Abstract
In recent years, heat storage technology has attracted wide attention in the fields of renewable energy storage for its relatively high melting point, high heat storage capacity and economy, Na2CO3 and eutectic salt mixtures containing Na2CO3 are promising candidates in the field of solar energy storage. In this paper, a molecular dynamics (MD) simulation of Na2CO3 was conducted with the Born–Mayer potential function. The simulated solid–liquid phase change temperature is 1200 K, and the error is 5.4%. The heat capacity at constant pressure (Cp) is higher in liquid than in solid, the average Cp of solid is 1.45 J/g and that of liquid is 1.79 J/g, and the minimum error is 2.8%. The simulation results revealed the change rules of density and thermal expansion coefficient of Na2CO3 in the process of heating up, and these changes were analyzed by radial distribution functions (RDF) and angular distribution functions (ADF). Moreover, the RDF and ADF results show that the atomic spacing of Na2CO3 increases, the coordination number decreases, and the angle distribution between atoms becomes wider as the temperature rises. Finally, this paper examined the microscopic changes of ions during the phase transition of Na2CO3 from solid to liquid. It is concluded that the angle change of in the liquid state is more sharply. This study improves the understanding of the thermodynamic properties and local structure of Na2CO3 and provides theoretical support for Na2CO3 heat storage materials.
1. Introduction
With the development of society and the progress of science and technology, the energy demand is increasing year by year, and the waste of energy is becoming more and more serious. The overexploitation of fossil energy (coal, oil, etc.) has not only led to the energy crisis but also caused serious pollution problems [1,2]. Solving the energy crisis has become a global consensus. Therefore, it is urgent to seek renewable energy [3,4,5]. Heat storage technology is an important part of renewable energy, and heat storage materials play a key role in heat storage technology [6]. Due to the intermittency and instability of solar and wind power generation, as well as the peak and trough of power consumption during the day and night, it is urgent to develop efficient energy storage technologies [7,8,9,10].
Phase change materials (PCMs) are the core of energy storage technology. For PCMs, the absorption and release of heat energy are carried out during the charging and discharging process, which is accompanied by melting [11]. In the aspect of solar energy utilization, PCMs can directly convert solar energy into sensible heat and phase change latent heat of materials. There is a wide range of applications for organic, inorganic salts and their hydrates in low temperature applications of solar energy such as building space insulation and cooling [12]. In the aspect of medium and high temperature applications of solar energy, except for parabolic trough systems with relatively low working temperatures (use nitrate, 673.15 K to 773.15 K, thermal decomposed above 773.15 K), there are two other major methods used to use solar energy, which both have higher maximum working temperatures. One method is a solar tower surrounded by thousands of small mirrors. The upper limit temperature of the solar tower is 773.15 K to 1223.15 K. The other method, a solar dish, is a large reflective parabolic dish which has a receiver set on its focal point. The upper limit temperature of the solar dish is 973.15 K to 1473.15 K. However, chloride salts, which corrode pipes, heat exchangers, tanks and other thermal components at high temperatures, are difficult to apply despite their high melting point [13]. Due to its relatively high melting point and high heat storage capacity and economy, Na2CO3 and eutectic salt mixtures containing Na2CO3 are promising candidates in the field of solar energy storage [14,15].
Good thermal characteristics such as wide working temperature range, large heat capacity and excellent thermal stability make the molten salt an ideal material for thermal energy storage [16,17,18,19]. Some salts used in the heat storage industry are displayed in Figure 1 according to their thermophysical properties. It shows that the phase change temperature of nitrate is low, and the low phase change temperature, which limits its application range; the latent heat of NaCl and MgCl2 is high, but chloride is very corrosive. When used for a long time, it will cause great pollution to the system and environment. Therefore, carbonate with low corrosivity has obvious advantages. Among various carbonates, Li2CO3 has high latent heat, but its cost is too high, and it is difficult to be widely used, and low-cost heat storage materials such as Na2CO3 have received extensive attention from researchers. Nobuyuki [20] and Feng [21] studied phase change materials (PCMs) with Na2CO3 as the heat storage medium. However, the macroscopic thermophysical properties of molten salt are determined by its microstructure. By studying the microstructure of molten salt, you can gain a deeper understanding of its thermophysical properties as well as explore its molecular motion state at high temperatures [22], which has important guiding significance for further studying the variation law between thermophysical properties and temperature of molten salt.
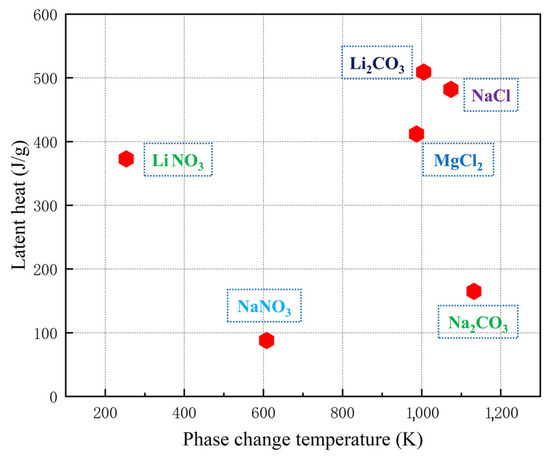
Figure 1.
Comparison of thermophysical properties of some salts [23,24,25,26].
The change law of local structure and thermodynamic properties of salts can be explored by the Molecular Dynamics (MD) simulation [27]. Wang [22] studied the transport characteristics of liquid chloride and explained the local structure and transport characteristics of chloride at high temperatures. Du [28] and Ding [29] simulated the thermophysical properties of Na2CO3 in a liquid environment by the MD method and described the changing trends of microstructure and thermophysical properties of carbonate in the liquid state. However, the local microstructure and thermophysical properties of Na2CO3 in solid and during the transformation from solid to liquid have not been studied, which will help us to deeply understand the thermophysical properties of Na2CO3.
In this study, we used MD simulation to study the thermophysical properties (phase change temperature, heat capacity at constant pressure (Cp), and density, etc.) of Na2CO3 in solid-state and the process of solid-state transformation into the liquid state and verified the reliability of the model by comparing with the experimental data and literature results. Through the simulation of local microstructure (radial distribution functions (RDF) and angular distribution functions (ADF)), the law of local structure transformation of Na2CO3 during heating and the relationship between local transformation and thermophysical properties were clarified.
2. MD Simulation Methods and Experimental Details
2.1. Interaction Potential and Parameter Setting
In the MD simulations of this study, the effective pair potential was a Born–Mayer type combined with a Coulomb term, which was proposed by M.P. Tosi [30,31] in 1964. The thermophysical properties of molten salts are often calculated using this effective potential [32,33]:
where, rij is the distance between the centers of two particles i and j; α (3.45 Å) and b (4.865 kcal/mol) are constants, representing the softness parameter and the pre-exponential term, respectively. Furthermore, zi is the valence of ion i, ni is the number of ion’s electrons in the outer shell, e is the electronic charge unit and σi is the ion’s effective radius. In this study, the parameters of the relevant potential model for Na2CO3 simulation are listed in Table 1, which were obtained by Janssen [34].

Table 1.
Parameters of Na2CO3 in MD simulation.
In this paper, the open-source program LAMMPS is used as the MD simulation tool, and the model Na2CO3 refers to the work of Arakcheeva [35]. The lattice structure constants of Na2CO3 are shown in Table 2, and a cubic box containing 1500 ions is used as the MD simulation system. O, C and Na are distributed in a ratio of 3:1:2 in the box.
Table 2.
The lattice constant of Na2CO3.
A Nose–Hoover thermostat was used to balance the simulation system under the NVT ensemble, followed by a range of temperatures from 300 K to 1600 K. The short-range interaction cutoff distance was set at 15 Å, which is half the simulation box length, to maintain a constant number of particles. The particle numbers were maintained by a periodic boundary condition. The method of eliminating truncation error in K-space was based on the Ewald summation, an accuracy of 1.0 × 10⁻⁴ was achieved in the calculation of force. Initial velocity follows a Gaussian distribution and is randomly distributed. The Verlet algorithm was used to solve the Newton equation of motion and the time step was set to 1 fs. To ensure a good statistical representation of the required characteristics, it has been run 5 million times in the NPT ensemble environment.
2.2. Evaluation of Properties
2.2.1. Phase Change Temperature and Heat Capacity at Constant Pressure
In this study, the self-diffusion coefficient (D) was used to verify the phase change temperature of Na2CO3 [36,37]. The D increases as temperature rises, which means that the fluidity of particles increases gradually [38,39]. Einstein’s law describes D as Equation (2), where M(t) is the mean square displacement (MSD) which was shown in Equation (3), where ri is the position of ion i at different temperatures. The sign of phase change is marked by a significant change of D, and with the change of temperature, the D curve appears a turning point [40,41].
Heat capacity at constant pressure (Cp) is determined by the change of enthalpy with temperature, and the Cp of Na2CO3 can be calculated as shown in Equation (4), where H is the enthalpy, T is the temperature.
2.2.2. Density and Thermal Expansion Coefficient
From initial NPT simulations, the densities ρ of Na2CO3 could be determined by the following Equation (5), where n is the particle number, N is the total number of atoms in the simulation box, NA denotes the Avogadro constant, M is the molar mass of the simulated molten salt, and VE is the equilibrated volume of the simulation cell at the given temperature in the NPT ensemble simulations. The thermal expansion coefficient depends on the volume changes with temperature, and Equation (6) is used to evaluate it, where T is the temperature, V is the volume of the simulation box, ρ is the density, the subscript P indicates the constant pressure and β is thermal expansion coefficient.
2.2.3. The RDF and ADF of Na2CO3
The RDF and the ADF [28], which are defined by Equation (7) and Equation (10), can be used to describe eutectic salt’s local microstructure.
The RDF expression is shown in Equation (7), where Nij(r) was the number of j-type ions inside a spherical cavity with a radius of r centered on i-type ion, and ρj was the ideal number density of j-type ion around i-type ion, and rmin was the position of the first peak valley of the RDF. It could be calculated from the RDF through the following formula as Equation (8),
Because RDF and coordination number can only describe the probability of atomic pairing, they do not contain the orientation information between atoms. To analyze the local structure further, the ADF of Na2CO3 can be characterized. The ADF expression is shown in Equations (9) and (10), where r is used to represent the atomic spacing, n(θ) is the number of the angle i-j-k in the range between θ and θ + Δθ, and N is the total number of the angle i-j-k in the sphere, and based on the corresponding RDF, rmin represents the position of the first peak valley.
2.3. Experimental details
The phase change temperature and Cp were measured by differential scanning calorimetry (DSC) and thermal gravity analyzer (STA449F5, NETZSCH, Selb, Germany). The weight of sample was 15 ± 2 mg. The phase change temperature was tested with an alumina crucible, and the Cp was tested with a platinum–rhodium crucible. The test environment is N2, and the temperature was heated from 500 K to 1100 K at the heating rate of 10 K/min.
3. Results and Discussion
3.1. Thermophysical Properties of Na2CO3
3.1.1. Phase Change Temperature and Specific Heat Capacity of Na2CO3
There is a corresponding relationship between the value of MSD and the atomic self-diffusion coefficient (D). The MSD has a linear relationship with time, and its slope has a relationship with D as Equation (2). The MSD curves of Na2CO3 at different temperatures are shown in Figure 2a, from which we can know that the slope of MSD increases gradually as the temperature rises, which shows that the movement of Na2CO3 atom increases gradually with the increase of temperature. Figure 2b shows that the self-diffusion coefficient (D) has a turning point at 1200 K obviously. Figure 3 shows the phase change temperature tested by Na2CO3, it shows that the phase change temperature is 1135 K, and the simulation error is 5.42% compared with the experimental test.
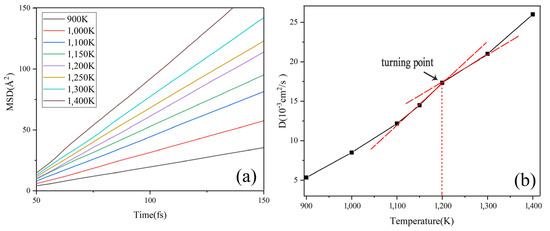
Figure 2.
Simulation results of Na2CO3: (a) MSD change with time; (b) D change with temperature.
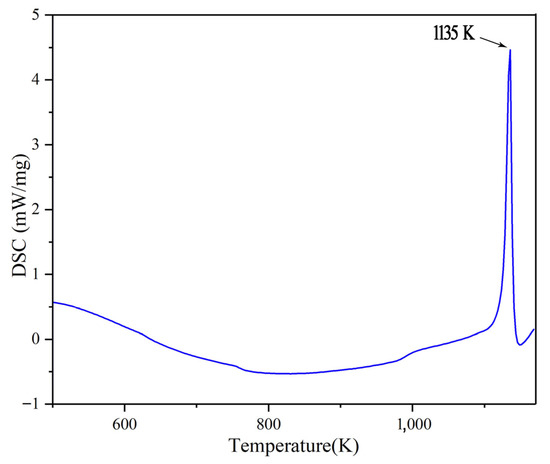
Figure 3.
Phase change temperature tested by Na2CO3.
By simulating the enthalpy and temperature, the Cp of Na2CO3 can be determined. Figure 4a shows the average Cp between 500–1100 K is 1.45 J/(g·K). As shown in Figure 4b, the Cp of Na2CO3 (500~1100 K) obtained by simulation calculation is basically consistent with the results of experimental tests and literature reports [42], the Cp of Na2CO3 has a peak value between 700~800 K, and this peak may be caused by crystal transformation. The Cp of liquid Na2CO3 is shown in Figure 5. It can be seen that the Cp is 1.79 J/(g·K). As shown in Table 3, the minimum error between the simulated and experimental values of Cp is 2.8%, and the maximum error is 16.26%, which has good fitting results. The simulation shows that the enthalpy of Na2CO3 increases as temperature rises, and the specific heat capacity (Cp) is higher in liquid than in solid.
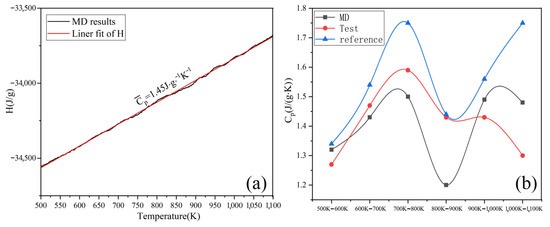
Figure 4.
Heat capacity at constant pressure (Cp) of solid Na2CO3: (a) simulation; (b) experimental (reference and MD).
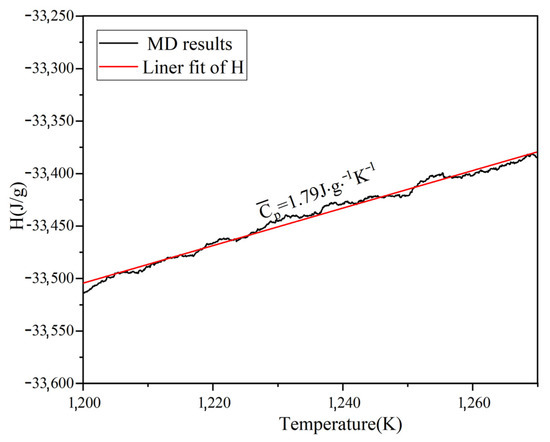
Figure 5.
Simulation results of heat capacity at constant pressure (Cp) of liquid Na2CO3.
Table 3.
The solid Cp of Na2CO3.
3.1.2. Density and Thermal Expansion Coefficient of Na2CO3
The density–temperature curve in the Na2CO3 simulation system is shown in Figure 6. It shows that the density is about 1.8 g/cm3 at 500 K. In the range of 500 K to 1100 K, the density decreases linearly with the temperature. Its density decreases rapidly and tends to be stable after 1400 K when the temperature is greater than 1200 K.
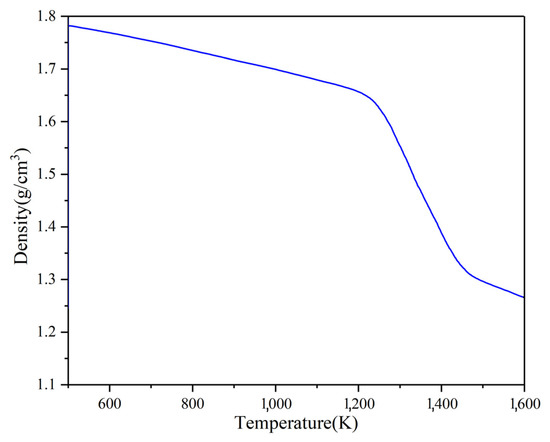
Figure 6.
The density of Na2CO3 at different temperatures.
Table 4 shows the simulated calculation values of the thermal expansion coefficient of Na2CO3 in different temperature ranges. The thermal expansion coefficient of Na2CO3 is 2 × 10⁻⁴ K−1 between 500~900 K. The thermal expansion coefficient of Na2CO3 is 3.5 × 10⁻⁴ K−1 between 1000~1200 K. When the temperature is higher than 1200 K, the change of thermal expansion coefficient intensifies, and the maximum thermal expansion coefficient appears between 1200~1400 K and is 22 × 10−4 K−1. The thermal expansion coefficient drops to 7 × 10⁻⁴ K−1 when the temperature is greater than 1400 K. It shows that the thermal expansion coefficient increases sharply, and the density decreases rapidly during phase transition.
Table 4.
Coefficient of thermal expansion of Na2CO3 at different temperatures.
3.2. Local Microstructure
3.2.1. The RDF of Na2CO3
The relationship between the microstructure and temperature of Na2CO3 is the key to the study, and RDF can be used to reveal the change law of Na2CO3 in the process of solid–liquid phase change. The variation laws of RDF function and coordination number of Na2CO3 at different temperatures are illustrated in Figure 7, and Table 5. As the temperature rises, the long-range peak (the peak after the fourth peak) of the RDF curve weakens and disappears, and the short-range peak (the first four peaks) of the RDF curve widens. The long-range ordered structure of Na2CO3 crystal will gradually collapse to disappear as the temperature rises. Whenever the temperature falls below 1200 K, there is a long-range peak in the RDF curve, and the solid Na2CO3 crystal presents a long-range ordered structure; when the temperature is 1200~1500 K, the long-range peak of the RDF curve disappears and only the short-range peak (the first four peaks), and the liquid Na2CO3 presents a long-range disordered and short-range ordered structure. During the solid-liquid transition of sodium carbonate, the RDF curve changes in growth range peak and short-range peak. When the solid-state changes to the liquid state, the long-range peak disappears, and the short-range peak widens. Moreover, the degree of short-range peak broadening increases, and the order of short-range structure becomes worse as the liquid temperature rises.
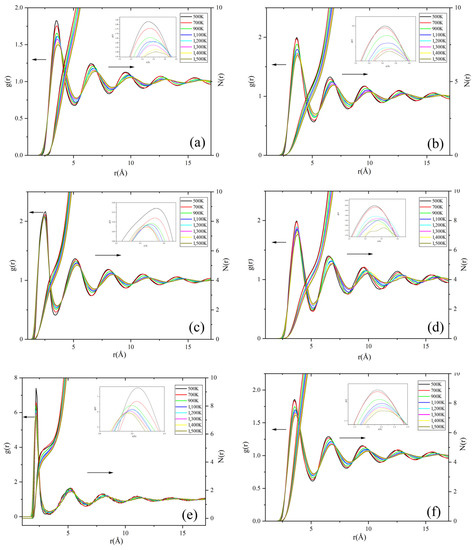
Figure 7.
The RDF and coordination number of Na2CO3: (a) Na-Na; (b) Na-C; (c) Na-O; (d) C-C; (e) C-O; (f) O-O.
Table 5.
Characteristic parameters for local structures of Na2CO3.
As shown in Figure 7 and Table 5, the rmax at the first peak of the RDF curve of Na2CO3 increases as the temperature rises, which shows the distances between Na-C, Na-Na, C-C, and O-O in the Na2CO3 system increase as the temperature increases, and in the process of solid–liquid transition, the coordination number curve shows an obvious right shift trend, and the coordination number of atoms decreases. This also explains that the molar volume of Na2CO3 increases as the temperature rises, resulting in the decrease of its density, the increase of thermal expansion coefficient and the change of other thermophysical properties. When the temperature is higher than 900 K, rmax hardly changes. As the temperature increases, the peak width becomes wider, which shows that the C-O stretching vibration and the out-of-plane bending vibration of C are increasing, and it means that the bond energy and the kinetic energy of also increase as the temperature rises.
3.2.2. The ADF of Na2CO3
To learn more about the microstructure of sodium carbonate, the ADF of Na2CO3 at different temperatures was calculated and characterized on the basis of RDF simulation analysis, and the interatomic angular distribution and temperature variation of sodium carbonate were studied.
The Na-C-Na angular distribution function of Na2CO3 at different temperatures is shown in Figure 8a. At 500 K and 700 K, there are four obvious peaks in the angular function of Na-C-Na at 50°, 90°, 140° and 170°. When the temperature rises to 900 K, the angular function becomes two peaks (about 50° and 100°) and the peak shape becomes wider, and especially the intensity of the second peak decreases. It shows that the angle between Na-C-Na has changed significantly in this process. According to the literature [43], the solid-state phase transition of Na2CO3 occurs at 723 K (phase β to phase α), which may cause the peak value of the angular distribution function to be changed.
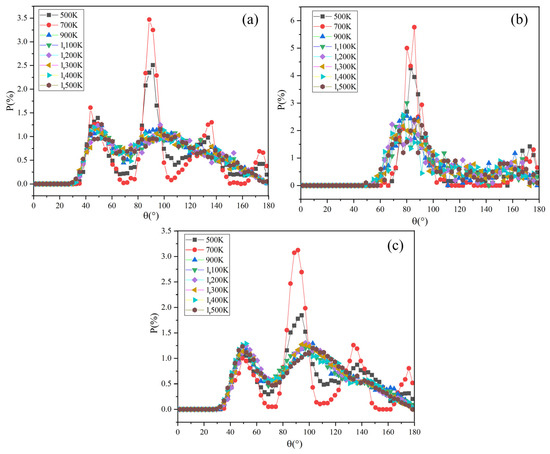
Figure 8.
The ADF of Na2CO3: (a) Na-C-Na; (b) O-C-O; (c) C-C-C.
When Na2CO3 is solid, the angle distribution range of Na-C-Na is 40–180°. It transforms from solid-state to liquid state as the temperature rises, the angle distribution range of Na-C-Na expands to 30–180°, and the peak shape becomes wider and weakens. After the solid–liquid transformation, the angle distribution range of Na-C-Na of sodium carbonate expands significantly, which is also consistent with the report in the literature [24].
Figure 8b shows the angular distribution function of O-C-O in Na2CO3 at different temperatures. The angular function has two peaks in the range of 60–100° and 150–180°. When the temperature increases from 500 K to 900 K, the peak shape and peak intensity become significantly wider and weaken, and the change of peak shape and peak intensity becomes weaker when the temperature is over 900 K. In the solid-state, the included angle distribution range of O-C-O is 70–100°, while when the system temperature rises and becomes liquid, the included angle distribution range of O-C-O extends to 50–100°. As shown in Figure 8a,c, the change of angle between Na-C-Na is basically consistent with C-C-C.
This phenomenon shows that the atomic motion in Na2CO3 becomes more and more intense as the temperature rises, the activity range expands, the periodicity of the arrangement becomes worse and leading to the widening of the angular distribution, which is consistent with the change of the angular distribution function of Na2CO3 at different temperatures. The angular distribution of Na2CO3 in the liquid state is wider than that in the solid state. With the increase of liquid temperature, the order of its short-range structure becomes worse. When it becomes the liquid phase, the atomic activity range is larger, the periodicity of the arrangement becomes worse, and the distribution of the included angle between atoms continues to expand, but the change of the angular distribution in the liquid phase gradually slows down with the increase of temperature.
4. Conclusions
In this paper, molecular dynamics (MD) software LAMMPS was used for modeling and simulation. Thermodynamic properties and local structure of alkali carbonate Na2CO3 have been simulated by means of MD method with an effective pair potential model. The main conclusions are as follows:
- (1)
- The self-diffusion coefficient (D) of Na2CO3 increases as the temperature rises, and the D changes significantly with temperature during solid-liquid transformation. The simulated solid-liquid phase change temperature is 1200 K, and the error is 5.4%.
- (2)
- The enthalpy of Na2CO3 increases as temperature rises, and the specific heat capacity (Cp) is higher in liquid than in solid. The Cp has a peak in the temperature range of 700~800 K. The average specific heat capacity of solid is 1.45 J/g and that of liquid is 1.79 J/g, the minimum error is 2.8%.
- (3)
- When the Na2CO3 transforms from solid to liquid, the thermal expansion coefficient changes suddenly and the density decreases rapidly. The calculated expansion coefficient shows that the expansion coefficient was the largest in the solid-liquid phase transformation (1200~1400 K), and the maximum expansion coefficient was 22·10−4 K−1.
- (4)
- The RDF and ADF results show that the atomic spacing of Na2CO3 increases, the coordination number decreases, and the angle distribution between atoms becomes wider as the temperature rises. When the solid state changes to the liquid state, the long-range peak disappears and the short-range peak widens in the RDF curve, the distribution of the included angle between atoms widens and the periodicity of the arrangement worsens. The degree of short-range peak broadening increases, and the order of short-range structure becomes worse, as the temperature of the liquid rises.
- (5)
- The microscopic changes of ions during the phase transition of Na2CO3 from solid to liquid shows that the angle change of in the liquid state is sharper.
Author Contributions
Conceptualization, H.L. and J.H.; methodology, H.L. and Y.L.; validation, H.L. and Y.L.; formal analysis, H.L. and H.Z.; investigation, H.L., J.Z.; resources, L.C. and G.Z.; data curation, H.L. and Y.L.; writing—original draft preparation, H.L.; writing—review and editing, H.L.; visualization, Y.L.; supervision, J.H; project administration, J.H. All authors have read and agreed to the published version of the manuscript.
Funding
This research received no external funding.
Data Availability Statement
Not applicable.
Conflicts of Interest
The authors declare no conflict of interest.
References
- Zhang, H.; Baeynes, J.; Caceres, G.; Degrève, J.; Lv, Y. Thermal energy storage: Recent developments and practical aspects. Prog. Energ. Combust. 2016, 53, 1–40. [Google Scholar] [CrossRef]
- Goods, S.H.; Bradshaw, R.W. Corrosion of stainless steels and carbon steel by molten mixtures of commercial nitrate salts. J. Mater. Eng. Perform. 2004, 13, 78–87. [Google Scholar] [CrossRef]
- Mozafari, M.; Lee, A.; Cheng, S. Simulation Study of Solidification in the Shell-And-Tube Energy Storage System with a Novel Dual-PCM Configuration. Energies 2022, 15, 832. [Google Scholar] [CrossRef]
- Mohammadpour, J.; Lee, A.; Timchenko, V.; Taylor, R. Nano-Enhanced Phase Change Materials for Thermal Energy Storage: A Bibliometric Analysis. Energies 2022, 15, 3426. [Google Scholar] [CrossRef]
- Ge, Z.; Ye, F.; Ding, Y. Composite Materials for Thermal Energy Storage: Enhancing Performance through Microstructures. Chemsuschem 2014, 7, 1318–1325. [Google Scholar] [CrossRef]
- Hasan, A. Phase change material energy storage system employing palmitic acid. Sol. Energy 1994, 52, 143–154. [Google Scholar] [CrossRef]
- Wei, G.S.; Xing, L.J.; Du, X.Z.; Yang, Y. Research status and selection of phase change thermal Energy storage materials for CSP systems. Proc. Csee. 2014, 34, 325–335. [Google Scholar] [CrossRef]
- Aneke, M.; Wang, M. Energy storage technologies and real life applications-a state of the art review. Appl. Energy 2016, 179, 350–377. [Google Scholar] [CrossRef]
- Lu, Y.; Peng, G.W.; Wang, Z.P.; Wang, K.Z.; Ma, R. A review on research for molten salt as a phase change material. Mater. Rev. 2011, 25, 38–42. [Google Scholar] [CrossRef]
- Peng, Q.; Ding, J.; Wei, X.L.; Yang, J.P.; Yang, X.X. Research progress in application of molten nitrate salt in energy utilization. Mod. Chem. Ind. 2009, 29, 17–24. Available online: http://refhub.elsevier.com/S0306-2619(18)30454-9/h0015 (accessed on 20 September 2022).
- Oró, E.; Gracia, A.; Castell, A.; Farid, M.M.; Cabeza, L.F. Review on phase change materials (PCMs) for cold thermal energy storage applications. Appl. Energy 2012, 99, 513–533. [Google Scholar] [CrossRef]
- Zhou, D.; Zhao, C.Y.; Tian, Y. Review on thermal energy storage with phase change materials (PCMs) in building applications. Appl. Energy 2012, 92, 593–605. [Google Scholar] [CrossRef]
- Vignarooban, K.; Xu, X.; Arvay, A.; Hsu, K.; Kannan, A.M. Heat transfer fluids for concentrating solar power systems—A review. Appl. Energy 2015, 146, 383–396. [Google Scholar] [CrossRef]
- Wang, T.; Mantha, D.; Reddy, R.G. Novel high thermal stability LiF–Na2CO3–K2CO3 eutectic ternary system for thermal energy storage applications. Sol. Energ. Mater. Sol. Cells 2015, 140, 366–375. [Google Scholar] [CrossRef]
- Forsberg, C.W.; Peterson, P.F.; Zhao, H. High-Temperature Liquid-Fluoride-Salt Closed-Brayton-Cycle Solar Power Towers. J. Sol. Energy Eng. 2007, 129, 141–146. [Google Scholar] [CrossRef]
- Cunha, J.P.; Eames, P. Thermal energy storage for low and medium temperature applications using phase change materials—A review. Appl. Energy 2016, 177, 227–238. [Google Scholar] [CrossRef]
- Ismail, K.A.R.; Lino, F.A.M.; Machado, P.L.O.; Teggar, M.; Arıcı, M.; Alves, T.A.; Teles, M.P.R. New potential applications of phase change materials: A review. J. Energy Storage. 2022, 53, 105202. [Google Scholar] [CrossRef]
- Wu, Y.T.; Ren, N.; Ma, C.F. Research and application of molten salts for sensible heat storage. Energy Storage Sci. Technol. 2013, 2, 586–592. Available online: http://refhub.elsevier.com/S0306-2619(18)30454-9/h0040 (accessed on 20 September 2022).
- Shen, X.Y.; Ding, J.; Peng, Q.; Yang, J. Application of high temperature molten salt to solar thermal power. Guangdong Chem. Ind. 2007, 34, 49. Available online: http://refhub.elsevier.com/S0306-2619(18)30454-9/h0035 (accessed on 20 September 2022).
- Gokon, N.S.; Nakamura, S.; Hatamachi, T.; Kodama, T. Steam reforming of methane using double-walled reformer tubes containing high-temperature thermal storage Na2CO3/MgO composites for solar fuel production. Energy 2014, 68, 773–782. [Google Scholar] [CrossRef]
- Ye, F.; Ge, Z.; Ding, Y.; Yang, J. Multi-walled carbon nanotubes added to Na2CO3/MgO composites for thermal energy storage. Particuology 2014, 15, 56–60. [Google Scholar] [CrossRef]
- Wang, J.; Wu, J.; Lu, G.; Yu, J. Molecular dynamics study of the transport properties and local structures of molten alkali metal chlorides. Part III. Four binary systems LiCl-RbCl, LiCl-CsCl, NaCl-RbCl and NaCl-CsCl. J. Mol. Liq. 2017, 238, 236–247. [Google Scholar] [CrossRef]
- Suleiman, B.; Yu, Q.; Ding, Y.; Li, Y. Fabrication of form stable NaCl-Al2O3 composite for thermal energy storage by cold sintering process. Front. Chem. Sci. Eng. 2019, 13, 1–9. [Google Scholar] [CrossRef]
- Papapetrou, M.; Kosmadakis, G.; Cipollina, A.; La Commare, U.; Micale, G. Industrial waste heat: Estimation of the technically available resource in the EU per industrial sector, temperature level and country. Appl. Therm. Eng. 2018, 138, 207–216. [Google Scholar] [CrossRef]
- Kenisarin, M.M. High-temperature phase change materials for thermal energy storage. Renew. Sustain. Energy Rev. 2010, 14, 955–970. [Google Scholar] [CrossRef]
- Kourkova, L.; Sadovska, G. Heat capacity enthalpy and entropy of Li2CO3 at 303.5–563.15 K. Thermochim. Acta 2007, 452, 80. [Google Scholar] [CrossRef]
- Lantelme, F.; Turq, P.; Quentrec, B.; Lewis, J.W. Application of the molecular dynamics method to a liquid system with long range forces (Molten NaCl). Mol. Phys. 1974, 28, 1537–1549. [Google Scholar] [CrossRef]
- Du, L.; Xie, W.; Ding, J.; Lu, J.; Wei, X.; Wang, W. Molecular dynamics simulations of the thermodynamic properties and local structures on molten alkali carbonate Na2CO3. Int. J. Heat Mass Transfer. 2019, 131, 41–51. [Google Scholar] [CrossRef]
- Ding, J.; Du, L.; Pan, G.; Lu, J.; Wei, X.; Li, J.; Wang, W.; Yan, J. Molecular dynamics simulations of the local structures and thermodynamic properties on molten alkali carbonate K2CO3. Appl. Energy 2018, 220, 536–544. [Google Scholar] [CrossRef]
- Fumi, F.G.; Tosi, M.P. Ionic sizes and born repulsive parameters in the NaCl-type alkali halides—I: The Huggins-Mayer and Pauling forms. J. Phys. Chem. Solids 1964, 25, 31–43. [Google Scholar] [CrossRef]
- Tosi, M.P.; Fumi, F.G. Ionic sizes and born repulsive parameters in the NaCl-type alkali halides—II: The generalized Huggins-Mayer form. J. Phys. Chem. Solids 1964, 25, 45–52. [Google Scholar] [CrossRef]
- Ding, J.; Pan, G.; Du, L.C.; Lu, J.; Wang, W.; Wei, X.; Li, J. Molecular dynamics simulations of the local structures and transport properties of Na2CO3 and K2CO3. Appl. Energy 2018, 227, 555–563. [Google Scholar] [CrossRef]
- Du, L.; Ding, J.; Wang, W.; Pan, G.; Lu, J.; Wei, X. Molecular dynamics simulations on the binary eutectic system Na2CO3-K2CO3. Energy Procedia 2017, 142, 3553–3559. [Google Scholar] [CrossRef]
- Janssen, G.J.M.; Tissen, J. Pair potentials from ab initio calculations for use in MD simulations of molten alkali carbonates. Mol. Simulat. 1990, 5, 83–98. [Google Scholar] [CrossRef]
- Arakcheeva, A.; Bindi, L.; Pattison, P.; Meisser, N.; Chapuis, G.; Pekov, I. The incommensurately modulated structures of natural natrite at 120 and 293 K from synchrotron X-ray data. Am. Miner. 2010, 95, 574–581. [Google Scholar] [CrossRef]
- Rao, R.P.; Seshasayee, M. Molecular dynamics simulation of ternary glasses Li2O–P2O5–LiCl. Solid State Commun. 2004, 131, 537–542. [Google Scholar] [CrossRef]
- Que, Y.; Chao, L.; Chen, Q.Y. Molecular Dynamics Simulation of Phase Change in Heptadecane-Pentadecane Binary System. Mater. Rep. 2010, 24, 77–80. [Google Scholar]
- Naghizadeh, J.; Rice, S.A. Kinetic theory of dense fluids. X. Measurement and interpretation of self-diffusion in liquid Ar, Kr, Xe, and CH4. J. Chem. Phys. 1962, 36, 2710–2720. [Google Scholar] [CrossRef]
- Jolly, D.L.; Bearman, R.J. Molecular dynamics simulation of the mutual and self-diffusion coefficients in Lennard-Jones liquid mixtures. Mol. Phys. 1981, 41, 137–147. [Google Scholar] [CrossRef]
- Lu, Y.K.; Zhang, G.Q.; Hao, J.J. Molecular dynamics simulation of thermodynamic properties and local structure of Na2CO3-K2CO3 eutectic salt during phase transition. J. Chem. Phys. 2021, 43, 103221. [Google Scholar] [CrossRef]
- Feng, T.X.; Yang, B.; Lu, G.M. Deep learning-driven molecular dynamics simulations of molten carbonates: 1. Local structure and transport properties of molten Li2CO3-Na2CO3 system. Ionics 2022, 28, 1231–1248. [Google Scholar] [CrossRef]
- Karad, S.K.; Jones, F.R.; Attwood, D. Moisture absorption by cyanate ester modified epoxy resin matrices. Part I. Effect of spiking parameters. Polymer 2002, 43, 5209–5218. [Google Scholar] [CrossRef]
- Ye, D.L. Handbook of Inorganic Thermodynamic Data, 1st ed.; Metallurgical Industry Press: Beijing, China, 2002; pp. 659–660. [Google Scholar]


Publisher’s Note: MDPI stays neutral with regard to jurisdictional claims in published maps and institutional affiliations. |
© 2022 by the authors. Licensee MDPI, Basel, Switzerland. This article is an open access article distributed under the terms and conditions of the Creative Commons Attribution (CC BY) license (https://creativecommons.org/licenses/by/4.0/).