Article

Study on CO2–Water Co-Injection Miscible Characteristics in Low-Permeability Near-Critical Volatile Oil Reservoir

1
College of Energy, Chengdu University of Technology, Chengdu 610059, China
2
State Key Laboratory of Oil and Gas Reservoir Geology and Exploitation, Chengdu University of Technology, Chengdu 610059, China
3
School of Geoscience and Technology, Southwest Petroleum University, Chengdu 610500, China
4
Engineering and Technology Research Institute, Sinopec Northwest Oilfield Company, Urumqi 830011, China
5
State Key Laboratory of Oil and Gas Reservoir Geology and Exploitation, Southwest Petroleum University, Chengdu 610500, China
*
Author to whom correspondence should be addressed.
Energies 2022, 15(19), 7131; https://doi.org/10.3390/en15197131
Submission received: 19 August 2022 / Revised: 10 September 2022 / Accepted: 13 September 2022 / Published: 28 September 2022
(This article belongs to the Section H: Geo-Energy)

Abstract

:
Low-permeability near-critical volatile reservoirs are characterized by light oil, complex fluid phase, and strong reservoir inhomogeneity, etc. Purely injecting CO2 will create a series of problems, such as serious gas channeling, low sweep efficiency, and low oil recovery. Therefore, in this paper, through a combination of experiments and simulations and in the process of studying the problem from simple to complex, we carried out phase equilibrium experiments for CO2-near-critical volatile oil and CO2-near-critical volatile oil-formation water, as well as experiments for minimum miscible pressure of slim-tube with pure CO2 and CO2–water co-injection to the comparative study of the miscible characteristics and displacement oil efficiency between pure CO2 injection and CO2–water co-injection. It provides an important reference for improving oil recovery by CO2–water co-injection in low-permeability near-critical volatile reservoir. The results of CO2-near-critical volatile oil/CO2-near-critical volatile oil-formation water phase equilibrium experiments show that the saturation pressure, density, and gas–oil ratio of the system increase, and the viscosity decreases with the increase in CO2 injection. In the three-phase system of CO2-near-critical volatile oil-formation water, the CO2 content in the flash gas of crude oil, gas–oil ratio, and gas–water ratio are negatively correlated with the water saturation. The results of slim-tube experiments and simulations on the miscible characteristics and displacement oil efficiency of pure CO2 injection and CO2–water co-injection show that the recovery degree of crude oil under CO2–water co-injection is higher than that of pure CO2 injection, and the CO2 dissolved transition section in oil and gas is shorter and the gas breakthrough time is later under CO2–water co-injection, which effectively increases the sweep efficiency and improves the degree recovery of crude oil. When CO2–water co-injection, the ratio of water is higher, the later the gas–oil ratio rises, the later the CO2 breakthrough, and the higher the degree of crude oil recovery. It indicates that when CO2–water co-injection, the ratio of water is higher, the more CO2 is dissolved in water, which effectively inhibits the occurrence of gas channeling and increases the sweep area, thus improving the degree recovery of crude oil. The research results of this paper provide an experimental basis and theoretical foundation for CO2–water co-injection for enhanced crude oil recovery in low-permeability near-critical volatile reservoirs.

1. Introduction

In recent years, with the continuous development of exploration and development technology, low-permeability reservoirs have been discovered in Xinjiang, Shaanxi, Heilongjiang, Shandong, and Sichuan basins in China [1,2]. There exists a special class of low-permeability reservoirs, namely low-permeability near-critical volatile reservoir [3,4], which is characterized by high gas–oil comparison and high crude oil shrinkage compared to other low-permeability reservoirs. At the same time, the existence of start-up pressure and capillary force in low-permeability reservoirs makes the injection pressure too high to achieve enhanced recovery [5], and the gas injection development will also face the occurrence of gas scram and gravity segregation, which leads to low crude oil recovery [6,7]. Alternating gas–water injections suffer from difficulties in gas–water switching and the lack of control ability of injected gas flow [8], while gas–water co-injection can effectively overcome the shortcomings of alternating gas–water injections and make full use of the gravity difference, advance water–gas segregation, which can obtain the longitudinal sweep coefficient that cannot be achieved by single-phase displacement, and also alleviate the occurrence of gas channeling, thus effectively improving the crude oil recovery [9]. Therefore, the research related to gas–water co-injection is important for the efficient development of heterogeneous dense- and low-permeability near-critical volatile reservoir.
In recent years, scholars at home and abroad have conducted a lot of research on water or gas injection in low-permeability black-oil reservoirs to improve the recovery rate. From 2015 to 2022, Xuefeng Qu [10], Junru Wang [11], Jianming Fan [12], S. M. Ghaderi [13], Meng Chen [14], Xiangzeng Wang [15], Zhilin Cheng [16], Jing Wang [17], Zhengming Yang [18], Jiandong Zou [19], Yongzan Liu [20], and Yisheng Liang [21] conducted theoretical and experimental studies on water imbibition injection using cores from low-permeability reservoirs. The experimental studies showed that the water imbibition recovery rate was 30% to 35%, the inverse of bond number at the optimal percolation recovery rate was about 1, and the lower the imbibition displacement rate, the lower the recovery rate of crude oil in large pore throats, while the oil–water saturation in small pore throats was basically the same. It is clear that the influencing factors of waterflood stimulation are huff-and-puff cycle, injection volume, soaking time, injection rate, and fluid recovery rate in order. From 2015 to 2022, Chen Ting [22], Dai Yixin [23], Wei Bing [24], Bo Ren [25], Daoyong Yang [26], Wei Yu [27], Yuan Zhang [28], Zhaojie Song [29], and Haiyang Yu [30] conducted theoretical and experimental research on gas–flooding–oil in low-permeability oil reservoirs. The research results show that the gas-injection capacity of tight oil reservoirs is significantly better than the water-injection capacity, and the lower the permeability, the more obvious the advantage of gas-injection capacity. The gas–water co-injection process has been implemented in Siri and Viking fields and achieved significant improvement in crude oil recovery. From 2001 to 2019, Eileen A [31], NKP Pisharody [32], and E Ajoma [33] found that there is an optimal range for both permeability and injection ratio, and the oil displacement effect is significantly improved in the optimal range. For low-permeability reservoirs, CO2 flooding is overall better than natural gas and N2. The higher the permeability, the better the flooding, with large and medium pores in the core contributing most of the recovered crude oil. The diffusion coefficient increases with the initial gas injection pressure and eventually levels off, but the maximum diffusion system appears near the critical pressure point, and the diffusion coefficient increases with the increase in permeability and porosity of the matrix and decreases rapidly with the increase in tortuosity of the core.
In summary, scholars in China and abroad have studied CO2–water co-injection in low-permeability near-critical volatile reservoirs relatively little. Therefore, in this paper, by combining physical and numerical simulations, the tow-phase equilibrium experiment for CO2-near-critical volatile oil, the three-phase equilibrium experiment for CO2-near-critical volatile oil-formation water, and experiment for minimum miscible phase pressure of slim-tube with pure CO2 and CO2–water injection is carried out in order, using the low-permeability near-critical volatile oil reservoir as the target block. Based on the experiments, the slim-tube numerical simulation for pure CO2 injection and CO2–water co-injection is conducted to reveal the miscible characteristics of CO2 and crude oil and the oil displacement effect during pure CO2 injection and CO2–water co-injection. The results of this paper provide a theoretical basis and technical support for CO2–water co-injection in low-permeability near-critical volatile reservoirs to enhance the recovery of crude oil.

2. Experimental Section

2.1. Experimental Sample

The samples for this experiment were taken from well X in the S low-permeability oil field in northwest China, whose reservoir has an average burial depth of 3120–3360 m and an average permeability of 1.54 × 10⁻³ μm2, and the formation temperature is 157.5 °C and the formation pressure is 40.6 MPa. Reservoir fluid samples were obtained using surface separator and separator oil compounding and analyzing reservoir fluid samples. The compounding process was carried out in strict accordance with the national standard “GB/T 26981-2020 Method for Fluid Property Analysis in Oil and Gas Reservoirs” [34]. The well stream composition for X well is shown in Table 1, which can show that the molar percentage contents of well stream for X well contains 63.61 mol% of C1, 19.61 mol% of C2 to C6, and 11.35 mol% of C7+. The gas–oil ratio of the compounded formation fluid is 712 m3/m3, and the field stable production gas–oil ratio is 715 m3/m3. Additionally, the content of intermediate hydrocarbon in the oil field is 19.72%, which is closely matched with the actual crude oil data, indicating that the compounded formation fluid can accurately characterize the real reservoir fluid, and this fluid belongs to the composition range of a typical near-critical rich in intermediate hydrocarbons oil–gas system, which can better reflect the special phase study of the fluid in the near-critical zone.

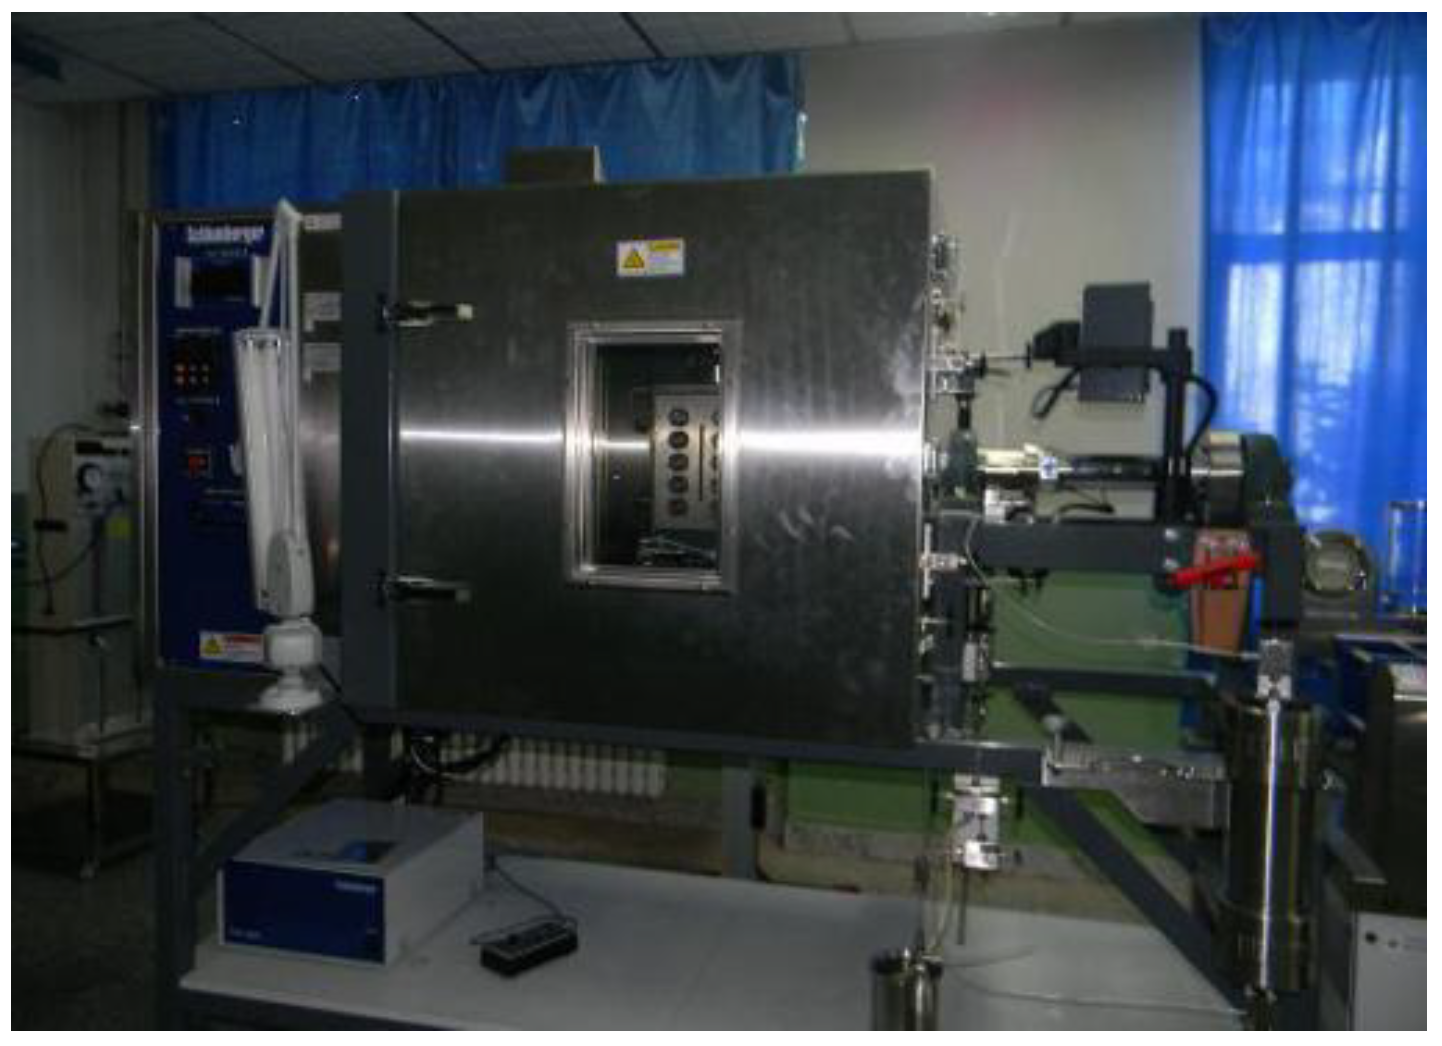
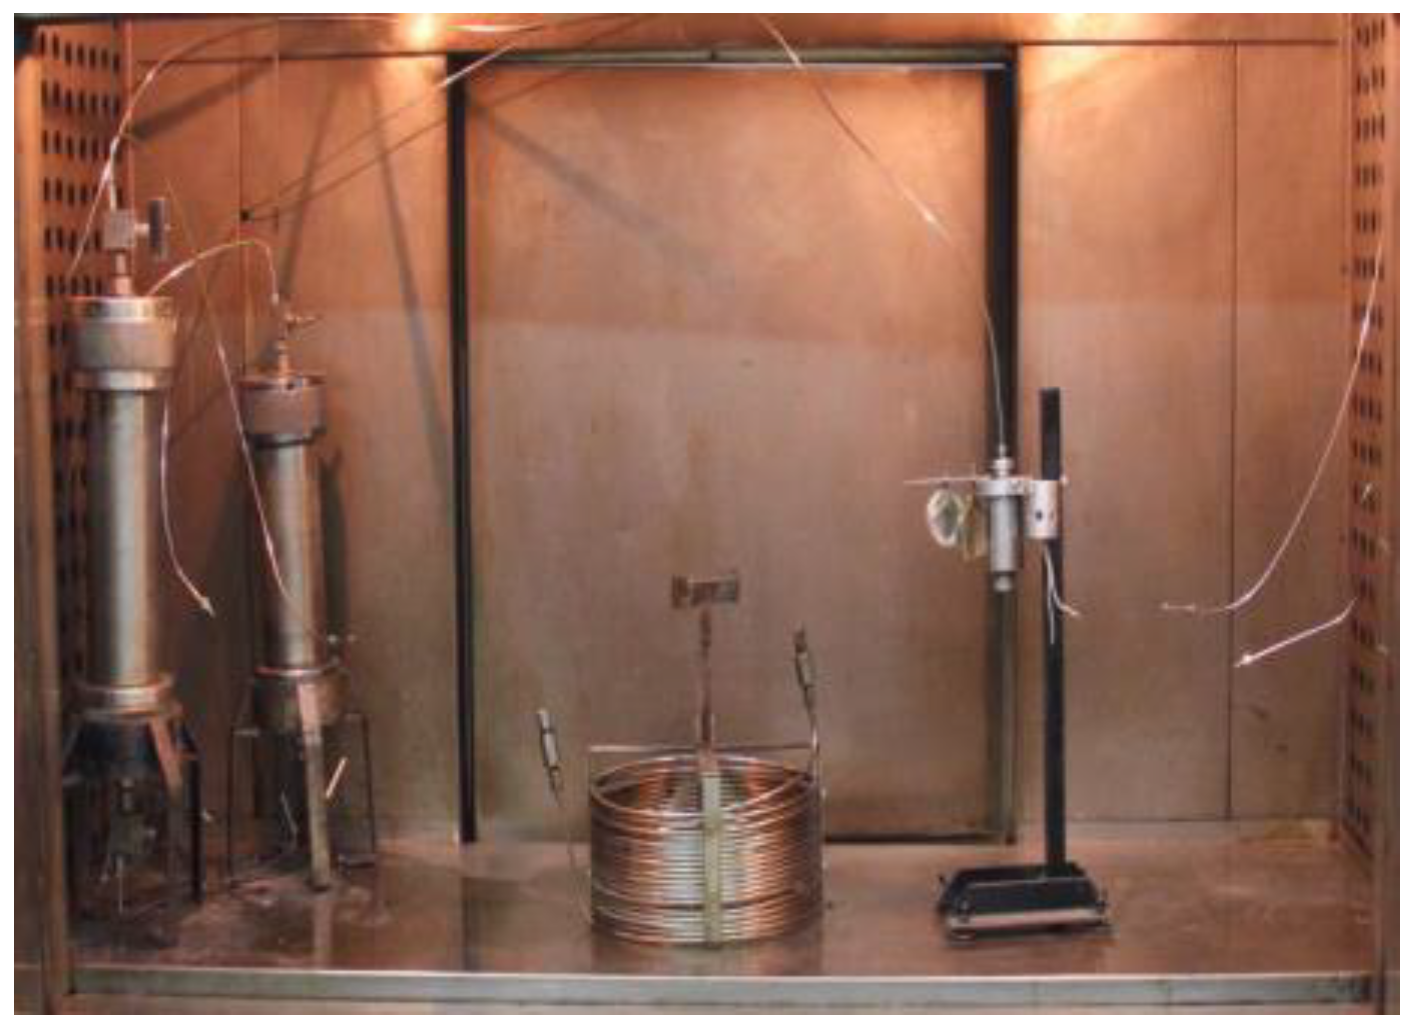
2.2. Experimental Device

The experimental devices for phase equilibrium experiments with CO2-near-critical volatile oil and CO2-near-critical volatile oil-formation water, slim-tube experiment of miscible phase characteristics, and oil displacement efficiency for CO2 injection and CO2–water co-injection are shown in Figure 1 and Figure 2. The two-phase equilibrium experiment of CO2-near-critical volatile oil and the three-phase equilibrium experiment of CO2-near-critical volatile oil-formation water were experimented on using a high-temperature and high-pressure visualization mercury-free PVT device (Figure 1), which can be used to observe the phase changes in fluids in the PVT experiment cell by computer acquisition of images recorded by the camera. The experimental temperature range of PVT device is 0~200 °C, and the pressure range is 0.1~70 MPa. The device for the slim-tube experiment on the miscible characteristics and oil displacement efficiency for CO2 injection and CO2–water co-injection contains high-pressure displacement pump, slim-tube, back-pressure valve, observation window, gasometer, electronic balance, oil chromatograph, and gas chromatograph. The parameters of the slim-tube are shown in Table 2.

2.3. Experimental Procedure

2.3.1. Phase Behavior Characteristic Experiment

The detailed steps of the experiments for single-phase near-critical volatile oil, two-phase equilibrium experiment of CO2-near-critical volatile oil, and three-phase equilibrium experiment of CO2-near-critical volatile oil-formation water were referred to the national standard “GB/T 26981 2020 Method for Fluid Property Analysis in Oil and Gas Reservoirs” [34]. The experimental procedure is shown in Figure 3.
(1)
The steps of phase equilibrium experiments for single-phase near-critical volatile oil consisted of:
① Two-flash experiment: the experimental sample was put into the PVT cell and adjusted to the laboratory temperature and pressure; then, the gas–liquid separation was performed, the amount of bled oil volumes was recorded with an electronic balance and density meter, and the separated gas–liquid was chromatographed (HP-6890 gas chromatograph and Agilent-7890A oil chromatography) to determine the composition of the reservoir fluid system, and the experiment aimed to find the well stream component and gas–oil ratio.
② Constant composition expansion experiment: The remaining fluid sample in the PVT vessel was gradually depressurized at formation temperature and pressure, and the pressure and volume changes were recorded. The purpose of the experiment was to provide information on determining the dew point, the gas deviation factor, and the relative volume of the fluid at different pressures.
(2)
The steps of two-phase equilibrium experiment for CO2-near-critical volatile oil consisted of the following:
① The ambient temperature of the dispenser was raised to the formation temperature, and the original formation fluid was pressurized to the formation pressure so that the fluid sample in the dispenser became single-phase and was transferred to the PVT test cell, where seven temperature points between 35 °C and 157.5 °C and pressures between 10 MPa and 40 MPa were selected for two-flash experiment and constant composition expansion experiments were used to obtain the fluid sample saturation pressure, and fluid sample volume change with the parameters, such as the volume change in the fluid sample with pressure variation, were obtained.
② Under the original formation pressure conditions (40.6 MPa), CO2, which accounted for 10 mol% of the formation fluid, was injected into the formation fluid and pressurized until CO2 was completely dissolved in the formation fluid and became a single phase.
③ The volume change relationship with pressure, saturation pressure, crude oil viscosity, density, and P-T phase diagram for fluid samples injected with 10 mol% CO2 was tested.
④ Injecting other molar percentages (molar percentages = 20%, 30%, 40%, 50%, 60%) of CO2 into the gas injection expansion experiment repeated the experimental steps ②~③ until the total amount of CO2 injected reached the design requirement ratio; then the experiment ended.
(3)
The steps of three-phase equilibrium experiment for CO2-near-critical volatile oil-formation water consisted of the following:
① The experimental temperature was raised to the formation temperature. A certain volume of near-critical volatile oil was saturated into the PVT test cell, and a certain volume of formation water was saturated to make the oil–water ratio 4:1. Then, a certain ratio (10 mol%) of CO2 was injected into the two phases of near-critical volatile oil and formation water at the bottom of the PVT test cell. The fluid was pressurized so that the injected CO2 was completely dissolved in the near-critical volatile oil and formation water to turn it into the two phases of near-critical volatile oil–water.
② After the pressure was stabilized, the pressure, near-critical volatile oil volume, formation water volume, and total near-critical volatile oil-formation water volume were recorded.
③ Under the conditions of formation temperature, flash experiment and constant composition expansion experiment were conducted for the three-phase system of CO2-near-critical volatile oil–formation water with a certain amount (10 mol%) of injection.
④ Steps ① to ③ were repeated for other molar percentages (molar percentages = 20%, 30%, 40%, 50%, 60%) of CO2 injected.
⑤ Saturated with other oil–water ratios (oil–water ratio 3:2, namely, 40% water), the experiments were repeated from ① to ④ with different molar percentages of CO2 injected in the oil–water ratio of 2:3, namely, 60% of water.

2.3.2. Miscible Characteristics Experiment

The detailed steps of slim-tube experiment for CO2 injection and CO2–water co-injection on the near-critical volatile oil were referred to the petroleum industry standard “SY/T 6573 2016 Minimum miscible-phase pressure experimental determination method—slim-tube method” [35]. The experimental flow is shown in Figure 4.
(1)
Slim-tube experiment for CO2 injection on near-critical volatile oil consisted of the following:
① The slim-tube was placed in the dryer and dried, and the permeability and porosity of the slim-tube were measured by N2 to calculate the volume of the slim-tube pores.
② The formation fluid to a slim-tube at formation temperature and experimental pressure conditions (5 to 6 experimental pressures) was saturated.
③ CO2 was injected at a constant pressure until the injection volume reached 1.2 PV, the volume of oil and gas was recorded at the extraction end every 20 min, and the composition components of the extracted gas by chromatograph were analyzed.
④ Every time a group of repulsion pressure experiments were completed, the slim-tube was cleaned with petroleum ether, and the cleaning standard was that the color and components at the outlet end were the same as those at the inlet end.
⑤ The experiments were repeated for other injection pressure conditions ② to ④.
(2)
Slim-tube experiment for CO2–water co-injection on near-critical volatile oil. The experimental procedure of near-critical volatile oil CO2–water co-injection refers to the experimental procedure of near-critical volatile oil CO2 injection slim-tube, except that the CO2 injected in ③ became CO2–water co-injection.

3. Simulation

To verify the reliability of the experiment, the complex phase behavior characteristics of CO2-near-critical volatile oil and the simulation studies of near-critical volatile oil injected CO2 and CO2–water co-injected slim-tube were carried out by using the WinProp module and GEM component modeler in CMG numerical simulation software.

3.1. Simulation Study on Phase Behavior Characteristics of CO2 Injection

To verify the laboratory results, we utilized the high precision PR equation of state (PR78-EOS) in WinProp module of the Computer Modeling Group (CMG) simulator [36]. Combined with the fluid thermodynamic equilibrium theory, it can accurately describe and predict phase behavior of volatile reservoir fluid and phase transition near the critical point. Thermodynamic parameters of the PR78-EOS are adjusted to match the experimental measured PVT data. The detailed PR78-EOS is shown in Equations (1)–(4). The original well stream composition was split and grouped into eight pseudo-components, which are given in Table 3. Critical temperatures, critical pressures, and acentric factors of the plus components and binary interaction parameters (Kij) were adjusted to match the experimental data, such as the saturation pressure (the bubble point pressure), gas–oil ratio, relative volumes, and so on. It is worth mentioning that interaction coefficients (Kij) are introduced to account for the molecular interaction between dissimilar molecules. The values of the interaction coefficients are obtained by fitting the predicted saturation pressures to experimental data through the PR78-EOS. Table 4 and Table 5 present the adjusted critical temperatures, critical pressures, and acentric factors of the plus components and obtained binary interaction parameters. The absolute relative error (5) and the average absolute relative error (6) are used to express the deviation between the calculated values by using the PREOS in this paper and the experimental measured values. The objective is to make the deviation between the calculated value and experimental value minimum.
P = RT V - b a V ( V + b ) + b ( V b )
For a pure fluid, constant 𝑏 is given by
b i = 0.007780 ( R T c i P c i )
while (𝑇), a function of temperature, is given by
a i ( T ) = a i ( T c i ) × α i ( T r i , ω i ) a i ( T c i ) = 0.45724 R 2 T c i 2 P c i α i ( T r i , ω i ) = 1 + m ( 1 T r i 1 / 2 ) m = 0.37464 + 1.54226 ω i 0.26992 ω i 2
A simple classical Van der Waals mixing rule with one binary interaction parameter 𝑘𝑖𝑗 is used to calculate mixture systems:
a m ( T ) = i = 1 n j = 1 n x i x j ( a i a j α i α j ) 0.5 ( 1 k i j ) b m = i = 1 n x i b i
A R E % = i = 1 N | C a l E x p E x p | i × 100
A A R E % = 1 N i = 1 N | C a l E x p E x p | i × 100

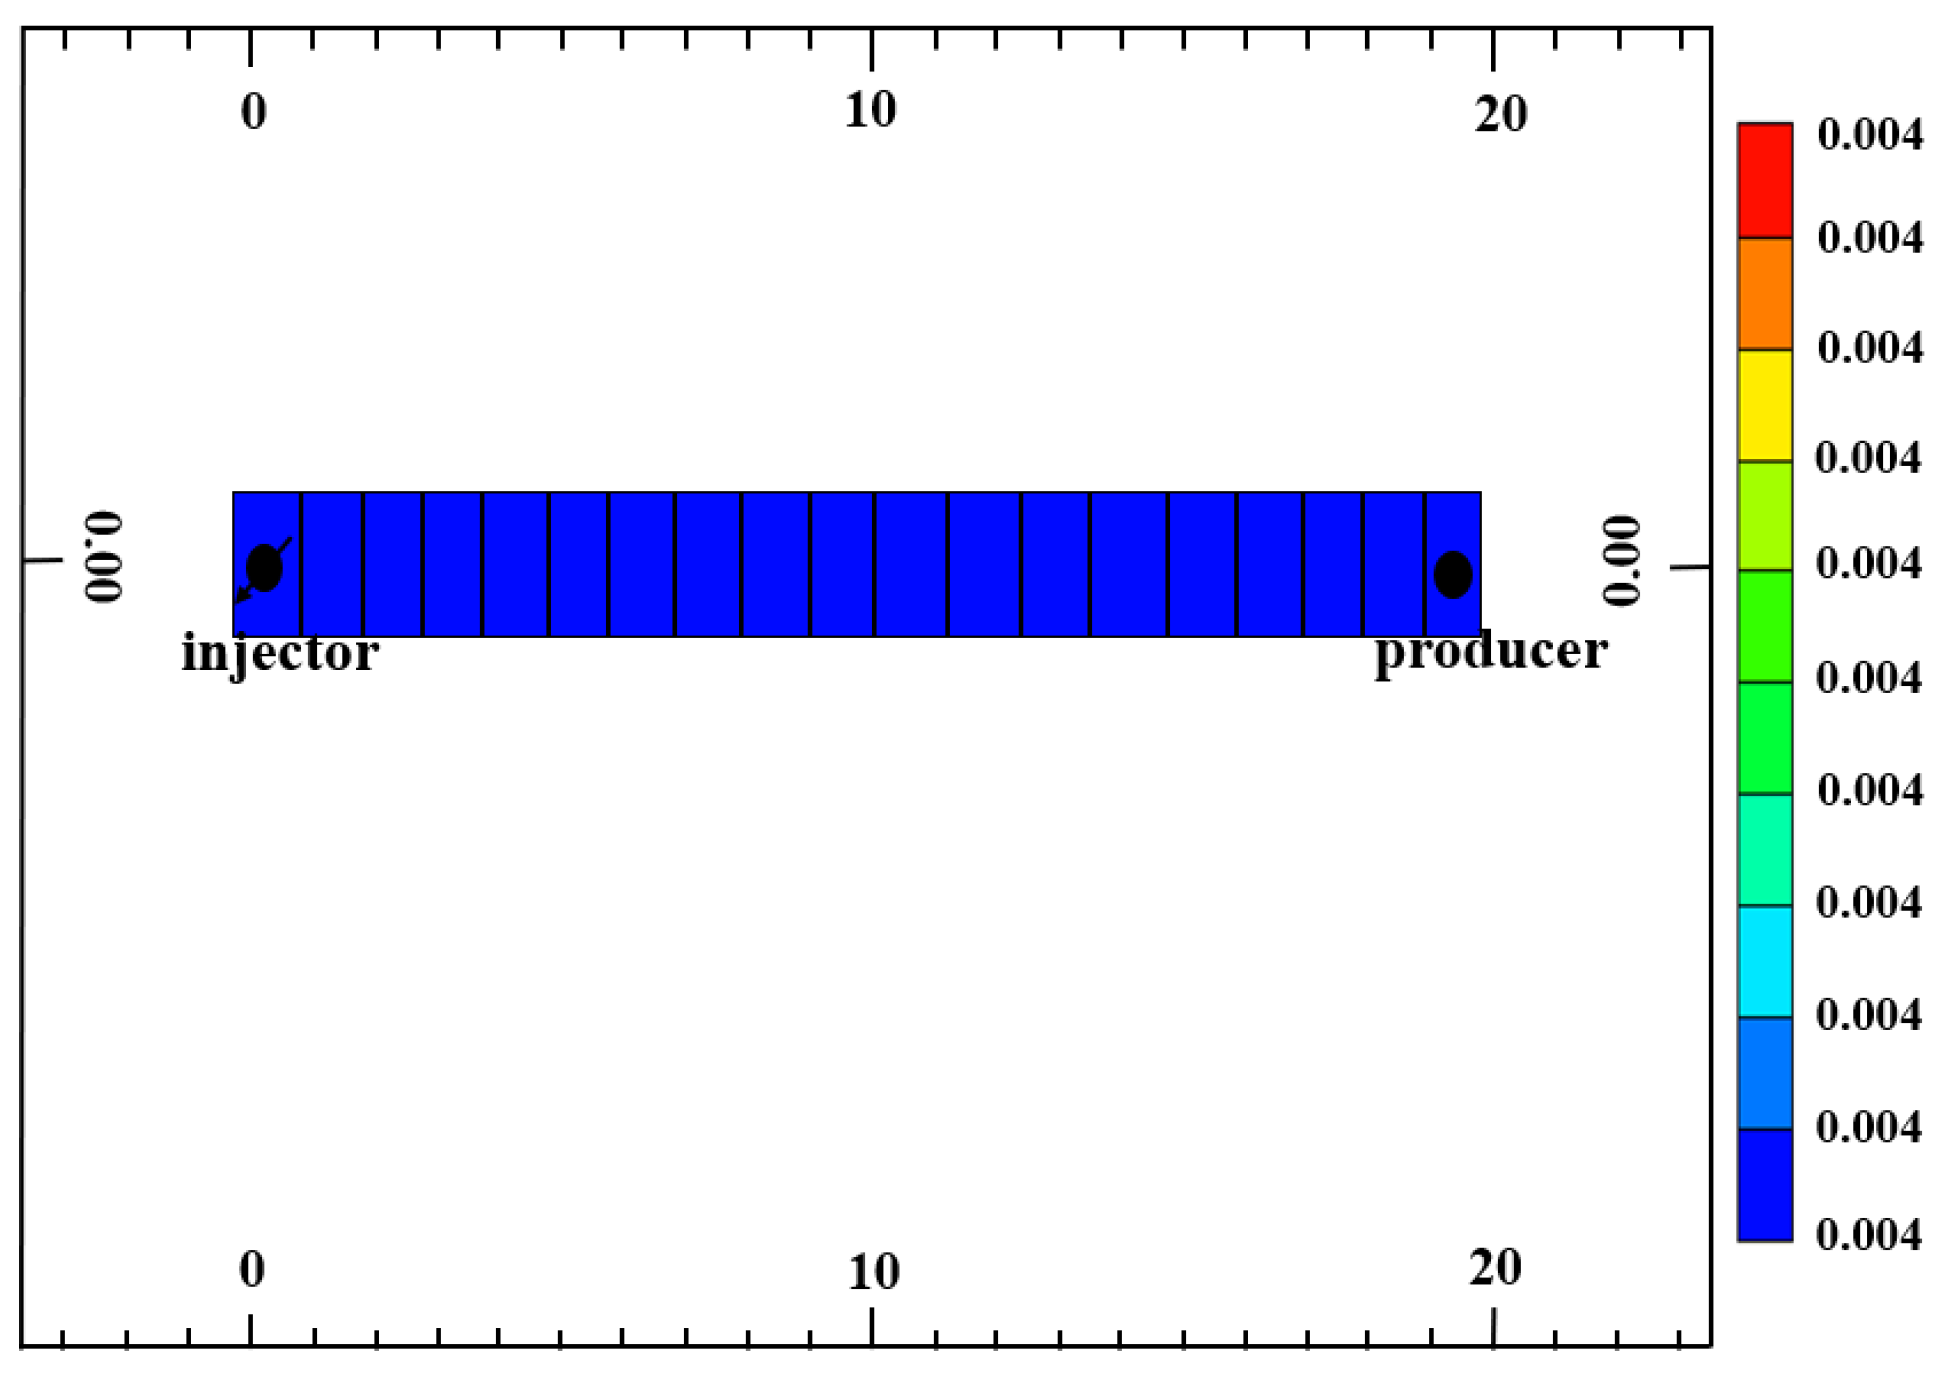
3.2. Pure CO2 Injection and CO2–Water Co-Injection Slim-Tube Simulation Study

Using Builder module of CMG, pure CO2 injection and CO2–water co-injection in 1D slim-tube based on GEM component simulator for formation fluids were used to simulate the miscible characteristics of pure CO2 injection and CO2 –water co-injection on near-critical volatile oil. The dimensions of the slim-tube model were designed as follows: the length of the slim-tube is 20 m, the cross section is square, the side length is 0.0044 m, the average porosity is 9.43%, and the average permeability is 9.7 mD. The grid is divided into 50 in the X direction, one each in the Y and Z directions, and the grid steps are DX = 0.4 m, DY = 0.0044 m, and DZ = 0.0044 m. There is one well at the initial end and one at the end of the model. One well is a production well and the other is an injection well. The model is shown in Figure 5.

4. Result and Analysis

4.1. Study of Complex Phase Behavior Characteristics of CO2 Injection

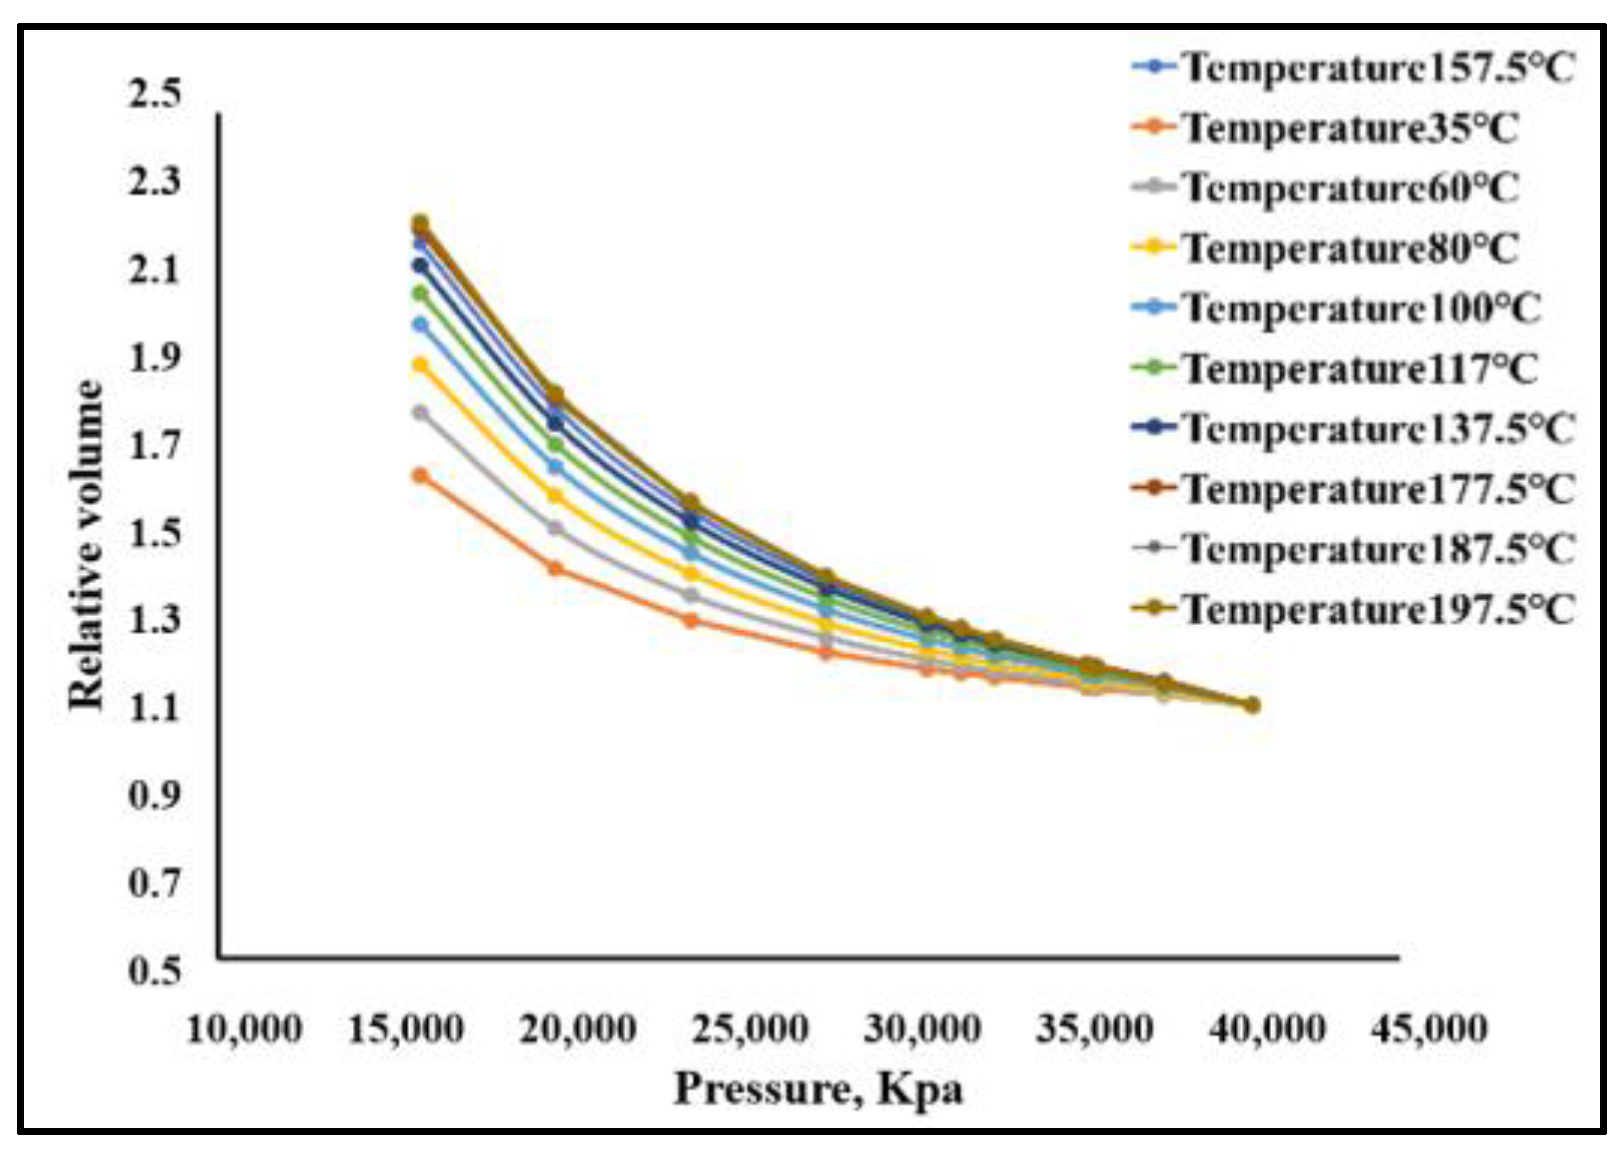
4.1.1. Result Analysis for Single-Phase Behavior Characterization on Near-Critical Volatile Oil

The experimental and simulation results of two-phase flash and constant compositional expansion of single-phase on near-critical volatile oil are shown in Table 6 and Table 7 and Figure 6 and Figure 7. The results of two-phase flash and constant compositional expansion experiments show that the gas–oil ratio of crude oil is 711.5 m3/m3, and the density of crude oil is 0.8006 g/cm3. It shows that the fluid has low density and large gas–oil ratio, which is the volatile oil. The volume expansion of crude oil increases with the increase in temperature and decreases with the increase in pressure. When the temperature is 177.5~187.5 °C, the saturation pressure in the system transforms from bubble point pressure to dew point pressure. The simulation results of two-phase flash and constant compositional expansion experiments show that the calculated values are quite close to the simulated values, and the relative errors are less than 5%; the simulation results can show the real formation fluid better. The P-T phase diagram calculated from the simulation at the same time shows that the formation temperature and pressure point are located to the left of the critical point, and the formation temperature is close to the critical temperature of the formation fluid. Therefore, the formation fluid belongs to the near-critical volatile oil system.

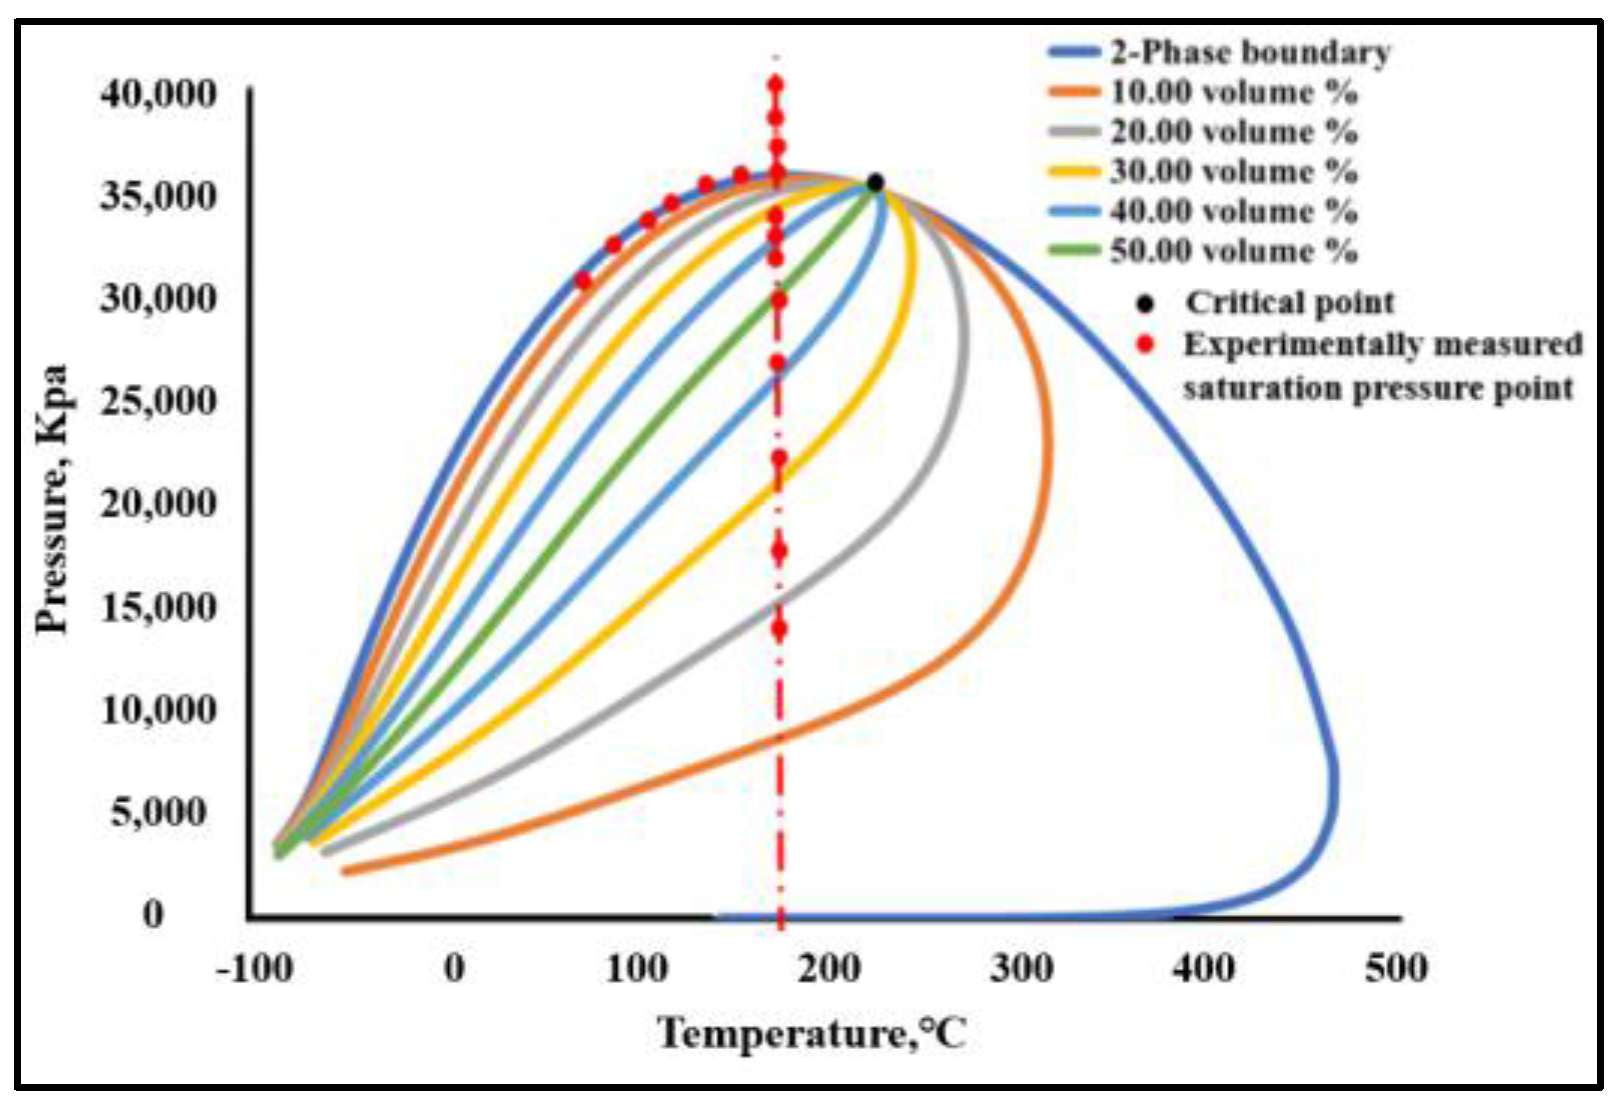
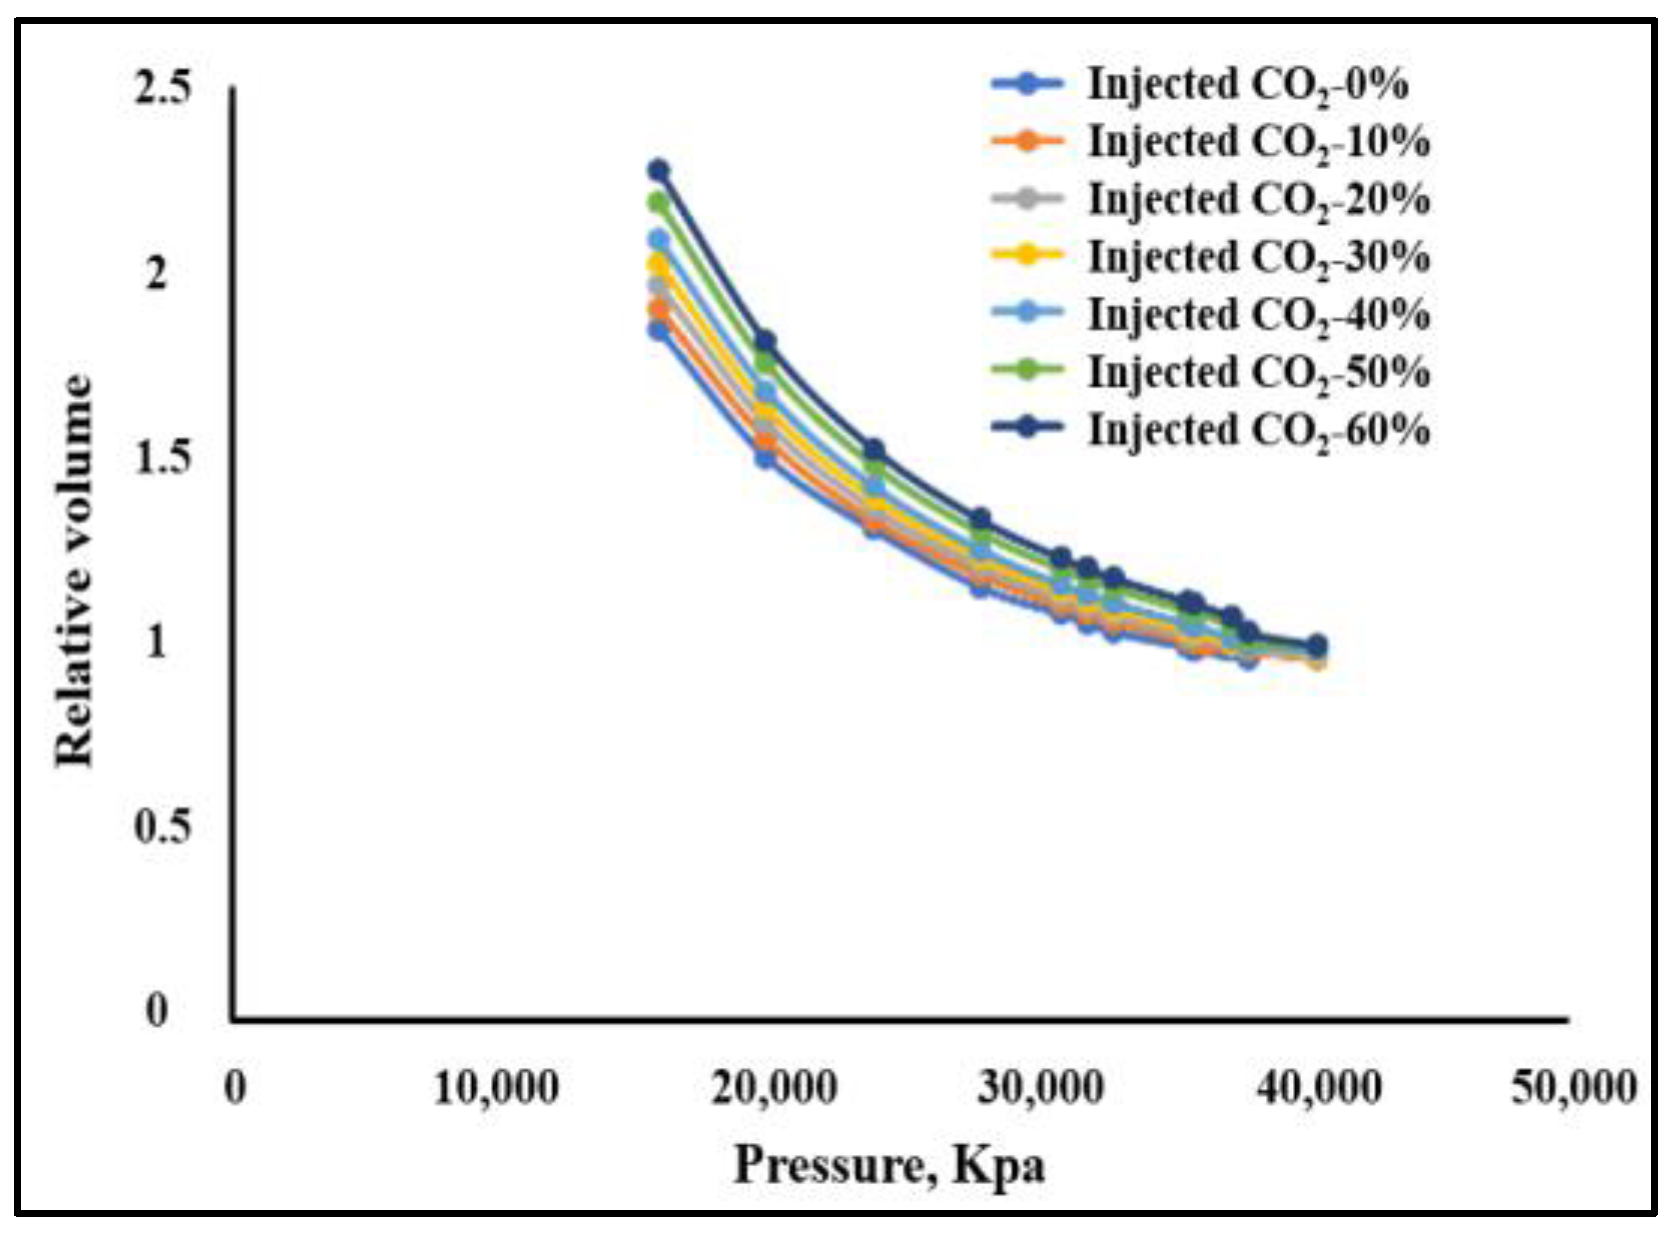
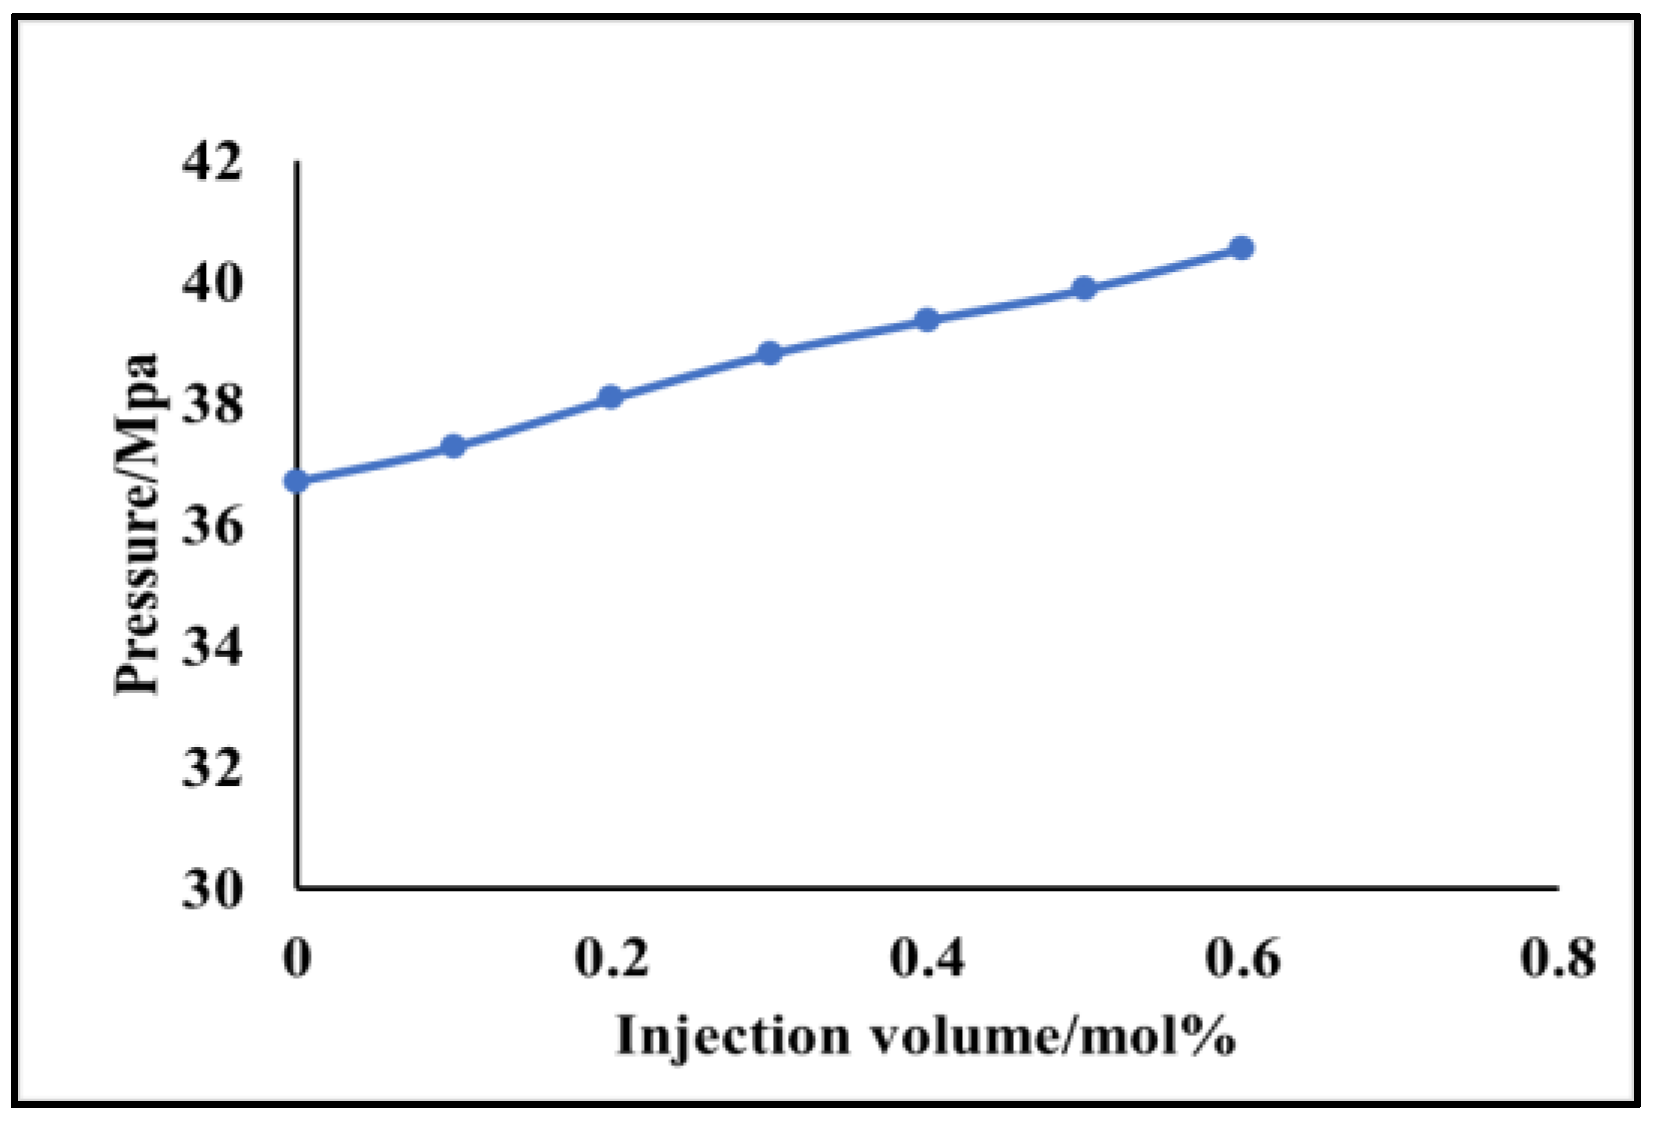
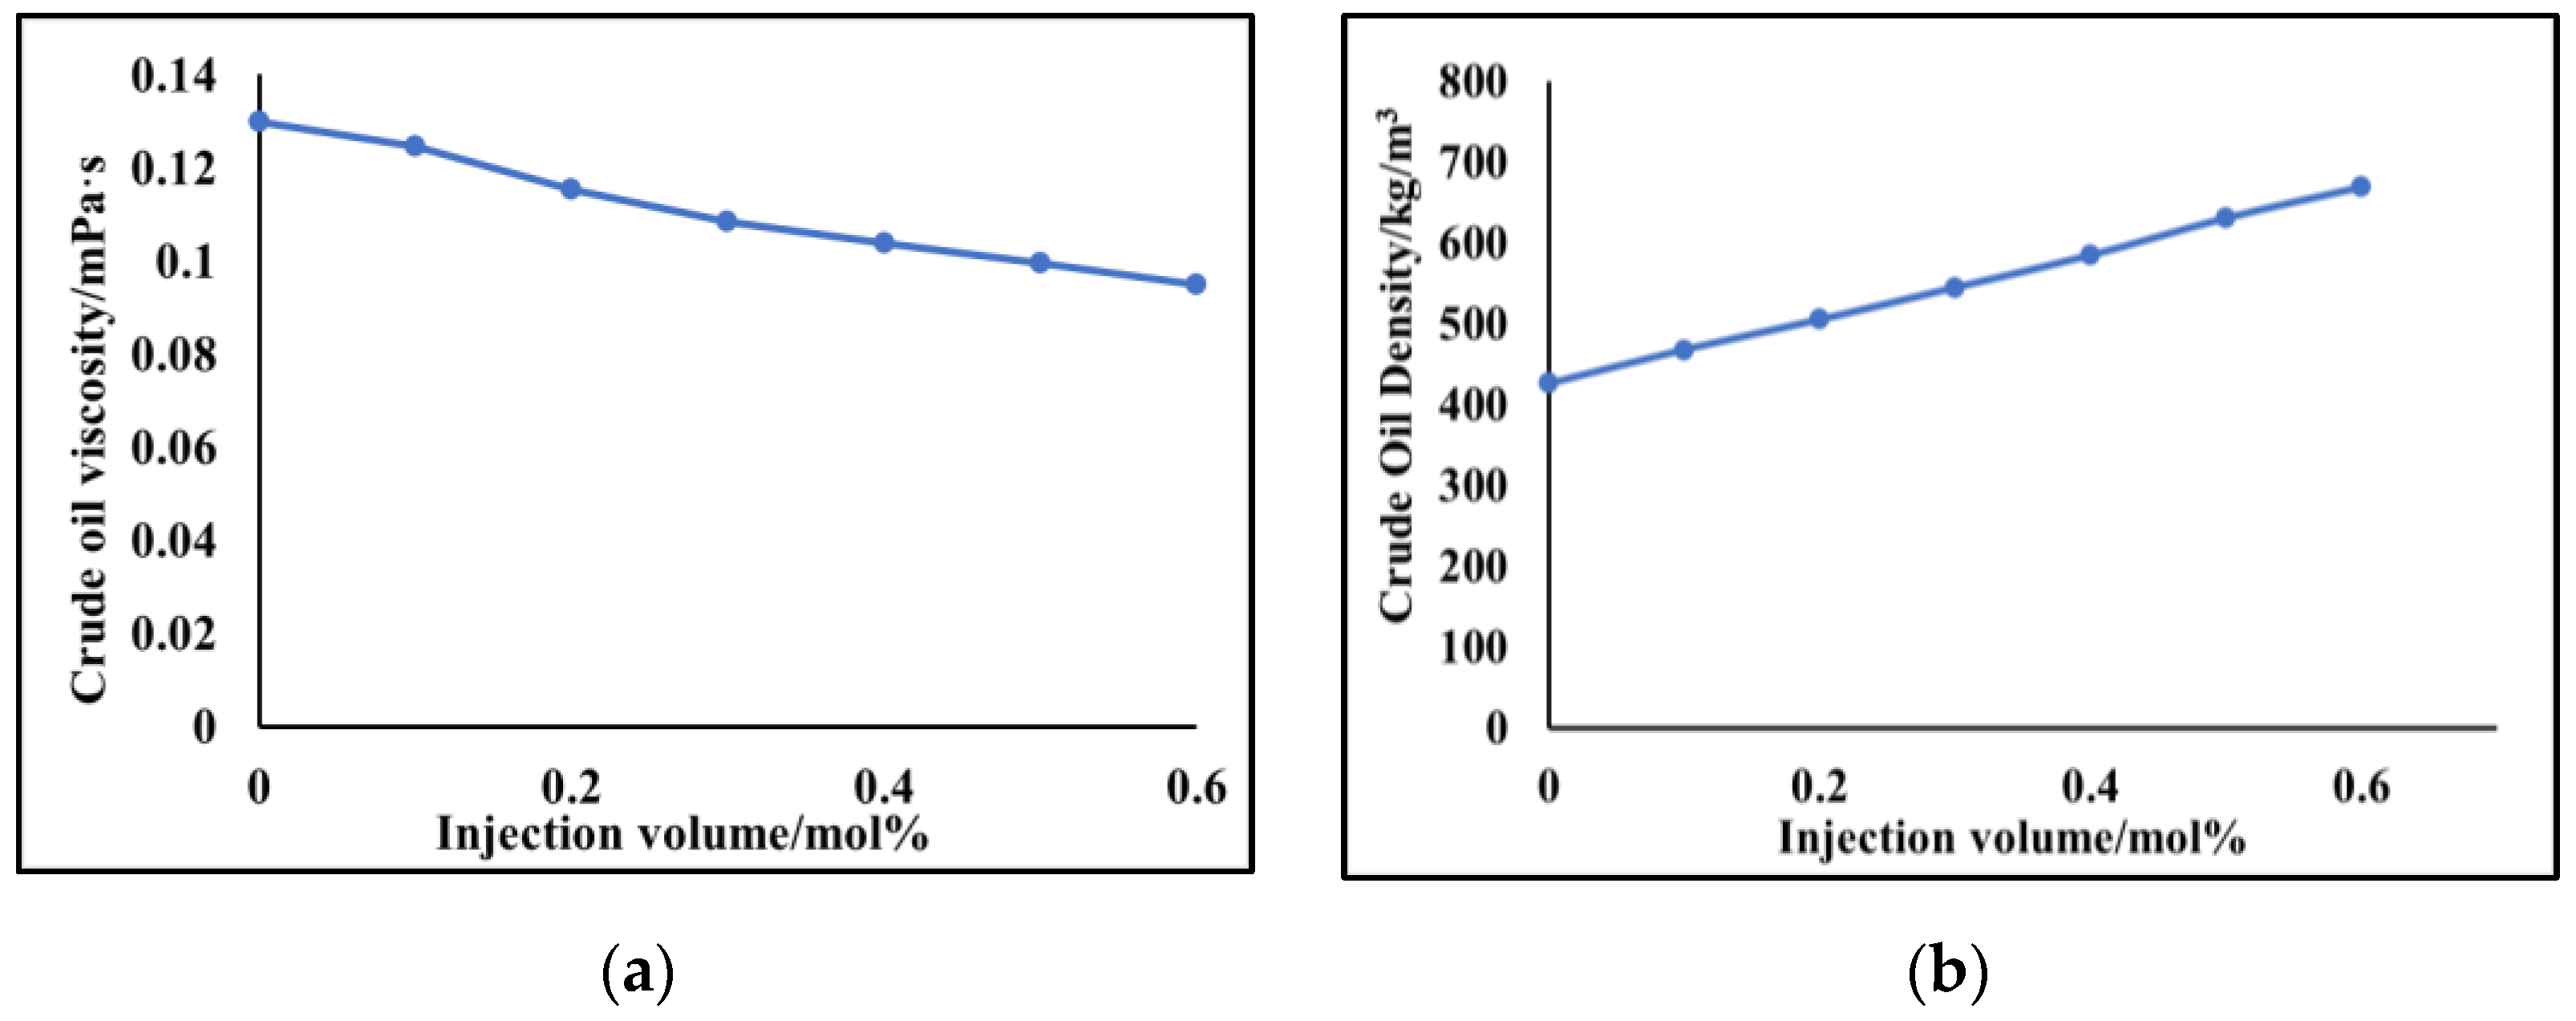
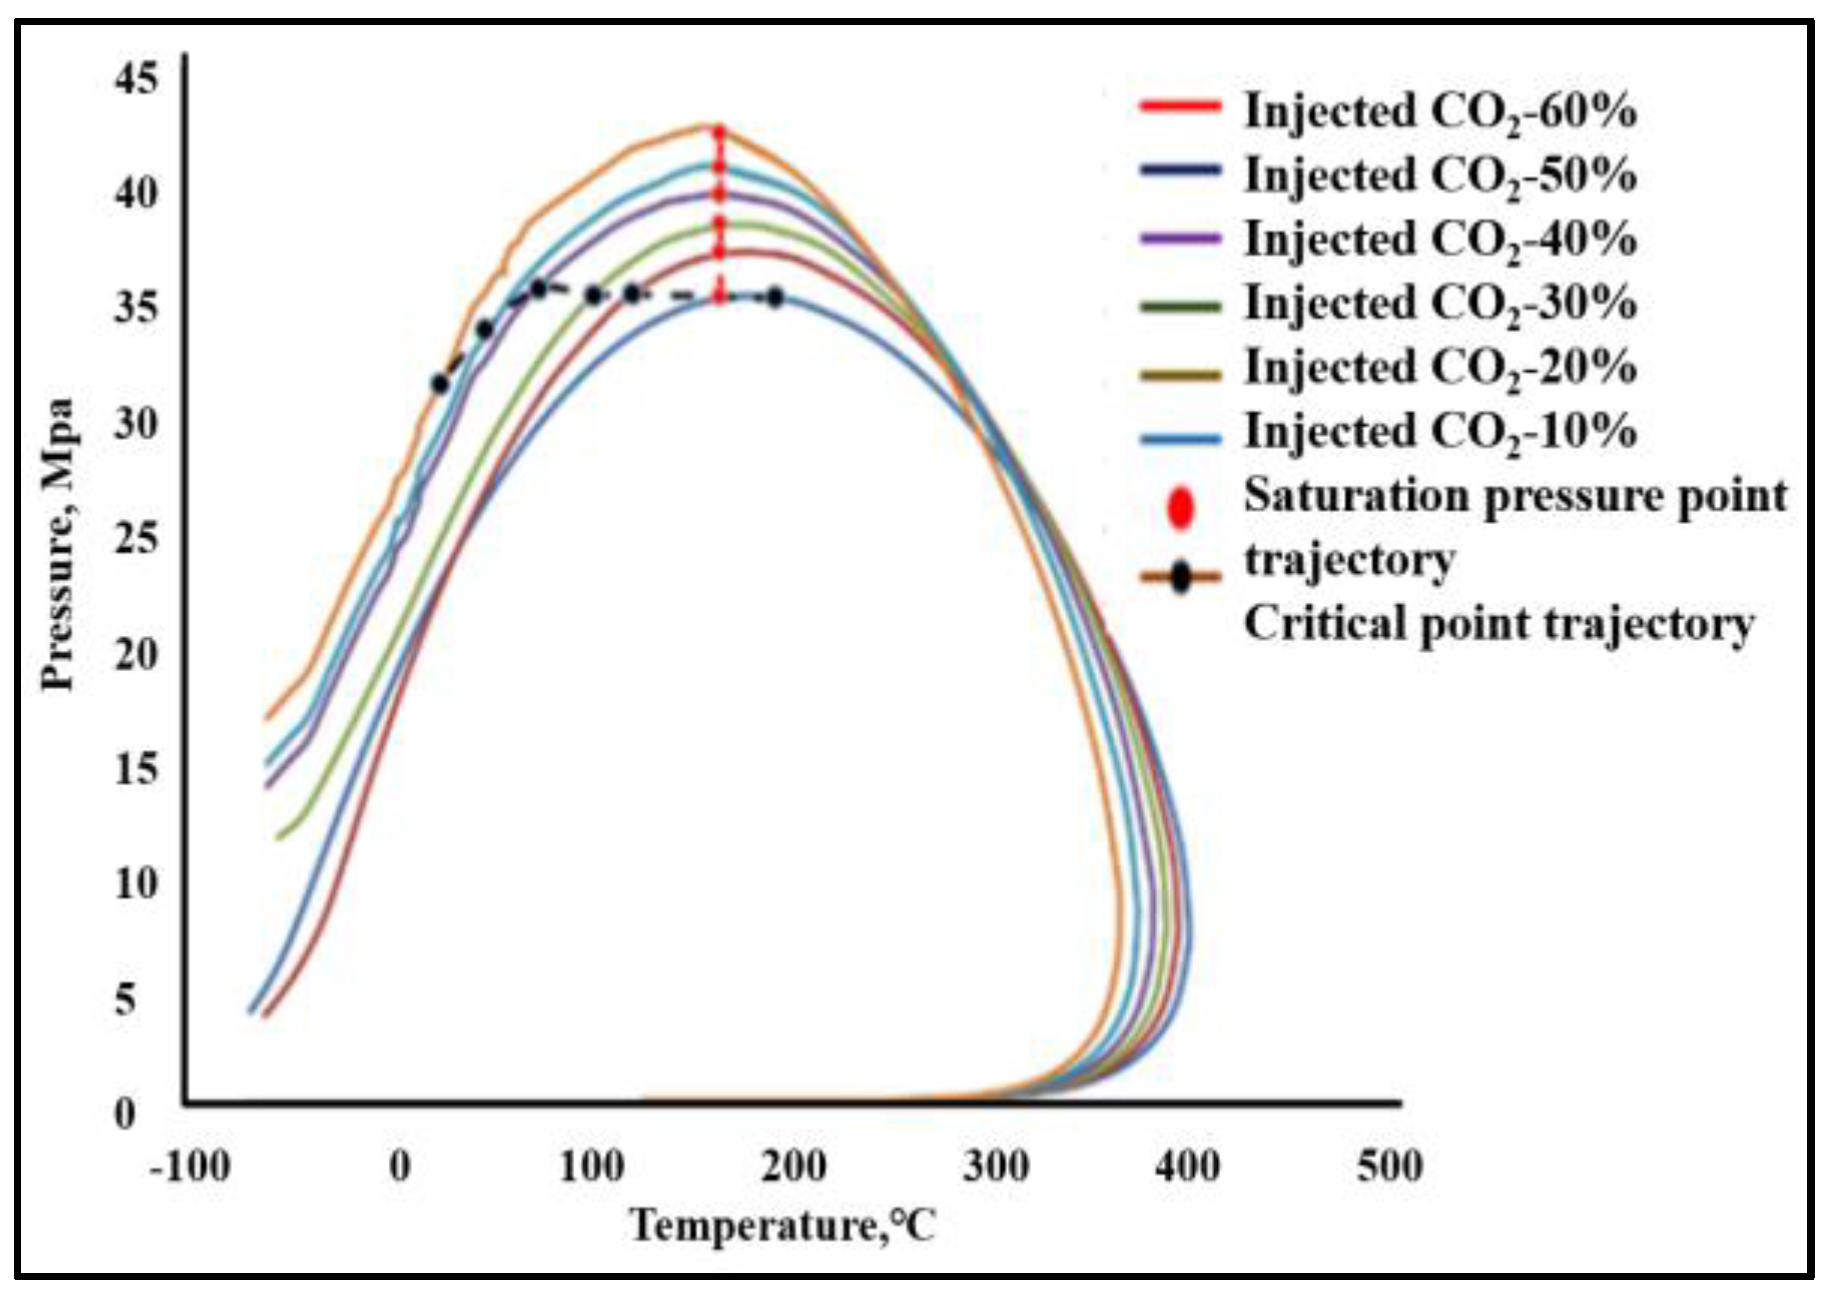
4.1.2. The Two-Phase Behavior Characteristic Result Analysis for CO2-Near-Critical Volatile Oil

The experimental and simulation results of near-critical volatile oil injected CO2 phase characteristics are shown in Figure 8, Figure 9, Figure 10, Figure 11, Figure 12 and Figure 13. The experimental results of near-critical volatile oil injection CO2 phase characteristics (Figure 8, Figure 9 and Figure 10) show that the relative volume increases with the increase in injected CO2 content in the system, decreases with the increase in pressure, and gradually converges to 1. It shows that, under the high-pressure condition, more CO2 is dissolved in the near-critical volatile oil system to form a single phase, resulting in the relative volume gradually tends to 1, and eventually, CO2 will be completely dissolved in the near-critical volatile oil system to become the single-phase. The near-critical volatile oil saturation pressure gradually increases with the increasing amount of CO2 injection. After injecting 20 mol% of CO2, the saturation pressure was 37.37 MPa, and when the injection amount reached 60 mol%, the system saturation pressure reached 43.09 MPa. With the increasing injection of CO2, the density of near-critical volatile oil gradually increases, while the viscosity gradually decreases, indicating that the CO2 is in a supercritical state under the conditions of formation temperature and different saturation pressure. The higher density and lower viscosity of CO2 in supercritical conditions have better pumping ability, which eventually leads to the increase in density and decrease in viscosity of crude oil after CO2 injection. The phase characteristic simulation results for CO2 injection on near-critical volatile oil (Figure 11, Figure 12 and Figure 13) show that, under the formation conditions (temperature of 157.5 °C and pressure of 40.6 MPa), the saturation pressure of the system gradually increases with the increasing amount of CO2 injection, the critical temperature gradually decreases, the critical pressure initially increases and then decreases, and the critical point moves to the upper left. When the injection amount reaches 10~20%, the heavy hydrocarbon components in the system are extracted, which makes the phase characteristics transform from a near-critical volatile oil system to a condensate gas system. When the CO2 injection amount reaches 20 mol% under the original formation conditions, the gas and crude oil reach the primary contact miscible phase, and the primary contact miscible pressure is 37.62 MPa. With the increasing pressure, the gas–liquid two components keep approaching, and when the injection pressure reaches 36.25 MPa, CO2 and the original formation fluid reach the miscible-phase state through multiple contacts, namely, the multiple-contact miscible pressure is 36.25 MPa.

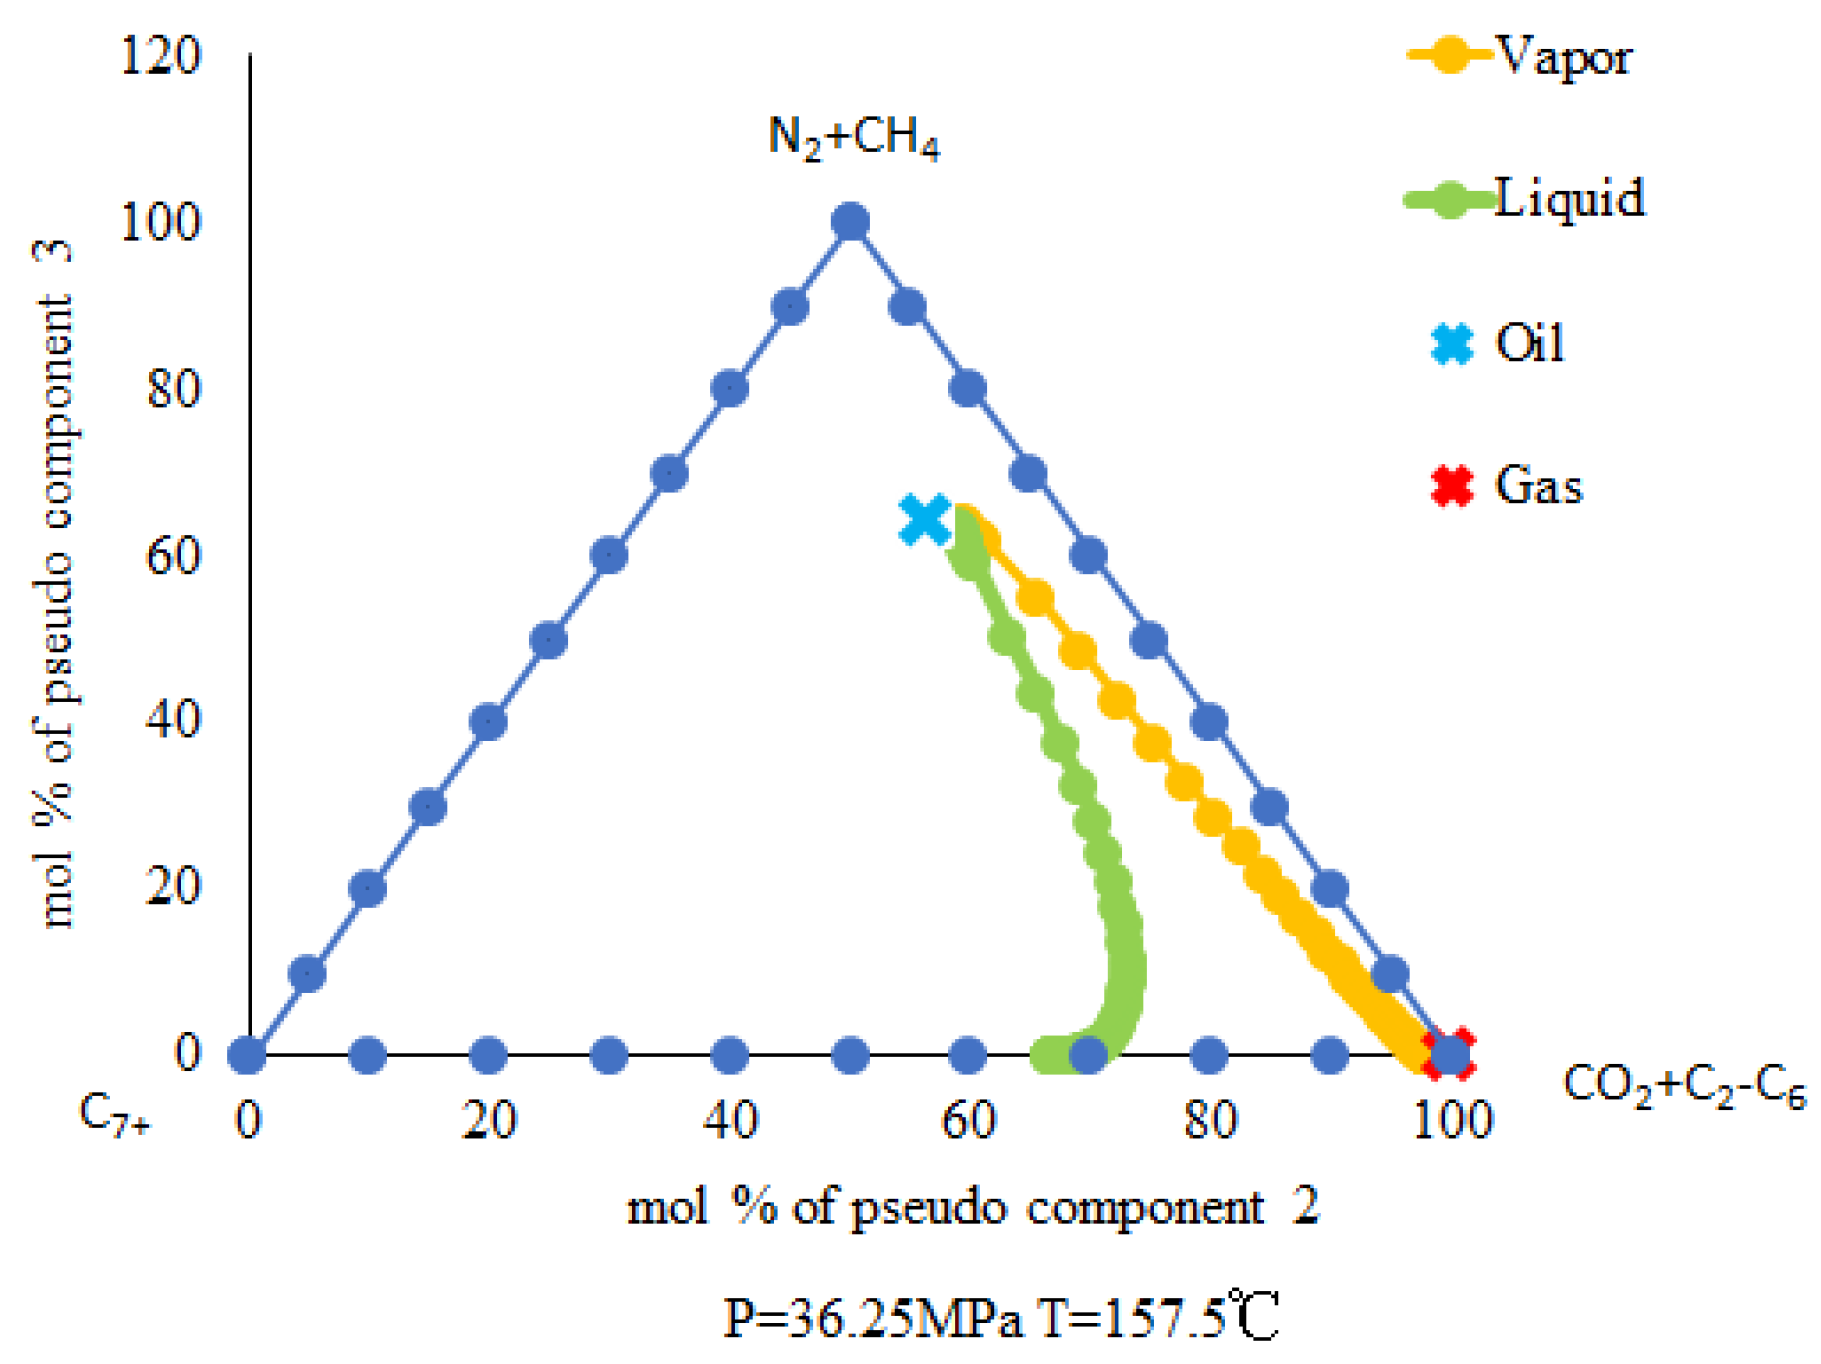
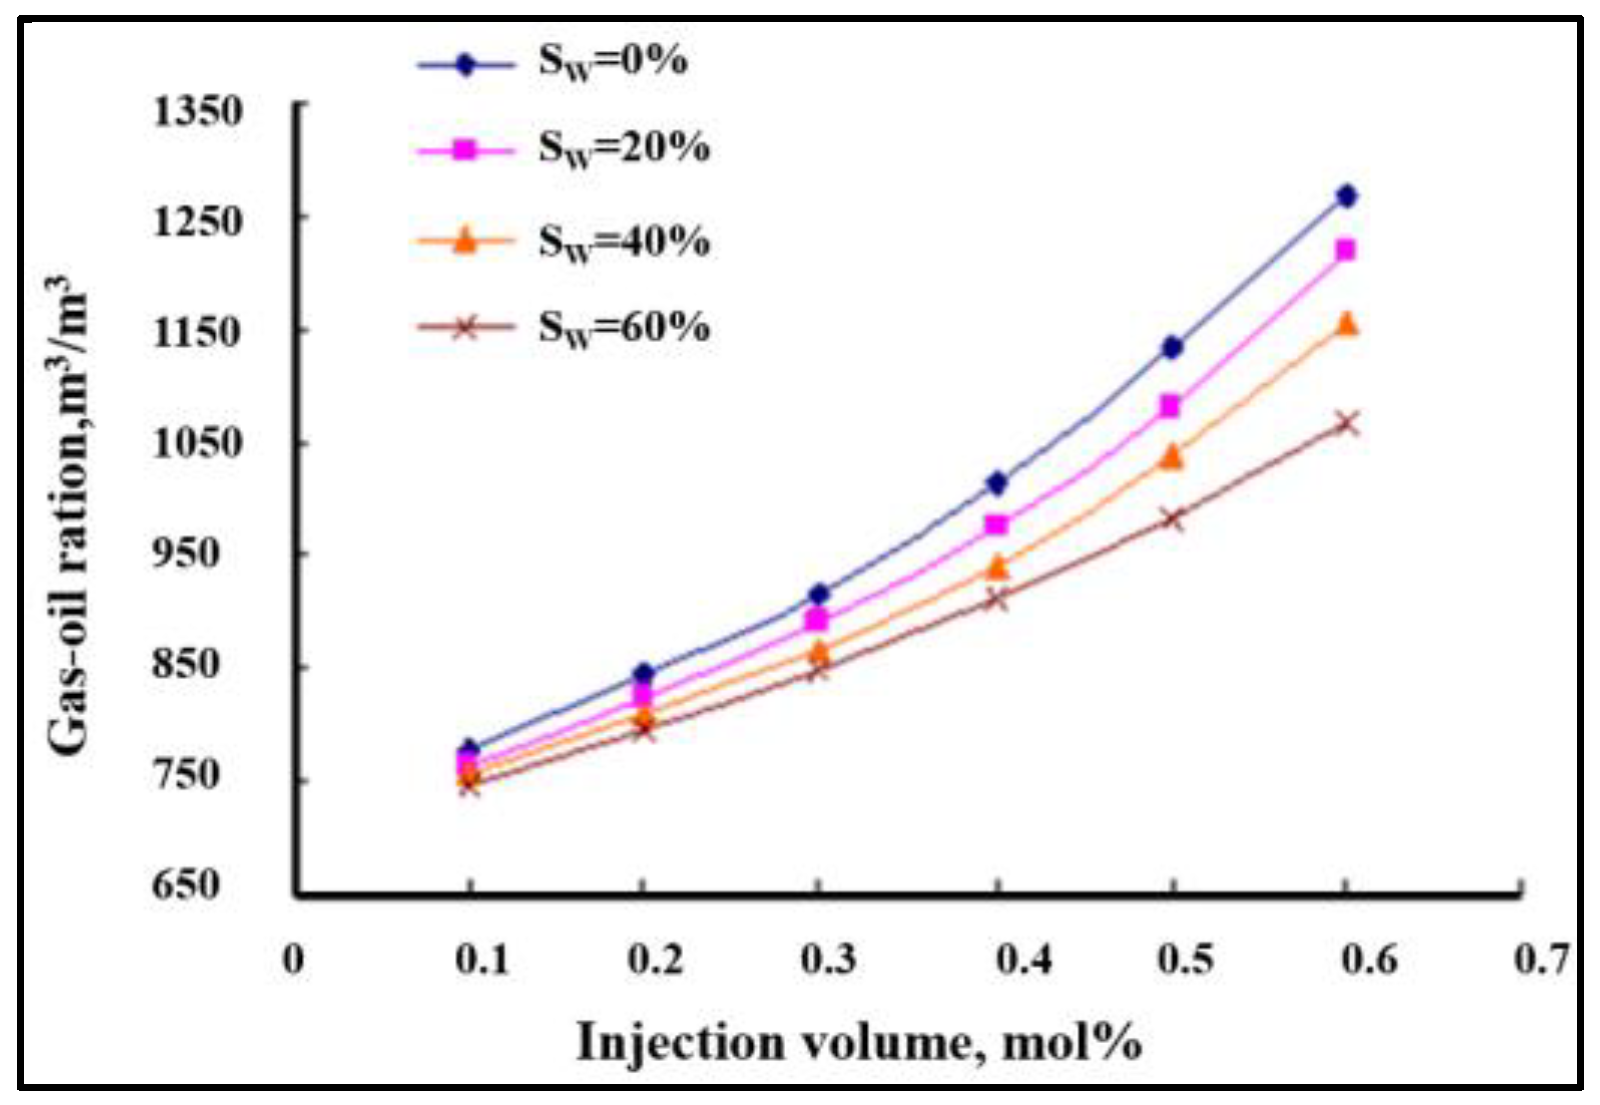
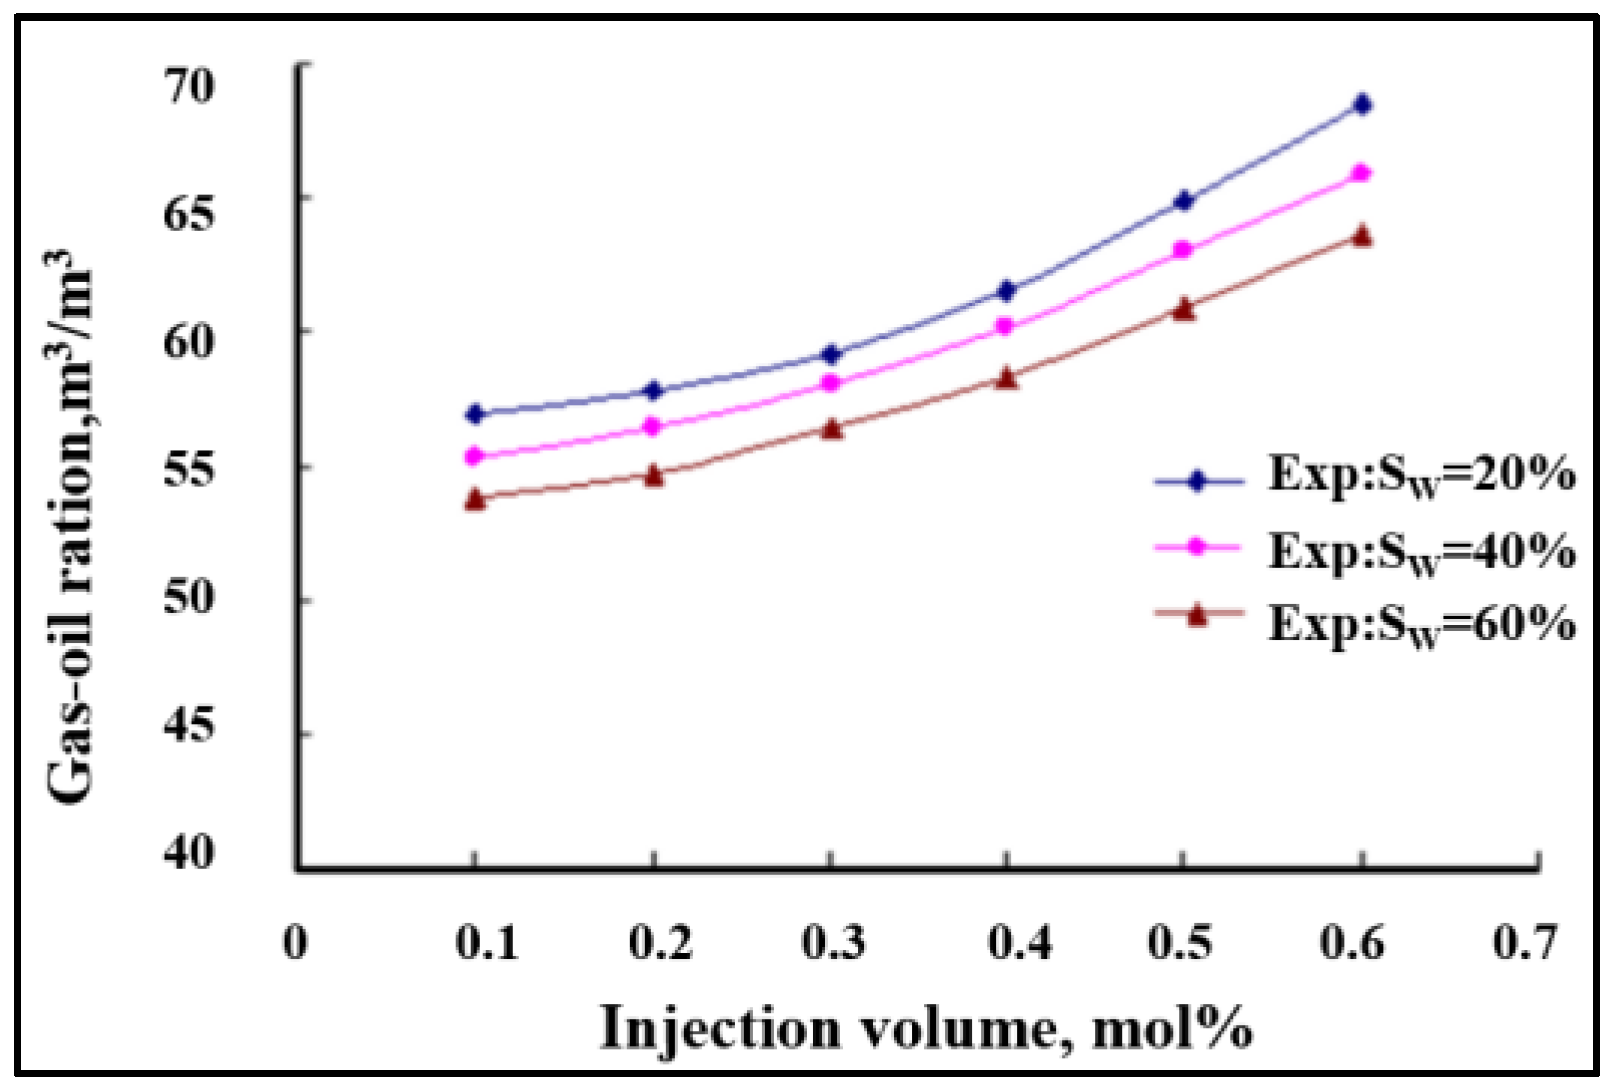
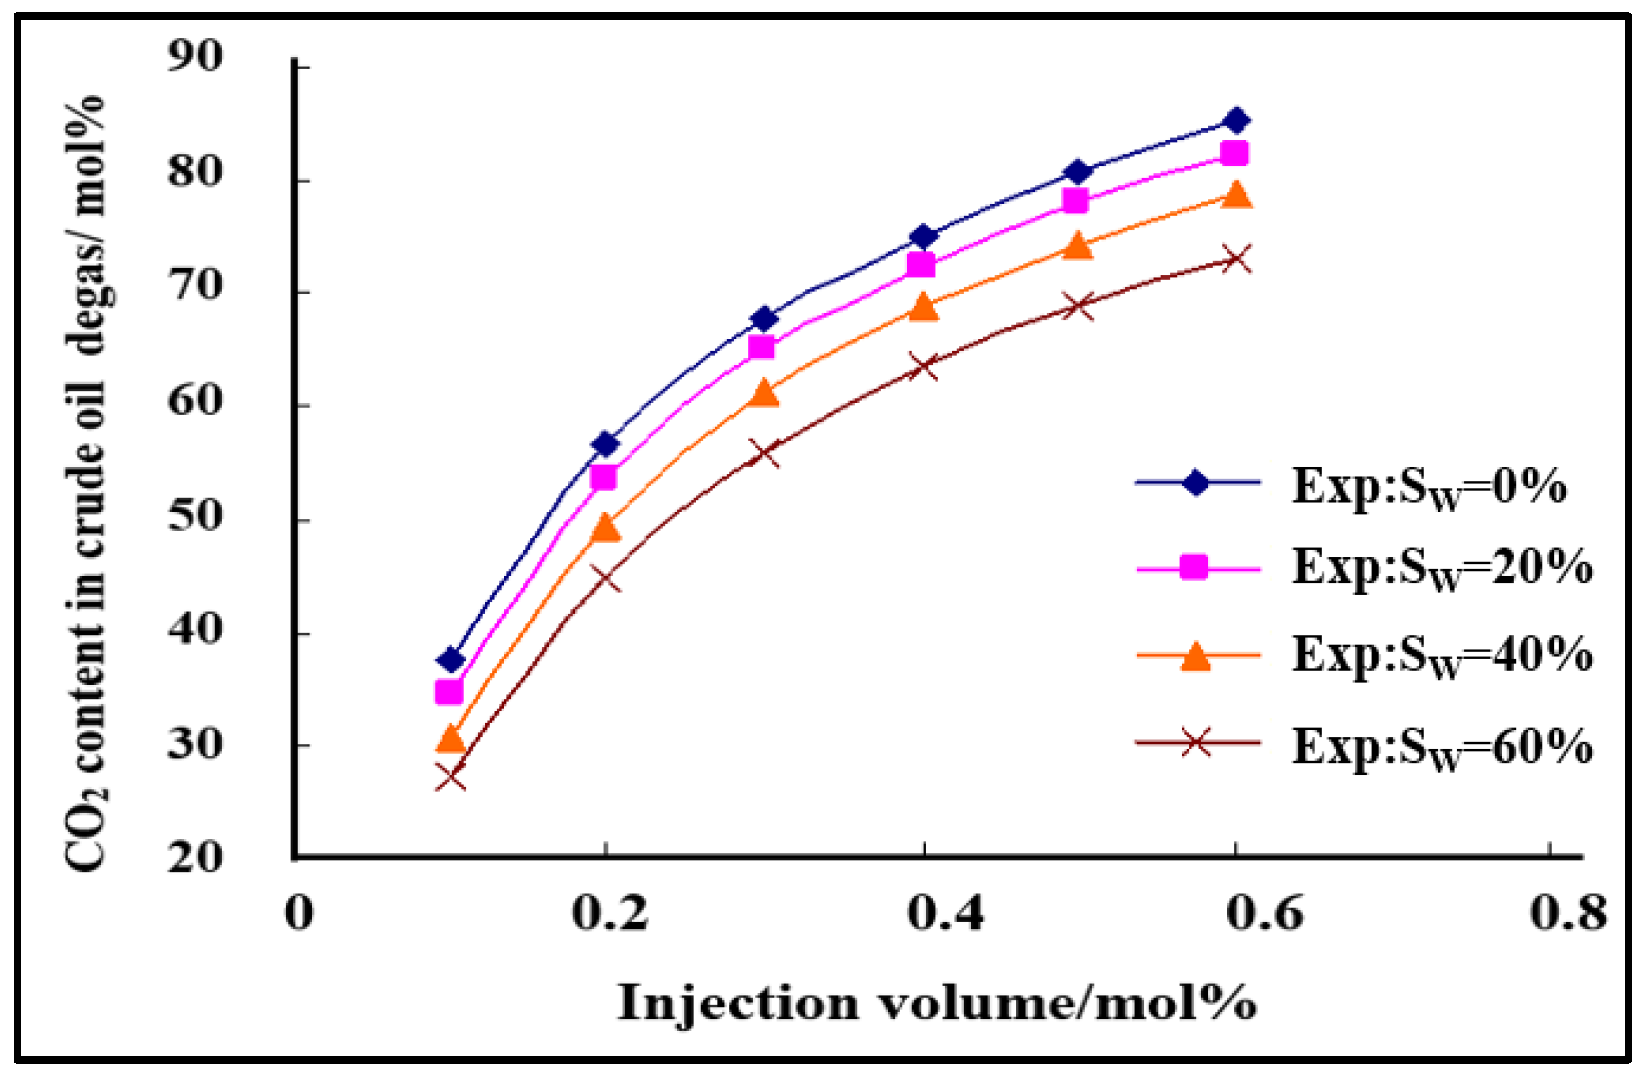
4.1.3. The Three-Phase Behavior Characteristic Result Analysis for CO2-Near-Critical Volatile Oil-Formation Water

The experimental results of near-critical volatile oil injection CO2 phase characteristics are shown in Figure 14, Figure 15 and Figure 16. The experimental results show that the gas–oil ratio and gas–water ratio are positively correlated with CO2 injection and negatively correlated with water saturation. This is due to CO2 continuously dissolving in formation water, which reduces the content of dissolved CO2 in crude oil and the saturation pressure, resulting in lower gas content in crude oil degas, and the higher the water saturation, the less CO2 gas is contained in the degas.

4.2. Study on the Miscible Characteristics for CO2 Injection and CO2–Water Co-Injection

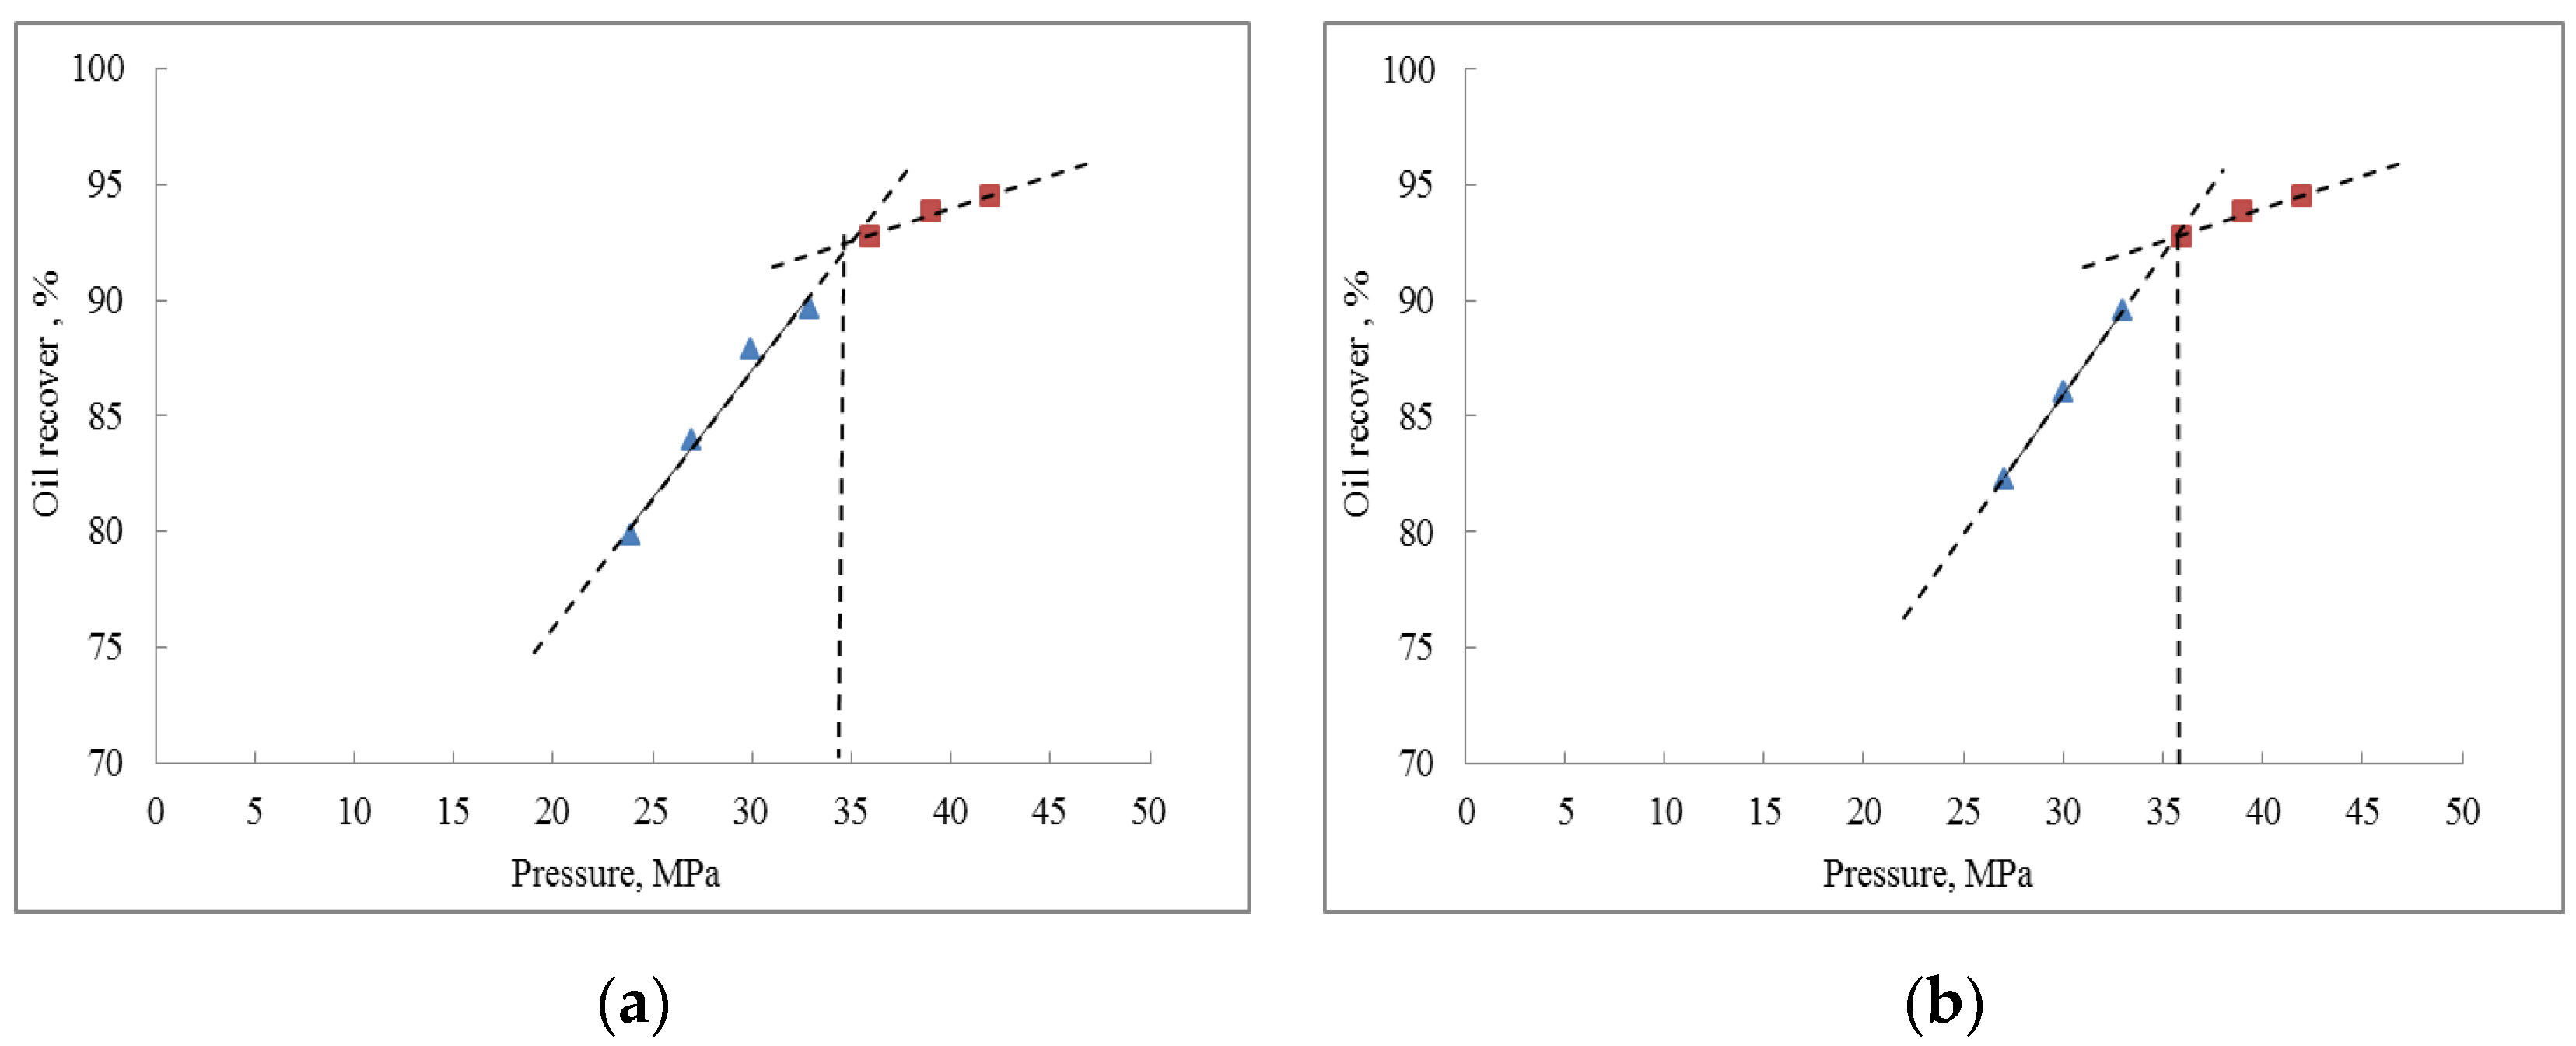
4.2.1. Slim-Tube Experiment Result Analysis with Pure CO2 Injection and CO2–Water Co-Injection

The experimental results are shown in Table 8 and Figure 17. In this CO2–water co-injection process, the CO2 to water injection ratio is 3:1. Experimental results show that the degree of crude oil recovery rate is positively correlated with the injection pressure, but the increase in recovery rate becomes decreasing as the pressure continues to increase. According to the petroleum industry standard “SY/T 6573-2016 minimum miscible-phase pressure experimental determination method—slim-tube method”, making the relationship curve between the degree of recovery and pressure, two straight lines between the data points and pressure for the degree of recovery greater than 90% and the degree of recovery less than 90% respectively, the reverse extension of the two lines, and the intersection of the two lines is the minimum miscible-phase pressure. Therefore, the minimum miscible pressure obtained from the slim-tube experiment with pure CO2 injection is 34.0 MPa, and the minimum miscible pressure obtained from the slim-tube experiment with CO2–water co-injection is 35.6 MPa. This indicates that when the injection pressure reaches 36 MPa, the crude oil recovery rate is greater than 90% for both pure CO2 injection and CO2–water co-injection, and the system is in a miscible-phase state. When the injection pressure is less than 36 MPa, the crude oil recovery is less than 90%, and at this time the gas–liquid has not yet formed a miscible phase. The results also show that the minimum miscible pressure obtained from the slim-tube experiment with pure CO2 injection is lower than the minimum miscible pressure obtained from the slim-tube experiment with CO2–water co-injection, which is due to the fact that when CO2–water is injected together, part of the CO2 is dissolved in water, resulting in less CO2 in contact with the crude oil and a higher miscible pressure.

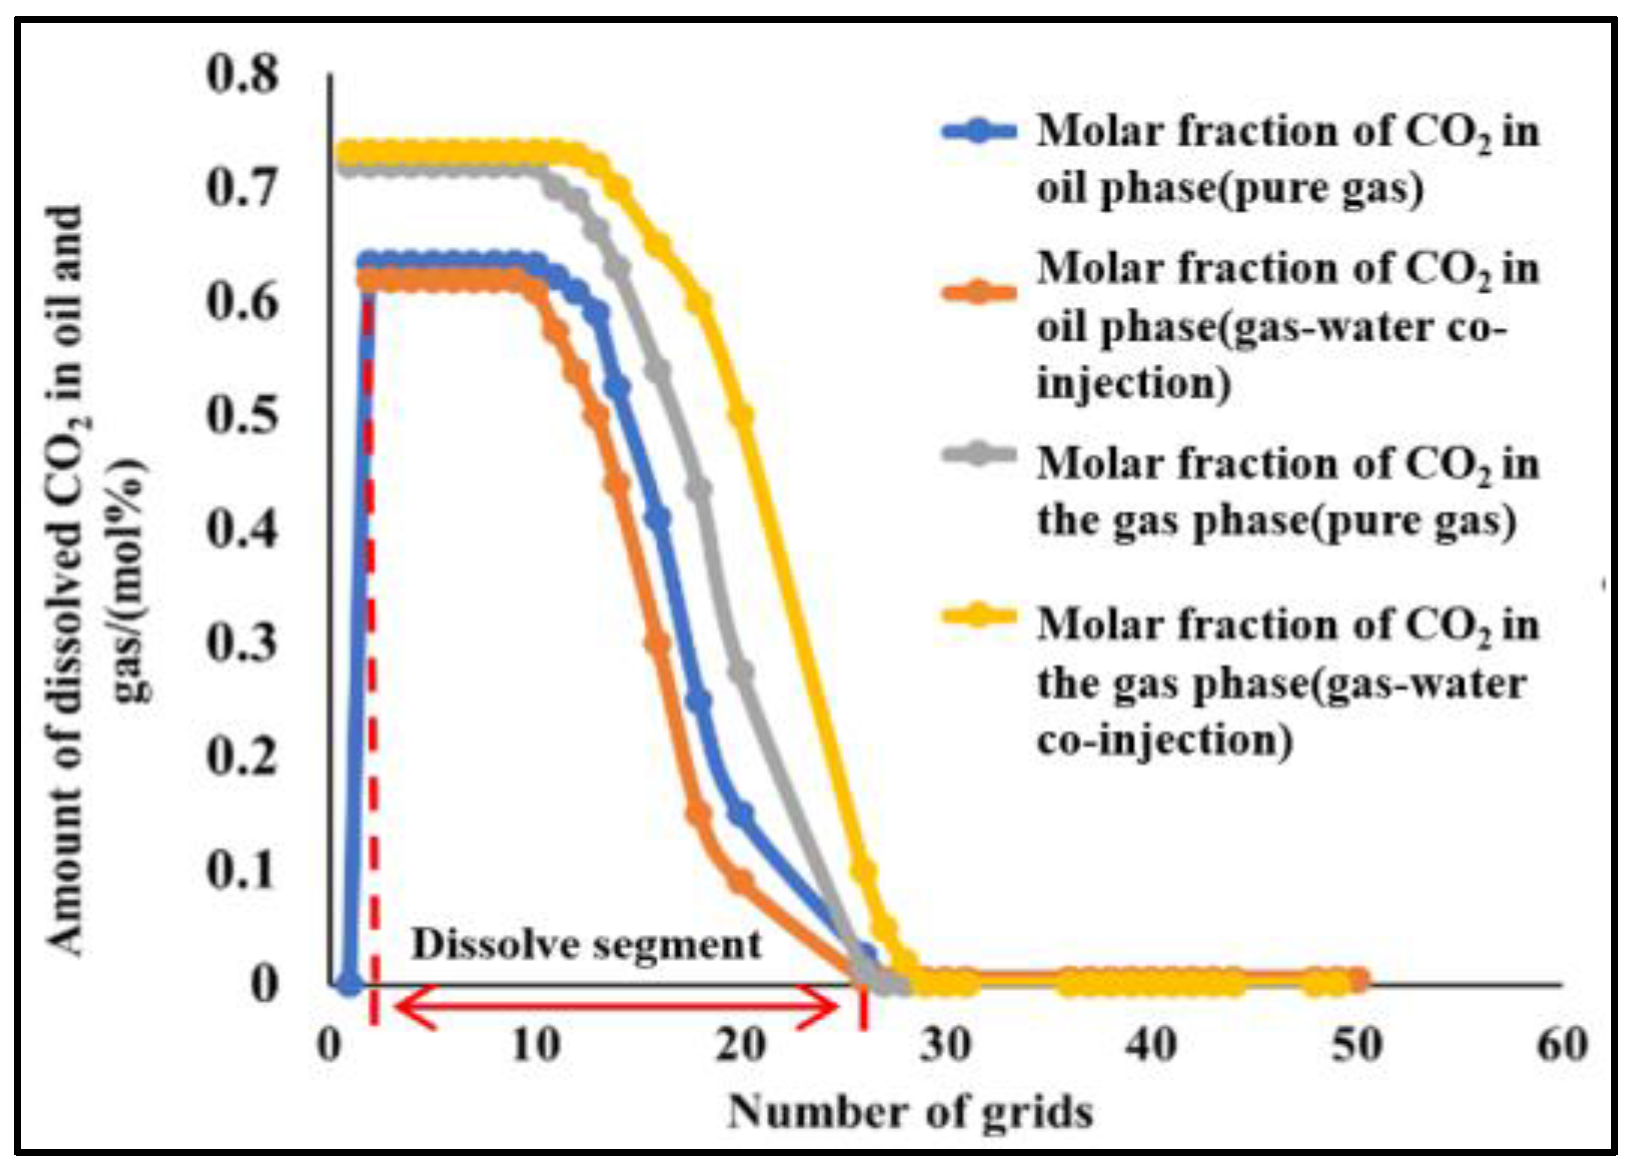
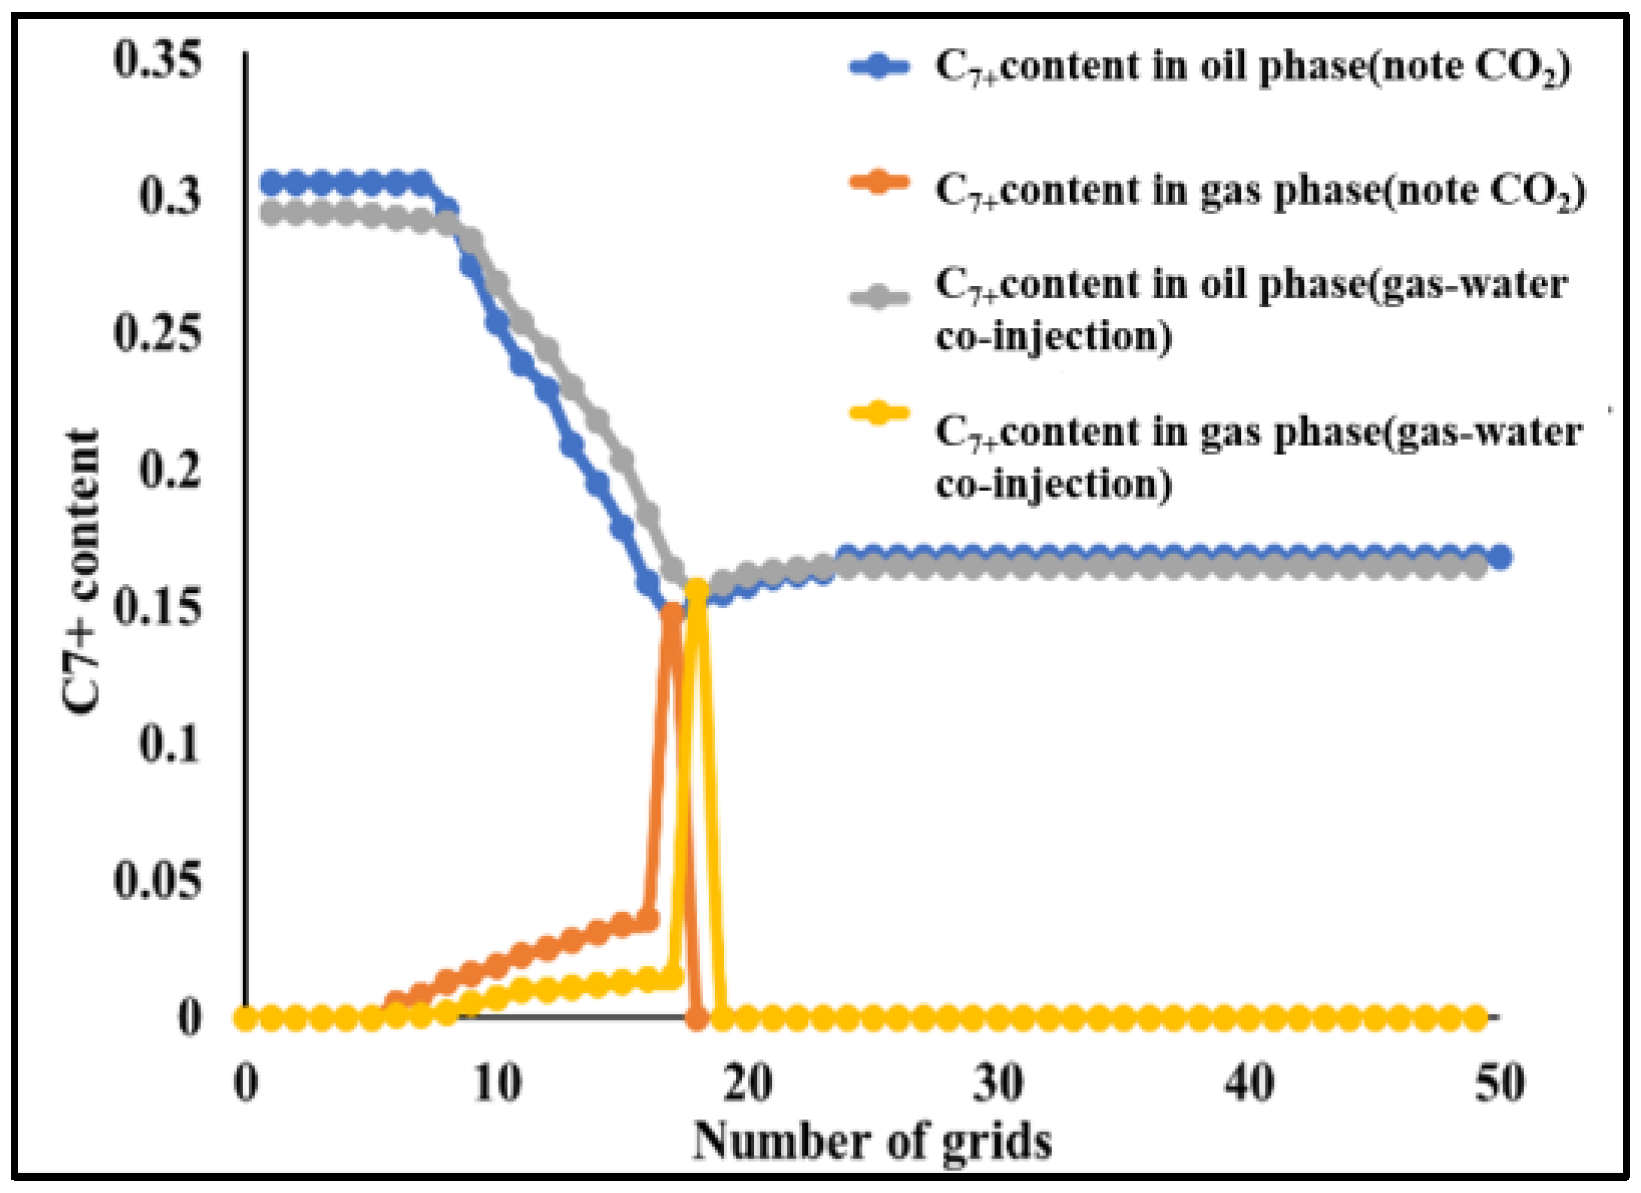
4.2.2. Slim-Tube Simulation Result Analysis with Pure CO2 Injection and CO2–Water Co-Injection

Using the slim-tube simulation method established in Section 2.2, a slim-tube simulation study with pure CO2 injection and CO2–water co-injection was conducted. The simulated values of the minimum miscible pressure for pure CO2 injection and CO2–water co-injection are shown in Table 9 and Table 10. The simulated CO2–water co-injection process is 3:1 ratio of CO2–water injection. As can be seen from Table 9 and Table 10, the simulated values of the minimum miscible phase pressure for pure CO2 injection and CO2–water co-injection are 34.8 MPa and 35.4 MPa, respectively, and the simulated and calculated values are very close to each other, with relative errors less than 1%. Therefore, the model of this slim-tube can better characterize the experiment procedure of the minimum miscible pressure for injection of pure CO2 and CO2–water co-injection in dense low-permeability near-critical volatile reservoirs. On the basis of the above experiments and simulations, a further simulation study of CO2–water co-injection into the slim-tube at the injection ratio of CO2 to water of 1:1 was carried out, and the simulation results are shown in Table 9, with a minimum miscible pressure of 35.7 MPa. It suggests that the larger the proportion of water in the CO2–water co-injection process, the higher the minimum miscible pressure of CO2 and crude oil.

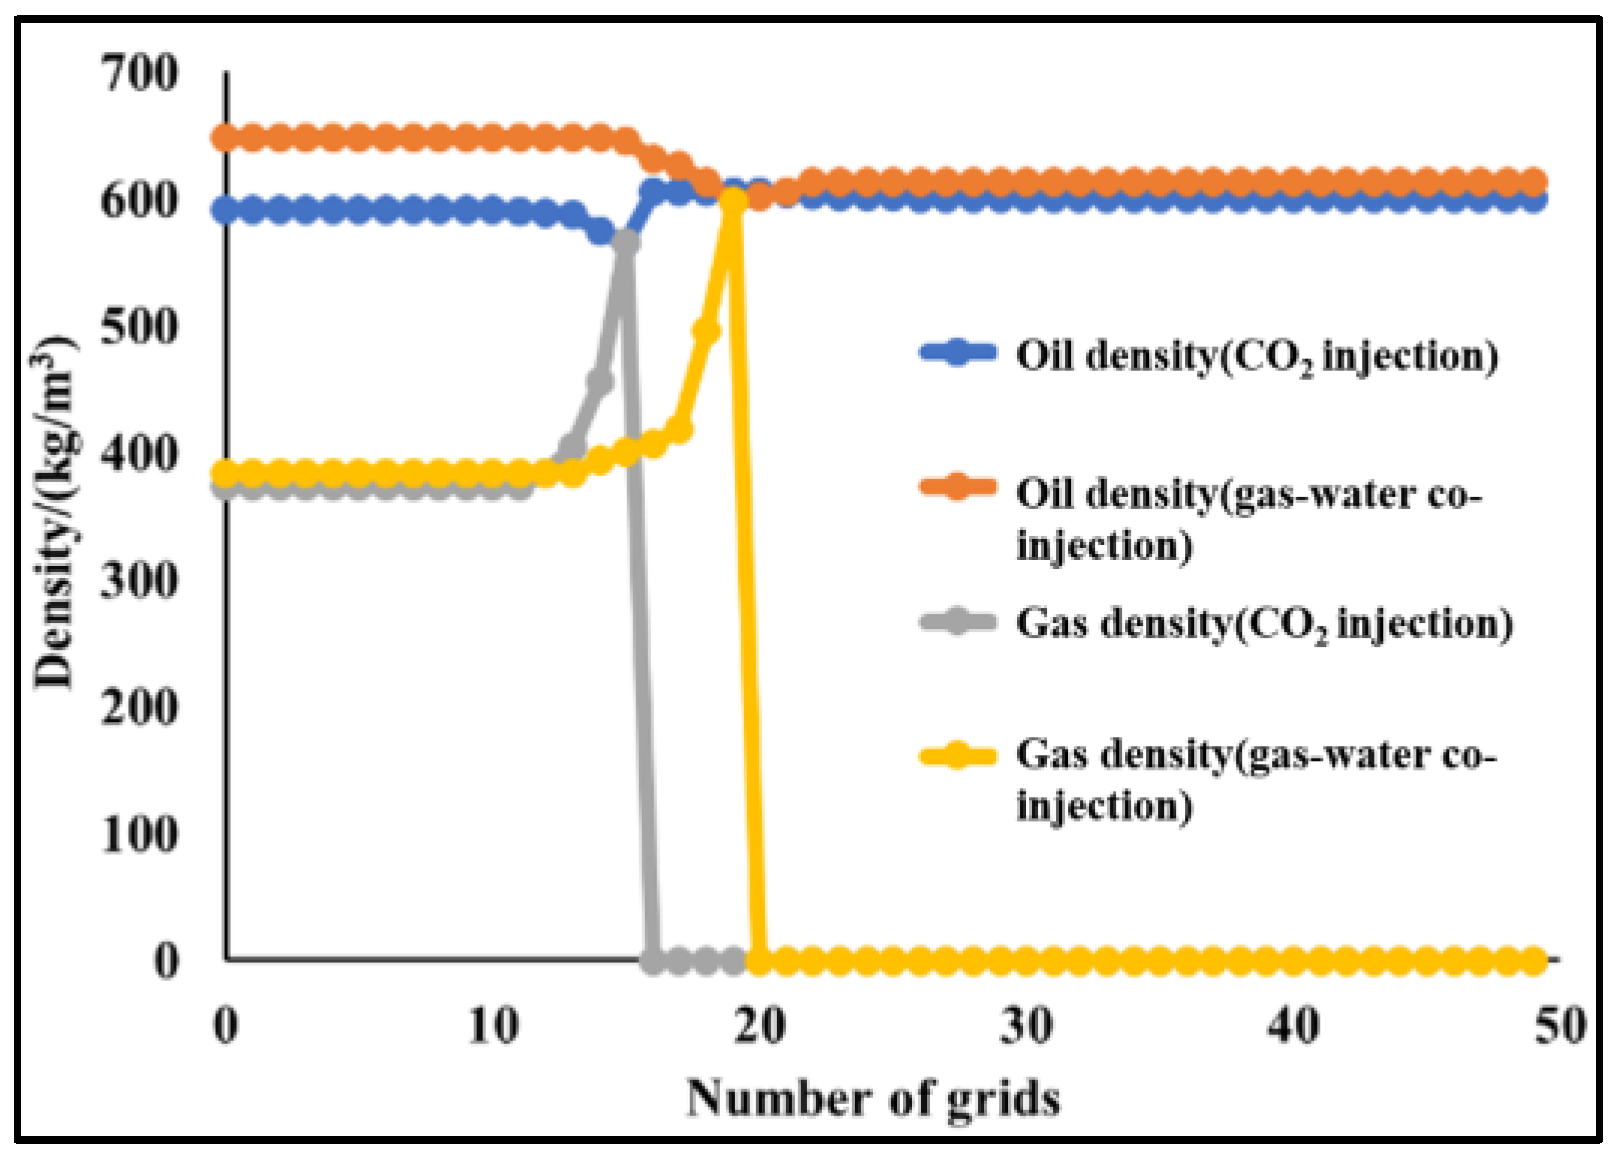
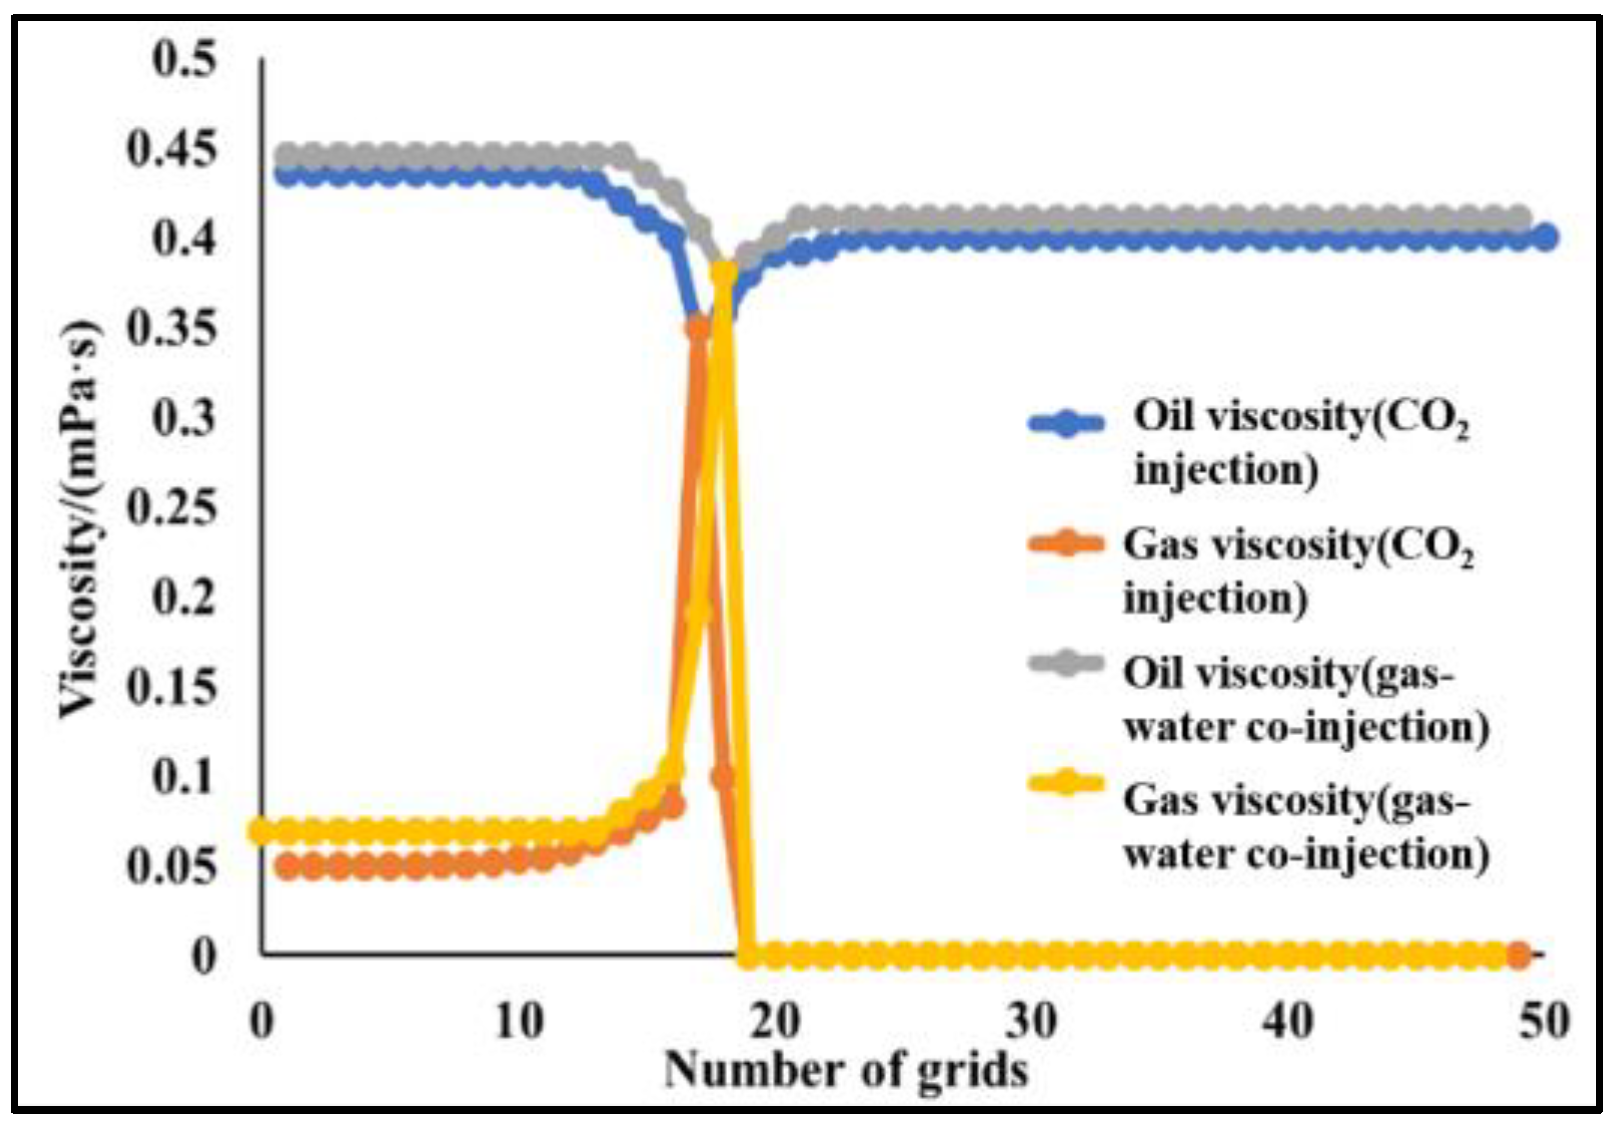
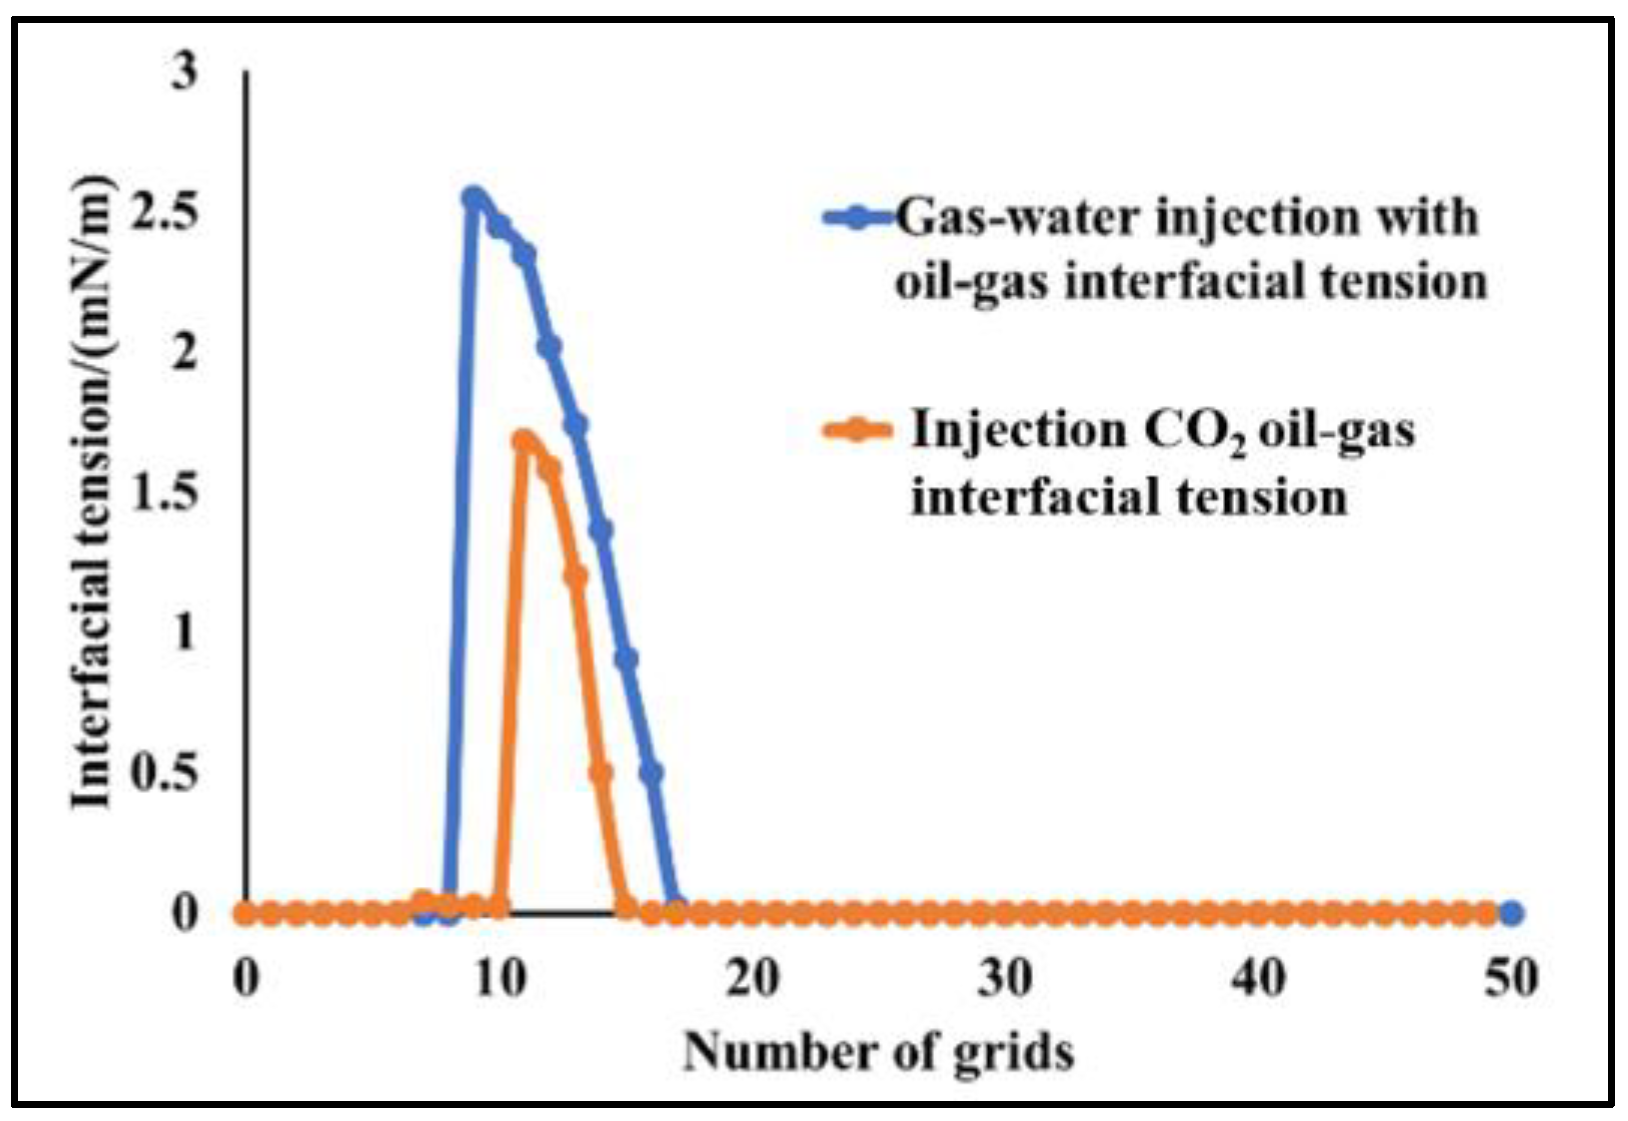
4.2.3. Study on the Miscible Characteristics of Pure CO2 Injection and CO2–Water Co-Injection

Based on the analysis of the degree of recovery, this paper also focuses on the change in CO2 and crude oil physical properties during the simulation of the slim-tube experiment with pure CO2 injection and CO2–water co-injection. The simulation results of CO2 content, C7+ content, density, viscosity, and surface tension in the gas–liquid phase obtained from the slim-tube simulation studies of pure CO2 injection and CO2–water co-injection (CO2 to water injection ratio of 3:1) are shown in Figure 18, Figure 19, Figure 20, Figure 21 and Figure 22. As can be seen in Figure 18, Figure 19, Figure 20, Figure 21 and Figure 22, at the same injection volume (0.3 PV) and pressure of 36 MPa, the CO2 will continuously extract the heavy hydrocarbon components from the crude oil in the sweep range of the injected fluids (pure CO2 injection and CO2–water injection) during the two displacement methods, causing the C7+ content to first decrease and then increase, and when the intersection of oil and gas phases exists, it indicates that the system reaches the miscible-phase state and the oil–gas interface When the intersection of oil and gas phases exists, the system reaches the miscible-phase state and the oil–gas interfacial tension decreases to zero. In the CO2–water co-injection process, the dissolved section of CO2 in oil and gas is relatively short, and the oil–gas density, viscosity, and interfacial tension are higher than those of pure CO2 injection, and the formation of the intersection point between gas and oil phases is later, indicating that part of CO2 is dissolved in water during CO2–water co-injection, resulting in less CO2 in contact with crude oil, leading to higher oil density, viscosity, and interfacial tension than those of pure CO2 injection. However, the CO2–water co-injection increases the sweep area, and the gas breakthrough is later, leading to higher oil displacement efficiency and more obvious development effect.
In order to explore the effect of different gas–liquid injection ratios on crude oil recovery during CO2–water co-injection, a slim-tube simulation study of CO2–water co-injection with different gas–liquid injection ratios (CO2 to water ratio of 3:1 and CO2 to water ratio of 1:1) was conducted at formation temperature (157.5 °C) and 36 MPa (miscible-phase pressure), and the simulation results were compared with pure CO2 injection. The variation of crude oil recovery and gas–oil ratio with pure CO2 injection and different gas–liquid injection ratios (CO2 to water ratio of 3:1 and CO2 to water ratio of 1:1) are shown in Figure 23 and Figure 24. The simulation results show that the crude oil recovery degree of CO2–water co-injection is higher than that of pure CO2 injection. Under the three replacement conditions, the highest degree of crude oil recovery is achieved by CO2–water co-injection with CO2 to water ratio of 1:1, and the lowest by pure CO2 injection. The higher the ratio of water in CO2–water co-injection, the later the gas–oil ratio rises, and the later the CO2 breaks through, the higher the degree of crude oil recovery. This suggests that gas–water co-injection increases the influence of the sweep area and effectively inhibits the occurrence of gas scramble, thus improving the degree of crude oil recovery.

5. Conclusions

(1)
The phase equilibrium experimental and simulation results for CO2-near-critical volatile oil and CO2-near-critical volatile oil-formation water show that with the continuous injection of CO2, the saturation pressure of the system gradually increases, the density increases and the viscosity decreases; when the injected CO2 amount reaches 10 mol%~20 mol%, the phase inversion occurs and the near-critical volatile oil system is transformed into a condensate gas system; as the water saturation increases, the gas–oil ratio, the gas–water ratio and the CO2 content in the degassing decrease.
(2)
The results of the slim-tube experiment show that when the injection pressure is greater than 36 MPa, both pure CO2 injection and CO2–water co-injection reach a miscible-phase state; the recovery rate of crude oil increases with the increase in injection pressure, and after reaching a certain pressure point, the increase of in recovery rate will slow down; the minimum miscible pressure under CO2–water co-injection is higher than that under pure CO2 injection. This is due to the fact that when CO2–water is co-injected, part of the CO2 is dissolved in water, resulting in less CO2 in contact with the crude oil and a higher miscible pressure.
(3)
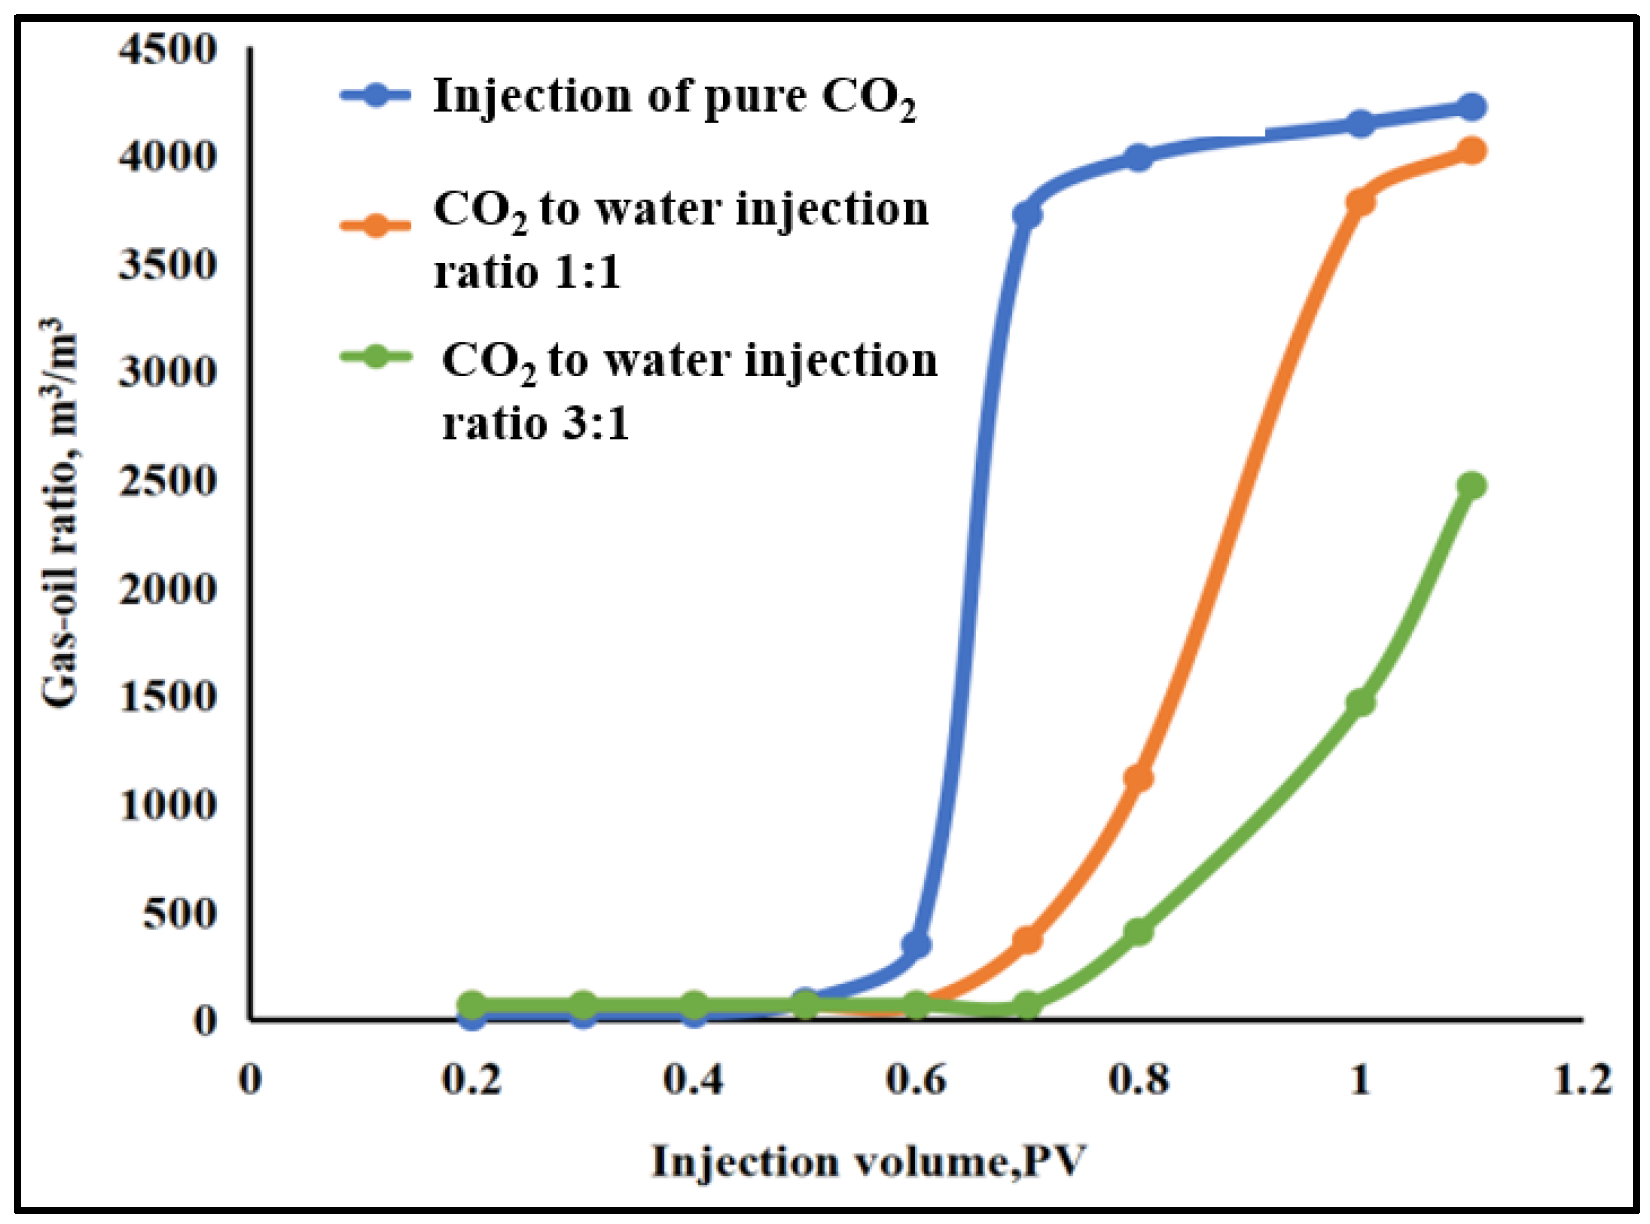
The results of slim-tube simulation show that the degree of crude oil recovery under CO2–water co-injection is higher than that of pure CO2 injection, and the transition period of CO2 dissolution in oil and gas is shorter and the gas breakthrough time is later under CO2–water co-injection, which effectively increases the sweep volume and improves the degree of crude oil recovery. When CO2–water is injected together, the higher the proportion of water, the later the gas–oil ratio rises, the later the CO2 breaks through, and the higher the degree of crude oil recovery. It shows that the gas–water co-injection increases the sweep area and effectively inhibits the occurrence of gas scramble, thus improving the degree of crude oil recovery.

Author Contributions

Conceptualization, methodology, software, validation, resources, D.H.; funding acquisition, project administration, J.L.; formal analysis, data curation, supervision, H.T. and J.G.; investigation, writing—original draft preparation, writing—review and editing, X.X. All authors have read and agreed to the published version of the manuscript.

Funding

This research was funded by the Postdoctoral Foundation grant number 2017M612995, Applied Basic Research Project of Sichuan Provincial Science and Technology Department grant number 2021YJ0352, State Key Laboratory of Oil and Gas Reservoir Geology and Development Engineering Free Exploration Project grant number CZ201910 and Chengdu University of Technology 2020 Support Program for Young and Middle-aged Backbone Teachers.

Institutional Review Board Statement

Not applicable.

Informed Consent Statement

Not applicable.

Data Availability Statement

The datasets supporting the conclusions of this article are private and came from the Chengdu University of Technology, Chengdu, China.

Conflicts of Interest

The authors declare no conflict of interest.

Nomenclature

𝑉molar volume (dm3 mol1)
𝑏covolume parameter (dm3 mol1)
𝑎attraction parameter (kPa dm3 mol−2)
𝑅universal gas constant (kPa dm3 mol1 K1)
𝑃pressure (MPa)
𝑇absolute temperature (K)
𝑇𝑐𝑖critical temperature of component 𝑖 (K)
𝑇𝑟𝑖reduced temperature of component 𝑖
𝜔𝑖acentric factor of component 𝑖
𝑃𝑐𝑖critical pressure of component 𝑖 (MPa)
𝑥𝑖mole fraction of component 𝑖
𝑥𝑗mole fraction of component 𝑗
𝑘𝑖𝑗binary interaction parameter for 𝑖-𝑗 contacts

References

  1. Lv, C.; Lun, Z.; Wang, J.; Zhao, S.; Wang, X.; Xu, X. Dynamic miscible characteristics of CO2 drive in volatile reservoirs. Oil Gas Geol. Recovery 2020, 27, 92. [Google Scholar]
  2. Lu, K.; Su, C.; Cheng, C. An improved method for predicting crude oil recovery from volatile reservoirs. Pet. Explor. Dev. 2021, 48, 95–1003. [Google Scholar] [CrossRef]
  3. Zhang, Z.; Ma, L.; Ouyang, C.; Wang, Z.; Zhu, H. Optimization of alternating gas-water drive parameters in low-permeability reservoirs. Contemp. Chem. Ind. 2018, 47, 1380–1386. [Google Scholar]
  4. Li, L. Dynamic production performance in a natural depletion and evaluation on remaining production potential of Hua 3 near-critical volatile reservoir. Petrochem. Ind. Appl. 2015, 34, 4–10. [Google Scholar]
  5. Chen, M.; Ren, L.; Li, M.; Yue, Y. Study on seepage law of Chang 7 ultra-low permeability reservoir in Ordos Basin. Fault-Block Oil Gas Field 2013, 20, 191–195. [Google Scholar]
  6. Reza, B.; Mohsen, M. A novel correlation for modeling interfacial tension in binary mixtures of CH4, CO2 and N2+normal alkanes systems: Application to gas injection EOR process. Fuel 2022, 325, 124622. [Google Scholar]
  7. Li, H.; Li, X.; Zhao, L.; Li, J. Characterization of dew point pressure change during gas injection in condensate reservoirs. J. Shanxi Univ. Sci. Technol. Nat. Sci. Ed. 2009, 27, 12–16. [Google Scholar]
  8. Zhou, X.; Wang, Y.; Zhang, L.; Zhang, K.; Jiang, Q.; Pu, H.; Wang, L.; Yuane, Q. Evaluation of enhanced oil recovery potential using gas/water flooding in a tight oil reservoir. Fuel 2020, 272, 117706. [Google Scholar] [CrossRef]
  9. Ma, Y.; Zhao, F.; Hou, J.; Duan, X.; Li, S. Physical simulation of enhancing oil recovery by simultaneous water and gas injection flooding. Pet. Geol. Recovery Effic. 2015, 22, 89–98. [Google Scholar]
  10. Qu, X.; Lei, Q.; Gao, W.; Zhang, L.; He, Y.; Wang, B. Experimental study on imbibition of Chang7 tight oil cores in Erdos Basin. J. China Univ. Pet. 2018, 42, 102–109. [Google Scholar]
  11. Wang, J.; Yang, S.; Cao, Y.; Wang, M.; Xu, Y. Influencing Factors of Water Injection Huff and Puff of Tight Oil and Establishment of Mathematical Model. J. Petrochem. Univ. 2020, 33, 26–31. [Google Scholar]
  12. Fan, J.; Wang, C.; Qu, X.; Cheng, L.; Xue, T. Development and practice of water flooding huff-puff in tight oil horizontal well, Ordos Basin: A case study of Yanchang Formation Chang 7 oil layer. Acta Pet. Sin. 2019, 40, 706–715. [Google Scholar]
  13. Ghaderi, S.M.; Clarkson, C.R.; Ghanizadeh, A.; Barry, K.; Fiorentino, R. Improved oil recovery in tight oil formations: Result of water injection operations and gas injection sensitivities in the Bakken formation of southeast Saskatchewan. In Proceedings of the SPE Unconventional Resources Conference, Calgary, AB, Canada, 15–16 February 2017. SPE185030-MS. [Google Scholar]
  14. Chen, M.; Dai, J.; Liu, X.; Qin, M.; Pei, Y.; Wang, Z. Differences in the Fluid Characteristics between Spontaneous Imbibition and Drainage in Tight Sandstone Cores from Nuclear Magnetic Resonance. Energy Fuels 2018, 32, 10333–10343. [Google Scholar] [CrossRef]
  15. Wang, X.; Peng, X.; Zhang, S.; Du, Z.; Zeng, F. Characteristics of oil distributions in forced and spontaneous imbibition of tight oil reservoir. Fuel 2018, 224, 280–288. [Google Scholar] [CrossRef]
  16. Cheng, Z.; Ning, Z.; Yu, X.; Wang, Q.; Zhang, W. New insights into spontaneous imbibition in tight oil sandstones with NMR. J. Pet. Sci. Eng. 2019, 179, 455–464. [Google Scholar] [CrossRef]
  17. Wang, J.; Liu, H.; Qian, G.; Peng, Y.; Gao, Y. Investigations on spontaneous imbibition and the influencing factors in tight oil reservoirs. Fuel 2019, 236, 755–768. [Google Scholar]
  18. Yang, Z.; Liu, X.; Li, H.; Lei, Q.; Luo, Y.; Wang, X. Analysis on the influencing factors of imbibition and the effect evaluation of imbibition in tight reservoirs. Pet. Explor. Dev. 2019, 46, 779–785. [Google Scholar] [CrossRef]
  19. Zou, J.; Liao, X.; Chen, Z.; Zhao, X.; Mu, L.; Chu, H.; Dong, P.; Guan, C. Integrated PVT and Coreflooding Studies of Carbonated Water Injection in Tight Oil Reservoirs: A Case Study. Energy Fuels 2019, 33, 8852–8863. [Google Scholar] [CrossRef]
  20. Lijun, L.Y.L.; Leung, J.Y.; Wu, K.; Moridis, G. Coupled flow/geomechanics modeling of interfracture water injection to enhance oil recovery in tight reservoirs. SPE J. 2021, 26, 1–21. [Google Scholar]
  21. Liang, Y.; Lai, F.; Dai, Y.; Shi, H.; Shi, G. An experimental study of imbibition process and fluid distribution in tight oil reservoir under different pressures and temperatures. Capillarity 2021, 4, 66–75. [Google Scholar] [CrossRef]
  22. Chen, T.; Yang, Z.; Wang, X.; Xiao, P.; Wang, X. Study on micro displacement mechanism with gas flooding in tight oil reservoir. China Sci. 2017, 12, 1038–1043. [Google Scholar]
  23. Dai, Y.; Guo, H.; Li, H.; Yang, Z.; Meng, L.; Zhang, Y.; Zeng, Q.; Meng, H. NMR experiment study of gas flooding of tight oil reservoir. China Sci. 2020, 15, 105–111. [Google Scholar]
  24. Wei, B.; Shang, J.; Pu, W.; Valeriy, K.; Zhao, J. Predicting the diffusive front of supercritical CO2 in tight oil reservoirs. J. Southwest Pet. Univ. Sci. Technol. Ed. 2020, 42, 94–102. [Google Scholar]
  25. Ren, B.; Zhang, L.; Huang, H.; Ren, S.; Chen, G.; Zhang, H. Performance evaluation and mechanisms study of near-miscible CO2 flooding in a tight oil reservoir of Jilin Oilfield China. J. Nat. Gas Sci. Eng. 2015, 27, 1796–1805. [Google Scholar] [CrossRef]
  26. Yang, D.; Song, C.; Zhang, J.; Zhang, G.; Ji, Y.; Gao, J. Performance evaluation of injectivity for water-alternating-CO2 processes in tight oil formations. Fuel 2015, 139, 292–300. [Google Scholar] [CrossRef]
  27. Yu, W.; Lashgari, H.R.; Wua, K.; Sepehrnoori, K. CO2 injection for enhanced oil recovery in Bakken tight oil reservoirs. Fuel 2015, 159, 354–363. [Google Scholar] [CrossRef]
  28. Zhang, Y.; Yu, W.; Li, Z.; Sepehrnoori, K. Simulation study of factors affecting CO2 Huff-n-Puff process in tight oil reservoirs. J. Pet. Sci. Eng. 2018, 163, 264–269. [Google Scholar] [CrossRef]
  29. Song, Z.; Song, Y.; Li, Y.; Baic, B.; Song, K.; Hou, J. A critical review of CO2 enhanced oil recovery in tight oil reservoirs of North America and China. Fuel 2020, 276, 1–12. [Google Scholar] [CrossRef]
  30. Yu, H.; Fu, W.; Zhang, Y.; Lu, X.; Cheng, S.; Xie, Q.; Qu, X.; Yang, W.; Lu, J. Experimental study on EOR performance of CO2-based flooding methods on tight oil. Fuel 2021, 290, 119988. [Google Scholar] [CrossRef]
  31. Quale, E.A.; Lv, W.; Han, R. Optimization of process of CO2-water co-injection. Foreign Oilfield Eng. 2001, 8, 13–14. [Google Scholar]
  32. Pisharody, N.; Hussain, F. Techno-Economic Analysis of Co-Injection of CO2 and Water into Formations with Open Boundary. In Proceedings of the 14th Greenhouse Gas Control Technologies Conference (GHGT-14), Melbourne, VIC, Australia, 21–26 October 2018. [Google Scholar]
  33. Ajoma, E.; Kamali, F.; Ge, J.; Hussain, F. Effect of CO2-Water Injection Ratio on the Co-Optimization of Oil Recovery and CO2 Storage in a Swag Displacement Process. In Proceedings of the 14th Greenhouse Gas Control Technologies Conference (GHGT-14), Melbourne, VIC, Australia, 21–26 October 2018. [Google Scholar]
  34. GB/T 26981-2020; Method for Fluid Physical Properties Analysis of Oil and Gas Reservoirs. Standardization Administration of China: Beijing, China, 2020.
  35. SY/T 6573 2016; Minimum Miscible Pressure Experiment Determination Method-Slim Tube Method. China Petroleum Industry Standard; Petroleum Industry Press: Beijing, China, 2016.
  36. Peng, D.-Y.; Robinson, D.B. A new two-constant equation of state. Ind. Eng. Chem. Fundam. 1976, 15, 59–64. [Google Scholar] [CrossRef]
Figure 1. PVT experimental device.
Energies 15 07131 g001
Figure 2. Slim-tube experimental device.
Energies 15 07131 g002
Figure 3. Flow chart of PVT behavior phase experiment flow: 1. High-pressure displacement pump, 2. PVT cell, 3. Constant temperature air bath, 4. Valve, 5. Gas–liquid Separation bottle, 6. Gas indicator bottle, 7. Gasometer.
Energies 15 07131 g003
Figure 4. Flow chart of slim-tube experiment: 1. Intermediate container for CO2, 2. Intermediate container for water, 3. Intermediate container for oil, 4. Valve, 5. Slim tube, 6. Constant temperature air bath, 7. Back pressure valve, 8. Gas–liquid separator, 9. Gasometer, 10. Intermediate container for N2, 11. High-pressure displacement pump.
Energies 15 07131 g004
Figure 5. Numerical simulation diagram of slim-tube.
Energies 15 07131 g005
Figure 6. PV relationship at different temperatures.
Energies 15 07131 g006
Figure 7. P-T phase diagram of formation fluid.
Energies 15 07131 g007
Figure 8. Relative volume versus pressure at different CO2 injection molar quantity.
Energies 15 07131 g008
Figure 9. Relationship between saturation pressure and CO2 injection molar quantity.
Energies 15 07131 g009
Figure 10. Variation of crude oil viscosity and crude oil density under different CO2 injection molar quantity: (a) oil viscosity and (b) oil density.
Energies 15 07131 g010
Figure 11. P-T of the system with different CO2 injection molar quantity.
Energies 15 07131 g011
Figure 12. P-X phase diagram of the original formation fluid.
Energies 15 07131 g012
Figure 13. Pseudo-ternary phase diagram of the original formation fluid.
Energies 15 07131 g013
Figure 14. The relationship between saturation pressure and CO2 injection molar quantity at different water content.
Energies 15 07131 g014
Figure 15. Relationship between gas–oil ratio and CO2 injection molar quantity under different water content.
Energies 15 07131 g015
Figure 16. The relationship between the molar content of CO2 in flash gas of crude oil and CO2 injection molar quantity at different water contents.
Energies 15 07131 g016
Figure 17. I The relationship between injection pressure and crude oil recovery: (a) pure CO2 injection and (b) CO2–water co-injection.
Energies 15 07131 g017
Figure 18. Molar fraction of CO2 in oil and gas.
Energies 15 07131 g018
Figure 19. Molar fraction of C7+ in oil and gas.
Energies 15 07131 g019
Figure 20. Variation of oil and gas density.
Energies 15 07131 g020
Figure 21. Variation of oil and gas viscosity.
Energies 15 07131 g021
Figure 22. The diagram of oil–gas interfacial tension.
Energies 15 07131 g022
Figure 23. Recovery rate at different injection ratios.
Energies 15 07131 g023
Figure 24. Gas–oil ratio at different injection ratios.
Energies 15 07131 g024
Table 1. Well stream composition for X well.
CompositionMolar Percentage Content, mol%
CO24.69
N20.74
C163.61
C211.01
C34.98
iC40.76
nC41.52
iC 50.45
nC50.43
C60.46
C70.45
C81.01
C90.99
C101.02
C11+7.88
Note: The relative density of C11+ is 0.8743, the relative molecular mass is 247.02 g/mol.
Table 2. The parameters of slim-tube.
Length, mDiameter, mPorosity, %Pore Volume, cm3Permeability, mD
200.00449.4328.6639.7
Table 3. Pseudo-component division of well stream composition for X well.
Pseudo-ComponentMolar Percentage Content, mol%
CO24.69
N20.74
C163.607
C2~C619.612
C7~C103.47
C11~C153.938
C16~C273.194
C28+0.748
Table 4. Binary interaction parameters (𝐾𝑖𝑗) and mixing rules for the PREOS in this study.
Pseudo-ComponentCO2N2C1C2~C6C7~C10C11~C15C16~C24C28+
CO200.02000.10300.13150.15000.15000.15000.1500
N20.020000.03100.06480.12000.12000.12000.1200
C10.10300.031000.00270.02530.03140.04260.0561
C2~C60.13150.06480.002700.01170.01600.02450.0352
C7~C100.15000.12000.02530.011700.00750.01360.0219
C11~C150.15000.12000.03140.01600.007500.00690.0133
C16~C270.15000.12000.04260.02450.01360.006900.001
C28+0.15000.12000.05610.03520.02190.01330.0010
Table 5. Corrected critical temperature, critical pressure, and acentric factor.
CompositionCritical Temperature Tc, °CCritical Pressure Pc, MPa Acentric   Factor ,   ω
C11~C15416.722.130.487
C16~C27527.641.580.717
C28+684.511.081.086
Table 6. Comparison of two-phase flash experimental data and simulation data.
Physical Property ParameterExperimental ValueSimulated ValueRelative Error, %
Gas–oil ratio, m3/m37127130.14
Density of formation crude oil, g/cm3 0.4390.440.23
Degassed crude oil density (20 °C, 0.1 MPa), g/cm30.80060.80220.20
Molecular weight of degassed crude oil, g/mol207.18207.80.30
Bubble point pressure, MPa35.7235.680.11
Table 7. Comparison of experimental and simulation results of bubble/dew point pressure at different temperatures.
Temperature, °CMeasured Value, MPaCalculated Value, MPaRelative Error, %
197.50 d35.5035.420.213
187.50 d35.8535.610.673
177.50 b35.6235.720.280
157.50 b35.7235.680.112
137.50 b35.0935.130.113
117.50 b33.9934.250.785
100.00 b33.5533.151.213
80.00 b31.8531.481.174
60.00 b28.9029.361.596
35.00 b26.8826.082.955
Note: superscript b denotes bubble point, superscript d denotes dew point.
Table 8. The recovery of crude oil at different injection pressures.
Pressure, MPa24273033363942
Recovery of pure CO2 injection, %79.8583.9287.8889.6292.0593.4594.24
Recovery of CO2–water co-injection, % 82.3186.0189.5592.7693.8594.46
Table 9. Crude oil recovery at different pressures.
Pressure, MPa24273033363942
Recovery of CO2 injection, %79.5883.4387.5589.5592.5593.8794.75
Recovery of CO2–water co-injection, %
(CO2 to water injection ratio of 3:1)
83.5487.6389.892.7493.9294.68
Recovery of CO2–water co-injection, %
(CO2 to water injection ratio of 1:1)
83.7987.9889.9593.0594.0894.85
Table 10. Minimum Miscible Pressure under different injection methods (CO2 to water injection ratio of 3:1).
Minimum Miscible PressureSimulated Value, MPaExperimental Value, MPaRelative Error, %
CO2 injection34.834.00.88
CO2–water co-injection35.435.60.84
Publisher’s Note: MDPI stays neutral with regard to jurisdictional claims in published maps and institutional affiliations.

