Abstract
The seismic sensors used for automatic seismic trip systems (ASTS) of nuclear power plants (NPPs) are mainly arranged on the raft foundation of reactor buildings; however, the arrangement principle of seismic sensors is not clear. In order to analyze the seismic response sensitivity of the raft foundation of reactor building in NPPs, this paper carried out the seismic response sensitivity research at seven positions on the raft foundation of a reactor building under three site conditions, with two sets of time histories as input. The results show that (1) the peak acceleration of the outer ring point of the raft foundation was the largest, and the peak acceleration of the center point was the smallest; (2) the peak value of the floor response spectrum at the outer ring point of the raft foundation was the largest, and the peak value at the center point was the smallest. In an earthquake, the outer ring point of the raft foundation of the reactor building was the most sensitive. It was suggested that the seismic sensors used for ASTS should be arranged at the outer ring of the raft foundation NPP reactor building, and the shutdown threshold shall be calculated according to site conditions and structural characteristics.
1. Introduction
According to the Seismic Design and Evaluation of NPPs (HAD102/02) [1], the maximum threshold and trigger level of reactor shutdown shall be determined by reference to SL-2 for the automatic seismic trip systems (ASTS). At present, the seismic instruments used for the ASTS are mainly arranged on the raft foundation of the reactor building. For nuclear safety guidelines or national standards [1,2,3,4,5,6], the arrangement principle is not clear. The third-generation NPPs are equipped with automatic seismic trip systems in China [7]. The seismic sensors used for ASTS are uniformly distributed on the raft foundation reactor building. Some are arranged according to the fire compartment, and some are arranged according to the place with the lowest radiation dose. In addition, seismic sensor layout and shutdown threshold for ASTS do not consider the impact of site conditions.
The finite element analysis method has been considered as one of the most effective approaches for simulating seismic behaviors of civil infrastructures and nuclear structures [8]. The influence of soil structure interaction (SSI) should be considered in the seismic response analysis of nuclear power plant structure [9,10,11].
Halbritter et al. [12] compared and analyzed two methods of soil structure interaction based on the Russian VVER-440 and VVER-1000 pile types, and the results showed that the soil structure interaction can be more truly represented by using the soil structure interaction model. Elaid and Eissa [13] proposed a three-dimensional seismic soil structure interaction analysis method for NPP structures. Leonardo et al. [14] analyzed the soil structure interaction of AP1000 on six typical sites and compared the floor response spectra. Mansour Tabataie et al. [15] established a three-dimensional finite element model and a lumped mass rod model of the EPR and made a comparative analysis using the SASSI program. They believed that the rod model could basically represent the seismic response, but the vertical response was relatively conservative.
In order to determine the layout principle and the shutdown threshold of ASTS, this paper intends to carry out sensitivity analysis of the seismic response of the raft foundation of the reactor building under different site conditions.
2. Numerical Analysis Method and Models
2.1. Finite Element Model
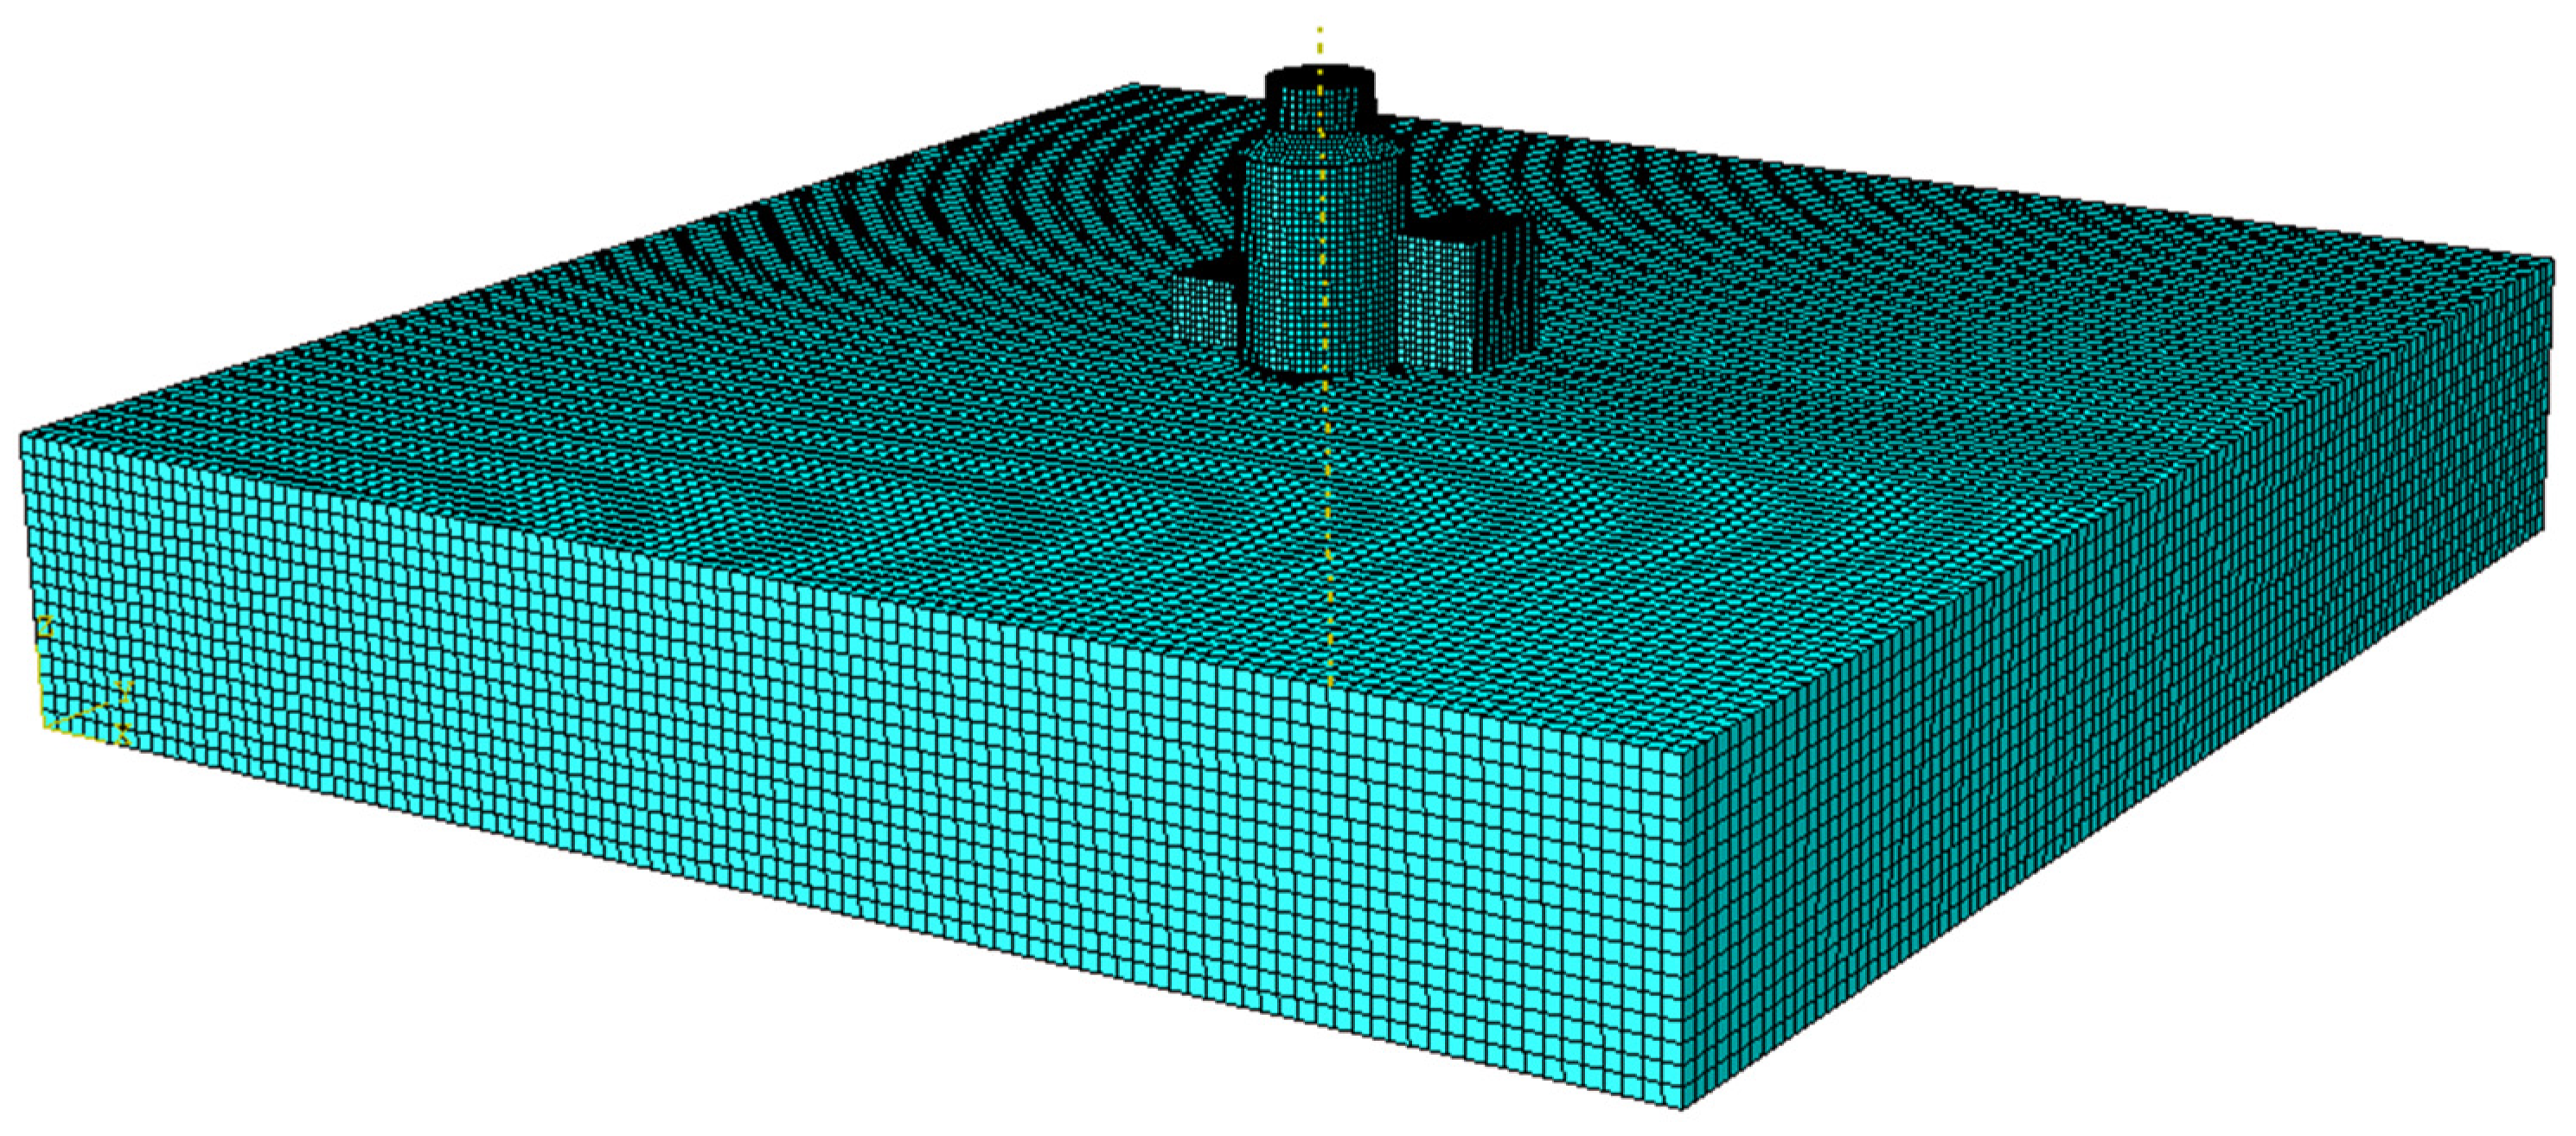
Referring to the relevant drawings of the NPP, the finite element model of soil structure interaction was established using the finite element software ABAQUS. The soil structure system, including the raft foundation and the NPP structure, is shown in Figure 1. NEWMARK implicit integration was used for the calculation. The finite element model of NPP structure included nuclear auxiliary building and shielding building. The influences of the steel containment, equipment holes, and air inlets on the shield building, as well as the annular water tank, were not considered; solid and shell elements were used for modeling. There were 182,031 elements and 216,807 nodes in the finite element model of the raft foundation and NPP structure.
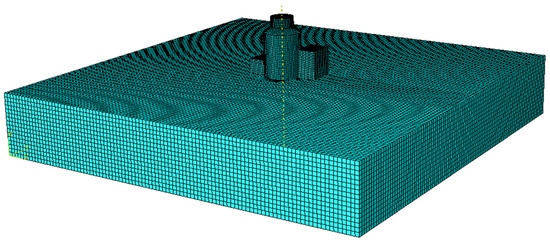
Figure 1.
Finite element model of raft foundation and NPP structure.
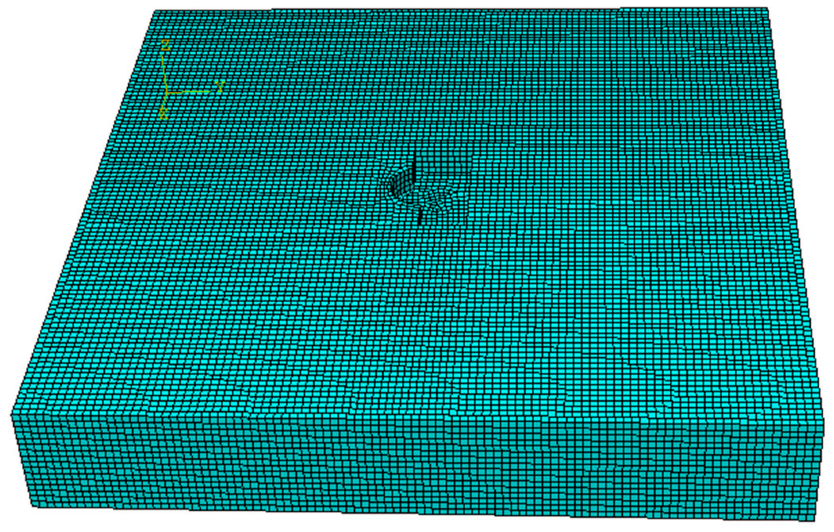
The finite element model of the raft foundation is shown in Figure 2, all of which were solid elements. The size of the raft foundation was 500 × 500 × 80 m, with a total of 155,992 units and 184,214 nodes. The first four modes calculated are shown in Figure 3.
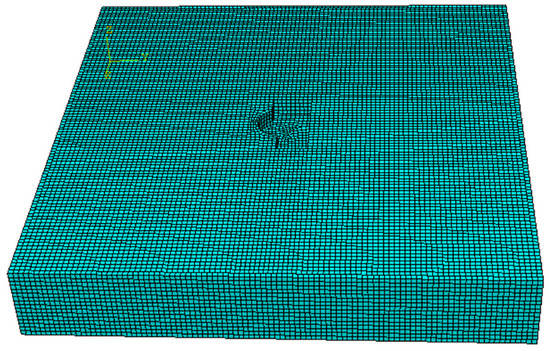
Figure 2.
Finite element model of the raft foundation.
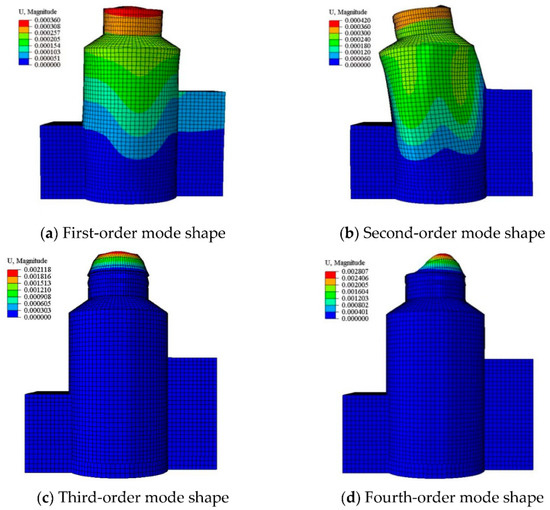
Figure 3.
First four modes of the NPP structure.
2.2. Site Conditions
As for site conditions, three site conditions were selected in this paper, namely, bedrock site, firm rock site (shear wave velocity is divided into 2500 m/s, 1146 m/s), and actual layered site, provided by the Site Safety Analysis Report of Guangdong NPP Phase I Project; the three sites were marked as site I, site II, and site III, as shown in Table 1 below.

Table 1.
Sites geotechnical parameters.
As for damping, Rayleigh damping was selected to simulate the energy dissipation caused by materials [16,17] in the calculation and analysis, and the calculation formula was as follows:
where M is the mass matrix, K is the stiffness matrix, is the mass coefficient, and is the stiffness coefficient.
and were, respectively, determined by the following formulas:
where and are the damping ratio of the i and j modes, respectively, and and are the circular frequency of the i and j modes, respectively.
2.3. Ground Motion Input
The combination of seismic site response and viscoelastic boundary realized the input mode of ground motion fluctuation that converts the site seismic response into equivalent load on the truncated boundary [18,19].
In this paper, the actual earthquake ground motion provided in the Site Safety Analysis Report of Guangdong NPP Phase I Project was selected. Its input location was at the bedrock, and time histories are shown in Figure 4.
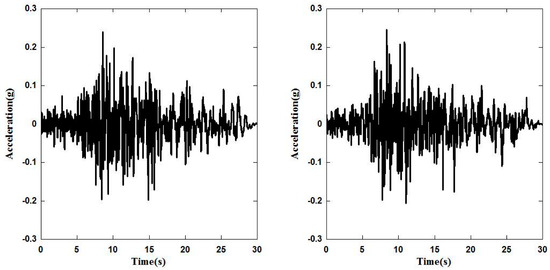
Figure 4.
Time history of Guangdong NPP site.
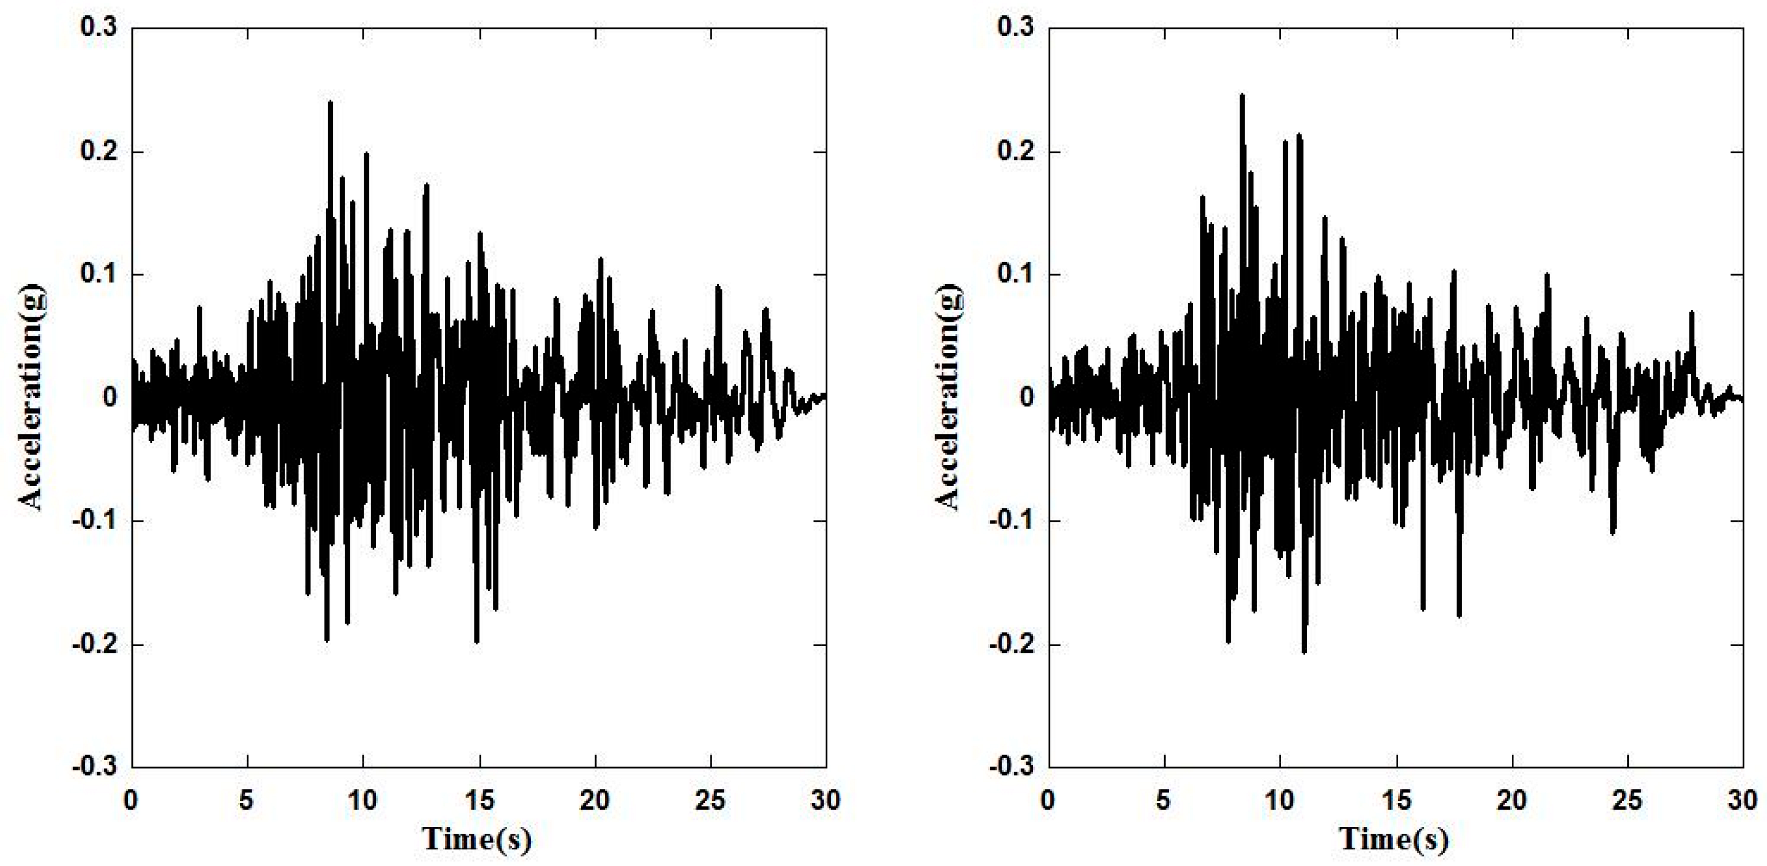
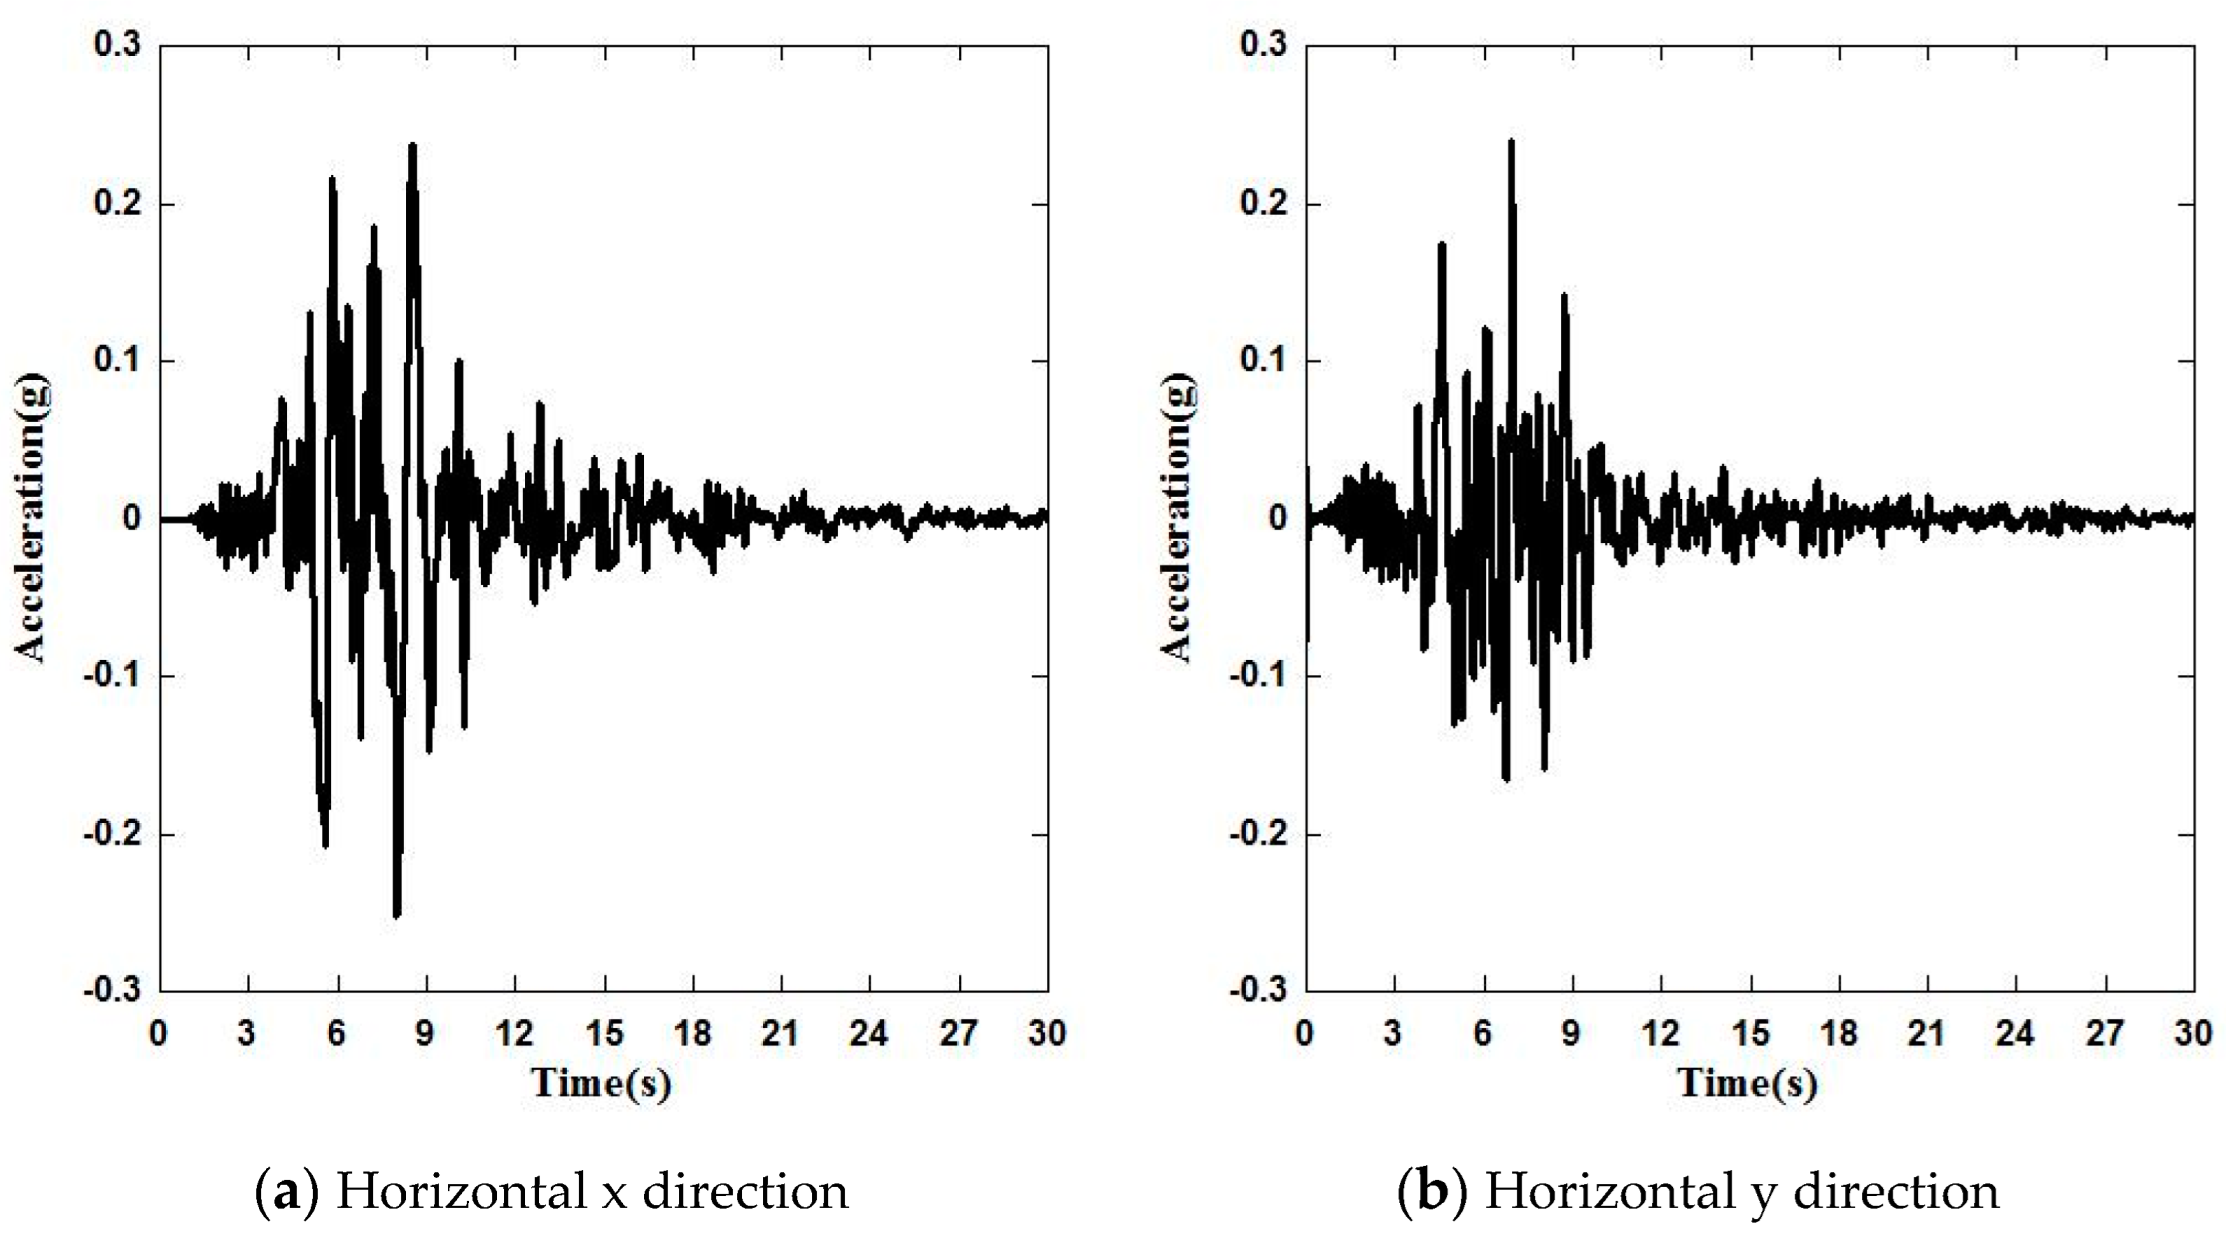
Considering the uncertainty of the time history, the Kobe earthquake record was selected, whose input location was also the bedrock. The time histories are shown in Figure 5, with a total duration of 30 s. The ground motion of the Kobe earthquake in Japan was selected mainly because of the difference between its frequency spectrum characteristics and the ground motion of the Guangdong NPP site. Figure 6 is the comparison of four ground response spectra.
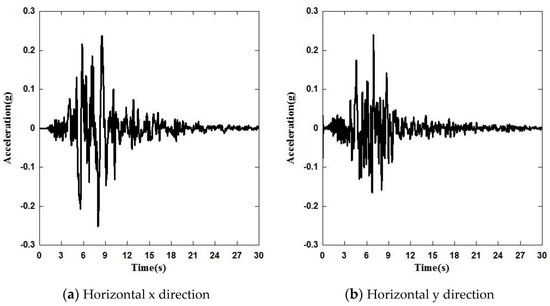
Figure 5.
Time history of the Kobe earthquake.
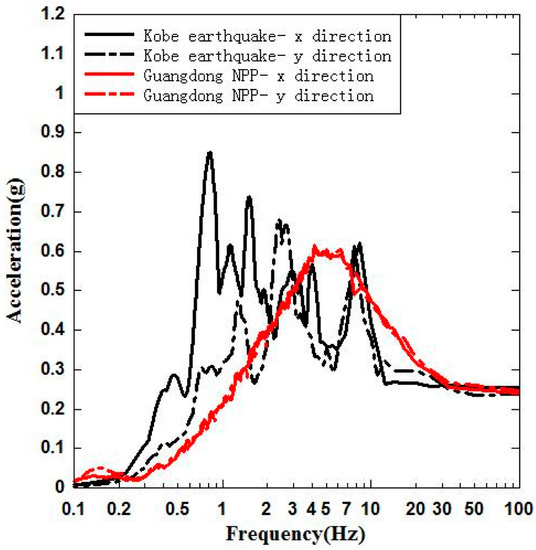
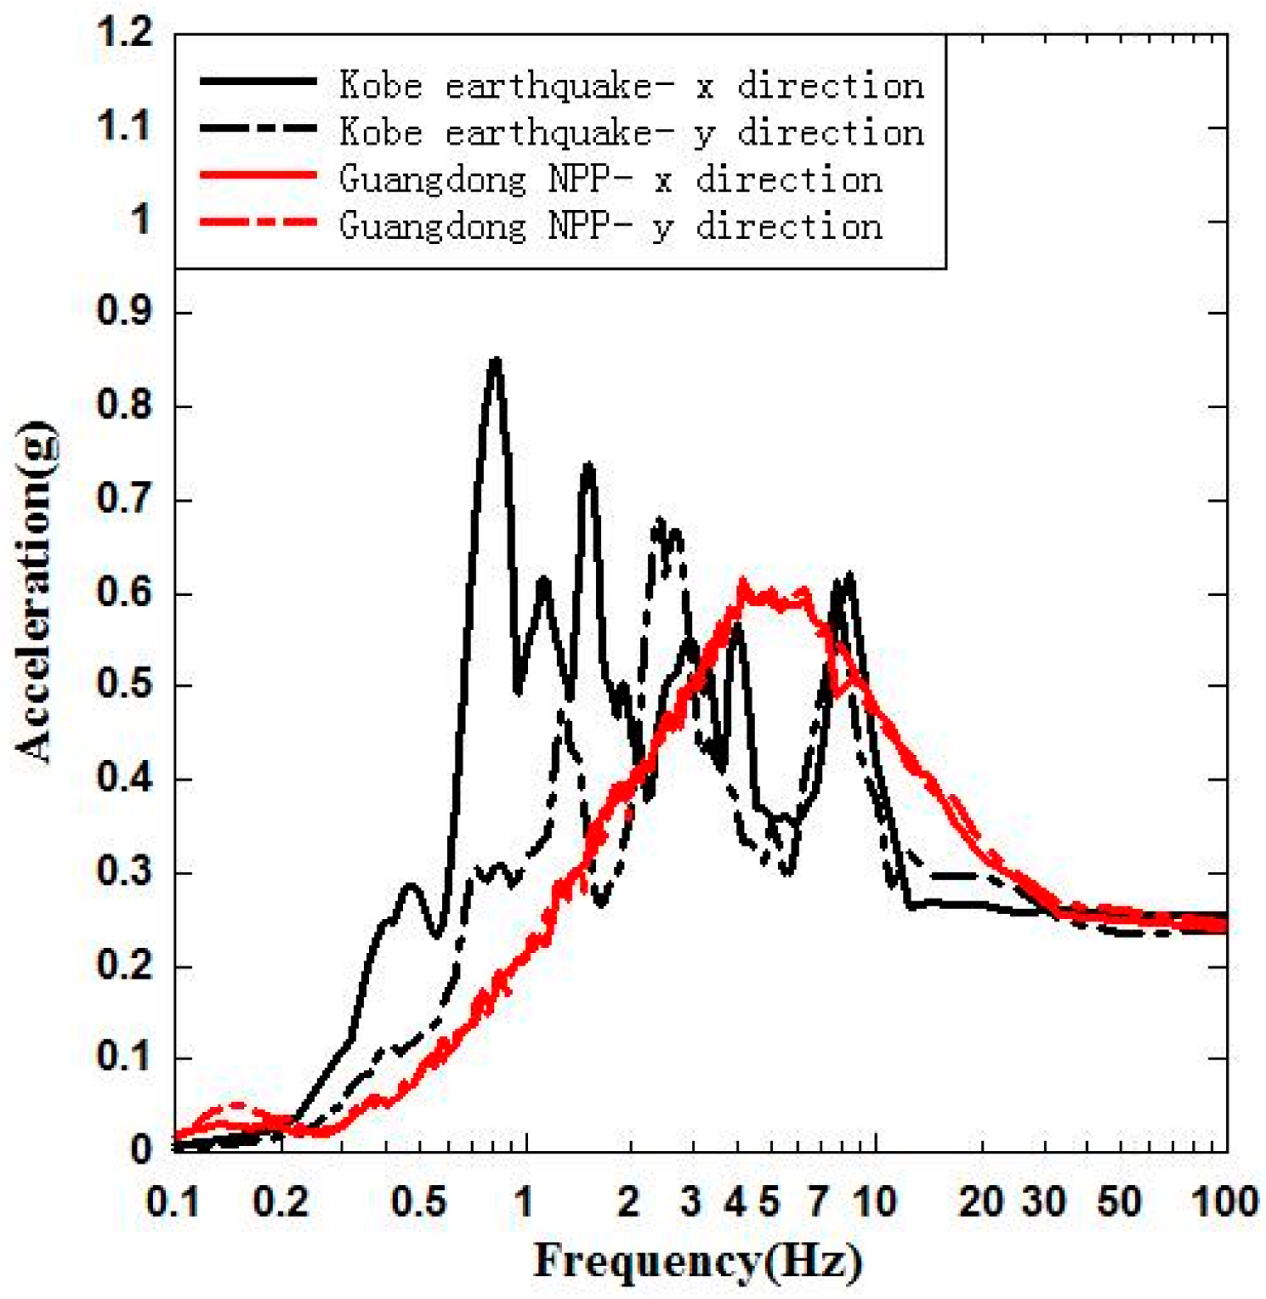
Figure 6.
Comparison of the ground response spectra of the Kobe earthquake and the Guangdong NPP site.
From Figure 6, it can be seen that there was a certain difference in the predominant period of the acceleration response spectra recorded between the ground motions of the Guangdong NPP site and the Kobe earthquake. The ground motions of the Kobe earthquake were with abundant seismic records mainly at low frequencies. Therefore, two sets of time histories selected in this paper were representative. At the same time, in order to make the analyzed data comparable, the time histories of the Kobe earthquake were also amplitude modulated according to the peak value time histories of the Guangdong NPP site.
3. Layout Principle
In order to carry out sensitivity analysis of seismic response of the raft foundation reactor building, seven representative positions were selected. The outer ring of the raft foundation, a point at an interval of 120 degrees; the inner ring of raft foundation, a point at an interval of 120 degrees; and the center point of the raft foundation are shown in Figure 7 below.
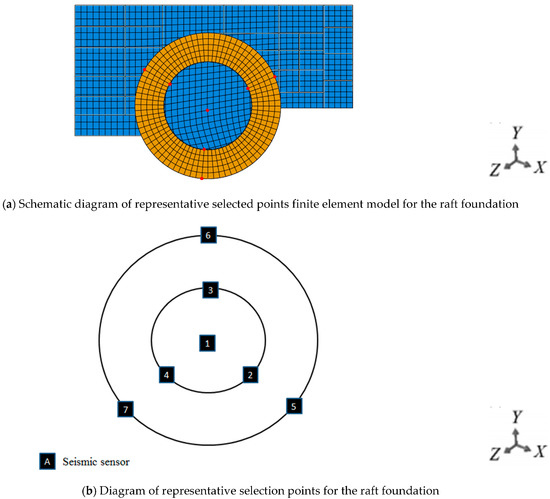
Figure 7.
Schematic diagram of representative point selection of the raft foundation.
The mesh density of the soil structure interaction finite element model in this section was selected according to the formula recommended in the Code for Seismic Design of Nuclear Power Plants (GB 50267-2019) [2],
where is the shear wave velocity of foundation soil; is the highest frequency of seismic vibration; and is a coefficient between .
4. Analysis of Different Sites
4.1. Seismic Response Analysis of the Raft Foundation in the Bedrock Site
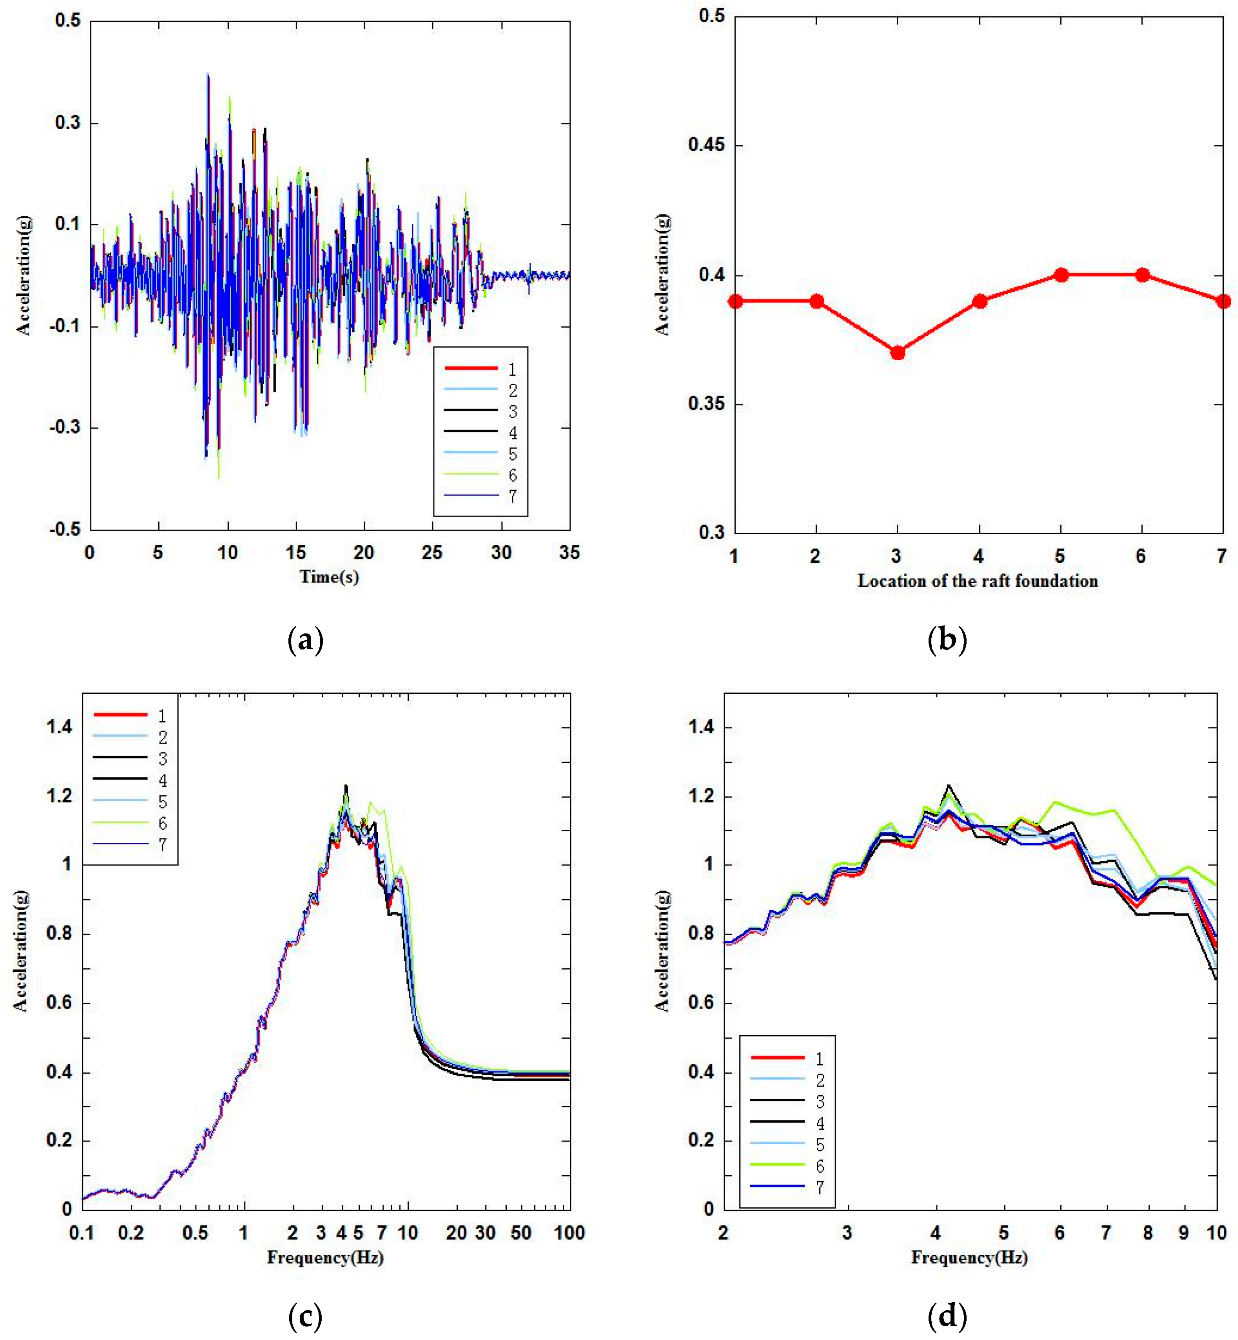
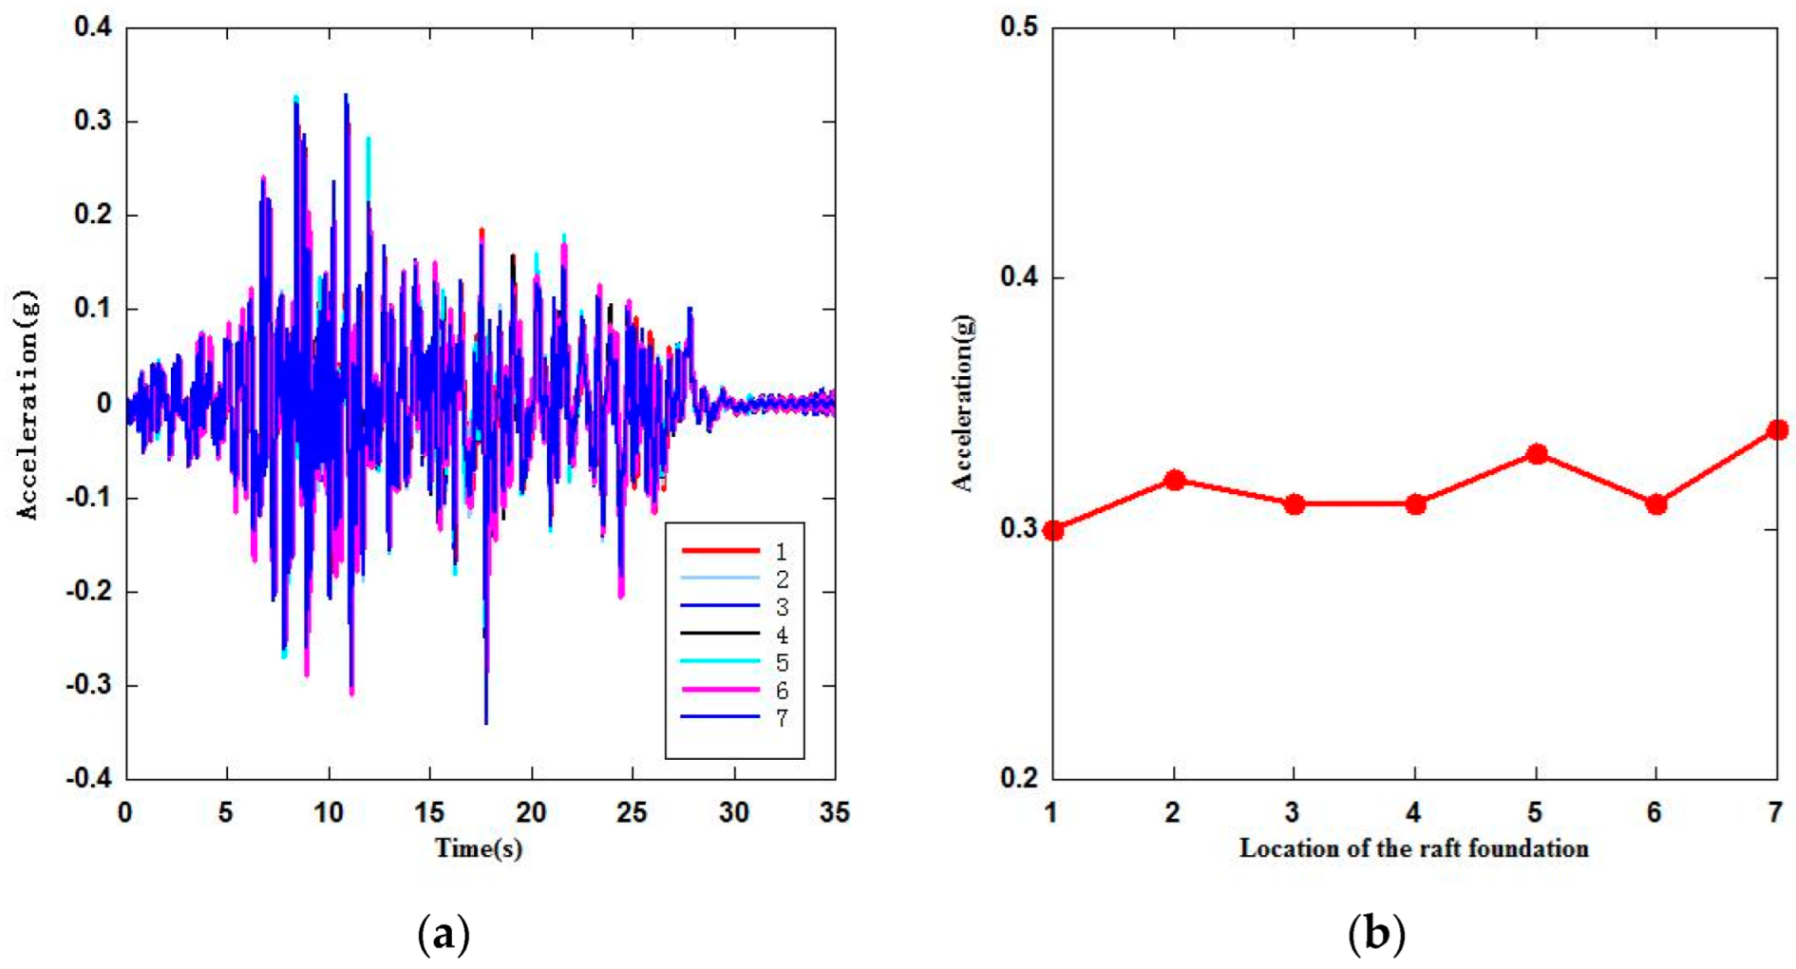
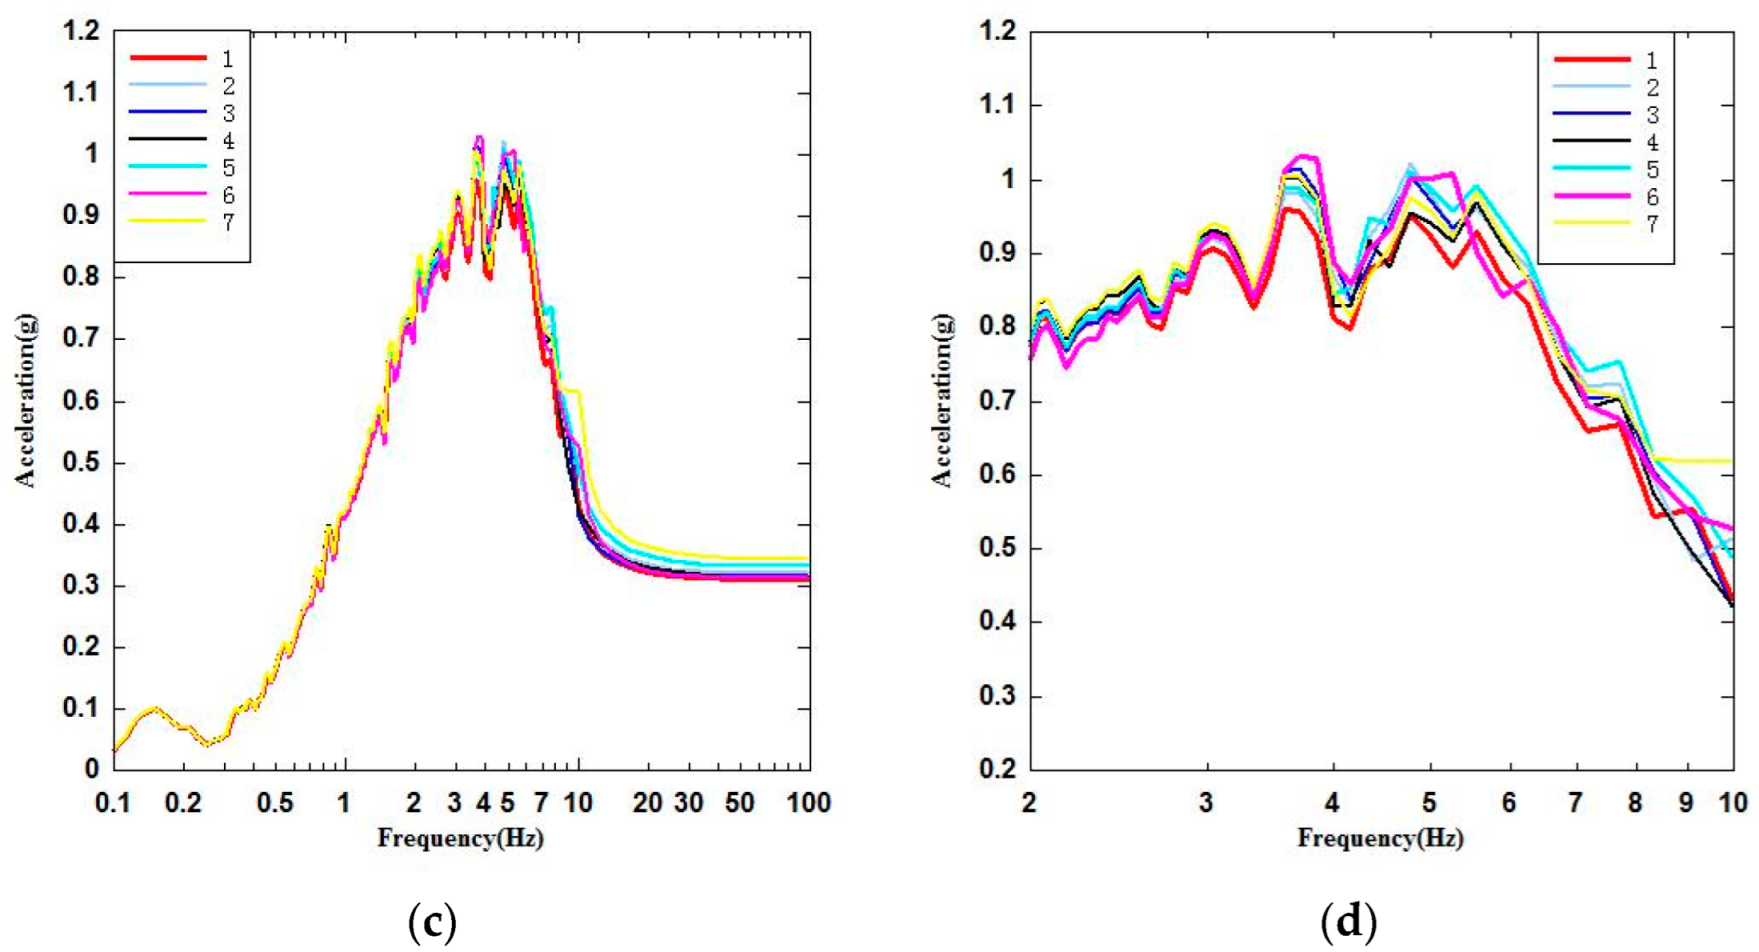
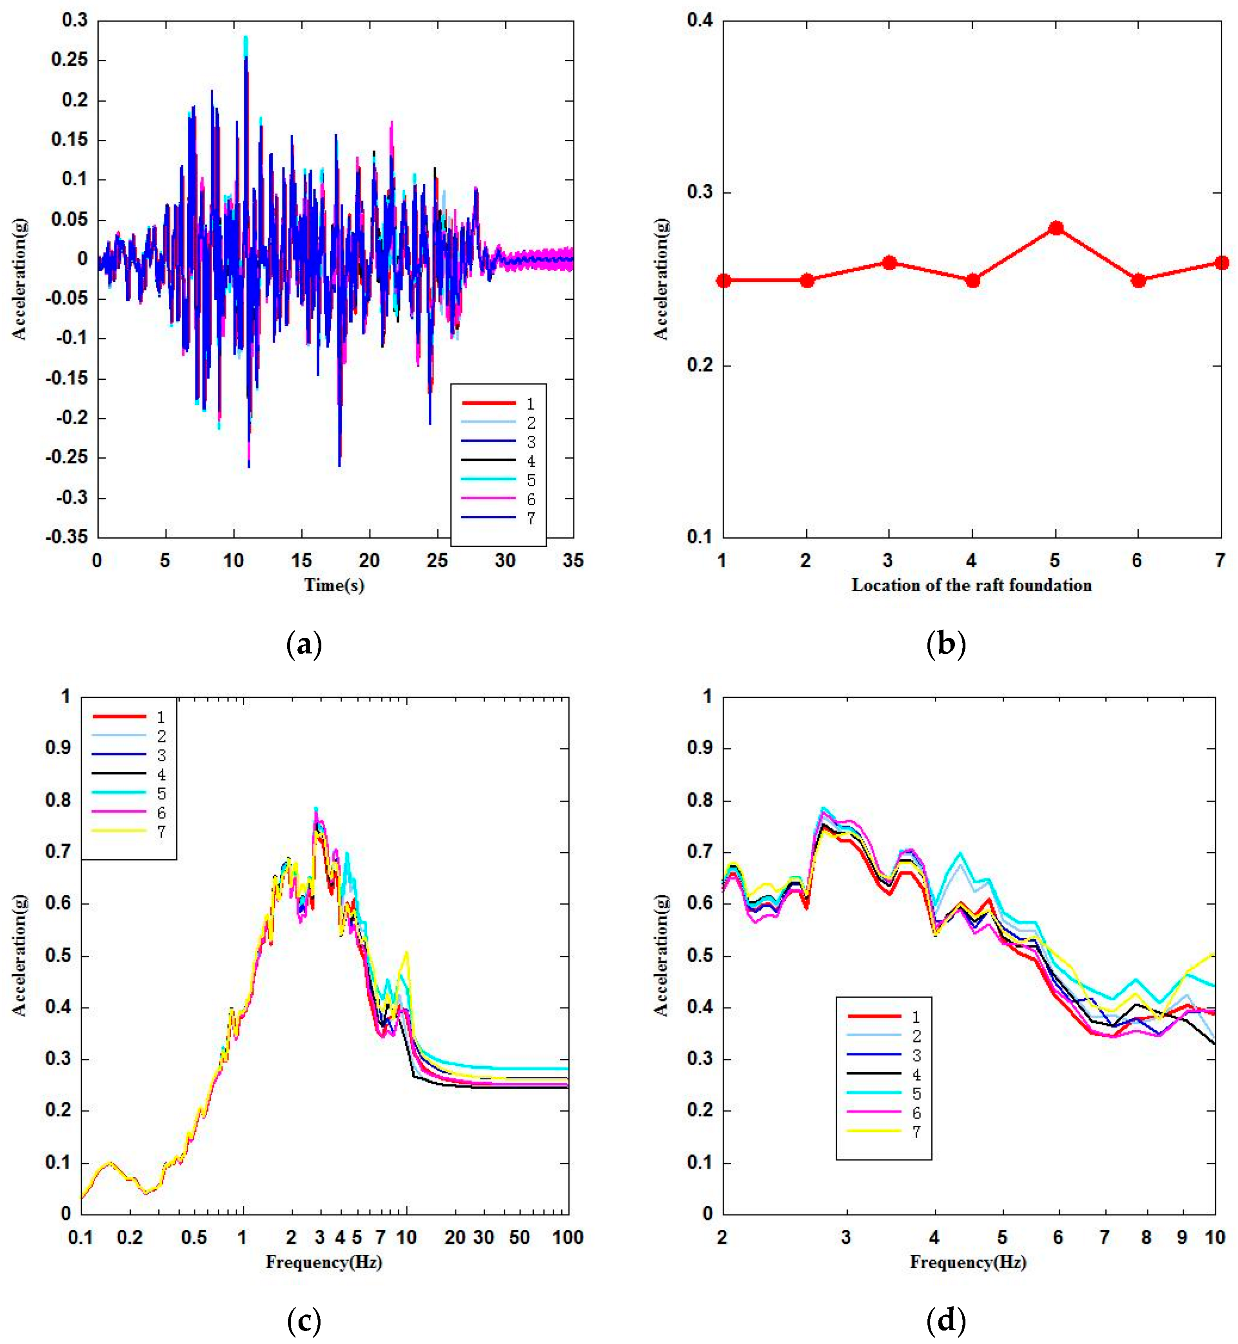
The raft foundation (position 1–7) at the site of 2500 m/s was taken to calculate the acceleration response and the floor response spectrum. Meanwhile, in order to make the analysis more targeted, the frequency band (2–10 Hz) that has a great impact on the structural, system, and components (SSCs) of the NPPs [20] was extracted for comparative analysis. The seismic response of seven points of the raft foundation is shown in Figure 8a–d. In addition, the seismic responses in the y directions of the seven points were calculated, as shown in Figure 9.
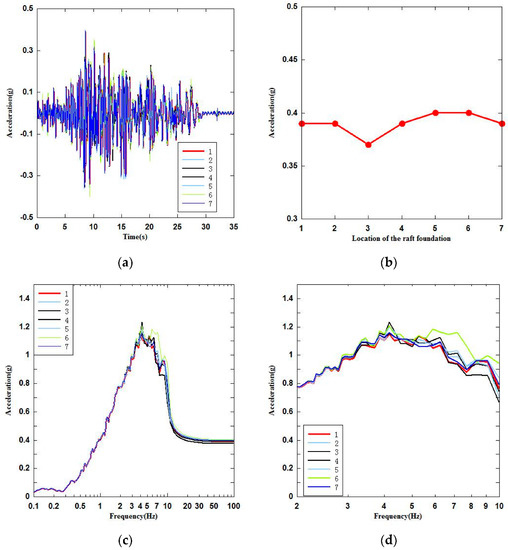
Figure 8.
Peak acceleration and floor response spectrum of the raft foundation at 7 positions in the x direction. (a) Acceleration time history of the raft foundation in the x direction. (b) Peak acceleration of the raft foundation in the x direction. (c) Floor response spectrum of the raft foundation in the x direction. (d) Floor response spectrum of the raft foundation in the x direction (2–10 Hz).
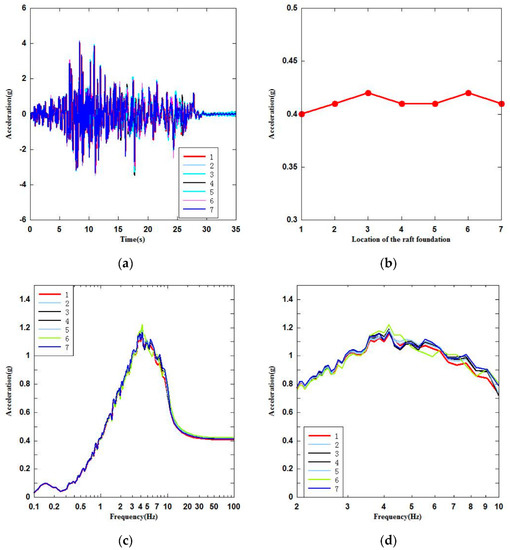
Figure 9.
Peak acceleration and floor response spectrum of the raft foundation at 7 positions in the y direction. (a) Acceleration time history of the raft foundation in the y direction. (b) Peak acceleration of the raft foundation in the y direction. (c) Floor response spectrum of the raft foundation in the y direction. (d) Floor response spectrum of the raft foundation in the y direction (2–10 Hz).
4.2. Seismic Response Analysis of the Raft Foundation in the Firm Rock Site
The raft foundation (position 1–7) of the 1146 m/s site was taken to calculate the acceleration response and floor response spectrum. Meanwhile, in order to make the analysis more targeted, the frequency band (2–10 Hz) was extracted for comparative analysis. The seismic response of seven points of raft foundation is shown in Figure 10a–d. In addition, the seismic responses in y directions of seven points were calculated, as shown in Figure 11.
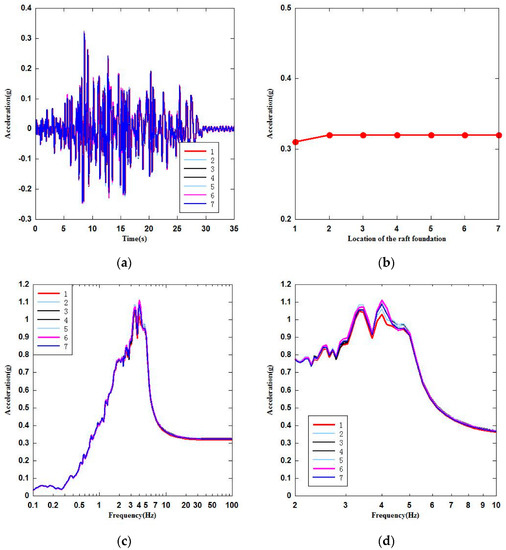
Figure 10.
Peak acceleration and floor response spectrum of the raft foundation at 7 positions in the x direction. (a) Acceleration time history of the raft foundation in the x direction. (b) Peak acceleration of the raft foundation in the x direction. (c) Floor response spectrum of the raft foundation in the x direction. (d) Floor response spectrum of the raft foundation in the x direction (2–10 Hz).

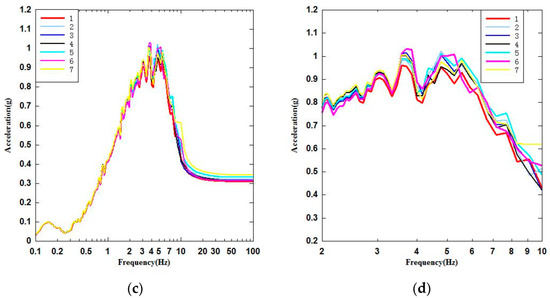
Figure 11.
Peak acceleration and floor response spectrum of the raft foundation at 7 positions in the y direction. (a) Acceleration time history of the raft foundation in the y direction. (b) Peak acceleration of the raft foundation in the y direction. (c) Floor response spectrum of the raft foundation in the y direction. (d) Floor response spectrum of the raft foundation in the y direction (2–10 Hz).
4.3. Seismic Response Analysis of Raft Foundation in Guangdong NPP
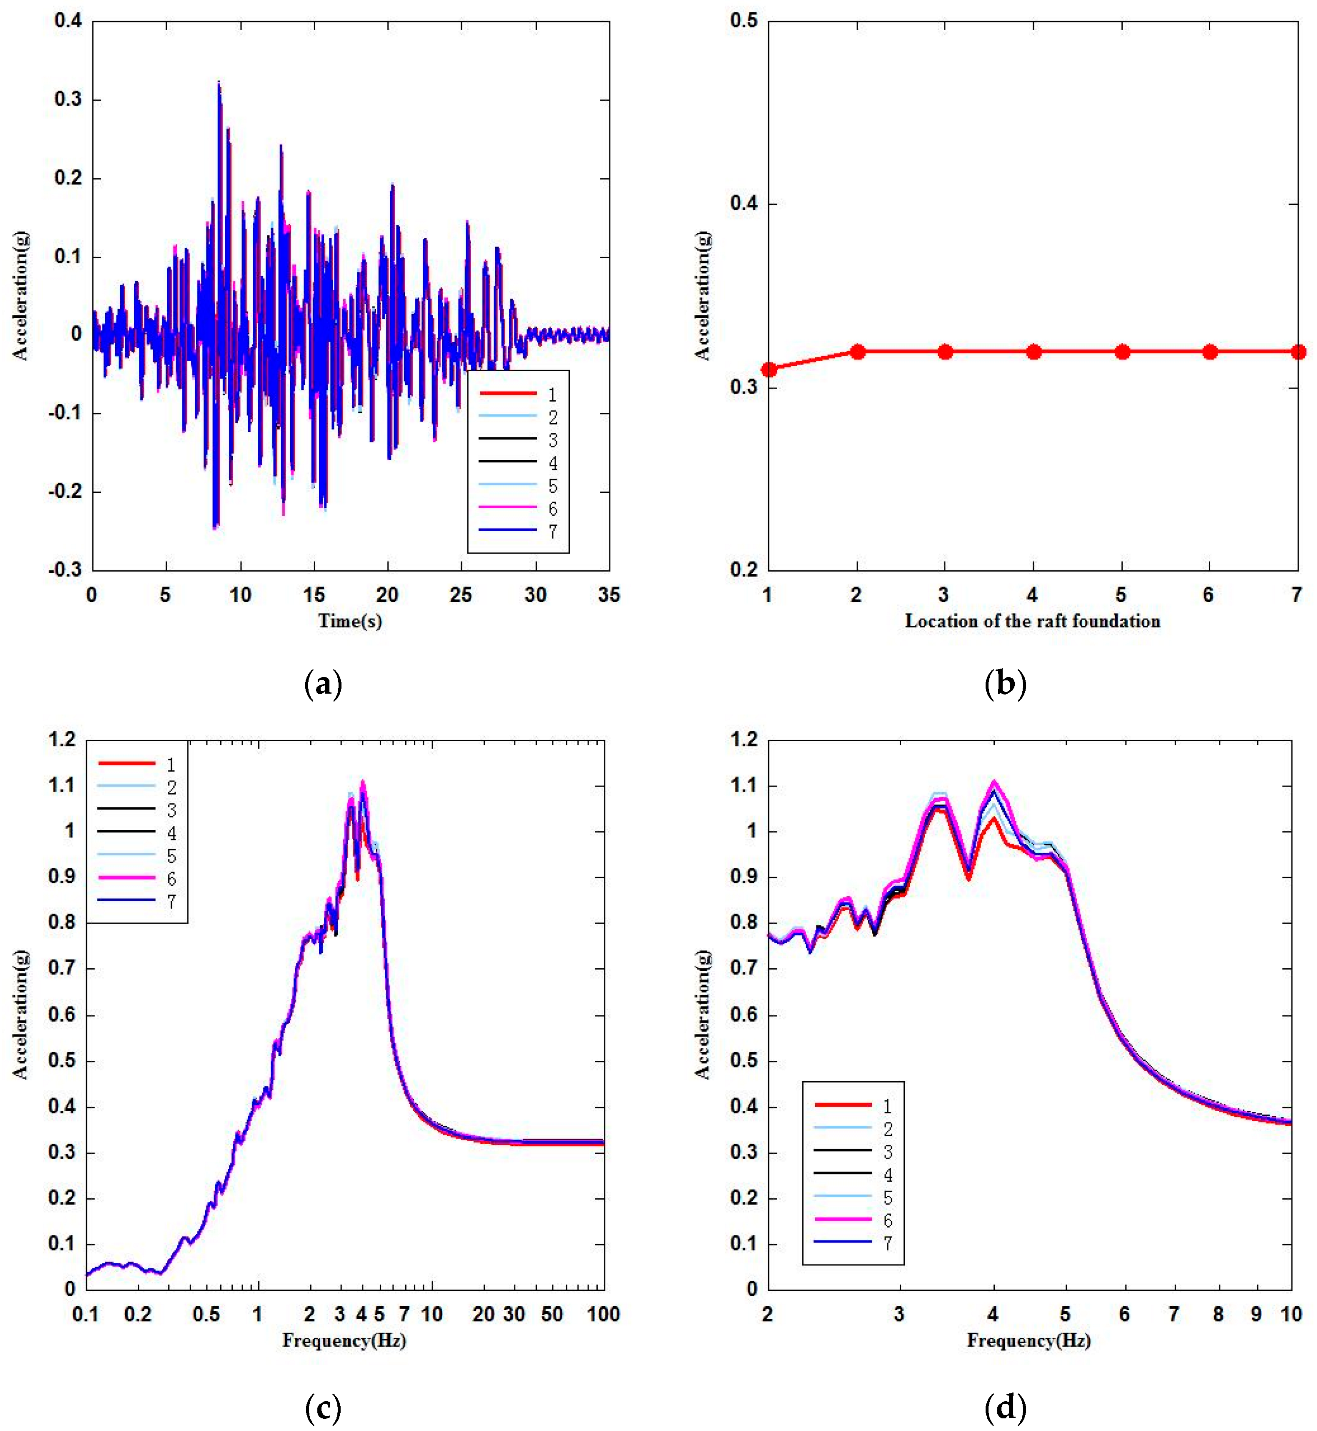
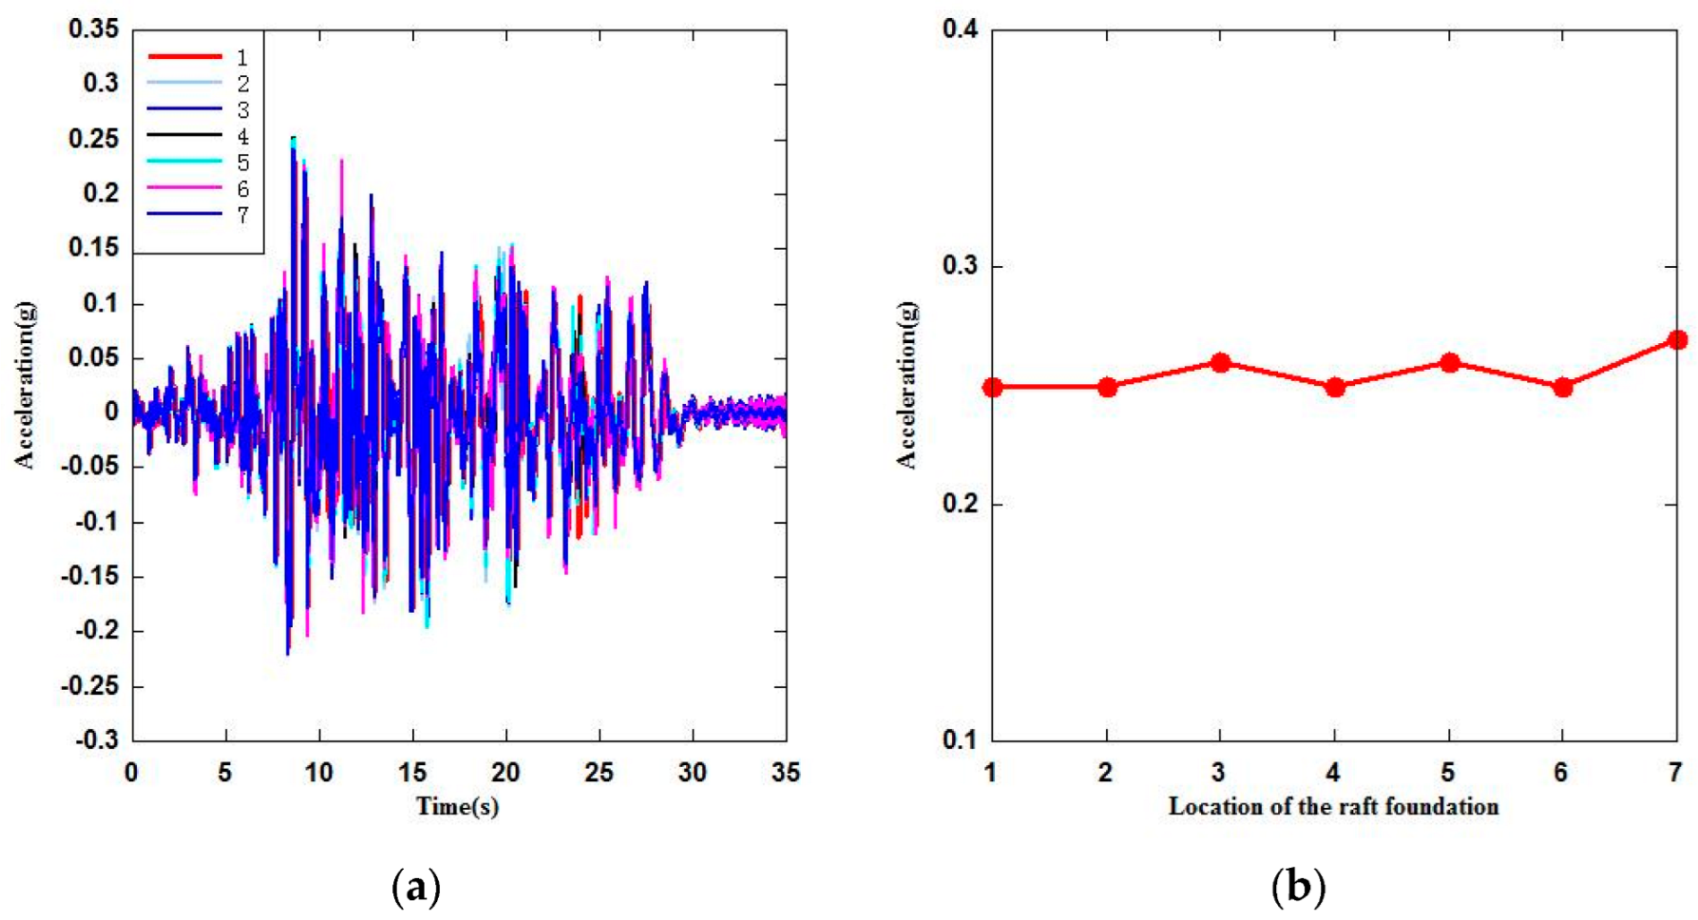
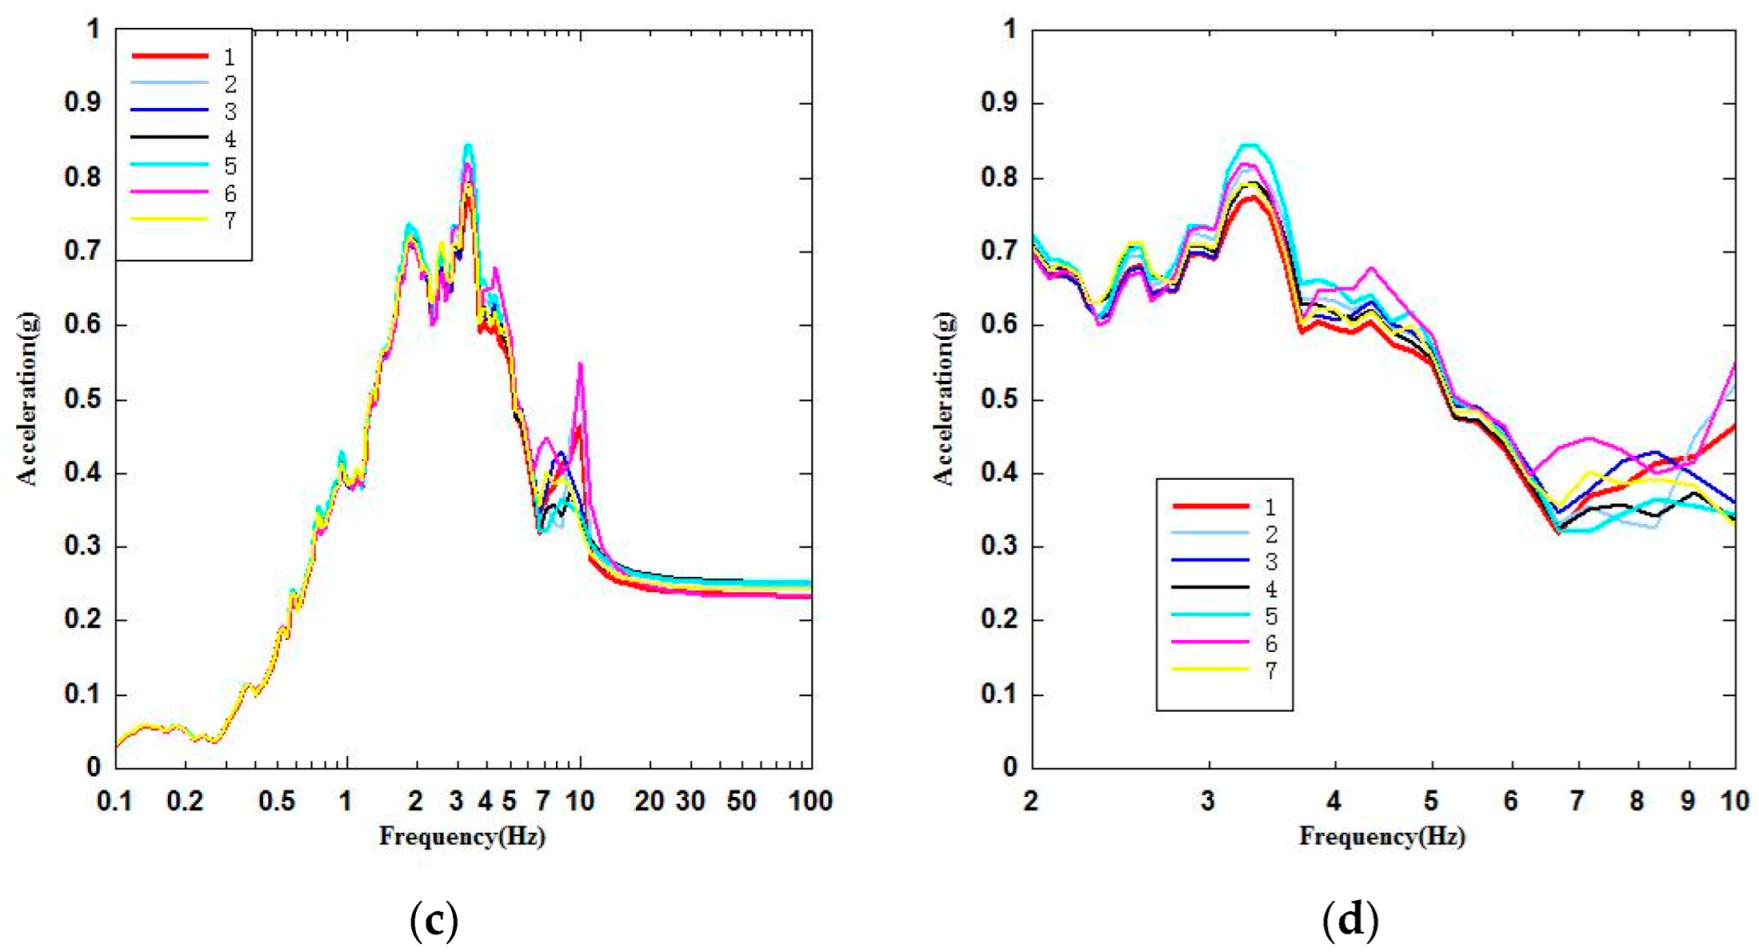
The actual layered site of Guangdong NPP was taken. Similarly, the raft foundation reference point (position 1–7) was taken to calculate the acceleration and floor response spectrum. Meanwhile, in order to make the analysis more targeted, the frequency band (2–10 Hz) was extracted for comparative analysis. The seismic response of seven points of raft foundation is shown in Figure 12a–d. In addition, the seismic responses in the y directions of seven points were calculated, as shown in Figure 13.

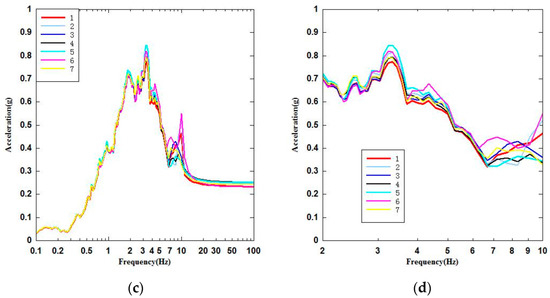
Figure 12.
Peak acceleration and floor response spectrum of the raft foundation at 7 positions in the x direction. (a) Acceleration time history of the raft foundation in the x direction. (b) Peak acceleration of the raft foundation in the x direction. (c) Floor response spectrum of the raft foundation in the x direction. (d) Floor response spectrum of the raft foundation in the x direction (2–10 Hz).
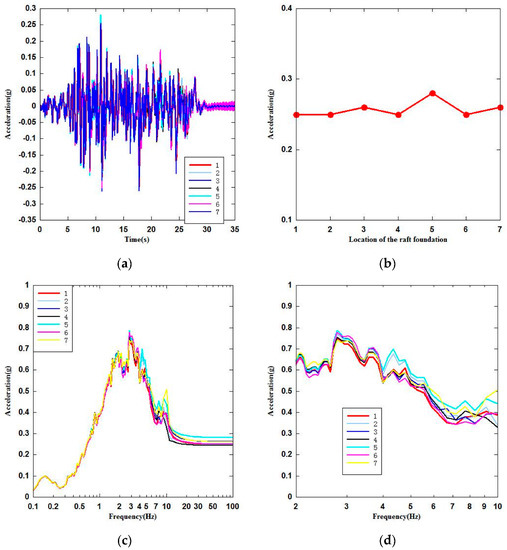
Figure 13.
Peak acceleration and floor response spectrum of the raft foundation at 7 positions in the y direction. (a) Acceleration time history of the raft foundation in the y direction. (b) Peak acceleration of the raft foundation in the y direction. (c) Floor response spectrum of the raft foundation in the y direction. (d) Floor response spectrum of the raft foundation in the y direction (2–10 Hz).
5. Results and Discussion
5.1. Seismic Response Analysis under the Ground Motion of the Guangdong NPP Site
In order to analyze the change of peak acceleration at different positions of raft foundation under the same shear wave velocity, we took seven points on the raft foundation, namely, the outer ring point (positions 5, 6, and 7), the inner ring point (positions 2, 3, and 4), and the center point (position 1). With the change of site conditions, the peak acceleration (), raft foundation position, and reduction rate of are shown in Table 2.
Table 2.
Peak acceleration at different positions of the raft foundation.
As for the peak accelerations at different positions of the raft foundation, it can be seen from the above table, under the same site, that the peak value of the acceleration at the outer ring point (positions 5, 6, and 7) was the largest, and the peak value of the acceleration at the center point (position 1) was the smallest. The reduction rate of the peak value varied from 3% to 10%. Whether or not it has an impact on the safety of the NPPs, it is necessary to analyze the reduction rate of the floor response spectrum.
In order to analyze the reduction rate of the floor response spectra at different positions of the raft foundation under the same site condition, seven points on the raft foundation were taken, namely, the outer ring point (positions 5, 6, and 7), the inner ring point (positions 2, 3, and 4), and the center point (position 1). In accordance with the calculation results, peak acceleration of the floor response spectrum (), the raft foundation position, and reduction rate of under the same site conditions are shown in Table 3.
Table 3.
Floor response spectrum at different positions of the raft foundation.
It can be seen from the above table that the peak acceleration of the floor response spectrum of the raft foundation was mainly at the outer ring, i.e., positions 5 and 6. The minimum value of the peak acceleration of the floor response spectrum was essentially at the center of the ring (position 1). The reduction rate of the floor response spectrum was from 5% to 10%, mainly within 10%.
In order to make the analysis more targeted, this paper extracted the frequency band (2–10 Hz) for comparative analysis, as shown in Table 4.
Table 4.
Acceleration floor response spectrum at different positions of the raft foundation (2–10 Hz).
It can be seen from the above table that the maximum value of the floor response spectrum (2–10 Hz) was mainly in the outer ring, that is, positions 5 and 6. The reduction rate of the floor response spectrum was from 4% to 7%, mainly within 7%.
From Table 2, Table 3 and Table 4, for different site conditions, the acceleration, floor response spectrum, and other calculation results of the seismic response of the raft foundation structure, we can draw the following conclusions: the change of the shear wave velocity of the site had a significant impact on the response of the NPP structure. With the increase in the shear wave velocity, the seismic response increased at the raft foundation. The main reason was that the soil structure interaction (SSI) effect essentially changed the actual input ground motion at the raft foundation NPPs reactor building. Thus, the shutdown threshold for the ASTS shall be calculated according to different site conditions and NPP structural characteristics, and then the threshold will be set according to SL-2.
5.2. Seismic Response Analysis under the Ground Motion of the Kobe Earthquake
In order to consider the fact that the uncertainty of the earthquake ground motion and the layered site is more representative, this section analyzes the peak acceleration changes under the time histories of the Kobe earthquake. We took seven points on the raft foundation, namely, outer ring points (positions 5, 6, and 7), inner ring points (positions 2, 3, and 4), center point (position 1), peak acceleration, raft foundation position, and reduction rate of acceleration, as shown in Table 5.
Table 5.
Peak acceleration at different positions of the raft foundation.
As for the peak acceleration at different positions of the raft foundation, it can be seen from Table 5 that the peak value of the acceleration at the outer ring point (positions 5, 6, and 7) was the largest, and the peak value of the acceleration at the center point (position 1) was the smallest. The reduction rates of these peak acceleration rates were 4% and 5%.
In order to analyze the reduction rate of the floor response spectrum at different locations of the raft foundation under the same site conditions, seven points on the raft foundation were also taken, namely, the outer ring point (positions 5, 6, and 7), the inner ring point (positions 2, 3, and 4), and the center point (position 1). According to the calculation results, the peak value of the floor response spectrum and the reduction of their corresponding frequencies can be obtained, as shown in Table 6.
Table 6.
Floor response spectrum at different positions of the raft foundation.
It can be seen from Table 6 that the maximum peak value of the raft foundation floor response spectrum was mainly in the outer ring, that is, positions 6 and 7. The minimum peak value of the floor response spectrum was at the center or inner ring (positions 1 and 3), and the reduction rates of the floor response spectrums were 3% and 4%.
In order to make the analysis more targeted, the frequency bands (2–10 Hz) that had a greater impact on the SSCs of the NPP were extracted for comparative analysis, as shown in Table 7.
Table 7.
Acceleration floor response spectrum at different positions of the raft foundation (2–10 Hz).
It can be seen from Table 7 above that the peak value (2–10 Hz) of the floor response spectrum was also in the outer ring, that is, position 7. The minimum peak value of the floor response spectrum was also at the center of the ring (positions 1). The reduction rates of the floor response spectrum were 7.5% and 4%, which were relatively small, mainly because the main frequency bands of the Kobe earthquake had little impact on the NPP structure. However, under the two sets of time histories, there is the conclusion that the peak value of the raft foundation was the largest at the outer ring point and the smallest at the center point, regardless of whether it was the peak value of the acceleration or the peak value of the floor response spectrum.
In summary, under the same site conditions, whether the peak acceleration or the peak value floor response spectrum of the raft foundation, the outer ring point was the largest and the center point was the smallest. This was not consistent with the conclusion that there is no layout principle when the seismic sensors for ASTS are deployed on the raft foundation of the NPPs. Therefore, it is suggested that the seismic sensors used for ASTS should be arranged on the outer ring of the raft foundation of a reactor building.
6. Conclusions
In this paper, two sets of time histories with different frequency characteristics were selected as input, and the influence of soil structure interaction (SSI) of NPPs was considered. Under three site conditions, the distribution characteristics of seismic response at seven representative locations on the raft foundation of the reactor building were studied. Some conclusions were derived as follows:
- The shear wave velocity of the site had a significant influence on the seismic response of the raft foundation NPP reactor building. With the increase in the shear wave velocity, the peak acceleration and peak acceleration of floor response spectrum were increased.
- Under different site conditions, the peak value of the acceleration at the outer ring point of the raft foundation reactor building was the largest, and the peak value of the acceleration at the center point was the smallest. The reduction rate of the peak acceleration varied from 3% to 10%.
- Under different site conditions, the peak value of the floor response spectrum at the outer ring point of the reactor building raft foundation was the largest, and the peak value of the response spectrum at the center point was the smallest.
- On the basis of the research in this paper, the outer ring point of raft foundation reactor building was found to be the most sensitive for an earthquake. It is suggested that the seismic instrument used for ASTS should be arranged at the outer ring of the raft foundation of the reactor building. Shutdown threshold shall be calculated according to different site conditions and structural characteristics and set according to SL-2.
Author Contributions
Conceptualization, L.L.; supervision, R.P.; data curation, Y.L. All authors have read and agreed to the published version of the manuscript.
Funding
This research was funded by National Key Research and Development Program of “Aging Degradation Behavior and Prediction Model of Important Structures and Equipment Materials of In-Service Nuclear Power Plants” (no. 2019YFB1900900). This financial support is gratefully acknowledged.
Data Availability Statement
Not applicable.
Acknowledgments
This paper was prepared to document work performed by the Nuclear and Radiation Safety Center, Ministry of Environmental Protection (NSC). This paper is an independent product and does not reflect the views or regulatory positions of the NSC.
Conflicts of Interest
The authors declare no conflict of interest.
References
- HAD102/02-2019; Seismic Design and Evaluation of NPPs. National Nuclear Safety Administration: Beijing, China, 2019.
- GB50267-2019; Code for Seismic Design of Nuclear Power Plants. China Architecture and Building: Beijing, China, 2019.
- ANSI/ANS2.2; Earthquake Instrumentation Criteria for Nuclear Power Plants. American Nuclear Society: LaGrange Park, IL, USA, 2002.
- USNRC. Seismic Instrumentation. Standard Review Plan; United States Nuclear Regulatory Commission: Rockville, MD, USA, 2007.
- USNRC. Nuclear Power Plant Instrumentation Earthquakes; United States Nuclear Regulatory Commission: Rockville, MD, USA, 1997.
- Lu, Y.; Wang, Q.; Sun, Z. Review Experience Feedback on Seismic Instrumentation in Nuclear Power Plant; National Conference Structural Mechanicsin Reactor Technology: Shanghai, China, 2012. [Google Scholar]
- Li, L.; Du, X.; Pan, R. Research on Improved Seismic Instrumentation System for Nuclear Power Plants. Energies 2021, 14, 4262. [Google Scholar] [CrossRef]
- Nguyen, D.-D.; Thusa, B.; Park, H. Efficiency of various structural modeling schemes on evaluating seismic performance and fragility of APR1400 containment building. Nucl. Eng. Technol. 2021, 53, 2696–2707. [Google Scholar] [CrossRef]
- Elkhoraibi, T.; Hashemi, A.; Ostadan, F. Probabilistic and deterministic soil structure interaction analysis including ground motion incoherency effects. Nucl. Eng. Des. 2014, 269, 250–255. [Google Scholar] [CrossRef]
- Politopoulos, I.; Sergis, I.; Wang, F. Floor response spectra of a partially embedded seismically isolated nuclear plant. Soil Dyn. Earthq. Eng. 2015, 78, 213–217. [Google Scholar] [CrossRef]
- Farahani, R.V.; Dessalegn, T.M.; Vaidya, N.R.; Bazan-Zurita, E. Seismic soil–structure interaction analysis of a nuclear power plant building founded on soil and in degraded concrete stiffness condition. Nucl. Eng. Des. 2016, 297, 320–326. [Google Scholar] [CrossRef]
- Halbritter, A.L.; Krutzik, N.J.; Boyadjiev, Z.; Katona, T. Dynamic analysis of VVER type nuclear power plants using different procedures for consideration of soil-structure interaction effects. Nucl. Eng. Des. 1998, 182, 73–92. [Google Scholar] [CrossRef]
- Elaidi, B.M.; Eissa, M.A. Soil-structure interaction in fuel handling building. Nucl. Eng. Des. 1998, 181, 145–156. [Google Scholar] [CrossRef]
- Leonardo, T.S.; Richard, S.O.; Sener, T.; Peña Ruiz, D. Finite Element Modeling of the AP1000 Nuclear Island for Seismic Analyses at Generic Soil and Rock Sites. Nucl. Eng. Des. 2007, 237, 1474–1485. [Google Scholar]
- Tabatabaie-Raissi, M. The Flexible Volume Method for Dynamic Soil-Structure Interaction Analysis; University of California: Los Angeles, CA, USA, 1982. [Google Scholar]
- Zhao, M.; Wang, X.; Zhong, Z. Study on seismic responses of nuclear island structure in non-bedrock site under obliquely incidence of p waves. Eng. Mech. 2020, 37, 43–51. [Google Scholar]
- Frano, R.L.; Forasassi, G. Isolation systems influence in the seismic loading propagation analysis applied to an innovative near term reactor. Nucl. Eng. Des. 2010, 240, 3539–3549. [Google Scholar] [CrossRef]
- Du, X.L.; Zhao, M. A local time-domain transmitting boundary for simulating cylindrical elastic wave propagation in infinite media. Soil Dyn. Earthq. Eng. 2010, 30, 937–946. [Google Scholar] [CrossRef]
- Zhao, M.; Gao, Z.D.; Wang, L.T.; Du, X. Obliquely incident earthquake input for soil-structure interaction in layered half space. Earthq. Struct. 2017, 13, 573–588. [Google Scholar]
- IAEA TECDOC-1956; Seismic Instrumentation System and Its Use in Post-Earthquake Decision Making at Nuclear Power Plants. International Atomic Energy: Vienna, Austria, 2021.


Publisher’s Note: MDPI stays neutral with regard to jurisdictional claims in published maps and institutional affiliations. |
© 2022 by the authors. Licensee MDPI, Basel, Switzerland. This article is an open access article distributed under the terms and conditions of the Creative Commons Attribution (CC BY) license (https://creativecommons.org/licenses/by/4.0/).