Review

Optimal Planning of Future District Heating Systems—A Review

Mechanical Engineering Department, Eindhoven University of Technology, 5612 AZ Eindhoven, The Netherlands
*
Author to whom correspondence should be addressed.
Energies 2022, 15(19), 7160; https://doi.org/10.3390/en15197160
Submission received: 30 August 2022 / Revised: 26 September 2022 / Accepted: 26 September 2022 / Published: 28 September 2022
(This article belongs to the Topic District Heating and Cooling Systems)

Abstract

:
This article provides the state-of-the-art on the optimal planning and design of future district heating (DH) systems. The purpose is to provide practical information of first-step actions for countries with a low DH market share for heating and cooling supply. Previous research showed that for those countries, establishing a heat atlas with accurate geographical data is an essential prerequisite to promote the development of DH systems. In this review, essential techniques for building a high-quality heat atlas are elaborated. This includes a review of methodologies for district thermal energy demand prediction and the status of the integration of sustainable resources in DH systems. In the meanwhile, technical barriers for the implementation of various sustainable heat sources are identified. Furthermore, technologies for the optimal planning of DH systems are discussed. This includes the review of current approaches for the optimal planning of DH systems, discussions on various novel configurations which have been actively investigated recently, and common upgrading measures for existing DH systems.

1. Introduction

The Paris Agreement sets the goal of initially reducing the rise in global temperature to no more than 2 °C above preindustrial levels and pursuing efforts to decrease the temperature rise even further to 1.5 °C by the end of this century. This target requires global reductions in greenhouse gas (GHG) emissions. Statistics from the International Energy Agency (IEA) show [1] that the production of heat accounts for more than 50% of the global energy consumption and that fossil fuels are the major source of heat supply. It is therefore of great importance to provide heat supply in a more sustainable way in order to decrease GHG emissions to the targeted level. In response to the Paris Agreement, much new research has discussed the optimal planning of a future energy system with improved energy efficiency based on sustainable energy resources. In the process of including sustainable energy resources and increasing energy efficiency, district heating (DH) was shown to have an important role to play in various countries/regions [2,3,4,5,6,7,8].
DH is not a new concept, but it has undergone a few generations of development, with each generation incorporating major changes in energy supply, heat carrier medium, operating conditions, and manufacturing of system components, as summarized in Table 1. Most of the DH schemes being operated at present follow the technologies of the 3rd generation. Those built before the development of the 3rd generation DH technology are either already upgraded or undergoing intensive refurbishment to increase system efficiency. The DH systems expected to contribute most to the future sustainable energy schemes are the 4th generation district heating (4GDH) systems. A novel concept called 5th generation district heating and cooling (5GDHC) has been intensively discussed in the literature in recent years. However, since the technology of this concept is at an early stage of development and the definition of the concept itself is still under debate [9], the 5GDHC is not listed in Table 1, but will be discussed separately in Section 6.3.
As can be seen from Table 1, one of the major changes along the DH evolution is the reduction in the operating temperature. A reduced operating temperature is beneficial for the DH system since it helps to unlock more low-grade heat sources and leads to lower thermal losses. In order to realize the design and operation of the low temperature DH (LTDH) concept, technologies in various aspects have undergone systematic development ever since the 4GDH concept was first defined in [10]. In [10], the authors defined the 4GDH system on the basis of the following five abilities:
  • Ability to provide low-temperature heat supply for space heating (SH) and domestic hot water (DHW) to existing buildings, renovated buildings, and new low-energy buildings
  • Ability to distribute heat in networks with low grid losses
  • Ability to utilize renewable heat and recycled heat from low-temperature sources
  • Ability to integrate with other energy systems
  • Ability to ensure suitable planning, cost and motivation structures
This relatively broad definition of a 4GDH system resulted in massive research on relevant topics, such as the design of radiators and substations for LTDH supply, conversion and expansion of existing grids to LTDH systems, digitally-enabled performance monitoring and optimal control of LTDH systems etc. One obvious reality is that the current research on future DH development is dominated by countries with DH systems already quite well developed, such as Denmark, Sweden and some eastern European countries. For these countries, the status quo of their existing DH systems has led their research interest to topics such as necessary system improvements/adjustments for a transition to 4GDH [11], optimal operation of DH systems [12] and upgrading of substations for LTDH supply [13], etc. However, for countries where the market share of DH heat supply is rather low, such as the Netherlands and the United Kingdom, their DH development is at an early stage and the focus is on a refined planning and design of the energy supply system. In such countries, most DH projects are constructed locally by DH operators. However, the development of DH systems is reliant on the synergy between available heat sources and required heat demands. This means that a more systematic approach is required. Existing research showed that a high quality heat atlas, which contains the geospatial representation of heating and cooling demand and potential supply, is an essential prerequisite for DH planning [14]. The lacking of such a high quality heat atlas was shown to be the bottleneck for the development of some technologies and for local strategic heat plannings [15,16]. In the present work, practical information will be provided as a first step towards the establishment of such a heat atlas.
This review article attempts to answer two questions:
  • How does recent research development in DH contribute to the establishment of a high quality heat atlas?
  • What is the state-of-the-art on the optimal planning of DH systems?
The article is arranged as follows. In Section 2, the specific approach to implementing this review article is described. To answer the first question, three sections are presented. In Section 3, some existing heat atlases are first reviewed. Then, methods for the evaluation of DH potentials are discussed. In Section 4, approaches for the computation of DH thermal demands are discussed. In Section 5, the integration status of various sustainable heat sources in DH systems are elaborated, and suggestions on which resources to be mapped on the heat atlas are provided. Along the discussion, major barriers that still exist for the implementation of the discussed sustainable heat sources in DH systems are also identified. Afterwards, in Section 6, the optimal planning and design of future DH systems is presented to answer the second question. Finally, major conclusions are summarized in Section 7.

2. Research Methodology

The primary motivation of this review article was to identify the practical primary steps and major technical barriers for optimal planning and design of future DH systems for countries with low DH market shares. Given the broad range and natural complexity of the topic, a semi-systematic review approach [17], which will be introduced below in 2 steps, was adopted.

2.1. Step 1: Designing the Overall Structure

In this step, around 300 articles from recent years (from 2016 to date) were investigated to narrow down the research scope. Key words “district heating”, ”district heating and cooling”, and “district energy system” were used. In this step, the resulting articles were screened to spot specific research topics that are related to the optimal planning and design of district heating and cooling systems. As an integrated regional energy supply solution, the impact from factors such as tariff policies, financial arrangement, social acceptance are equally, if not more, important than technological progress on the development of DH systems. However, this article focuses mainly on the technological development. The impact of the aforementioned topics will not be deliberated, and will also not be included when drawing major conclusions. Nonetheless, if some of them are found to be the predominant factors for the development of certain technologies, they will be highlighted.
After investigation, around 100 articles were found to be closely related to the research topic. Those filtered articles were broadly categorized in four main sub-topics:
  • Identification of DH potentials
  • Approaches for heat demand predictions
  • Integration of sustainable heat sources in DH systems
  • Optimal planning and design of future DH systems
Afterwards, more key words were selected from the filtered articles for the next step search. Key words selected in this step include: “heat atlas”, “GIS”, “heat density”, “feasibility evaluation”, “heat demand”, “regional thermal load”, “sustainable heat sources”, “renewable energy”, “geothermal”, “biomass”, “solar energy”, “surplus heat”, “waste heat”, “data center”, “heat pump (HP)”, “topology”, “topological optimization”, “prosumer”, “4th generation district heating (4GDH)”, “5th generation of district heating and cooling (5GDHC)”, “Ultra-low temperature district heating (ULTDH)” “upgrade”, etc.

2.2. Step 2: Conducting the Review

Based on the defined structure and selected key words from step 1, a more detailed search was conducted on each subtopic. In this step, key words that were used and finally selected from step 1 were combined for further investigation, e.g., “geothermal” + “district heating and cooling”, “solar energy” + “district heating systems”, “topological optimization” + “district heating”, etc. Note that although the focus of the search in this step mainly remained on recent publications starting from the year 2016, articles published before 2016 were also considered if they provided valuable explanation and understanding for certain topics.
This review includes journal articles, conference papers and technical reports from well recognized organizations such as IEA and international renewable energy agency (IRENA). In total, approximately 200 articles were included in the present review article.

3. Identification of DH Potentials

For policymakers, a comprehensive heat plan must consider how much heat to supply, how to supply it and at what cost. To answer these questions, the availability of a detailed heat atlas was shown to be crucial [18]. A complete heat atlas contains the distribution of heat demand, the available heat sources and the information of suitable heat supply solution for a specified region. However, building such a heat atlas is not an easy task since it is very time consuming and capital intensive. Moreover, detailed data regarding heat demand is usually very difficult to collect due to privacy issues. In practice, the level of detail and resolution of existing heat atlases vary significantly in different countries and regions.

3.1. Heat Atlas Worldwide

In the literature, several heat atlases were identified. At the EU level, the heat atlas was mainly developed in the Heat Roadmap Europe study series. A heat atlas with the information of heat demand distribution was first built for the 27 EU member states in [19,20]. Then, heat recycling resources from the energy and industry sector were quantified and mapped for the EU27 members in [21]. Together with the heat demand map, target regions for large-scale implementation of DH were identified in the same work. In [18], a more versatile online application named Pan-European Thermal Atlas 4 (PETA4) was developed for 14 EU member states. In this application, potential regions for DH construction and the DH distribution costs for different regions were also identified. In Figure 1, a screenshot of the heat atlas for the Netherlands from PETA4 is shown. For illustration purpose, only some selected layers are shown. It can be seen from the figure that in addition to the information on the heat demand and various available resources, the DH distribution costs and strategic heat synergy regions for large-scale implementation of DH with different priority levels are also identified. Although this online heat map provides in-depth information for the construction of potential DH systems, it is worth mentioning here that the level of confidence in the results from [18] is not very high since the hectare level heat demand in PETA4 was assessed by using a regression model based on Danish conditions. The original objective of PETA4 was to create first-order accurate continental map layers where there were no layers available at all to visualise the possibilities and inspire more local-oriented mapping initiatives. Direct application of PETA4 to EU countries other than Denmark is therefore limited. Nevertheless, it still serves as a representative example for the establishment of local heat atlases for other EU countries.
In addition to the heat atlases at EU level, regional heat maps have also been generated by local governments and associations, such as the heat map of Scotland [22], London [23], the Irish heat atlas [24] and the German heat atlas [25]. On those heat atlases, information of the heat demands, the distribution of available sustainable heat resources and the distribution of existing DH networks are presented. In the Netherlands, the development of a heat atlas started from 2020 [26]. On this atlas, information on the heat demand is not available yet, but information regarding the access to certain sustainable heat sources is. In [27], clean heat sources including water bodies, data centers, supermarkets, underground subway stations, sewage plants, shallow geothermal sources, and ice rinks were mapped for DH development in Stockholm city. A special case worth mentioning is Denmark, where a detailed heat atlas is established on building level based on age, type and usage of the building [28]. This detailed heat atlas has been extensively used for the development and planning of Danish energy systems.
It is obvious from the above discussion that there exists a huge gap between different heat atlases, while most countries still need to build their heat atlases with detailed heat demand and supply information, PETA4 already presents the heat synergy regions with different levels of priority for potential DH construction. The step from the heat demand map to the identification of potential DH construction, however, is non-trivial.

3.2. DH Potential Identification

The basic advantage of DH compared to local heat generation comes from the cost difference between local heat generation and central heat generation. However, unavoidable extra cost is also introduced in DH systems. If the extra cost is too high compared to the heat generation cost advantage, the competitiveness of the DH system will be substantially erased. In traditional DH systems, the extra cost is dominated by the heat distribution cost as shown in Figure 2. In future DH systems, such as ULTDH and 5GDHC systems as will be discussed in Section 6.3, large amount of distributed thermal units such as thermal storages and HPs are involved. The related installation capital cost and the operation and maintenance cost on the distributed substations will substantially influence the competitiveness of the DH supply solution. Note that Figure 2 only shows the cost component of each heat supply solution. Neither the scale nor the difference in cost was validated versus real conditions.
To identify the DH potential of a region, the involved cost on DH should be compared with the cost of individual heat supply solutions. If the DH supply is cheaper than the individual supply solution, DH could be identified as a viable heat supply solution. To make the conclusion more persuasive, the least-expensive individual heat supply solution should be used, as was done in [29]. This action guarantees the competitiveness of DH against all potential renovation projects on local heat supply strategies. However, this approach requires detailed information on heat demand of buildings and heat producers. The work in [29] was enabled due to the high quality of the heat atlas in Denmark. For other countries, the common practice is to use the linear heat density Q s / L (annual energy demand per unit length of DH pipe, GJ/m). Examples are the potential evaluation work in [30] for Switzerland, in [31] for France and in [32] for Hamburg, Germany. The evaluation of DH potential is performed by defining a threshold, and regions with Q s / L higher than the defined value are considered suitable for DH development. Some specific data that emerged as reference values for the DH potential identification could be found in [30]. Since the trench length of the DH system is unknown yet at the planning stage, some empirical correlations were identified to estimate Q s / L with the use of the number of buildings per hectare [30] or by using the land area (m2) and specific heat demand of buildings (GJ/m2) [33]. Note that those empirical correlations are region/country specific since they were obtained by simple regressions. Their application in other regions with different spatial layout of buildings should therefore be carefully evaluated.
The essential reason for using Q s / L as the indicator of DH potential identification is because it is the determinant of the heat distribution cost. The total costs of district heat distribution basically consist of the annual cost of four different categories: distribution capital cost, distribution heat loss cost, distribution pressure loss cost, and distribution maintenance cost. Among the four terms, the distribution capital cost dominates the total distribution cost. The distribution capital cost is the investment cost of constructing the DH network within an area, which could be expressed in the following form [34]:
C c = a · ( C 1 + C 2 · d a ) Q s / L
Here a is the annuity based on the chosen hurdle rate and the investment lifetime, C c is the annual distribution capital cost (EUR/GJ), C 1 is construction cost constant (EUR/m), C 2 is construction cost coefficient (EUR/m2) and d a is the average pipe diameter (m). Experience from existing DH systems showed that higher Q s / L in general requires greater d a . One such example is the correlation derived in [34] based on data from 134 Swedish DH networks:
d a = 0.0486   l n ( Q s / L ) + 0.0007
Construction cost in different countries and different characteristic areas (inner city area and outer city area, etc.) are different, but could be established as a function of nominal pipe diameter, as can be seen from Figure 3. As a result, the value of Q s / L could solely determine the scale of C c , and thus also the DH construction potentials.
Figure 3. Construction cost per meter trench length for DH pipes of various sizes for (a) Sweden (2015). Reproduced from [35], Elsevier: 2022; (b) Ireland (2020). Reproduced from [36], Sustainable Energy Authority of Ireland: 2022.
Energies 15 07160 g003
It is obvious from Figure 2 that still using Q s / L to evaluate future DH potentials might be problematic since the extra cost term of DH compared with individual heat supply is not only the heat distribution cost anymore, but also includes substation cost. This is also revealed in [16], where the assessed Q s / L of some 5GDHC systems are lower than the feasibility threshold adopted in traditional DH systems. As will be seen in Section 6.3, future DH systems rely heavily on booster units. Those systems will only be economically competitive if the heat generation cost savings, which is enabled by unlocking more sustainable and low quality heat sources, outbalance the extra substation costs (including the installation capital cost, power consumption cost and the maintenance cost). Compared with traditional DH systems, a lower distribution temperature in future DH systems will also lead to lower heat loss cost [37]. Another potential saving term could be from the distribution capital cost in 5GDHC systems, where the close to ground operation temperature does not require insulated pipes anymore. However, the specific evaluation of this contribution still requires systematic comparison. What is clear here is that only using Q s / L to evaluate DH potential is not enough any more. The reliability of using Q s / L for DH potentials identification was enabled by massive experiences. For future DH potential identification, the cost comparison between individual supply solutions and DH supply is necessary. For this, a high quality heat atlas with high resolution is a prerequisite.

4. Approaches for Heat Demand Predictions

Heat demand is the driving force for both the planning and operation of a DH system. Including detailed information of the heat demand distribution on the heat atlas is therefore of great importance. Methods for the prediction of the heat demand for single buildings have been extensively researched and are well established. However, when the scale comes to a district or a country, more complexities and uncertainties are introduced. The route from the prediction for individual buildings to district level is still a nascent field to be explored. The prediction of regional thermal energy use becomes difficult due to the following major challenges [38]:
  • Uncertainties caused by different user behaviors
  • Difficulty of gathering data for a large amount of buildings due to privacy and high cost
  • High computational cost due to the large amount of buildings involved
Interestingly, the uncertainties caused by different user behaviors do not necessarily have a negative effect on the regional energy prediction. Due to the diversity of the energy use profiles from different consumers, the prediction error caused by the uncertainties from user behaviors for aggregated regional heat use is often lower than for individual buildings.
At a large scale, energy prediction approaches in the building sector could be broadly divided into two categories: the top-down approach and the bottom-up approach, as shown in Figure 4. The top-down approach uses historical energy consumption data of a region and describes the correlation between the energy consumption of the region and long-term changes or transitions in the building sector. This approach is thus usually treated as a “macro-economic tradition” [39], which is often used to predict the impact of various macroeconomic factors, such as population, climate condition and fuel price etc., on the overall energy flow. It treats the entire building sector as an energy sink and does not distinguish the use from individual users. The bottom-up approach, on the contrary, starts from the prediction of energy consumption of individual users and then aggregates the profiles to generate the overall energy consumption for the whole region. For future DH systems, the increasing integration of sustainable resources at decentralized sites requires more detailed energy use prediction. Therefore, the bottom-up approach is found to be more suitable for the energy consumption prediction in DH systems [40] and will be discussed in this study.
Based on the availability of input data and techniques, methods for the energy consumption prediction of individual buildings in the bottom-up approach are grouped into engineering methods and data-driven methods, as is shown in Figure 5.

4.1. Engineering Methods

Engineering methods are developed based on fundamental physics of the built environment. Common inputs for engineering methods are the physical properties of the building, such as geometry, envelope fabric and ventilation conditions, occupancy behavior, indoor temperature setting and weather conditions, etc. Numerical models are built to describe the energy flow according to conservation laws and heat transfer theories. Due to the high computational cost for most engineering methods, energy prediction for each individual building in a region is unrealistic. Therefore, the concept of using some representative buildings to represent certain groups of dwellings is often used. The simulation results of representative buildings can then be extended for regional energy use evaluation. In general, there are two types of representative buildings: sample buildings and archetypes. Sample buildings are actual buildings from the region. To generate accurate regional energy consumption, the number of sample buildings must be sufficiently high to realistically reflect the degree of variety in the region. Archetypes can be “real buildings” whose inputs are representative for the buildings in the region, or “virtual buildings” whose inputs are artificially defined numbers (usually the mean value of the features of geometry and envelope fabric, as well as operation parameters of the buildings from the entire region). This means that an archetype can be different from any individual building in the system.
Compared with archetypes, sample buildings can generate more realistic regional energy consumption profiles, provided that the number of sample buildings is sufficiently high. However, this approach requires a large amount of input data, which are in most cases challenging to obtain due to privacy and marketing reasons. As a result, the application of sample buildings has been limited [40]. In comparison, archetypes have been used much more often. For the application of archetypes, the identification of the number of archetypes plays a critical role. Clustering techniques have been used for the identification of groups with similar thermal consumption patterns in building systems. As one of the simplest, but also the most popular algorithm, k-means was proven to be efficient in identifying archetypes [41,42,43]. Depending on the definition of similarity and pre-processing of the consumption data, the number of archetypes varies significantly in different research. In [41], 5 clusters were identified out of 8293 family houses. In [42], a variable cluster number over time was identified, varying from 5 to 11 among the 97 buildings within one month. Except for k-means, more advanced algorithms such as k-shape [44] and Gaussian Mixture Models (GMM) [45] were also used to discover heat load patterns.
Engineering modelling for the computation of the heat consumption profiles can be either deterministic or stochastic. Deterministic models generate the same output for a given set of inputs, while stochastic models incorporate uncertainty factors by including Monte Carlo sampling in deterministic models. Conventionally, the engineering method is a deterministic process. In this category, multi-zone building simulation models, which conduct detailed simulations of the energy flows of individual buildings with high spatial layout resolution, give the most complete description of building energy flows. However, this approach requires very detailed data of the buildings and is computationally rather expensive. As a result, lumped parameter building thermal models were proposed for building thermal simulations. In lumped parameter building thermal models, the building envelope is divided into a number of temperature uniform units and expressed as a network of thermal resistances (R) and capacitances (C). The building thermal model is thus reduced to a resistance-capacity (RC) thermal circuit model. In a RC model, the most pivotal work lies in determining the R and C terms. In [46], a summary for the application of RC modeling in building thermal load prediction is provided.
For district energy demand prediction, deterministic models contain significant uncertainty challenges. From an individual building heat demand prediction point of view, variables such as the set point of indoor temperature, which is correlated with human behavior, is by nature a stochastic input. From a regional energy prediction perspective, since a limited number of archetypes are used, uncertainties also emerge during the distribution of different building parameters. Stochastic models became natural choice for this issue. The variables which contain uncertainties are sampled randomly from a predefined range and then used for the prediction of energy consumption in the deterministic model. By the random sampling, the stochastic features are included. This introduced randomness, however, needs to be calibrated with measurement data to fit the characteristics of the investigated system. For this, the Bayesian calibration method is a common practice and was adopted in various studies, as summarized in [47]. It is worth mentioning that in some other research, different terminologies are used for building energy simulations. The detailed multi-zone physical based models are also called white-box models, the calibrated models of stochastic methods are called grey-box models and data driven models which will be discussed in Section 4.2 are also called black-box models.

4.2. Data Driven Methods

Data-driven approaches rely on historical data and utilize different mathematical techniques to derive the relationship between the energy consumption and input parameters from users. The major source of the data used in this approach is the energy billing from users, while engineering methods spend tremendous efforts to include uncertainties such as user behavior patterns in the model, data-driven approaches have the advantage of inherently containing all those factors in the model. There are two main techniques to obtain the correlation between thermal energy use and user inputs: regression techniques and machine learning (ML) algorithms.
Historically, regression techniques have been more frequently used for energy use prediction. In general, a correlation between energy use and weather conditions, such as ambient temperature, solar radiation, wind speed etc., as well as historical consumption data, is constructed to predict future energy use [48,49,50]. In [40,47], detailed reviews on regression models for energy use predictions were elaborated. In contrast, the application of ML algorithms was limited. However, due to the rapid development in the ML field, a substantial amount of work was found using ML algorithms for energy consumption predictions in the investigated period. In order to identify the most appropriate algorithm, comparisons across different ML algorithms, some also including regression methods, were performed in various studies. The main conclusions from those comparison work are summarized in Table 2. It can be observed that ML algorithms in general produce more accurate predictions than regression methods [51,52]. More specifically, SVM was shown to outperform other algorithms in most research [53,54,55,56]. In addition to using one algorithm, a combination of multiple techniques was also used [57]. It was shown that the robustness for the forecaster is increased after combining different algorithms.
Table 2. Comparison of various data-driven methods for energy use prediction [51,52,53,54,55,56,57].
Comparied Algorithms 1Conclusions
SVM, FFNN, LR, DT [51]ML algorithms significantly improve the accuracy of predicted heat load compared with LR
LR, Ridge regression, Lasso regression, FFNN [52]FFNN provides the best prediction accuracy
SVM, GP, FFNN [53]SVM outperforms GP and FFNN in prediction accuracy and generalization capability
EMD-ICA-SVM and other 8 different ML algorithms [54]EMD-ICA-SVM based model outperforms other algorithms in terms of forecasting accuracy
SVM-FFA, SVM with grid search, GP, FFNN [55]SVM-FFA is superior to GP, FFNN, and SVM with grid search in terms of accuracy
SVM, FFNN, MLR, DT regression [56]
  • SVM generates the most accurate prediction
  • DT regression has the poorest performance
FFNN, ETRs, LR, SVM [57]
  • LR performs the worst among the compared methods
  • FFNN and DT regression perform slightly better than SVM
1 Algorithms that are compared in the table include: Support Vector Machine (SVM), Feed Forward Neural Networks (FFNN), Decision Tree (DT), Linear Regression (LR), Ridge regression, Lasso regression, Generic Programming (GP), Empirical Mode Decomposition (EMD)-Imperialistic Competitive Algorithm (ICA)-SVM, SVM with Firefly Algorithm (FFA), Multiple Linear Regression (MLR), Extremely randomized (extra) Tree Regressors (ETRs).

4.3. Aggregation from Individual Buildings to a District/Region Scale

The route of building energy use from individual level to district scale is in general rather straightforward. In the simplest case, the regional energy use is computed by directly summing up the energy use of all buildings. This method is applicable to cases when the energy use for all the individual buildings in the district is available. This method was also called “Brute Force” approach in [58]. Due to the wide application of archetypes as discussed in Section 4.1, the most common aggregation approach is by extrapolation. The simulated energy demand profiles for archetypes are scaled up by summing up either the multiplication of the energy use for each archetype and the number it represents or the multiplication of the regional floor area and the normalized archetype’s energy use of each heated floor area, as elaborated in [40]. When sample buildings are available, regional energy consumption can be estimated by applying appropriate weightings to the aggregated results from the sample buildings. Except for those general approaches, a systematic two step model named DiDeProM (District, Demand, Profiles Model) was developed in [58] to aggregate energy profiles of archetypes to district energy use.
For regional energy use prediction, which approach to use is highly dependent on the availability of data. When aggregated district energy consumption data is available, predictions from data driven models could be directly used to generate the district energy demand profile. When no previous data is available, detailed archetype simulations will be needed.

5. Integration of Sustainable Heat Sources in DH Systems

As one of the major features of future DH systems, the inclusion of renewable resources and excess heat from industries in DH is only briefly touched upon in most recent review articles on DH systems. In a very recent article [59], a rather comprehensive review on the role of sustainable heat sources in future DH systems is provided. Given that our research aim was to provide local planners a clear vision on how to map the appropriate heat sources on their heat atlases, we focus on discussing the integration status of various sustainable heat sources in DH systems. Along the discussion, major technical barriers that still exist for the implementation of the discussed heat sources in DH systems are also identified and summarized in Table 3.

5.1. Geothermal Energy

As the most mature renewable technology in the context of DH, the application of geothermal energy in DH attracted tremendous attention from researchers. The detailed survey from [60] proved that the use of geothermal energy can be developed anywhere for both heating and cooling with the help of HP. The installed thermal capacity of geothermal direct use at the end of 2019 was estimated to be 107,727 MWt, among which 71.6% is reliant on HP. It was also indicated in [60] that the direct heat application of low-to-moderate temperature geothermal resources is an economically feasible business, and can make a significant contribution to a region’s energy mix. Given the current oil and gas price and supply uncertainties in mid-2022, geothermal energy supply is becoming an even more attractive heat supply solution. However, except for several countries (China, USA, Sweden, Turkey, Japan, Germany, Iceland, Finland, France and Canada), the development of geothermal heat supply in most countries has been slow. So, detailed mapping of available geothermal resources on the heat atlas will play an important role for the optimal planning and design of future DH systems.
The major obstacle for the development of geothermal energy is the high initial cost (exploring, drilling wells, pipeline construction and reservoir operation). Due to the high initial cost, long term supply, e.g., from 15 years [63] to as much as 60 years [64], is necessary. Therefore, the major research attention was on technical assessment for sustainable utilization of geothermal reservoirs. For its direct application in DH systems, fluid temperature and mass flow of the fluid from the reservoir are the most crucial factors [65]. They must meet the intended consumption requirements. In [66], a framework was proposed to evaluate the technical and useful potential of shallow geothermal application in district heating and cooling. For the evaluation of the feasibility of deep geothermal use in DH systems, the numerical tool GEOPHIRES was shown [67] to be sufficient. For more detailed investigation on the sustainability of geothermal exploitation, numerical tools such as COMSOL [64] and TOUCH [68] could be used.
For the identification of the location, magnitude and sources of thermodynamic inefficiencies in the system, exergy analysis was proven [59,69,70] to be powerful. The exergy analysis in [70] demonstrated that reducing the thermodynamic inefficiencies of the system (by changing operation conditions) is more meaningful than changing the design of system components. Furthermore, advanced exergy analysis was shown [71] to be more meaningful and effective than conventional exergy analysis for the system performance analysis since it provides information for the improvability of the system. Last but not least, safety issues must be carefully evaluated for the exploitation of geothermal energy. The study on the earthquakes induced by the deep geothermal based DH system in the city of St. Gallen in 2013 shows that over pressurized gas might cause seismicity [72]. In [73], a cyclical and iterative management process was presented as a governance model for the development of Shallow Geothermal Energy (SGE) resources. First, a management framework consisting of an open but exhaustive checklist of management problems, objectives, strategies and measures based on four policy principles was proposed for policy makers. This management framework was then adopted in the governance model to define the decision-making and the decision-implementation processes. With proper implementation, the scientifically-based robust policies formulated from this governance model will have the potential to guarantee safe and efficient exploitation of SGE resources.

5.2. Biomass

The application of biomass in DH refers to direct combustion of biomass resources such as wood chips. Although there are also researchers discussing about utilizing other forms of bioenergy in DH systems [74,75], those technologies are more considered as competitors of the biomass resource use in DH, such as transportation [59]. Compared with most of the other sustainable resources, biomass has two major advantages: it is dispatchable and the heat supply is not intermittent. However, biomass-based DH is not an option for many regions because the availability of biomass varies significantly from region to region. As can be seen from Figure 6, the population density of Canada and Australia is only 3–4 persons per km2, but for Korea and the Netherlands, it is more than 500 persons per km2. Although the distribution of biomass resources is influenced by various factors (such as the size of the country’s land area, topography, climatic conditions, and the distribution of land use), countries with low population density tend to have high availability of domestic biomass resources [76], and thus higher potential to develop biomass-based DH systems.
Except for the population density, another factor to be considered is the distance between the designed DH region and the available biomass resource. It is obvious from existing research that the development of biomass-based DH is mostly suitable for the heat supply in rural areas since logistical challenges for those areas to develop biomass-based DH systems are smaller [77,78,79]. The work in [77] further indicated that the feasibility of a biomass-based DH system is highly influenced by the presence of large heat consumers. For regions that are found to be suitable for the inclusion of biomass in their energy supply mix, the local planners should also realize the importance of policy support on developing biomass-based energy systems. As a pioneer in the development of biomass-based DH, Sweden supplies 60% of its heat demand in the building sector by DH supply, and biomass accounts for half of the sustainable heat supply. After studying this successful experience, the authors in [80] concluded that the biomass introduction and expansion was driven by local municipal initiatives and national energy policies.

5.3. Solar Energy

As a well explored technology, the integration of solar energy in DH systems continues to attract researchers’ attentions. In principle, a solar DH system can be categorized as either centralized or distributed [81], as depicted in Figure 7. A centralized system is featured with a large central solar collector field and a central seasonal thermal storage connected to the network supply. In a distributed solar DH system, solar collector fields are installed at suitable locations and connected directly to the network circuit on site. In this section, the applications of centralized and distributed solar systems will be first discussed. Afterwards, the selection of solar energy technologies in DH systems will be elaborated.

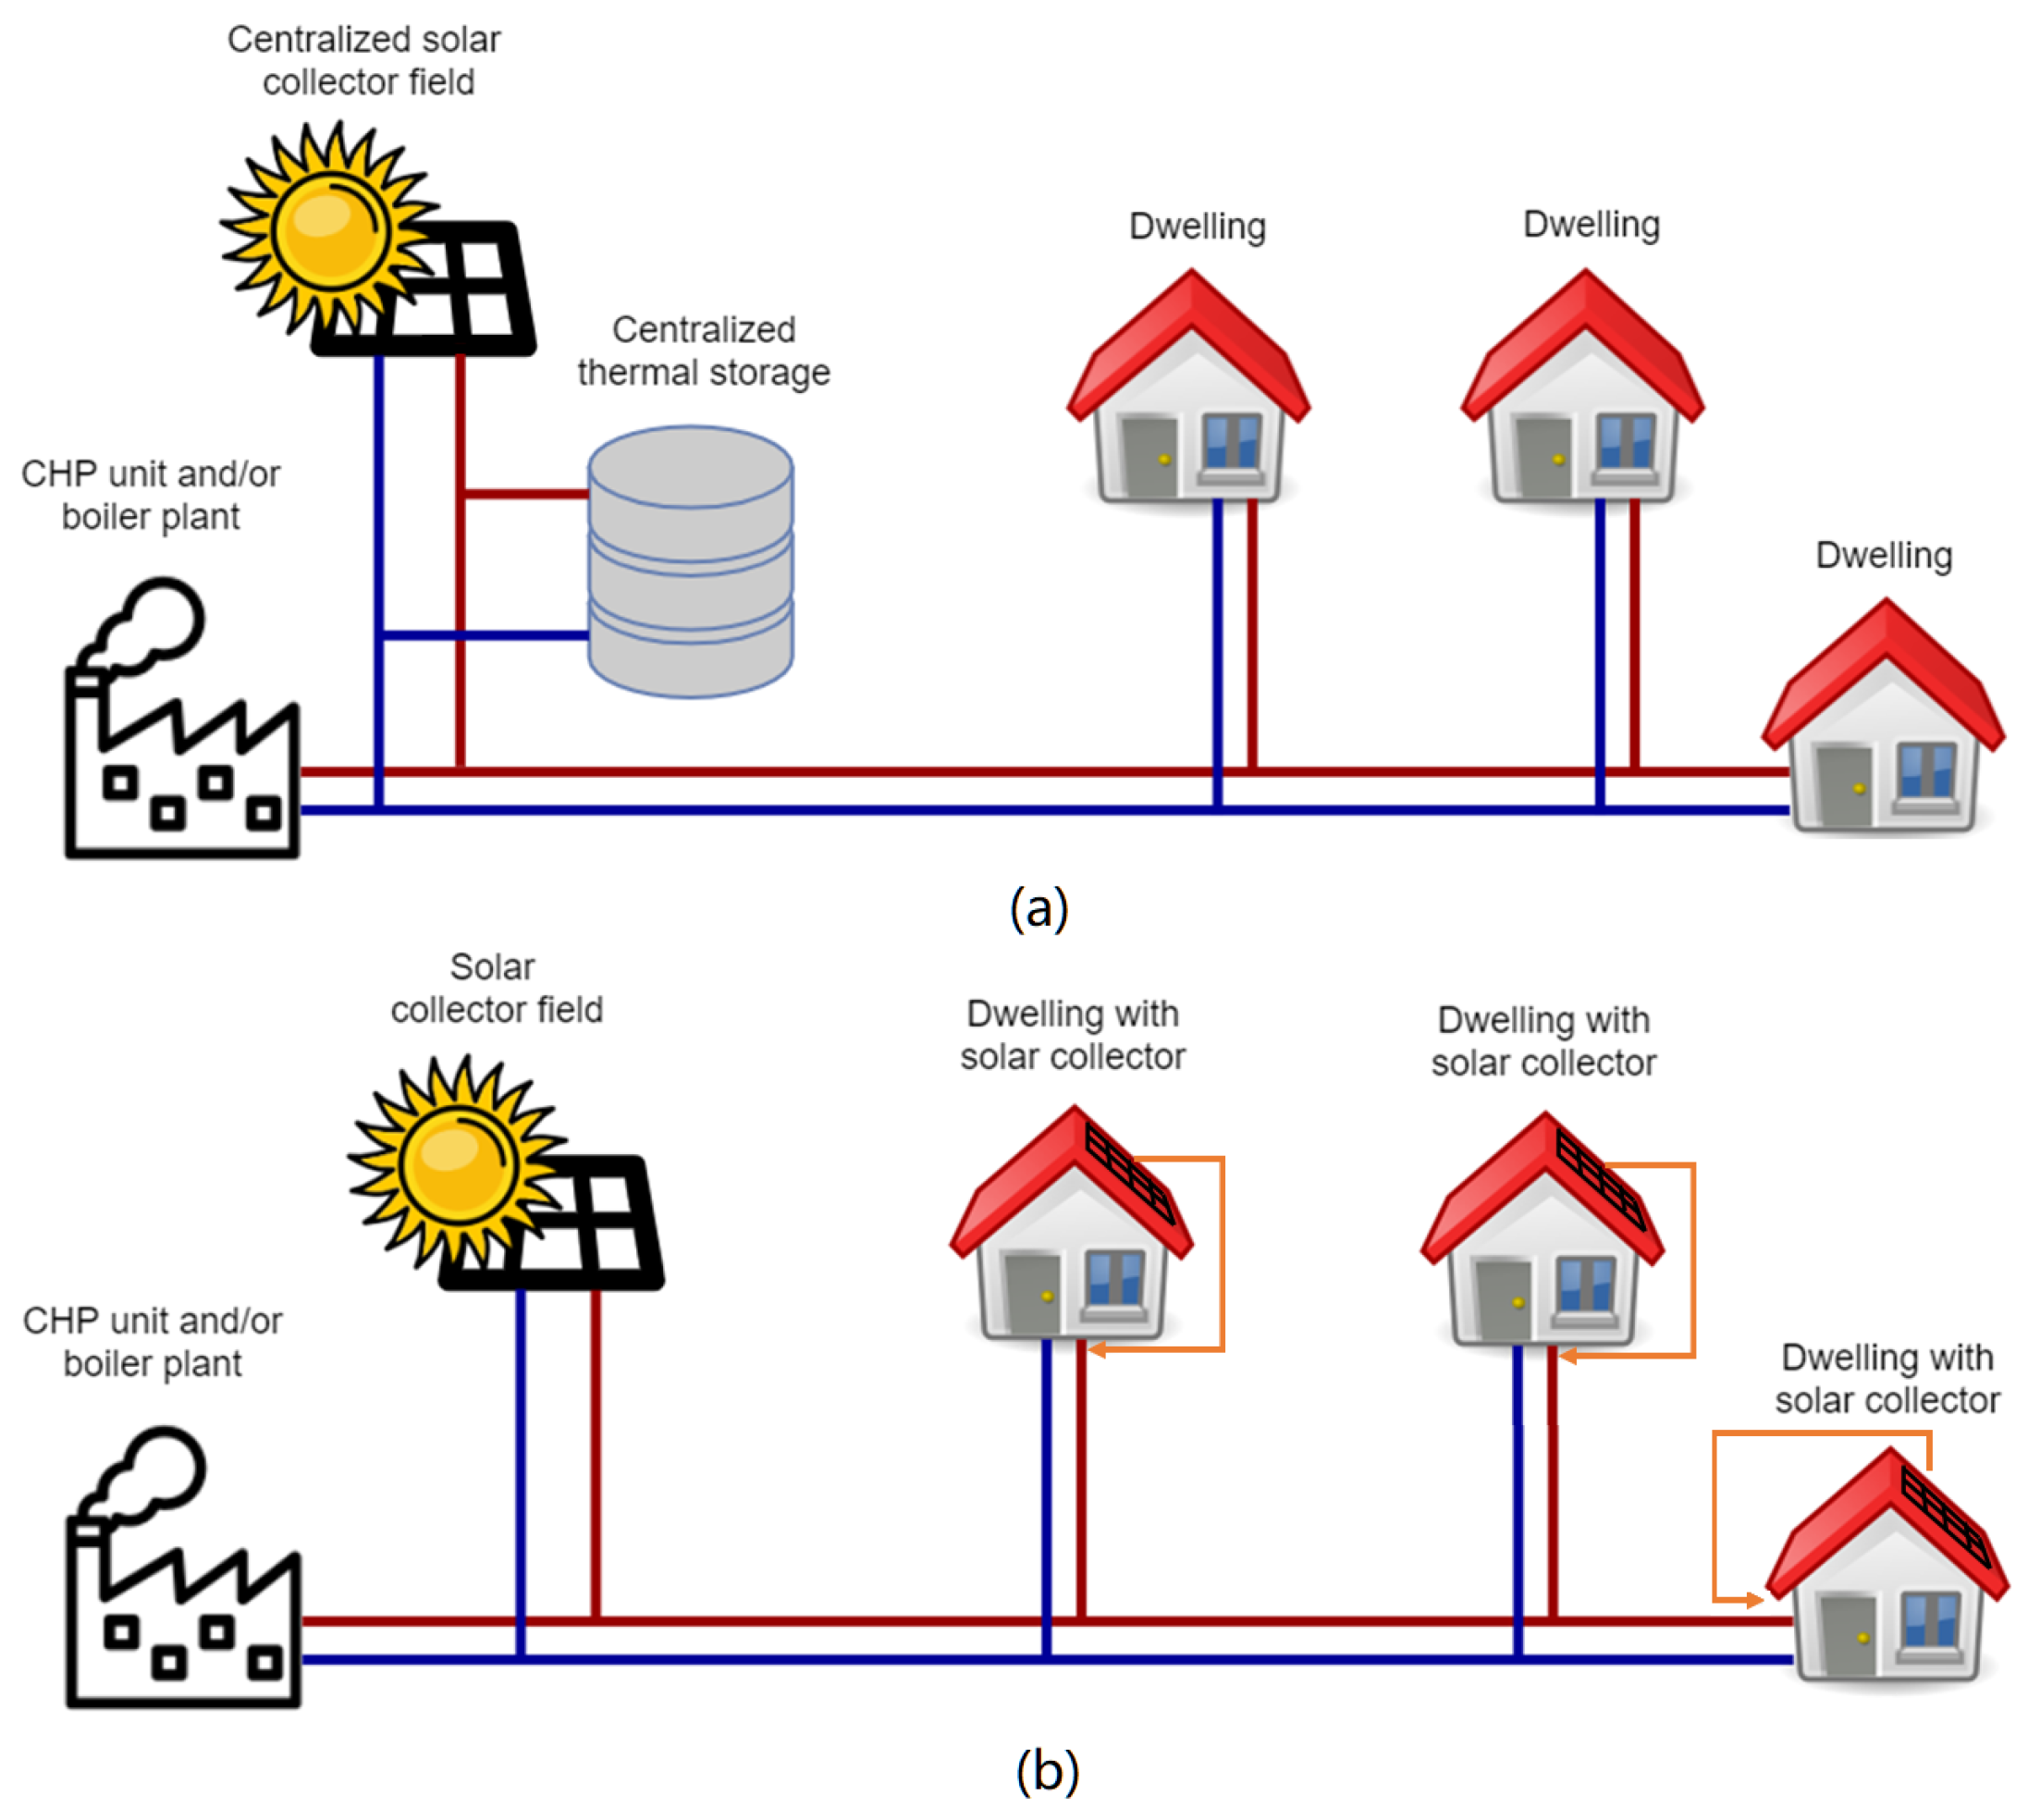
5.3.1. Centralized Solar DH Systems

Due to the seasonal mismatch between solar activities and heat demands, the combination of a large-scale Central Solar Heating Plant with a Seasonal Storage (CSHPSS) system has been a popular option, and the application of such strategy was found feasible at various locations: Austria [82], Germany [83], Latvia [84], Italy [85,86], Canada [87], China [88] and Spain [89] (see Table 4). Many more of these systems exist worldwide. According to [59], 260 were in operation in 2020 according. It can be seen from Table 4 that the CSHPSS system is economically feasible for the heat supply of different sizes of communities (ranging from a few houses to large cities), and at different locations (from cold to hot climates). The research in [90] further showed that larger communities provide better cost benefits since larger seasonal storage allows more direct utilization of seasonally stored heat, thus lowering the need for auxiliary heating devices. Depending on the scale of the heat supply, the sizes of the solar collectors and the seasonal thermal storages also vary significantly. Moreover, it can be seen from Table 4 that the application of most CSHPSS systems require installation of auxiliary units such as HPs, natural Gas Boilers (GB) and Short Term Thermal Storages (STTS). Among the existing systems, a remarkable case is the Drake Landing Solar Community (DLSC) in Canada [87], which has a Solar Fraction (SF) of as high as 97%. Because of this outstanding performance, the DLSC system was used as a reference for the feasibility study of other locations [91,92].
For a CSHPSS system, appropriate selections of the solar collector and the seasonal thermal storage are critical technical factors. According to [59], the combination of a flat plate collector and a parabolic trough collector is the most cost effective option in a CSHPSS system. Options for seasonal thermal storage in this design include hot water tank thermal energy storage (TTES), aquifer thermal energy storage (ATES), water pit thermal energy storage (PTES) and borehole thermal energy storage (BTES). For the selection of the seasonal thermal storage, a less clear guide could be provided since the choice is dependent on various factors such as the collector area, the total heat supply load and details of the system design etc. However, BTES was the choice of most existing systems [90].
Same as the integration of other sustainable resources, local subsidies and the energy tax for fossil fuels play significant roles in the integration of such systems due to the high initial investment. Without this support, the implementation of such systems is difficult. One typical example is the DLSC system. Although this system represents an attractive investment compared with natural gas-based systems, no such system has been built in North America due to the low natural gas price and the lack of local subsidies [93].
Table 4. Key technical information of some CSHPSS systems [82,83,84,85,86,87,88,89].
LocationLatitude Longitude CoordinatesCommunity Size/ Heating Area (m2)Solar Collector Area (m2)Seasonal Storage Size (m3)Seasonal TES TypeAuxilary Units + CapacityAnnual Supply (MWh)SF (%)Supply Temperature (°C)
Graz, Austria [82]47.07, 15.4239% demand of 276,526 residences500,0001,000,000PTESHP (100MW)935,00020120 winter
75 summer
Germany [83]~52, 13 1N.A. 455,000140,000BTESHP + GB25,0007655
Latvia [84]56.9, 24.120,000 residences72,900438,000TTESN.A. 423,7007866 winter
62 summer
Naples, Italy [85]40.85, 14.36 family houses4.42 27.2 2BTESSTTS (0.4 m3) + GBN.A. 44055
DLSC, Canada [87]50.73, 113.9552 houses229334,000BTESSTTS (240 m3)646,6729737–55
Chifeng, China [88]42.26, 118.89200,000 m2 residential area1002500,000BTESExcess heat supply42,000N.A. 445–55
Florence, Italy [86]43.77, 11.262 buildings
299 dwellings
10003800TTESHP + GB11424466
Barcelona, Spain [89] 341.35, 2.1740 buildings
1120 dwellings
700032,100TTESGB4225N.A. 450
1 The conclusion is drawn based on a typical German city. Berlin is thus used to estimate the coordinates; 2 In this case, the optimal sizes for solar collector field and thermal storage are obtained per unit heat supply; 3 The parameters from the minimum impact (environmentally optimal) solution are used; 4 N.A. means those values are not available/specified in the paper.

5.3.2. Distributed Solar DH systems

Compared with centralized DH systems, less research attention was paid on distributed DH systems. In [94], the integration of solar heat to a local DH system in Finland with both centralized and distributed configurations was investigated. The results showed that the performance of the distributed system is much lower than the centralized one in terms of euro/MWh of produced solar heat. However, the space for centralized large-scale solar panels is not always available. When space is limited, the distributed solar DH system was also shown to be an energy efficient, sustainable and economic alternative, especially with LTDH systems [95,96]. In [97], the possibility of integrating a solar thermal system (including thermal storage tank) as a sub-network in an existing CHP based DH system in Germany was evaluated. The results showed that the solar assisted sub-network could be self supportive and thus be isolated during summer months. The back-up boiler which was necessary in the original system could also be efficiently eliminated in the new configuration. In [98], the simulation of a distributed solar DH system generated similar conclusions as in [97]. It was shown that the prosumers produce more heat than they need during the summer period, the thermal network could therefore operate as an autonomous micro-grid in summer.
The fundamental premise of the distributed solar DH system is that prosumers could use the DH network as a virtual thermal storage and release excess solar thermal energy into the DH network for later use when it is needed. For the design of a distributed solar DH system, the feed-in connection between the distributed solar thermal (ST) collector loop and the DH network is one of the most important technical factors. If the temperature difference between the charging flow and the DH flow is considerable or if the cyclic charging is too frequent, the induced fatigue would create cracks in the underground pipes. The Return/Supply (R/S) feed-in principle (see Figure 8), in which water from the DH return pipe is heated up by the ST collector and pumped back to the DH supply pipe, was the choice of most systems since it largely avoids pipe fatigue break. However, to provide a stable required feed-in supply temperature and a feed-in heat power equal to the heat output from the ST collectors, advanced control is required. For existing distributed solar DH systems, oscillations in the supply temperature and the feed-in mass flow, which are the results of a poor control strategy, have been identified as one of the major problems [81,99,100]. In [99], two possible system layouts for robust R/S feed-in were proposed: a temperature—controlled system, which is enabled by a short circuit including a two-way-valve and the use of a model predictive controller, and a flow—controlled system, in which the feed-in flow and heat-power are controlled by a pump and a two-way valve in the main feed-in circuit. In [100], analysis of the supply temperature under different climate conditions showed that the cloud cover has a significant impact on the stability of the collector outlet temperature. TRNSYS simulation results of a test case from the same study indicated that to reduce the supply temperature fluctuations, a short waiting time of the three-way valve which controls the fluid temperature supplied to the DH network is necessary. However, additional fluctuations caused by continuous operation of the valve should also be properly addressed. Due to the complexity of the advanced control in the R/S feed-in, the R/R feed-in (Figure 8) was also adopted in some systems. In the R/R feed-in, simple control is sufficient since it only requires a constant flow rate [81]. Note that in a R/R feed-in system, the temperature in the DH return line will be increased by the ST collector. This is undesired in some DH systems, such as CHP-based DH systems, where increased return temperature decreases the overall efficiency of the heat production plant.

5.3.3. Selection of Solar Energy Technologies in DH Systems

Since solar energy can be utilized via different technologies, i.e., solar thermal (ST) collectors for heat production, photo-voltaic (PV) panels for power production, and photo-voltaic thermal panels (PVT) for both power and heat production, the question of which technology is the best to use arises. Given the natural geographical dependence of solar energy and DH demands, it is not surprising that no absolute answer could be provided for such a question. It is, however, feasible to evaluate what is the ‘best local fit’. In Table 5, the comparisons of various solar technologies in several DH systems at different locations are summarized. It can be seen that the the optimal solar mix is dependent on the location, system operating temperature and the selected objective functions. For LTDH systems, electrical based (PV/PVT) DH systems in all comparison studies are shown to perform better than thermal based (ST) systems in terms of life cycle cost, payback time and system technical performance. Furthermore, the P2H (power-to-heat, more specifically, using power generated by PV panels to generate heat by using HP) concept was studied in [101] and the results showed that indeed the P2H concept can increase the overall system efficiency or economic feasibility of a solar assisted DH system.
Table 5. Review on the comparison of different solar technologies in some DH systems [102,103,104,105].
LocationCompared TechnologiesEvaluation CriteriaSupply TemperatureMajor Conclusions
University of Bari, Italy [102]PVT, PV, ST (ETC 1)Economic (PBT 2)80 °C
  • PV system is the optimal option in PBT
  • PVT has a PBT 2.7 times longer than PV
  • ST system has a PBT 2.3 longer than PVT
University of Bari, Italy [102]PVT, PV, SC (ETC)Environmental (CO2 Reduction/year)80 °C
  • PVT system brings the best environmental benefits
  • PVT system displaces 0.16 and 1.4 times more CO2 than PV system and ST system, respectively
Multiple locations [103]100% PV, 100% ST, A mix of PV&STEconomic (LCOE 3), Technical (overall performance), Environmental (CO2 emissions)100–400 °C
  • A mix of technologies (not solely ST or PV) in a side-by-side configuration improves the performance, the LCOE and the environmental payback;
  • The use of PVT instead of PV in the side-by-side configuration helps to improve the SF and reduce the ST collector area, which is often a limiting factor
Latvia [104]PVT, PV, SCEconomic (NPV 4, LCOE, PBT) Technical (SF) Environmental (CO2 cost)63.7 °C
  • ST is the most desirable solution for the tested cases
  • PV/PVT + HP is more favorable if the operation temperature is 10 ◦ C lower since the power generated by the PV/PVT can be used by HP to increase the temperature level
Finland [105]Decentralized PV, Centralized PV Decentralized ST, Centralized STEconomic (PBT), Technical (OEF 5), Environmental (REF 6)DHW: 58 °C SH: 27–40 °C
  • Decentralized PV system (PV used as the energy source to generate heat by running HP) outperforms the other three systems
1 ETC: Evacuated Tube Collectors; 2 PBT: Payback Time; 3 LCOE: Levelized Cost of Electricity; 4 NPV: Net Present Vale; 5 OEF: Onsite Energy Fraction; 6 REF: Renewable energy fraction.

5.4. Excess Heat

Excess heat in the DH context includes industrial surplus heat and urban waste heat, i.e., heat from data centers, metro stations and other public buildings. Great potentials were identified for both industrial surplus heat and urban waste heat in DH. However, the potentials are far from fully exploited. Compared with other renewable resources, there still exists significant barriers for the inclusion of excess heat in DH systems, as shown in Table 3. One unfortunate situation is that explicit incentives for renewable resources are creating unnecessary competition between renewable resources and excess heat as DH heat sources [62,106].
Including industrial surplus heat in the DH system is, according to [107], with great political interest, great potential and high profitability. The high potential of industrial surplus heat was investigated and confirmed at various countries and locations [21,108,109,110]. Unfortunately, this great potential is mostly untapped. The most common obstacle for the inclusion of industrial heat in DH is the concern of supply security (such as unexpected shut down or decreased activities of the connected industries) from DH operators [61]. This concern, however, was proven to be exaggerated. After an assessment study of 107 excess heat recoveries in Sweden, Lygnerud and Werner [107] concluded that only a small proportion of industrial heat recovery has been lost in Sweden because of terminated industrial activities. An actual technical barrier requires further research is the mismatch between the production and consumption. To eliminate this barrier, the use of seasonal heat storage was considered and evaluated [111,112]. However, the results showed that this strategy is not yet viable due to technical risks and immaturity of current material technology. The annual charging cycle, which is crucial for a seasonal thermal storage, is rather low in the investigated cases, which makes the investment on seasonal heat storage unprofitable. It was also shown in [111] that existing materials used at the inner walls of the seasonal heat storage are either too expensive or not mature enough to guarantee expected lifespan. Another limiting factor for the use of industrial surplus heat is the distance between the factory location and the residential area. Since most DH systems considering connecting industrial surplus heat are nearby regions, the estimated consumption is usually lower than available heat supply. This results in long payback time and thus infeasible conclusion. As can be seen from Table 6, all the DH systems supplied by excess heat are within 4 km of the factories. However, the study in [113] showed that the maximum DH feasibility threshold distances can be actually longer than the ones listed in Table 6 (it may reach up to 30 km for waste heat flows of 30 MW in Austria). This indicates that there is large room for direct inclusion of industrial surplus heat in DH systems. What is missing is more regulations, incentives and obligations to enforce the feed-in of industrial surplus heat [114].
Table 6. Key information of some excess heat based DH systems [112,115,116,117].
LocationIndustryDistance to DH NetworkSupply Temperature
Jutland, Denmark [115]Meat processing plant3.2 km73 °C
Chifeng, China [116]Copper smeltery
+ cement plant
3.5 km25–80 °C
(cascade supply)
Linz, Austria [112]Steel millInside city boundaries97 °C
Hamburg, Germany [117]Copper smeltery3.7 km70–90 °C
Barcelona, Spain [117]Waste treatment plantInside city90 °C
Urban waste heat recovery, namely recovering the low temperature heat from urban sources for DH use, was shown to have the potential to cover 10% of residential heat demand in Europe [118]. However, at present, this application is not widespread and is an immature technology, according to [62]. Nevertheless, increasing interests were shown in demonstrating the effectiveness of low grade excess heat recovery, especially in data centers [119,120]. In general, the waste heat recovery solution in data centers is suffering from its economic viability. To improve the efficiency of reusing data center’s waste heat, high initial investment is required for upgrading the existing chillers and installation of thermal storages [121]. However, this high investment essentially decreases the economic viability of the excess heat recovery solutions. To date, most data center heat recovery projects for DH supply are located in cold climates such as Denmark and Finland.
To sum up, the excess heat recovery in both industries and in urban sectors require policy incentives. For industrial surplus heat, despite with still existing technical barriers, large room is available for its direct use in DH. Urban waste heat recovery solutions require further pilot projects to demonstrate technical and economic feasibility. Therefore, industrial surplus heat should be integrated into the heat atlas with information of the heat grade for regional DH potential evaluations. The inclusion of urban waste heat could be implemented later when the technology is proven to be mature.

5.5. Unlocking More Heat Sources with the Use of HPs

In the definition of the 4GDH concept in [10], the importance of HPs in future DH systems is clearly indicated as they enable efficient integration of more renewable resources and help to unlock more low temperature surplus heat. This was also clearly revealed on Table 3, where the exploitation of the majority of identified renewable resources (more than 70% of geothermal, solar PV + HP being the optimal solar DH configuration) and excess heat potentials (almost half of industrial surplus heat and 100% urban waste heat) were shown to be reliant on the use of HPs. Depending on its location in the DH system, a HP could be centralized, in which case it would be located close to the source of large-scale heat resources to increase the feed-in temperature of the heat sources to the DH network. Alternatively, it could be distributed, in which case it would be close to end-users to increase the fluid temperature from the DH network to the required level for the consumers. Centralized large-scale systems have the advantages of higher flexibility in heat supply, possibilities to integrate higher proportions of renewable energy, potential to make use of strategically advantageous heat sources and use of surplus electricity at lower costs [122]. Compared with centralized systems, decentralized small-scale systems have the following advantages [123]: (1) significant reduction on thermal loss, (2) low and even electricity demand if HPs are supplied only for DHW, (3) possibility to connect with more low temperature local heat sources, thus increasing supply reliability and reducing the dependency on the primary network. Just like solar DH systems, some researchers performed techno-economic evaluations for centralized and decentralized HP systems, attempting to figure out which system is better than the other [122,123,124,125]. However, since the evaluation results of HP installations, either centralized or decentralized, rely heavily on the price and generation mix of the electricity and the temperature of available heat sources, different conclusions were drawn for different test cases. In this section, the focus is placed on the integration of centralized large-scale HPs in DH systems. The use of decentralized HPs in DH systems is dependent on the overall system design, such as the operating temperature and the design of substations. Therefore, it will be covered in the next section together with the DH system design.
As stated in [126], the current technology developments of HPs are mature enough for large scale application in DH systems. Large-scale HP installations were identified across Europe in various countries: 120 units ranging between 1 and 50 MW in Sweden in 2017, 31 installations in Denmark, 2 geothermal based HP units in operation in Milan between 2010 and 2011, and several installations in Norway and Finland [122]. The expansion of large-scale HP units started from 1980s when large amount of surplus electricity was available from nuclear plants in Sweden. A dilemmatic fact is that the low electricity price of Sweden in the 1980s and onward also led to an expansion of individual HPs installed at small, private houses. This made HP a competitor from most DH operators’ perspective [127]. However, this competition was proven to be unnecessary. The research in [128] showed that the combination of HPs and DH is an important step toward low C O 2 emission targets. The current technology of neither centralized (large-scale) nor decentralized (small-scale) HP schemes are superior enough to replace the DH systems in Sweden. For the development of large-scale ground source-based HP systems, large physical space that is required to cover energy wells is unavailable [129]. The integration of distributed HPs was found to be limited by the capacity limit of the power grid in the investigated system [130].
In other countries, the developments of large-scale HP-based DH systems were also shown to have great potentials. It was concluded [131] that potential heat sources for HPs for DH are present near almost all DH areas in Denmark. A further assessment [132] showed that introducing HPs in Denmark has the potential to produce between 2 and 4 GW of thermal power and a total potential benefit of around 100 M€/year in 2025. The study in [133] proved that it is feasible to integrate large-scale HPs in the DH system of Greater Copenhagen. The viability of introducing large-scale HPs in existing Finnish DH systems was also investigated in [134]. The results indicated a much higher amount of viable HP-based DH systems (10–25%) compared with the current situation (3%) in Finland. The work in [135] also shows a significant increase in the use of HP in the Helsinki region in the future low-carbon scenario. The work in [136] indicated that HP might be a viable solution for the replacement of current biomass-based DH systems which are operating unprofitably in the rural area of Austria. This result is, however, dependent on the price of biomass resources. A similar result is found in [137], in which the application of industrial HPs in the UK is limited due to the gas price being lower than the electricity price.
Major heat sources in existing HP-based DH systems are: sewage water, ambient water, industrial waste heat and geothermal energy, as shown in Table 7. Large capacities of sewage water sourced HP systems are mainly found in big cities due to their ability to manage the reuse of sewage water. For a sewage water sourced HP system, special attention should be paid on the fouling problem. It was shown in [138] that the fouling problem in the heat exchanger results in serious reduction of efficiency in a HP when sewage water is used as the source. Ambient water mainly refers to saline sea water, lake and river water. So ambient water sourced HP systems are generally used, and should be considered in future in regions close to the sea or river. In future DH systems of Denmark, sea water was identified [131] as the main heat source for HP-based DH systems. For geothermal and excess heat, as discussed above, most of their identified potentials are dependent on HPs but only a small portion were unlocked. Large space is available for their future use.
To conclude, large-scale HP-based DH is a mature technology. Sources that could be mapped on the heat atlas for HP use include: sewage water, ambient water, industrial waste heat and geothermal energy. Urban excess heat is a future candidate.
Table 7. Major heat sources for existing HP-based DH systems in Europe [122,126].
Heat SourcePercentageTemperatureDevelopment Barriers
Sewage water56%12–20 °CDecreased HP performance due to fouling [138]
Ambient water24%2–14 °CAvailability
Excess heat8%15–40 °CLow technical maturity [59]
Geothermal heat4%10–20 °CLarge physical space required for energy wells [129]
Others8%N.A.

6. Optimal Planning and Design of Future DH Systems

To answer the second research question about the state-of-the-art on the optimal planning of DH systems, three related topics are discussed in this section. First, general methodologies for the optimal planning and system design of DH networks are reviewed in Section 6.1. Then, novel configurations that emerged in recent years are discussed in Section 6.3. Finally, measures to upgrade existing DH systems are summarized in Section 6.4.

6.1. Methodologies for DH System Design

The optimization of the spatial layout of DH pipes has been the main content for the DH topology design. In general, spatial layouts of DH grids are designed according to one of the following three topologies [139], as shown in Figure 9:
  • The radial grid, which comprises a single centralized heat production plant. Thermal energy is transported from the heat production plant to buildings by a unidirectional flow.
  • The ring grid, which contains a closed loop and allows multiple heat sources.
  • The meshed grid, which involves multiple closed loops in the network by introducing additional lines. The additional lines provide a high security of the supply and allow the flow to be bidirectional.
Figure 9. Grid topology for DH systems, adapted with permission from [139]. 2022, Justus von Rhein.
Energies 15 07160 g009
Historically, the shortest route which connects all the users to the heat producer has been the basis for DH network design. Current DH systems are still very often designed based on this concept [140,141]. The shortest DH route can be identified by using graph theory algorithms to solve the well-known minimum spanning tree (MST) problem. The wide application of this concept is due to the intuition that the shortest route minimizes the distribution capital cost, which dominates the distribution cost of a DH system, as shown in Figure 2. However, prior work has shown that the shortest route does not necessarily lead to the minimum initial capital cost or operation cost [142]. Besides, new DH systems are characterized by distributed heat sources and thermal units, optimal planning and sizing of heat production plants and thermal units is also a major task in future DH systems. The shortest route apparently does not guarantee an optimal solution for the selection and sizing of heat source plants and thermal units. Furthermore, potential trade-offs between initial capital cost and energy performance are not considered when the shortest route is used as the only standard. For large infrastructure projects like DH, the system design should be optimized based on long-term planning to ensure the development is beneficial for society in the long run. For this, life cycle cost (LCC), which accounts for both the annualized capital cost and the operating cost, is a more suitable indicator. The problem in this context is quite often formulated as a Mixed-Integer Programming problem. Given the natural non-linearity of the involved physics, the complete form of the LCC optimization is then a Mixed-Integer Non-linear Programming (MINLP) problem. Due to the complexity introduced by the non-linearity, the MINLP is usually simplified as a Mixed-Integer Linear Programming (MILP) problem by either simplifying or linearizing the involved physical models [142,143,144,145]. The results from [142] demonstrated that engineering design parameters related to pipe sizing, heat losses and pumping energy have significant influence on the total LCC. When those parameters were included, a reduction on the LCC was obtained compared with approaches which only considered capital or operating costs. In [143,144], MILP models were formulated to identify the optimal selection of the system components among available candidate technologies in decentralized DH systems. In [145], the shortest route concept was implemented in a MILP model for DH network optimization. First, buildings were divided into clusters based on the MILP model. Then, the optimal route within each cluster was identified by using MST algorithms.
Except for solving the MILP problem, heuristic approaches could also be used to perform the LCC analysis [139,146]. In [139], the optimization problem was solved based on an exhaustive search approach. Simulations were run on various connection scenarios, which were identified from the MST algorithms. The cost for each scenario was then computed and analyzed to find the optimal solution. In [146], a multi-objective problem, which considers not only the involved capital cost but also the equivalent C O 2 emission cost, was solved by decomposing the problem into three steps: the first step plans the network based on a MST algorithm, the second step designs the generation and renovation planning for the designed network from the first step and the last step simulates the operation. Based on the operation simulation, the cost for the designed configuration was computed. This process was then iterated to find the optimal solution.
To account for the non-linearity of the problem, some work attempted to solve the MINLP problem [147,148]. In [147], the problem was split into sub-problems to obtain the optimal option for the desired parameters: the sizing of the plant, the allocation between heat and power production and the topology of the DH network. The proposed approach was applied to academic cast studies which consist of one definite consumer and seven potential consumers. In [148], the model was applied to the optimal system design of a DH network with one producer and four consumers. It can be seen that both work limited their application in small networks with few users. This is a direct consequence of the high computational cost of the MINLP model. In [149], an adjoint-based numerical optimization strategy was proposed to perform the optimization. To avoid the high computational cost, consumer constraints were aggregated. At the same time, a numerical continuation strategy was applied to force continuous design variables towards discrete design choices for simultaneous optimization of network topology and pipe sizes. The model was applied to the optimal system design of a fictitious DH network with 160 users. The results from this work also emphasized the importance of considering the non-linear transport model in the design phase: a variation of 72% in the consumer flow rates was induced by the temperature variation.
It is evident that models for the optimal planning and system design of DH networks still require further development. Existing numerical models are mainly suffering from the high computational cost due to the large-scale of DH systems and non-linearity of the optimization problem.

6.2. Numerical Tools for Optimal Planning and System Design of Future DH Networks

The design, dimensioning and cost evaluation of a DH system requires knowledge of all above-mentioned topics. In general, different software tools are employed to solve related sub-problems on different topics. It is common to use numerical models to predict the thermal-hydraulic behaviour of the DH network, and then perform the system optimization based on scenario analysis. In this context, numerical tools such as Modelica [150] and Matlab/Simulink [151] could be used to provide the thermal-hydraulic performance of the system for further optimization. This process is usually time-consuming, inapplicable to other systems, and requires the designers to have in-depth understanding of the system. To overcome these challenges, some integrated frameworks and numerical tools were proposed for the optimization process.
The basis of most DH system design frameworks and tools is the above-mentioned methodologies in Section 6.1. In the project QUARREE100 [152], an optimization framework based on a flexible MILP formulation was proposed to investigate the impact of distributed thermal storages on the DH system design. The framework was programmed in Python as open source tool DHNx. In this framework, geospatial information from OpenStreetMap is used to identify potential routing options. Existing Python open source libraries were employed to perform system simulations and to optimize the network. In [153], a framework was established by combining Modelica simulations and modules from open source Python libraries. In the framework, Modelica is used to perform the thermal-hydraulic simulation and the open source Python module Pyomo is used to solve the MINLP model. This elegant combination of the efficient numerical tool Modelica and the complex optimization algorithm MINLP was shown to be rather reliable for continuous optimization of a virtual DH system. In [154], a framework was built using a thermal-hydraulic model in MATLAB to perform a holistic energy and economic analysis of the DH system. Geo-spatial data of the district and buildings was obtained from GIS, and district demand profiles were generated by using the simulation tool CESAR. In this framework, holistic energy and economic analyses were performed based on scenario comparisons.
In addition to the above-mentioned frameworks that combine different numerical tools in a systematic way to achieve an optimal design of the DH network, some software was also developed by assembling different tasks in one tool. This includes THERMOS [155], Comsof Heat [156], URBio [39] and Termis [157]. THERMOS a is free, web-based tool for optimal local district energy planning. It is based on a high-resolution address-level mapping and accurate energy demand estimation. The tool allows for instant feasibility evaluation of DH construction, identification of optimal spatial layout and optimal sizing of available heat sources and thermal units. Comsof Heat is a GIS-based DH planning and design software. In [158], Comsof Heat was used to investigate the optimal planning of a DH system with more than 2300 buildings in a neighbour of Nijmegen. URBio adopts an iterative and interactive optimization process. An initial solution is first presented to the decision makers for exploration and learning. Users preferences are then considered in the optimization model by updating the objective function and constraints in the MILP model. This process is repeated until a satisfactory solution is found. Termis is a commercial tool and has a long history of being used for planning and system design for DH networks. A simple MS Excel based tool developed by Ramboll named District heating assessment tool (DHAT) [159] could also be very useful for the optimal planning of DH systems. Compared with above-mentioned tools, DHAT is specifically designed for feasibility evaluation, and is therefore recommended to be used for screening projects and not for a final heat planning.

6.3. Novel Configurations for Future DH Systems
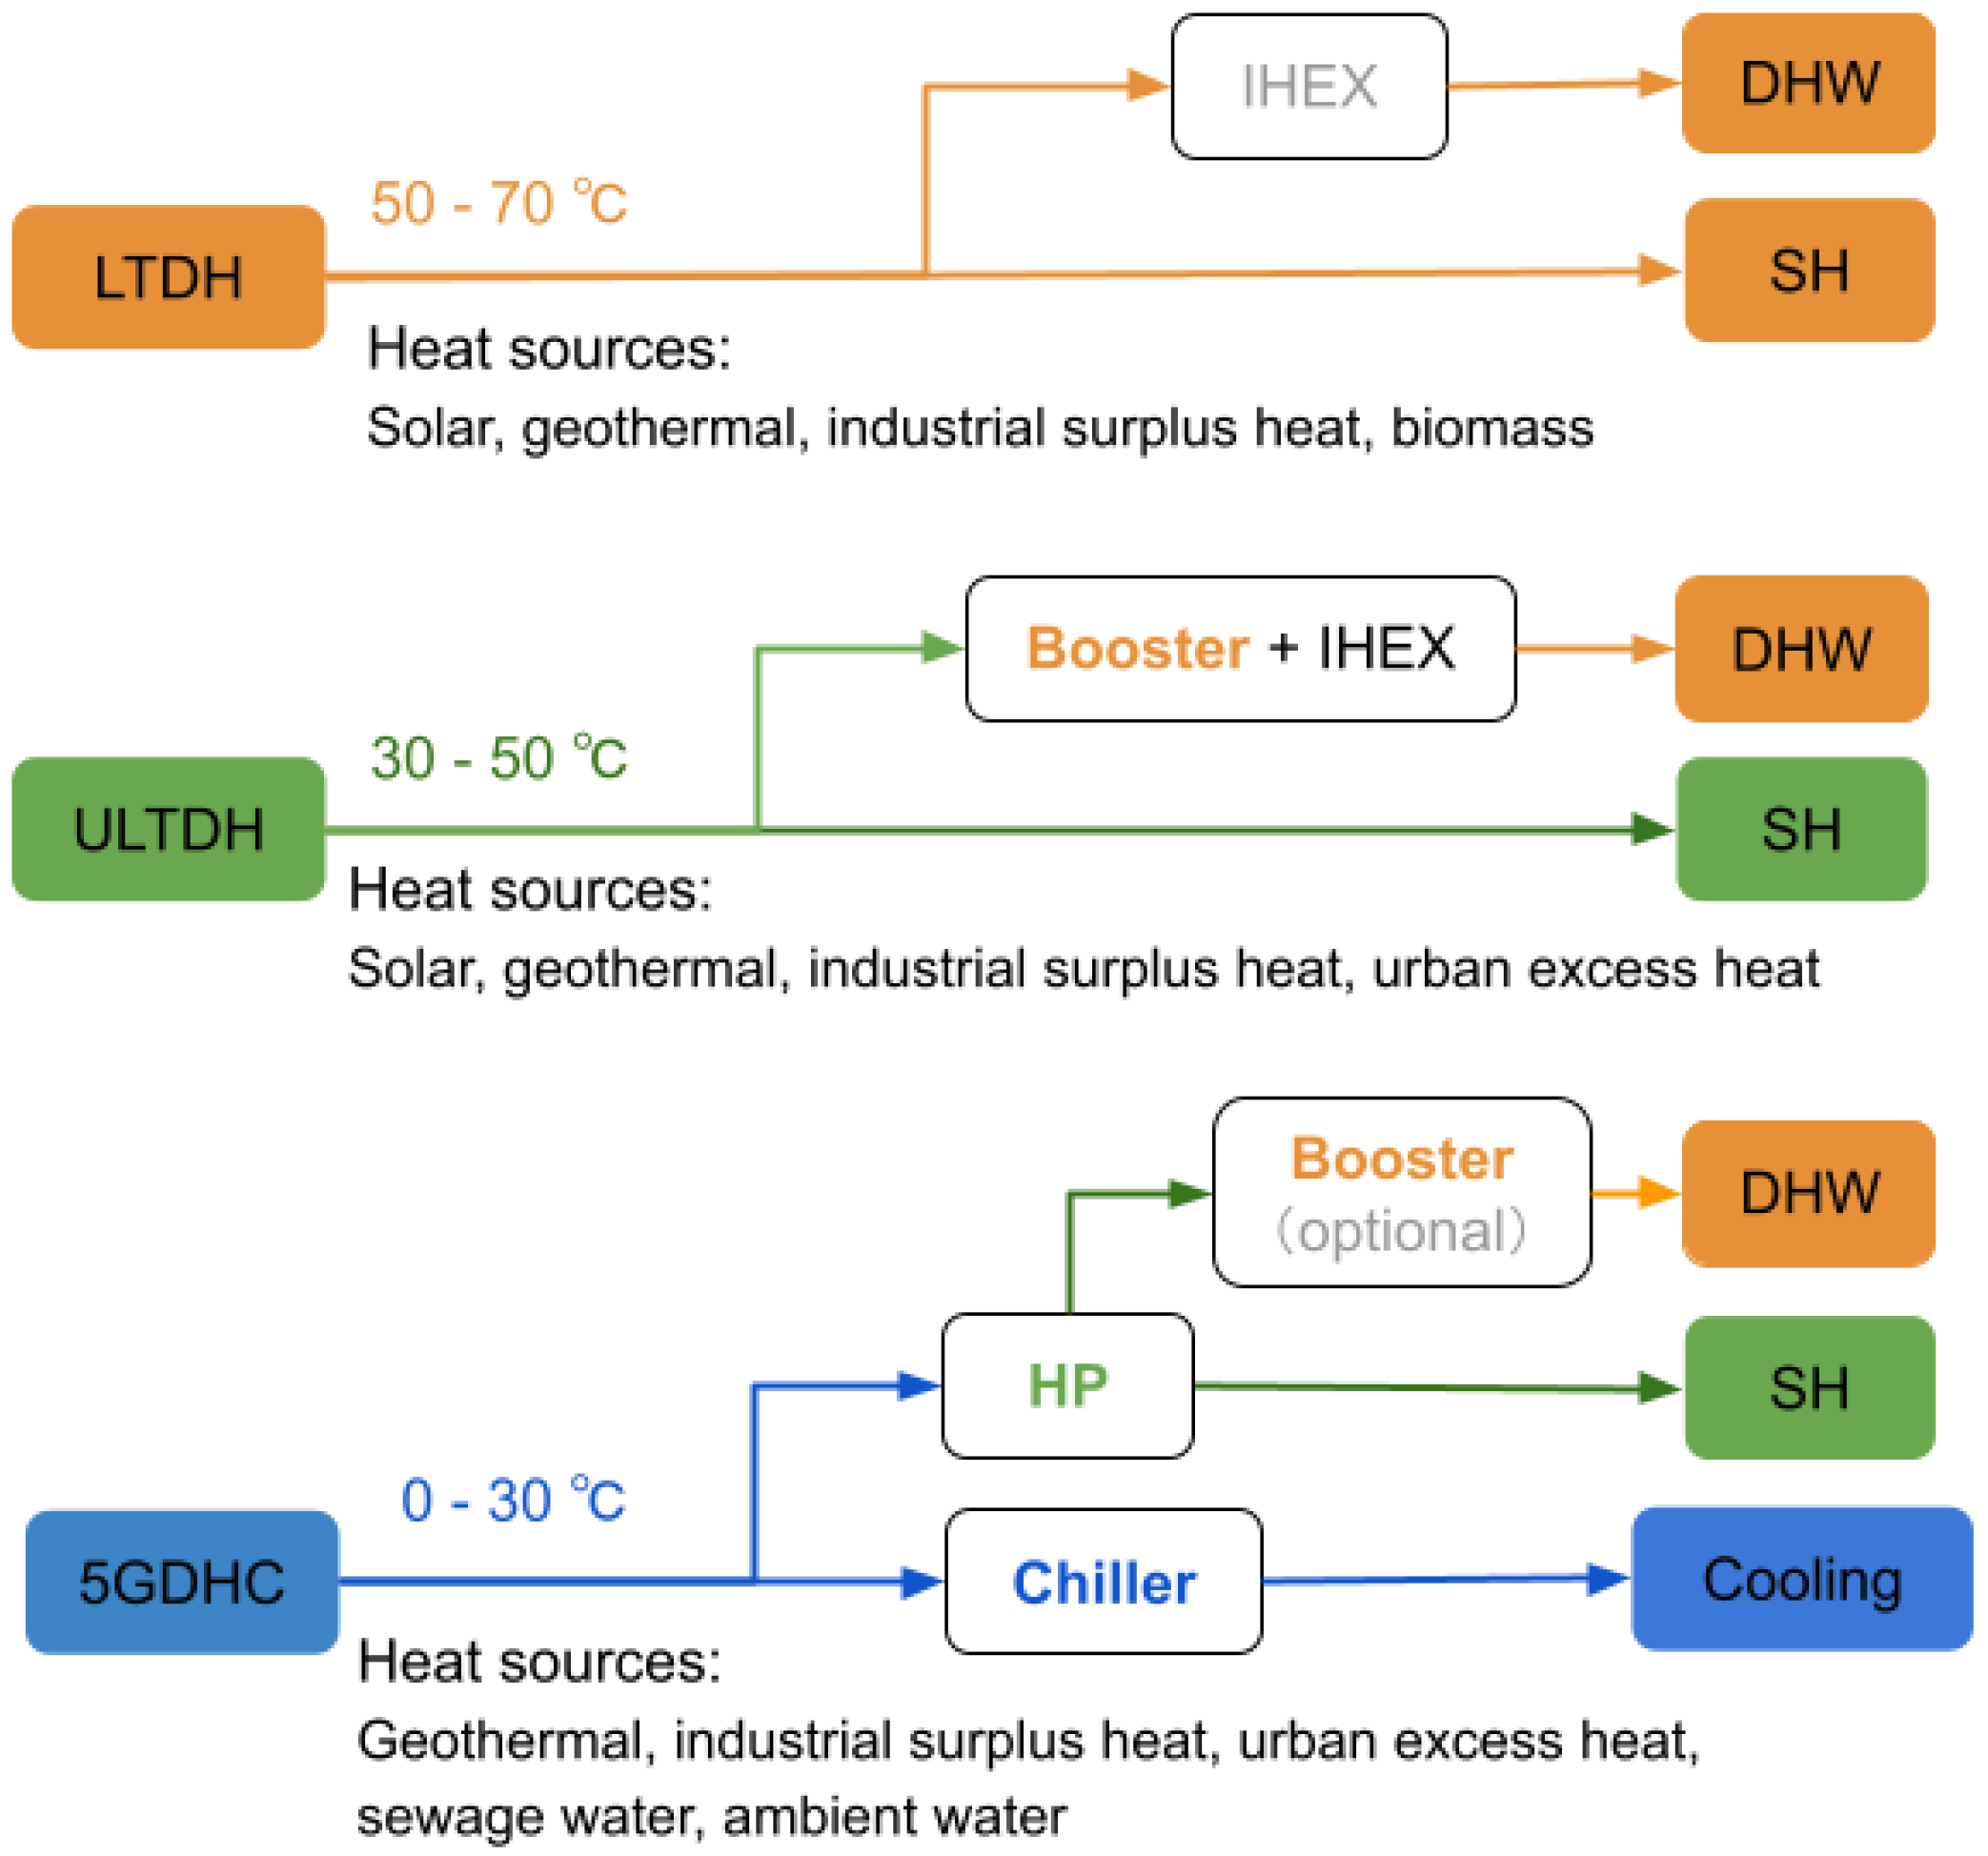
The rapid development of DH in the last few years resulted in various solutions for the heat and cold supply, while the technology of 4GDH is still under development, the concept of “5th generation district heating and cooling (5GDHC)” was already introduced. In [16], an explicit definition of 5GDHC is given and a detailed review on 40 5GDHC systems under operation in Europe is presented. However, the author of the original definition of 4GDH argued in [9] that the term “5th generation” would seem to suggest that the 5GDHC represents a sequential or serial development from 4GDH, indicating fundamental improvements on the system energy efficiency, which does not seem to reflect the reality. The author suggested to regard 5GDHC as a sibling of other technology options in the 4GHD family. In this article, we differentiate systems based on their system configurations and the corresponding operation temperature ranges.
A summary of the temperature levels used for three different configurations of a DH system, i.e., LTDH, ULTDH, 5GDHC, in the investigated articles are plotted in Figure 10. It is obvious that the temperature levels represented by the same term can differ a lot. In our work, the temperature levels are consistent with those used by most researchers, i.e., LTDH, ULTDH and 5GDHC represent DH systems with supply temperatures of: 50–70 °C, 30–50 °C and 0–30 °C, respectively. A more detailed sketch of the temperature levels in the three configurations is shown in Figure 11. The following featured configurations were identified as novel configurations: 5GDHC, ULTDH, non-uniform temperature district heating (NUTDH), and triple-pipe district heating system.
Figure 10. Summary of temperature levels in different category in the literature [16,138,159,160,161,162,163,164,165,166,167,168,169,170,171,172,173,174,175,176,177,178,179,180,181,182,183,184,185,186,187,188,189,190,191,192,193].
Energies 15 07160 g010

6.3.1. ULTDH

As can be seen from Figure 11, an ULTDH system operates at a lower temperature level than a LTDH system. Such low temperature level was proven to be high enough for direct SH supply for most of the residential buildings [163,169]. Temperature levels from the DH system are boosted up by extra units such as auxiliary heaters or HPs at each individual residence for the DHW supply. For DHW, Legionella bacteria has been and is still the central concern. Since a DHW temperature below 50 °C yields high concentrations of Legionella bacteria [169], the supply temperature has to be at least 50 °C. This is also clearly reflected in Figure 10, where the majority of the research took 50–55 °C as the dividing temperature between LTDH and ULTDH. In a LTDH system, a distributed substation with an instantaneous heat exchanger (IHEX) for the DHW preparation is sufficient [161], but in an ULTDH system, the design and control of the decentralized substation at each connected house can be more complicated. The design of a micro HP [168] and the combination of a micro tank and an immersion electric heater [161] were shown to function well for ULTDH systems. To control the return temperature, advanced control like model predictive control is required in an ULTDH system [180].
Compared to LTDH, ULTDH has the benefits of easier access to more sustainable heat sources and smaller distribution heat losses. However, the introduced capital costs on the distributed boosting units for DHW might hinder its economic feasibility. As illustrated in Figure 2, the economic feasibility of an ULTDH system is highly dependent on the saved cost on heat generation and the extra cost on distributed substations. The economic analysis in [170] indicated that an ULTDH is competitive compared with individual gas boilers when a local low-temperature heat source can be recovered with minor marginal costs for the investigated case. A more interesting question is: how competitive is ULTDH compared to LTDH? For this, the system performance of LTDH and ULTDH solutions were compared in different cases [160,162,164,166]. In [160], the coefficient of system performance (COSP) for LTDH and ULTDH with CHP plants and HPs as central heat supplies were compared. The results showed that the LTDH outperforms the ULTDH for CHP supplied system while the ULTDH provides a performance increase compared to the LTDH when heat was supplied by central HPs. In the CHP plant supplied system, the booster units in the ULTDH configuration consumed more electricity than the corresponding save at the CHP plant. In [162], the comparison was conducted based on energy performance, exergy performance and economy performance for a system supplied by geothermal energy in a low-heat-density area. The energy performance analysis showed that the two configurations had similar distribution efficiency, but the LTDH system presented higher exergy efficiency than the ULTDH system. This indicates that the energy in the LTDH scenario was better allocated to satisfy the heat demand from a thermodynamics perspective. On the other hand, good economic gain was shown in the ULTDH due to the cheap marginal cost from renewable heat sources and lower distribution losses. The economic comparison of the two configurations in another low-heat-density area [164] demonstrated that an ULTDH network can be more cost efficient than a LTDH network. In [166], the influences of the boundary conditions of the supplied area and the available heat sources on the economic performance of the two systems were compared. The results again highlighted the importance of the heat generation cost on the feasibility of the ULTDH configuration. It was shown that for areas with a plot ratio of above 0.6, LTDH is the most feasible solution for new buildings in Denmark supplied by HPs. The economic feasibility of ULTDH mainly suffered from additional investment and fixed operation and maintenance cost of the decentralized HPs.

6.3.2. 5GDHC

A 5GDHC, according to [16,195], is a decentralized, bi-directional system that operates at close to ground temperature level and uses local heat pumps and chillers to satisfy the heating and cooling demand of a district, as can be seen from Figure 11. Such system has attracted tremendous attention in recent research community since it allows recovering more low-temperature energy sources, it minimizes the thermal losses due to the small temperature difference between the fluid and the ground and it provides both heating and cooling services. If those functions and strengths were fully employed, this concept will have the potential to bring the energy supply market into a new era when the synergy between the thermal and the power grid enables a more efficient energy supply. In this new era, decarbonisation target can be realized via high inclusion of renewable resources and the optimal heat and power supply by synchronizing the optimal scheduling of the two systems. However, recent research results seem to indicate that the current technologies are not sufficient to promote this concept to a larger scale yet.
The detailed economic comparison in [194] clearly indicated that 5GDHC is less competitive than LTDH and ULTDH. The low competitiveness of 5GDHC is mainly due to the involved cost of the decentralized substations, including the capital cost of the units installations and the cost of the extra power consumption of HPs and Chillers. Compared with LTDH and ULTDH, 5GDHC systems comprise a significantly larger amount of expensive substations. It was shown in [189] that for a 2400 buildings community located 2 km away from the main heat source, the high building substation cost for the decentralized HP installation made the network deploy cost of a 5GDHC system 22.8% costlier than a 3rd generation DH system. Moreover, the low temperature difference between supply and return flow in 5GDHC leads to a larger pipeline diameter, which further results in higher pumping costs per unit of supplied energy. The survey in [16] showed that the pumping energy consumption of a 5GDHC system is about one magnitude higher than in traditional DH systems. In order to reach a good trade-off between initial investment and operating cost, the network temperature difference has to be carefully evaluated in the design phase. The parametric study in [170], in which the performance of booster HPs with network supply temperature between 15 and 45 °C was investigated, showed that unless the electricity consumption for the HPs is self produced, it is always advantageous to work with the highest supply temperature in the investigated case. This reveals that the competitiveness of 5GDHC is highly dependent on how the electricity is generated. To increase the amount of self generated power, integration of solar PV panels in 5GDHC systems were investigated in several studies [181,184,185,187,196]. Although with different configurations, the Coverage Ratio (CR), which represents the percentage of electrical energy demand covered by the self-generated solar power using the PV panels, for most of the investigated systems [181,184,185,187] were found to be around 30% at the district level. If the power production from the (roof-mounted) PV panels were only used for the local HPs at individual building level, the CR value decreases dramatically even to a much smaller value [196].
To increase the competitiveness of 5GDHC, the costs of both the components installation and operation have to be reduced. Due to the large amount of substations, an appropriate equipment sizing is of vital importance to decrease the capital cost of component installations. At the same time, the complexity of the system configuration and interactions between the network and users require more advanced control in 5GDHC. For both the optimal equipment sizing and advanced control strategy, integrated simulation of the 5GDHC system models and building models is crucial and remains to be challenging [178]. In most of the feasibility evaluation work, holistic simulation tools “TRNSYS” and “Modelica” were used since they are able to perform co-simulation of the district energy system and building performances. However, the coupled district and building energy simulation is facing a trade-off between simulation performance and prediction accuracy. To obtain desired results, numerical models are usually simplified. Two common simplifications were spotted in existing numerical models [139,179,190,192]:
  • The variation of the operating temperature was not included.
  • The dynamics of thermal units are either largely simplified or simulated with low level of detail.
Those simplifications could lower the confidence level of the conclusions significantly. To fill the gap, major efforts were found on developing new numerical models for 5GDHC simulation in the last two years [173,175,186,191].

6.3.3. NUTDH

The NUTDH system uses different temperature levels to supply the SH and DHW during different times of the day. This design is enabled by the use of thermal storage. The basic concept of NUTDH is to supply the SH with a low temperature at most of the time during a day and charge the heat storage for DHW supply during a short period. The major difference between NUTDH and ULTDH is that the operation of ULTDH constantly remains at a low temperature level while the operating temperature of NUTDH varies at different times of the day. In [197], a NUTDH system with decentralized heat storage was proposed for the energy supply of a town in Brazil. Given the local conditions, the system was designed to operate at low-temperature mode (40–45 °C) for SH and at high-temperature mode (70–75 °C) for 4 h a day to charge the heat storage for DHW use. In [174], a NUTDH system with decentralized HPs and heat storage units was proposed for the energy supply of 100 single-family detached houses in Denmark. In this system, the temperature in the transmission pipeline was always kept at 35–40 °C for SH supply and the heat pumps raise the temperature in the distribution pipe up to 70 °C during a short period of time in a day to charge the storage for DHW use.

6.3.4. Triple-Pipe DH System

Although the number of pipes in DH systems vary from one to four [16], the most common configuration is with two, one supply and one return. One proposal is to employ two supply pipes (a low temperature supply for SH and a high temperature supply for DHW) and one return pipe [198,199,200,200], while another suggested one supply and two return pipes [201]. The detailed CFD simulation results in [198] demonstrated that the triple-pipe design with two supply and one return is more energy efficient than a twin-pipe design, no matter how the three pipes are arranged. This same conclusion also appeared in other researchers’ work [199,200]. The author in [198] further claimed that a triangular arrangement of the three pipes within the same casing is the optimal option for the triple-pipe design. In [201], the necessity to use two return pipes in future high efficiency buildings was addressed via a cast study. However, unfortunately, no performance comparison between the two different triple pipe configurations has been carried out so far.
As elaborated above, all these novel designs have their own advantages and limitations for their application. Their superiority over other structures is also shown in the corresponding research work through case studies. However, the superiority is case dependent and a general conclusion of which one is best is difficult to draw. The 5GDHC system design is, among various novel concepts for future DH system design, most widely applied. It was found that on average three 5GDHC systems per year have entered the heating and cooling market in the last decade [16]. Despite this tremendous development, optimizing 5GDHC systems in terms of both design and operation remains challenging due to the large number of degrees of freedom introduced by different temperature levels, bi-directional flow, and decentralization of the system. For this, efficient tools for integrated simulation of the 5GDHC system models and building models are still lacking.

6.4. Upgrade of Existing DH Systems

For optimal planning and system design of future DH networks, another important topic that must be mentioned is the upgrade of existing DH systems since many existing DH systems were designed in the last century. As mentioned above, DH is developing towards a lower temperature direction. Therefore, most of the retrofitting programs were proposed to serve the purpose of decreasing the system operating temperature. Among various upgrading strategies, the following five patterns were identified:
  • Energy supply upgrade. For fossil fuel driven DH systems, the strategy of upgrading the heat supply solution proved its effectiveness. The benefit of this strategy is twofold. First, by enhancing the heat supply technology (such as switching from coal-fired plant to a CHP unit in [202]) or by replacing the fossil fuel with more sustainable resources [203,204], the overall energy conversion efficiency is increased, which leads to extra energy savings, lower heat generation cost and less GHG emissions. Furthermore, replacing fossil fuels with sustainable resources usually results in a lower operation temperature. This means that the benefits of a LTDH system are also empowered to the old systems [205].
  • Substation upgrade. Given the proved functionality of ULTDH [163], some retrofitting work focused on upgrading the substation for DHW preparation. In [206], an innovative substation was devised, of which an instantaneous heat exchanger and micro electric storage tank were used to replace the original bypass for DHW supply. The results showed that such design leads to a lower return temperature and higher efficiency for the DHW supply, thus enabling the DHW supply with LTDH. In [207], replacing the gas boilers with HPs for DHW production in Turin was shown to be economically feasible. More importantly, such replacement was shown to bring substantial environmental benefits. Except for structural changes, regular fault detection at the substation is of great importance to control the return temperature at the expected low level [208]. For this, the excess flow method proposed in [209] was shown to be efficient and reliable in identifying fault substations in urban networks.
  • Energy cascade. For well-established high temperature DH systems which are difficult to switch to LTDH, an energy cascade structure was proposed [210] to connect a LTDH to the return line of a high-temperature DH (HTDH). This proposal was shown to be economically feasible since the calculated payback time is less than 3 years. At the same time, the exergy analysis showed that the cascade structure is more efficient than a reference case, in which a new network is connected directly to the downstream of the HTDH.
  • System expansion. Here, expansion refers to both combining small DH systems into one large system and expanding the number of connected users in an existing DH system. It was shown in [211] that by combing individual small DH systems into a big one, electric boilers in the original small systems could be efficiently eliminated, and higher production of cogeneration units were enabled, making the system more profitable. In [212], a significant expansion of an existing DH system (26% of additional connections) with limited investment cost was enabled by considering the hydraulic limitation of the original DH network. The results showed that the expansion enables a reduction of C O 2 emissions of more than 13%.
The retrofitting and upgrading plan of an existing DH system is dependent on the design of the original system and local conditions. For policymakers, the above-mentioned strategies may be used as references.

7. Conclusions

The purpose of this review work is to provide a clear picture of the status of the optimal planning and design of an efficient and sustainable DH system. This can be useful for policy makers and local planners but also for researchers looking for a quick overview of this status and for gaps in the knowledge domain. Two main topics are considered important in this work: how does recent research development on DH contribute to build a high quality heat atlas for a higher inclusion of sustainable heat resources?, and what are the up-to-date technologies for the optimal design of the system structure?
For the establishment of a high quality heat atlas, an accurate forecast of district thermal demand is the driving force and a detailed mapping of sustainable heat sources is the work horse. There exists large differences between different atlases in terms of the level of detail and resolution. The importance of a high quality heat atlas is more evident for the optimal planning and system design of future DH networks than for traditional DH systems. To forecast district energy demand, a bottom-up approach, which aggregates energy profiles from individual users to district level, is considered more suitable for the energy consumption prediction in DH systems. Compared with engineering models which are based on fundamental conservation laws and heat transfer theories, data driven approaches showed great potentials for district heat demand forecasts. Comparison studies showed that machine learning algorithms in general produce more accurate predictions than regression methods. More specifically, SVM provided the best prediction in most studies. The main difficulty for accurate district energy forecasts lies in collecting high quality data of energy consumption profiles due to privacy issues.
For the inclusion of renewable heat resources in DH systems, technologies for geothermal energy, biomass, and solar energy are shown to be mature for their direct use in DH systems. The utilization of these resources is highly dependent on the location of the system. Geothermal has shown great potential for its inclusion in the energy supply mix everywhere for both heating and cooling demands, with the help of HP units. Biomass is mainly suitable for rural areas. Solar energy-based DH systems were found economically feasible for most regions from low to high latitudes. Centralized solar DH systems are especially attractive for large communities with high heating demands and for cold climates. However, a centralized solar DH system requires large space for centralized large-scale solar panels. When this space is unavailable, distributed solar DH systems were also proven to be technically viable and economically beneficial. However, for distributed solar DH systems, an appropriate feed-in principle from the solar collector loop to the DH network still requires further research. Among various solar technologies, electrical based (PV/PVT) DH systems in general perform better than thermal based (ST) systems in terms of life cycle cost, payback time and system technical performance. Inclusion of industrial surplus heat and urban waste heat in the total energy mix is also an attractive option because of the enormous amounts of heat involved. However, their implementation in DH was found to be limited so far due to some major barriers: supply risk concerns from DH operators, low technical maturity due to the low quality of the heat grade and the time mismatch between the availability of industrial excess heat and the DH demand, and long payback time. Special attention should be paid on avoiding the unnecessary competition between renewable heat sources based DH and excess heat based DH systems due to explicit incentives for renewable resources. To unlock low-quality heat sources, the applicability of HPs has shown its significant importance. Studies in various countries have shown that implementing HPs in existing DH systems is both economically and environmentally beneficial for the whole energy system. Sources that could be mapped on the heat atlas for HP use include: sewage water, ambient water, industrial waste heat and geothermal energy. Biomass is a direct heat source to be mapped on the heat atlas.
The planning and design of a future DH system is much more complicated compared to the design of a traditional network, while the design of old generations of DH systems mainly focused on the topological layout of the networks, future designers must expand their vision to the optimal system design of the overall structure, including the choice of distributed heat sources, sizing of different thermal units and the optimization of the spatial layout. Prior research has demonstrated the importance of including engineering parameters related to pipe sizing, heat losses and pumping energy in the planning and design phase. Moreover, the non-linear transport model was shown to have significant impact on design results. These findings result in a complicated optimization problem. Current optimization approaches are mainly suffering from the high computational cost due to the large dimension of DH systems and the non-linearity of the optimization models. It is therefore of great importance for researchers to develop approaches to solve the optimization models efficiently.
Alongside the development of approaches for optimal planning and design of DH systems based on the structure of previous generations of DH systems, some novel configurations have been proposed in the research field. This involves the intensively discussed 5GDHC system. It is obvious from the investigation that the term 5GDHC has been widely adopted to represent a decentralized, bi-directional DH system that operates at close to ground temperature level, and uses local heat pumps and chillers for both heating and cooling demand of a district. Despite its fast expansion, 5GDHC is considered an immature technology for large-scale implementation. For both optimal design and advanced control, integrated simulation of the 5GDHC system models and building models is crucial and remains to be challenging.
The future development of DH still requires efforts from both the scientific research community and national and local governments. Although the share of DH in the overall energy supply mix is quite low in most countries, its tremendous contribution to an efficient and sustainable overall energy system has been demonstrated by pioneering countries like Denmark. DH is arguably one of the best solutions for many regions and countries.

Author Contributions

Writing—original draft preparation, M.J.; writing—review and editing, C.R. and D.M.J.S.; supervision, D.M.J.S.; funding acquisition, C.R. All authors have read and agreed to the published version of the manuscript.

Funding

This research was funded by “TKI Urban Energy (TKITOE1621401)” and “Eindhoven University of Technology (10025249)”.

Institutional Review Board Statement

Not applicable.

Informed Consent Statement

Not applicable.

Data Availability Statement

Not applicable.

Conflicts of Interest

The authors declare no conflict of interest.

Abbreviations

The following abbreviations are used in this manuscript:
4GDH4th Generation District Heating
5GDHC5th Generation District Heating and Cooling
ATESAquifer Thermal Energy Storage
BTESBorehole Thermal Energy Storage
CRCoverage Ratio
CSHPSSCentral Solar Heating Plant with a Seasonal Storage
DHATDistrict heating assessment tool
DHDistrict Heating
DHWDomestic Hot Water
DiDeProM District, Demand, Profiles Model
DLSCDrake Landing Solar Community
DTDecision Tree
EMDEmpirical Mode Decomposition
ETCEvacuated Tube Collectors
ETRsExtremely randomized (extra) Tree Regressors
FFAFirefly Algorithm
FFNNFeed Forward Neural Networks
GBGas Boilers
GHGGreenHouse Gas
GMMGaussian Mixture Model
GPGeneric Programming
HPHeat Pump
HTDHHigh-Temperature DH
ICAImperialistic Competitive Algorithm
IEAInternational Energy Agency
IHEXInstantaneous Heat EXchanger
IRENAInternational Renewable Energy Agency
LCCLife Cycle Cost
LCOELevelized Cost of Electricity
LRLinear Regression
LTDHLow Temperature District Heating
MILPMixed-Integer Linear Programming
MINLPMixed-Integer Non-linear Programming
MLMachine Learning
MLRMultiple Linear Regression
MSTMinimum Spanning Tree
NPVNet Present Vale
NUTDHNon-Uniform Temperature District Heating
OEFOnsite Energy Fraction
PBTPayback Time
PETA4Pan-European Thermal Atlas 4
PTESPit Thermal Energy Storage
PVPhoto-Voltaic
PVTPhoto-Voltaic Thermal
REFRenewable Energy Fraction
SFSolar Fraction
SGEShallow Geothermal Energy
SHSpace Heating
STSolar Thermal
STTSShort Term Thermal Storages
SVMSupport Vector Machine
TTESTank Thermal Energy Storage
ULTDHUltra-Low Temperature District Heating

References

  1. IEA. Heating Without Global Warming; Technical Report; IEA: Paris, France, 2014. [Google Scholar]
  2. Lund, H.; Duic, N.; Østergaard, P.A.; Mathiesen, B.V. Smart energy systems and 4th generation district heating. Energy 2016, 110, 105. [Google Scholar] [CrossRef]
  3. Paredes-Sánchez, B.M.; Paredes, J.P.; Caparrini, N.; Rivo-López, E. Analysis of district heating and cooling energy systems in Spain: Resources, technology and management. Sustainability 2021, 13, 5442. [Google Scholar] [CrossRef]
  4. Averfalk, H.; Werner, S. Economic benefits of fourth generation district heating. Energy 2020, 193, 116727. [Google Scholar] [CrossRef]
  5. Patureau, R.; Tran, C.T.; Gavan, V.; Stabat, P. The new generation of District heating & cooling networks and their potential development in France. Energy 2021, 236, 121477. [Google Scholar] [CrossRef]
  6. Dorotić, H.; Pukšec, T.; Schneider, D.R.; Duić, N. Evaluation of district heating with regard to individual systems–Importance of carbon and cost allocation in cogeneration units. Energy 2021, 221, 119905. [Google Scholar] [CrossRef]
  7. Sorknæs, P.; Østergaard, P.A.; Thellufsen, J.Z.; Lund, H.; Nielsen, S.; Djørup, S.; Sperling, K. The benefits of 4th generation district heating in a 100% renewable energy system. Energy 2020, 213, 119030. [Google Scholar] [CrossRef]
  8. Paardekooper, S.; Lund, H.; Chang, M.; Nielsen, S.; Moreno, D.; Thellufsen, J.Z. Heat Roadmap Chile: A national district heating plan for air pollution decontamination and decarbonisation. J. Clean. Prod. 2020, 272, 122744. [Google Scholar] [CrossRef]
  9. Lund, H.; Østergaard, P.A.; Nielsen, T.B.; Werner, S.; Thorsen, J.E.; Gudmundsson, O.; Arabkoohsar, A.; Mathiesen, B.V. Perspectives on fourth and fifth generation district heating. Energy 2021, 227, 120520. [Google Scholar] [CrossRef]
  10. Lund, H.; Werner, S.; Wiltshire, R.; Svendsen, S.; Thorsen, J.E.; Hvelplund, F.; Mathiesen, B.V. 4th Generation District Heating (4GDH): Integrating smart thermal grids into future sustainable energy systems. Energy 2014, 68, 89. [Google Scholar] [CrossRef]
  11. Volkova, A.; Mašatin, V.; Siirde, A. Methodology for evaluating the transition process dynamics towards 4th generation district heating networks. Energy 2018, 150, 253–261. [Google Scholar] [CrossRef]
  12. van der Zwan, S.; Pothof, I. Operational optimization of district heating systems with temperature limited sources. Energy Build. 2020, 226, 110347. [Google Scholar] [CrossRef]
  13. Østergaard, D.S.; Svendsen, S. Replacing critical radiators to increase the potential to use low-temperature district heating—A case study of 4 Danish single-family houses from the 1930s. Energy 2016, 110, 75–84. [Google Scholar] [CrossRef]
  14. Lund, H.; Østergaard, P.A.; Chang, M.; Werner, S.; Svendsen, S.; Sorknæs, P.; Thorsen, J.E.; Hvelplund, F.; Mortensen, B.O.G.; Mathiesen, B.V.; et al. The status of 4th generation district heating: Research and results. Energy 2018, 164, 147–159. [Google Scholar] [CrossRef]
  15. Kicherer, N.; Lorenzen, P.; Schäfers, H. Design of a district heating roadmap for Hamburg. Smart Energy 2021, 2, 100014. [Google Scholar] [CrossRef]
  16. Buffa, S.; Cozzini, M.; D’antoni, M.; Baratieri, M.; Fedrizzi, R. 5th generation district heating and cooling systems: A review of existing cases in Europe. Renew. Sustain. Energy Rev. 2019, 104, 504–522. [Google Scholar] [CrossRef]
  17. Snyder, H. Literature review as a research methodology: An overview and guidelines. J. Bus. Res. 2019, 104, 333–339. [Google Scholar] [CrossRef]
  18. Möller, B.; Wiechers, E.; Persson, U.; Grundahl, L.; Connolly, D. Heat Roadmap Europe: Identifying local heat demand and supply areas with a European thermal atlas. Energy 2018, 158, 281–292. [Google Scholar] [CrossRef]
  19. Connolly, D.; Mathiesen, B.V.; Østergaard, P.A.; Möller, B.; Nielsen, S.; Lund, H.; Persson, U.; Nilsson, D.; Werner, S.; Trier, D. Heat Roadmap Europe 2050: First Pre-Study for the EU27; Technical Report; Aalborg University: Aalborg, Denmark, 2012. [Google Scholar]
  20. Connolly, D.; Mathiesen, B.V.; Østergaard, P.A.; Möller, B.; Nielsen, S.; Lund, H.; Persson, U.; Nilsson, D.; Werner, S.; Trier, D. Heat Roadmap Europe 2050: Second Pre-Study for the EU27; Department of Development and Planning, Aalborg University: Aalborg, Denmark, 2013. [Google Scholar]
  21. Persson, U.; Möller, B.; Werner, S. Heat Roadmap Europe: Identifying strategic heat synergy regions. Energy Policy 2014, 74, 663–681. [Google Scholar] [CrossRef]
  22. Scottish Government. Scotland Heat Map. Available online: https://heatmap.data.gov.scot/custom/heatmap/ (accessed on 13 July 2022).
  23. Centre for Sustainable Energy. London Heat Map. Available online: https://maps.london.gov.uk/heatmap (accessed on 13 July 2022).
  24. Flensburg, Halmstad and Aalborg Universities. Irish Heat Atlas. 2019. Available online: http://www.districtenergy.ie/heat-atlas (accessed on 25 September 2022).
  25. Pelda, J.; Holler, S.; Persson, U. District heating atlas—Analysis of the German district heating sector. Energy 2021, 233, 121018. [Google Scholar] [CrossRef]
  26. het Nationaal Expertisecentrum Warmte (NEW). The WarmteAtlas. Available online: https://rvo.b3p.nl/viewer/app/Warmteatlas/v2 (accessed on 25 September 2022).
  27. Su, C.; Dalgren, J.; Palm, B. High-resolution mapping of the clean heat sources for district heating in Stockholm City. Energy Convers. Manag. 2021, 235, 113983. [Google Scholar] [CrossRef]
  28. Möller, B. A heat atlas for demand and supply management in Denmark. Manag. Environ. Qual. Int. J. 2008, 19, 467–479. [Google Scholar] [CrossRef]
  29. Nielsen, S.; Möller, B. GIS based analysis of future district heating potential in Denmark. Energy 2013, 57, 458–468. [Google Scholar] [CrossRef]
  30. Chambers, J.; Narula, K.; Sulzer, M.; Patel, M.K. Mapping district heating potential under evolving thermal demand scenarios and technologies: A case study for Switzerland. Energy 2019, 176, 682–692. [Google Scholar] [CrossRef]
  31. Leurent, M. Analysis of the district heating potential in French regions using a geographic information system. Appl. Energy 2019, 252, 113460. [Google Scholar] [CrossRef]
  32. Dochev, I.; Peters, I.; Seller, H.; Schuchardt, G.K. Analysing district heating potential with linear heat density. A case study from Hamburg. Energy Procedia 2018, 149, 410–419. [Google Scholar] [CrossRef]
  33. Persson, U.; Werner, S. Heat distribution and the future competitiveness of district heating. Appl. Energy 2011, 88, 568–576. [Google Scholar] [CrossRef]
  34. Svend, F.; Sven, W. District Heating and Cooling; Studentlitteratur: Lund, Sweden, 2013; Volume 697. [Google Scholar]
  35. Persson, U.; Wiechers, E.; Möller, B.; Werner, S. Heat roadmap Europe: Heat distribution costs. Energy 2019, 176, 604–622. [Google Scholar] [CrossRef]
  36. District Heating and Cooling: Spatial Analysis of Infrastructure Costs and Potential in Ireland; Technical Report; Sustainable Energy Authority of Ireland: Dublin, Ireland, 2021.
  37. Østergaard, P.A.; Andersen, A.N. Booster heat pumps and central heat pumps in district heating. Appl. Energy 2016, 184, 1374–1388. [Google Scholar] [CrossRef]
  38. Reinhart, C.F.; Davila, C.C. Urban building energy modeling—A review of a nascent field. Build. Environ. 2016, 97, 196–202. [Google Scholar] [CrossRef]
  39. Eicker, U. Urban Energy Systems for Low-Carbon Cities; Academic Press: Boston, MA, USA, 2018. [Google Scholar] [CrossRef]
  40. Swan, L.G.; Ugursal, V.I. Modeling of end-use energy consumption in the residential sector: A review of modeling techniques. Renew. Sustain. Energy Rev. 2009, 13, 1819–1835. [Google Scholar] [CrossRef]
  41. Gianniou, P.; Liu, X.; Heller, A.; Nielsen, P.S.; Rode, C. Clustering-based analysis for residential district heating data. Energy Convers. Manag. 2018, 165, 840–850. [Google Scholar] [CrossRef]
  42. Le Ray, G.; Pinson, P. Online adaptive clustering algorithm for load profiling. Sustain. Energy Grids Netw. 2019, 17, 100181. [Google Scholar] [CrossRef]
  43. Tureczek, A.M.; Nielsen, P.S.; Madsen, H.; Brun, A. Clustering district heat exchange stations using smart meter consumption data. Energy Build. 2019, 182, 144–158. [Google Scholar] [CrossRef]
  44. Calikus, E.; Nowaczyk, S.; Sant’Anna, A.; Gadd, H.; Werner, S. A data-driven approach for discovering heat load patterns in district heating. Appl. Energy 2019, 252, 113409. [Google Scholar] [CrossRef]
  45. Lu, Y.; Tian, Z.; Peng, P.; Niu, J.; Li, W.; Zhang, H. GMM clustering for heating load patterns in-depth identification and prediction model accuracy improvement of district heating system. Energy Build. 2019, 190, 49–60. [Google Scholar] [CrossRef]
  46. Li, Y.; O’Neill, Z.; Zhang, L.; Chen, J.; Im, P.; DeGraw, J. Grey-box modeling and application for building energy simulations-A critical review. Renew. Sustain. Energy Rev. 2021, 146, 111174. [Google Scholar] [CrossRef]
  47. Lim, H.; Zhai, Z.J. Review on stochastic modeling methods for building stock energy prediction. Build. Simul. 2017, 10, 607–624. [Google Scholar] [CrossRef]
  48. Dahl, M.; Brun, A.; Andresen, G.B. Using ensemble weather predictions in district heating operation and load forecasting. Appl. Energy 2017, 193, 455–465. [Google Scholar] [CrossRef]
  49. Fang, T.; Lahdelma, R. Evaluation of a multiple linear regression model and SARIMA model in forecasting heat demand for district heating system. Appl. Energy 2016, 179, 544–552. [Google Scholar] [CrossRef]
  50. Rusovs, D.; Jakovleva, L.; Zentins, V.; Baltputnis, K. Heat load numerical prediction for district heating system operational control. Latv. J. Phys. Tech. Sci. 2021, 58, 121–136. [Google Scholar] [CrossRef]
  51. Saloux, E.; Candanedo, J.A. Forecasting district heating demand using machine learning algorithms. Energy Procedia 2018, 149, 59–68. [Google Scholar] [CrossRef]
  52. Suryanarayana, G.; Lago, J.; Geysen, D.; Aleksiejuk, P.; Johansson, C. Thermal load forecasting in district heating networks using deep learning and advanced feature selection methods. Energy 2018, 157, 141–149. [Google Scholar] [CrossRef]
  53. Protić, M.; Shamshirband, S.; Petković, D.; Abbasi, A.; Kiah, M.L.M.; Unar, J.A.; Živković, L.; Raos, M. Forecasting of consumers heat load in district heating systems using the support vector machine with a discrete wavelet transform algorithm. Energy 2015, 87, 343–351. [Google Scholar] [CrossRef]
  54. Eseye, A.T.; Lehtonen, M. Short-term forecasting of heat demand of buildings for efficient and optimal energy management based on integrated machine learning models. IEEE Trans. Ind. Inform. 2020, 16, 7743–7755. [Google Scholar] [CrossRef]
  55. Al-Shammari, E.T.; Keivani, A.; Shamshirband, S.; Mostafaeipour, A.; Yee, L.; Petković, D.; Ch, S. Prediction of heat load in district heating systems by Support Vector Machine with Firefly searching algorithm. Energy 2016, 95, 266–273. [Google Scholar] [CrossRef]
  56. Idowu, S.; Saguna, S.; Åhlund, C.; Schelén, O. Applied machine learning: Forecasting heat load in district heating system. Energy Build. 2016, 133, 478–488. [Google Scholar] [CrossRef]
  57. Geysen, D.; De Somer, O.; Johansson, C.; Brage, J.; Vanhoudt, D. Operational thermal load forecasting in district heating networks using machine learning and expert advice. Energy Build. 2018, 162, 144–153. [Google Scholar] [CrossRef]
  58. Kazas, G.; Fabrizio, E.; Perino, M. Energy demand profile generation with detailed time resolution at an urban district scale: A reference building approach and case study. Appl. Energy 2017, 193, 243–262. [Google Scholar] [CrossRef]
  59. Jodeiri, A.; Goldsworthy, M.; Buffa, S.; Cozzini, M. Role of sustainable heat sources in transition towards fourth generation district heating—A review. Renew. Sustain. Energy Rev. 2022, 158, 112156. [Google Scholar] [CrossRef]
  60. Lund, J.W.; Toth, A.N. Direct utilization of geothermal energy 2020 worldwide review. Geothermics 2021, 90, 101915. [Google Scholar] [CrossRef]
  61. Werner, S. International review of district heating and cooling. Energy 2017, 137, 617–631. [Google Scholar] [CrossRef]
  62. Wheatcroft, E.; Wynn, H.; Lygnerud, K.; Bonvicini, G.; Leonte, D. The role of low temperature waste heat recovery in achieving 2050 goals: A policy positioning paper. Energies 2020, 13, 2107. [Google Scholar] [CrossRef]
  63. Santamarta, J.C.; García-Gil, A.; del Cristo Expósito, M.; Casañas, E.; Cruz-Pérez, N.; Rodríguez-Martín, J.; Mejías-Moreno, M.; Götzl, G.; Gemeni, V. The clean energy transition of heating and cooling in touristic infrastructures using shallow geothermal energy in the Canary Islands. Renew. Energy 2021, 171, 505–515. [Google Scholar] [CrossRef]
  64. Iorio, M.; Carotenuto, A.; Corniello, A.; Di Fraia, S.; Massarotti, N.; Mauro, A.; Somma, R.; Vanoli, L. Low enthalpy geothermal systems in structural controlled areas: A sustainability analysis of geothermal resource for heating plant (the Mondragone case in Southern Appennines, Italy). Energies 2020, 13, 1237. [Google Scholar] [CrossRef]
  65. Bilić, T.; Raos, S.; Ilak, P.; Rajšl, I.; Pašičko, R. Assessment of Geothermal Fields in the South Pannonian Basin System Using a Multi-Criteria Decision-Making Tool. Energies 2020, 13, 1026. [Google Scholar] [CrossRef]
  66. Walch, A.; Li, X.; Chambers, J.; Mohajeri, N.; Yilmaz, S.; Patel, M.; Scartezzini, J.L. Shallow geothermal energy potential for heating and cooling of buildings with regeneration under climate change scenarios. Energy 2022, 244, 123086. [Google Scholar] [CrossRef]
  67. Beckers, K.F.; Kolker, A.; Pauling, H.; McTigue, J.D.; Kesseli, D. Evaluating the feasibility of geothermal deep direct-use in the United States. Energy Convers. Manag. 2021, 243, 114335. [Google Scholar] [CrossRef]
  68. Doughtry, C.; Hu, J.; Dobson, P.; Nico, P.; Wetter, M. Coupling subsurface and above-surface models for optimizing the design of borefields and district heating and cooling systems in the presence of varying water-table depth. In Proceedings of the 46th Workshop on Geothermal Reservoir Engineering, Virtual, 16–18 February 2021; Technical Report. Lawrence Berkeley National Lab. (LBNL): Berkeley, CA, USA, 2022. [Google Scholar] [CrossRef]
  69. Kanoglu, M. Exergy analysis of a dual-level binary geothermal power plant. Geothermics 2002, 31, 709–724. [Google Scholar] [CrossRef]
  70. Keçebaş, A. Exergoenvironmental analysis for a geothermal district heating system: An application. Energy 2016, 94, 391–400. [Google Scholar] [CrossRef]
  71. Yamankaradeniz, N. Thermodynamic performance assessments of a district heating system with geothermal by using advanced exergy analysis. Renew. Energy 2016, 85, 965–972. [Google Scholar] [CrossRef]
  72. Zbinden, D.; Rinaldi, A.P.; Diehl, T.; Wiemer, S. Potential influence of overpressurized gas on the induced seismicity in the St. Gallen deep geothermal project (Switzerland). Solid Earth 2020, 11, 909–933. [Google Scholar] [CrossRef]
  73. García-Gil, A.; Goetzl, G.; Kłonowski, M.R.; Borovic, S.; Boon, D.P.; Abesser, C.; Janza, M.; Herms, I.; Petitclerc, E.; Erlström, M.; et al. Governance of shallow geothermal energy resources. Energy Policy 2020, 138, 111283. [Google Scholar] [CrossRef]
  74. Lindroos, T.J.; Mäki, E.; Koponen, K.; Hannula, I.; Kiviluoma, J.; Raitila, J. Replacing fossil fuels with bioenergy in district heating—Comparison of technology options. Energy 2021, 231, 120799. [Google Scholar] [CrossRef]
  75. Difs, K.; Wetterlund, E.; Trygg, L.; Söderström, M. Biomass gasification opportunities in a district heating system. Biomass Bioenergy 2010, 34, 637–651. [Google Scholar] [CrossRef]
  76. Pelkmans, L. IEA Bioenergy Countries’ Report—Update 2021; Technical Report; IEA Bioenergy: Paris, France, 2021. [Google Scholar]
  77. Hendricks, A.M.; Wagner, J.E.; Volk, T.A.; Newman, D.H.; Brown, T.R. A cost-effective evaluation of biomass district heating in rural communities. Appl. Energy 2016, 162, 561–569. [Google Scholar] [CrossRef]
  78. Soltero, V.; Chacartegui, R.; Ortiz, C.; Velázquez, R. Potential of biomass district heating systems in rural areas. Energy 2018, 156, 132–143. [Google Scholar] [CrossRef]
  79. Soltero, V.M.; Chacartegui, R.; Ortiz, C.; Lizana, J.; Quirosa, G. Biomass district heating systems based on agriculture residues. Appl. Sci. 2018, 8, 476. [Google Scholar] [CrossRef]
  80. Ericsson, K.; Werner, S. The introduction and expansion of biomass use in Swedish district heating systems. Biomass Bioenergy 2016, 94, 57–65. [Google Scholar] [CrossRef] [Green Version]
  81. Perez-Mora, N.; Bava, F.; Andersen, M.; Bales, C.; Lennermo, G.; Nielsen, C.; Furbo, S.; Martínez-Moll, V. Solar district heating and cooling: A review. Int. J. Energy Res. 2018, 42, 1419–1441. [Google Scholar] [CrossRef]
  82. Reiter, P.; Poier, H.; Holter, C. BIG solar graz: Solar district heating in graz—500,000 m2 for 20% solar fraction. Energy Procedia 2016, 91, 578–584. [Google Scholar] [CrossRef]
  83. Welsch, B.; Göllner-Völker, L.; Schulte, D.O.; Bär, K.; Sass, I.; Schebek, L. Environmental and economic assessment of borehole thermal energy storage in district heating systems. Appl. Energy 2018, 216, 73–90. [Google Scholar] [CrossRef]
  84. Soloha, R.; Pakere, I.; Blumberga, D. Solar energy use in district heating systems. A case study in Latvia. Energy 2017, 137, 586–594. [Google Scholar] [CrossRef]
  85. Ciampi, G.; Rosato, A.; Sibilio, S. Thermo-economic sensitivity analysis by dynamic simulations of a small Italian solar district heating system with a seasonal borehole thermal energy storage. Energy 2018, 143, 757–771. [Google Scholar] [CrossRef]
  86. Salvestroni, M.; Pierucci, G.; Pourreza, A.; Fagioli, F.; Taddei, F.; Messeri, M.; De Lucia, M. Design of a solar district heating system with seasonal storage in Italy. Appl. Therm. Eng. 2021, 197, 117438. [Google Scholar] [CrossRef]
  87. Mesquita, L.; McClenahan, D.; Thornton, J.; Carriere, J.; Wong, B. Drake landing solar community: 10 years of operation. In Proceedings of the ISES Conference Proceedings, Abu Dhabi, United Arab Emirates, 29 October–2 November 2017; pp. 1–12. [Google Scholar] [CrossRef]
  88. Xu, L.; Torrens, J.I.; Guo, F.; Yang, X.; Hensen, J.L. Application of large underground seasonal thermal energy storage in district heating system: A model-based energy performance assessment of a pilot system in Chifeng, China. Appl. Therm. Eng. 2018, 137, 319–328. [Google Scholar] [CrossRef]
  89. Tulus, V.; Boer, D.; Cabeza, L.F.; Jiménez, L.; Guillén-Gosálbez, G. Enhanced thermal energy supply via central solar heating plants with seasonal storage: A multi-objective optimization approach. Appl. Energy 2016, 181, 549–561. [Google Scholar] [CrossRef]
  90. Hirvonen, J.; ur Rehman, H.; Sirén, K. Techno-economic optimization and analysis of a high latitude solar district heating system with seasonal storage, considering different community sizes. Sol. Energy 2018, 162, 472–488. [Google Scholar] [CrossRef] [Green Version]
  91. Renaldi, R.; Friedrich, D. Techno-economic analysis of a solar district heating system with seasonal thermal storage in the UK. Appl. Energy 2019, 236, 388–400. [Google Scholar] [CrossRef]
  92. Flynn, C.; Sirén, K. Influence of location and design on the performance of a solar district heating system equipped with borehole seasonal storage. Renew. Energy 2015, 81, 377–388. [Google Scholar] [CrossRef]
  93. Reed, A.; Novelli, A.; Doran, K.; Ge, S.; Lu, N.; McCartney, J. Solar district heating with underground thermal energy storage: Pathways to commercial viability in North America. Renew. Energy 2018, 126, 1–13. [Google Scholar] [CrossRef]
  94. Rämä, M.; Mohammadi, S. Comparison of distributed and centralised integration of solar heat in a district heating system. Energy 2017, 137, 649–660. [Google Scholar] [CrossRef]
  95. Lumbreras, M.; Garay, R. Energy & economic assessment of façade-integrated solar thermal systems combined with ultra-low temperature district-heating. Renew. Energy 2020, 159, 1000–1014. [Google Scholar] [CrossRef]
  96. Paulus, C.; Papillon, P. Substations for decentralized solar district heating: Design, performance and energy cost. Energy Procedia 2014, 48, 1076–1085. [Google Scholar] [CrossRef]
  97. Winterscheid, C.; Dalenbäck, J.O.; Holler, S. Integration of solar thermal systems in existing district heating systems. Energy 2017, 137, 579–585. [Google Scholar] [CrossRef]
  98. de Uribarri, P.M.Á.; Eicker, U.; Robinson, D. Energy performance of decentralized solar thermal feed-in to district heating networks. Energy Procedia 2017, 116, 285–296. [Google Scholar] [CrossRef]
  99. Lennermo, G.; Lauenburg, P.; Werner, S. Control of decentralised solar district heating. Sol. Energy 2019, 179, 307–315. [Google Scholar] [CrossRef]
  100. Zajacs, A.; Bogdanovičs, R.; Zeiza-Seleznova, A.; Valančius, R.; Zemītis, J. Integration of decentralized solar collectors into a district heating system. Sustain. Cities Soc. 2022, 83, 103920. [Google Scholar] [CrossRef]
  101. Gravelsins, A.; Pakere, I.; Tukulis, A.; Blumberga, D. Solar power in district heating. P2H flexibility concept. Energy 2019, 181, 1023–1035. [Google Scholar] [CrossRef]
  102. Herrando, M.; Pantaleo, A.M.; Wang, K.; Markides, C.N. Solar combined cooling, heating and power systems based on hybrid PVT, PV or solar-thermal collectors for building applications. Renew. Energy 2019, 143, 637–647. [Google Scholar] [CrossRef]
  103. Mousa, O.B.; Taylor, R.A.; Shirazi, A. Multi-objective optimization of solar photovoltaic and solar thermal collectors for industrial rooftop applications. Energy Convers. Manag. 2019, 195, 392–408. [Google Scholar] [CrossRef]
  104. Pakere, I.; Blumberga, D. Solar power or solar heat: What will upraise the efficiency of district heating? Multi-criteria analyses approach. Energy 2020, 198, 117291. [Google Scholar] [CrossRef]
  105. ur Rehman, H.; Hirvonen, J.; Kosonen, R.; Sirén, K. Computational comparison of a novel decentralized photovoltaic district heating system against three optimized solar district systems. Energy Convers. Manag. 2019, 191, 39–54. [Google Scholar] [CrossRef]
  106. Nielsen, S.; Hansen, K.; Lund, R.; Moreno, D. Unconventional excess heat sources for district heating in a national energy system context. Energies 2020, 13, 5068. [Google Scholar] [CrossRef]
  107. Lygnerud, K.; Werner, S. Risk assessment of industrial excess heat recovery in district heating systems. Energy 2018, 151, 430–441. [Google Scholar] [CrossRef]
  108. Ivner, J.; Viklund, S.B. Effect of the use of industrial excess heat in district heating on greenhouse gas emissions: A systems perspective. Resour. Conserv. Recycl. 2015, 100, 81–87. [Google Scholar] [CrossRef]
  109. McKenna, R.C.; Norman, J.B. Spatial modelling of industrial heat loads and recovery potentials in the UK. Energy Policy 2010, 38, 5878–5891. [Google Scholar] [CrossRef]
  110. Bühler, F.; Petrović, S.; Karlsson, K.; Elmegaard, B. Industrial excess heat for district heating in Denmark. Appl. Energy 2017, 205, 991–1001. [Google Scholar] [CrossRef] [Green Version]
  111. Moser, S.; Mayrhofer, J.; Schmidt, R.R.; Tichler, R. Socioeconomic cost-benefit-analysis of seasonal heat storages in district heating systems with industrial waste heat integration. Energy 2018, 160, 868–874. [Google Scholar] [CrossRef]
  112. Köfinger, M.; Schmidt, R.; Basciotti, D.; Terreros, O.; Baldvinsson, I.; Mayrhofer, J.; Moser, S.; Tichler, R.; Pauli, H. Simulation based evaluation of large scale waste heat utilization in urban district heating networks: Optimized integration and operation of a seasonal storage. Energy 2018, 159, 1161–1174. [Google Scholar] [CrossRef]
  113. Santin, M.; Chinese, D.; De Angelis, A.; Biberacher, M. Feasibility limits of using low-grade industrial waste heat in symbiotic district heating and cooling networks. Clean Technol. Environ. Policy 2020, 22, 1339–1357. [Google Scholar] [CrossRef]
  114. Holzleitner, M.; Moser, S.; Puschnigg, S. Evaluation of the impact of the new Renewable Energy Directive 2018/2001 on third-party access to district heating networks to enforce the feed-in of industrial waste heat. Util. Policy 2020, 66, 101088. [Google Scholar] [CrossRef]
  115. Bühler, F.; Petrović, S.; Holm, F.M.; Karlsson, K.; Elmegaard, B. Spatiotemporal and economic analysis of industrial excess heat as a resource for district heating. Energy 2018, 151, 715–728. [Google Scholar] [CrossRef]
  116. Fang, H.; Xia, J.; Zhu, K.; Su, Y.; Jiang, Y. Industrial waste heat utilization for low temperature district heating. Energy Policy 2013, 62, 236–246. [Google Scholar] [CrossRef]
  117. Fernández, M.G.; Bacquet, A.; Bensadi, S.; Morisot, P.; Oger, A. Integrating Renewable and Waste Heat and Cold Sources into District Heating and Cooling Systems; Publications Office of the European Union: Luxembourg, 2021. [Google Scholar] [CrossRef]
  118. Lygnerud, K.; Wheatcroft, E.; Wynn, H. Contracts, business models and barriers to investing in low temperature district heating projects. Appl. Sci. 2019, 9, 3142. [Google Scholar] [CrossRef]
  119. Li, H.; Hou, J.; Hong, T.; Ding, Y.; Nord, N. Energy, economic, and environmental analysis of integration of thermal energy storage into district heating systems using waste heat from data centres. Energy 2021, 219, 119582. [Google Scholar] [CrossRef]
  120. Li, J.; Yang, Z.; Li, H.; Hu, S.; Duan, Y.; Yan, J. Optimal schemes and benefits of recovering waste heat from data center for district heating by CO2 transcritical heat pumps. Energy Convers. Manag. 2021, 245, 114591. [Google Scholar] [CrossRef]
  121. Huang, P.; Copertaro, B.; Zhang, X.; Shen, J.; Löfgren, I.; Rönnelid, M.; Fahlen, J.; Andersson, D.; Svanfeldt, M. A review of data centers as prosumers in district energy systems: Renewable energy integration and waste heat reuse for district heating. Appl. Energy 2020, 258, 114109. [Google Scholar] [CrossRef]
  122. Averfalk, H.; Ingvarsson, P.; Persson, U.; Gong, M.; Werner, S. Large heat pumps in Swedish district heating systems. Renew. Sustain. Energy Rev. 2017, 79, 1275–1284. [Google Scholar] [CrossRef]
  123. Kauko, H.; Rohde, D.; Hafner, A. Local Heating Networks with Waste Heat Utilization: Low or Medium Temperature Supply? Energies 2020, 13, 954. [Google Scholar] [CrossRef]
  124. Rezaei, A.; Samadzadegan, B.; Rasoulian, H.; Ranjbar, S.; Samareh Abolhassani, S.; Sanei, A.; Eicker, U. A new modeling approach for low-carbon district energy system planning. Energies 2021, 14, 1383. [Google Scholar] [CrossRef]
  125. Kljajić, M.V.; Anđelković, A.S.; Hasik, V.; Munćan, V.M.; Bilec, M. Shallow geothermal energy integration in district heating system: An example from Serbia. Renew. Energy 2020, 147, 2791–2800. [Google Scholar] [CrossRef]
  126. David, A.; Mathiesen, B.V.; Averfalk, H.; Werner, S.; Lund, H. Heat roadmap Europe: Large-scale electric heat pumps in district heating systems. Energies 2017, 10, 578. [Google Scholar] [CrossRef]
  127. Lygnerud, K.; Ottosson, J.; Kensby, J.; Johansson, L. Business models combining heat pumps and district heating in buildings generate cost and emission savings. Energy 2021, 234, 121202. [Google Scholar] [CrossRef]
  128. Mateu-Royo, C.; Sawalha, S.; Mota-Babiloni, A.; Navarro-Esbrí, J. High temperature heat pump integration into district heating network. Energy Convers. Manag. 2020, 210, 112719. [Google Scholar] [CrossRef]
  129. Åberg, M.; Fälting, L.; Lingfors, D.; Nilsson, A.M.; Forssell, A. Do ground source heat pumps challenge the dominant position of district heating in the Swedish heating market? J. Clean. Prod. 2020, 254, 120070. [Google Scholar] [CrossRef]
  130. Arnaudo, M.; Topel, M.; Laumert, B. Techno-economic analysis of demand side flexibility to enable the integration of distributed heat pumps within a Swedish neighborhood. Energy 2020, 195, 117012. [Google Scholar] [CrossRef]
  131. Lund, R.; Persson, U. Mapping of potential heat sources for heat pumps for district heating in Denmark. Energy 2016, 110, 129–138. [Google Scholar] [CrossRef]
  132. Lund, R.; Ilic, D.D.; Trygg, L. Socioeconomic potential for introducing large-scale heat pumps in district heating in Denmark. J. Clean. Prod. 2016, 139, 219–229. [Google Scholar] [CrossRef]
  133. Bach, B.; Werling, J.; Ommen, T.; Münster, M.; Morales, J.M.; Elmegaard, B. Integration of large-scale heat pumps in the district heating systems of Greater Copenhagen. Energy 2016, 107, 321–334. [Google Scholar] [CrossRef]
  134. Kontu, K.; Rinne, S.; Junnila, S. Introducing modern heat pumps to existing district heating systems–Global lessons from viable decarbonizing of district heating in Finland. Energy 2019, 166, 862–870. [Google Scholar] [CrossRef]
  135. Hast, A.; Syri, S.; Lekavičius, V.; Galinis, A. District heating in cities as a part of low-carbon energy system. Energy 2018, 152, 627–639. [Google Scholar] [CrossRef]
  136. Terreros, O.; Spreitzhofer, J.; Basciotti, D.; Schmidt, R.; Esterl, T.; Pober, M.; Kerschbaumer, M.; Ziegler, M. Electricity market options for heat pumps in rural district heating networks in Austria. Energy 2020, 196, 116875. [Google Scholar] [CrossRef]
  137. Hewitt, N.; Cotter, D.; Huang, M.; Shah, N. Industrial Heat Pumps in the UK, Current Constraints and Future Possibilities. In Proceedings of the ICR2019: The 25th IIR International Congress of Refrigeration, Montreal, QC, Canada, 24–30 August 2019; pp. 4463–4470. [Google Scholar] [CrossRef]
  138. Kim, M.H.; Kim, D.W.; Han, G.; Heo, J.; Lee, D.W. Ground Source and Sewage Water Source Heat Pump Systems for Block Heating and Cooling Network. Energies 2021, 14, 5640. [Google Scholar] [CrossRef]
  139. von Rhein, J.; Henze, G.P.; Long, N.; Fu, Y. Development of a topology analysis tool for fifth-generation district heating and cooling networks. Energy Convers. Manag. 2019, 196, 705–716. [Google Scholar] [CrossRef]
  140. Dou, Y.; Togawa, T.; Dong, L.; Fujii, M.; Ohnishi, S.; Tanikawa, H.; Fujita, T. Innovative planning and evaluation system for district heating using waste heat considering spatial configuration: A case in Fukushima, Japan. Resour. Conserv. Recycl. 2018, 128, 406–416. [Google Scholar] [CrossRef]
  141. Allen, A.; Henze, G.; Baker, K.; Pavlak, G. Evaluation of low-exergy heating and cooling systems and topology optimization for deep energy savings at the urban district level. Energy Convers. Manag. 2020, 222, 113106. [Google Scholar] [CrossRef]
  142. Best, R.E.; Kalehbasti, P.R.; Lepech, M.D. A novel approach to district heating and cooling network design based on life cycle cost optimization. Energy 2020, 194, 116837. [Google Scholar] [CrossRef]
  143. Mehleri, E.D.; Sarimveis, H.; Markatos, N.C.; Papageorgiou, L.G. A mathematical programming approach for optimal design of distributed energy systems at the neighbourhood level. Energy 2012, 44, 96–104. [Google Scholar] [CrossRef]
  144. Sameti, M.; Haghighat, F. Optimization of 4th generation distributed district heating system: Design and planning of combined heat and power. Renew. Energy 2019, 130, 371–387. [Google Scholar] [CrossRef]
  145. Unternährer, J.; Moret, S.; Joost, S.; Maréchal, F. Spatial clustering for district heating integration in urban energy systems: Application to geothermal energy. Appl. Energy 2017, 190, 749–763. [Google Scholar] [CrossRef]
  146. Falke, T.; Krengel, S.; Meinerzhagen, A.K.; Schnettler, A. Multi-objective optimization and simulation model for the design of distributed energy systems. Appl. Energy 2016, 184, 1508–1516. [Google Scholar] [CrossRef]
  147. Marty, F.; Serra, S.; Sochard, S.; Reneaume, J.M. Simultaneous optimization of the district heating network topology and the Organic Rankine Cycle sizing of a geothermal plant. Energy 2018, 159, 1060–1074. [Google Scholar] [CrossRef]
  148. Mertz, T.; Serra, S.; Henon, A.; Reneaume, J.M. A MINLP optimization of the configuration and the design of a district heating network: Academic study cases. Energy 2016, 117, 450–464. [Google Scholar] [CrossRef]
  149. Blommaert, M.; Wack, Y.; Baelmans, M. An adjoint optimization approach for the topological design of large-scale district heating networks based on nonlinear models. Appl. Energy 2020, 280, 116025. [Google Scholar] [CrossRef]
  150. Fuchs, M.; Muller, D. Automated Design and Model Generation for a District Heating Network from OpenStreetMap Data. In Proceedings of the 15th IBPSA Conference, San Francisco, CA, USA, 7–9 August 2017. [Google Scholar] [CrossRef]
  151. Ancona, M.; Branchini, L.; De Lorenzi, A.; De Pascale, A.; Gambarotta, A.; Melino, F.; Morini, M. Application of different modeling approaches to a district heating network. In Second International Conference on Material Science, Smart Structures and Applications, Proceedings of the AIP Conference Proceedings; AIP Publishing LLC: Melville, NY, USA, 2019; Volume 2191, p. 020009. [Google Scholar] [CrossRef]
  152. Röder, J.; Meyer, B.; Krien, U.; Zimmermann, J.; Stührmann, T.; Zondervan, E. Optimal design of district heating networks with distributed thermal energy storages-method and case study. Int. J. Sustain. Energy Plan. Manag. 2021, 31, 5–22. [Google Scholar] [CrossRef]
  153. Schweiger, G.; Larsson, P.O.; Magnusson, F.; Lauenburg, P.; Velut, S. District heating and cooling systems—Framework for Modelica-based simulation and dynamic optimization. Energy 2017, 137, 566–578. [Google Scholar] [CrossRef]
  154. Wang, D.; Carmeliet, J.; Orehounig, K. Design and Assessment of District Heating Systems with Solar Thermal Prosumers and Thermal Storage. Energies 2021, 14, 1184. [Google Scholar] [CrossRef]
  155. THERMOS Project. THERMOS Tools. Available online: https://www.thermos-project.eu/thermos-tool/what-is-thermos/ (accessed on 25 September 2022).
  156. Comsof Heat. Available online: https://comsof.com/heat/ (accessed on 25 September 2022).
  157. Dalla Rosa, A.; Christensen, J.E. Low-energy district heating in energy-efficient building areas. Energy 2011, 36, 6890–6899. [Google Scholar] [CrossRef]
  158. Jebamalai, J.M.; Marlein, K.; Laverge, J.; Vandevelde, L.; van den Broek, M. An automated GIS-based planning and design tool for district heating: Scenarios for a Dutch city. Energy 2019, 183, 487–496. [Google Scholar] [CrossRef]
  159. Danish Energy Agency. The District Heating Assessment Tool. Available online: https://ens.dk/sites/ens.dk/files/Globalcooperation/dhat_report-10-17.pdf (accessed on 25 September 2022).
  160. Ommen, T.; Thorsen, J.E.; Markussen, W.B.; Elmegaard, B. Performance of ultra low temperature district heating systems with utility plant and booster heat pumps. Energy 2017, 137, 544–555. [Google Scholar] [CrossRef]
  161. Yang, X.; Li, H.; Svendsen, S. Energy, economy and exergy evaluations of the solutions for supplying domestic hot water from low-temperature district heating in Denmark. Energy Convers. Manag. 2016, 122, 142–152. [Google Scholar] [CrossRef]
  162. Yang, X.; Svendsen, S. Ultra-low temperature district heating system with central heat pump and local boosters for low-heat-density area: Analyses on a real case in Denmark. Energy 2018, 159, 243–251. [Google Scholar] [CrossRef]
  163. Østergaard, D.; Svendsen, S. Space heating with ultra-low-temperature district heating—A case study of four single-family houses from the 1980s. Energy Procedia 2017, 116, 226–235. [Google Scholar] [CrossRef]
  164. Best, I. Economic comparison of low-temperature and ultra-low-temperature district heating for new building developments with low heat demand densities in Germany. Int. J. Sustain. Energy Plan. Manag. 2018, 16, 45–60. [Google Scholar] [CrossRef]
  165. Khosravi, M.; Arabkoohsar, A. Thermal-hydraulic performance analysis of twin-pipes for various future district heating schemes. Energies 2019, 12, 1299. [Google Scholar] [CrossRef]
  166. Meesenburg, W.; Ommen, T.; Thorsen, J.E.; Elmegaard, B. Economic feasibility of ultra-low temperature district heating systems in newly built areas supplied by renewable energy. Energy 2020, 191, 116496. [Google Scholar] [CrossRef]
  167. Tunzi, M.; Ruysschaert, M.; Svendsen, S.; Smith, K.M. Double loop network for combined heating and cooling in low heat density areas. Energies 2020, 13, 6091. [Google Scholar] [CrossRef]
  168. Mugaguren, M.L.; Martínez, R.G.; Zabala, V.S.; Østergaard, K.K.; Caramaschi, M. Triple function substation and high-efficiency micro booster heat pump for Ultra Low Temperature District Heating. In Proceedings of the IOP Conference Series: Materials Science and Engineering; IOP Publishing: Bristol, UK, 2019; Volume 609, p. 052008. [Google Scholar] [CrossRef]
  169. Østergaard, D.S.; Smith, K.M.; Tunzi, M.; Svendsen, S. Low-temperature operation of heating systems to enable 4th generation district heating: A review. Energy 2022, 248, 123529. [Google Scholar] [CrossRef]
  170. Vivian, J.; Emmi, G.; Zarrella, A.; Jobard, X.; Pietruschka, D.; De Carli, M. Evaluating the cost of heat for end users in ultra low temperature district heating networks with booster heat pumps. Energy 2018, 153, 788–800. [Google Scholar] [CrossRef]
  171. Zhu, T.; Ommen, T.; Meesenburg, W.; Thorsen, J.E.; Elmegaard, B. Steady state behavior of a booster heat pump for hot water supply in ultra-low temperature district heating network. Energy 2021, 237, 121528. [Google Scholar] [CrossRef]
  172. Quirosa, G.; Torres, M.; Soltero, V.M.; Chacartegui, R. Energetic and economic analysis of decoupled strategy for heating and cooling production with CO2 booster heat pumps for ultra-low temperature district network. J. Build. Eng. 2022, 45, 103538. [Google Scholar] [CrossRef]
  173. Huber, D.; Illyés, V.; Turewicz, V.; Götzl, G.; Hammer, A.; Ponweiser, K. Novel District Heating Systems: Methods and Simulation Results. Energies 2021, 14, 4450. [Google Scholar] [CrossRef]
  174. Arabkoohsar, A. Non-uniform temperature district heating system with decentralized heat pumps and standalone storage tanks. Energy 2019, 170, 931–941. [Google Scholar] [CrossRef]
  175. Bilardo, M.; Sandrone, F.; Zanzottera, G.; Fabrizio, E. Modelling a fifth-generation bidirectional low temperature district heating and cooling (5GDHC) network for nearly Zero Energy District (nZED). Energy Rep. 2021, 7, 8390–8405. [Google Scholar] [CrossRef]
  176. Zeh, R.; Ohlsen, B.; Philipp, D.; Bertermann, D.; Kotz, T.; Jocić, N.; Stockinger, V. Large-Scale Geothermal Collector Systems for 5th Generation District Heating and Cooling Networks. Sustainability 2021, 13, 6035. [Google Scholar] [CrossRef]
  177. Reiners, T.; Gross, M.; Altieri, L.; Wagner, H.J.; Bertsch, V. Heat pump efficiency in fifth generation ultra-low temperature district heating networks using a wastewater heat source. Energy 2021, 236, 121318. [Google Scholar] [CrossRef]
  178. Abugabbara, M.; Javed, S.; Bagge, H.; Johansson, D. Bibliographic analysis of the recent advancements in modeling and co-simulating the fifth-generation district heating and cooling systems. Energy Build. 2020, 224, 110260. [Google Scholar] [CrossRef]
  179. Wirtz, M.; Kivilip, L.; Remmen, P.; Müller, D. 5th Generation District Heating: A novel design approach based on mathematical optimization. Appl. Energy 2020, 260, 114158. [Google Scholar] [CrossRef]
  180. Hermansen, R.; Smith, K.; Thorsen, J.E.; Wang, J.; Zong, Y. Model predictive control for a heat booster substation in ultra low temperature district heating systems. Energy 2022, 238, 121631. [Google Scholar] [CrossRef]
  181. Bordignon, S.; Quaggiotto, D.; Vivian, J.; Emmi, G.; De Carli, M.; Zarrella, A. A solar-assisted low-temperature district heating and cooling network coupled with a ground-source heat pump. Energy Convers. Manag. 2022, 267, 115838. [Google Scholar] [CrossRef]
  182. Cenian, A.; Dzierzgowski, M.; Pietrzykowski, B. On the road to low temperature district heating. J. Physics Conf. Ser. 2019, 1398, 012002. [Google Scholar] [CrossRef]
  183. Toffanin, R.; Caputo, P.; Belliardi, M.; Curti, V. Low and Ultra-Low Temperature District Heating Equipped by Heat Pumps—An Analysis of the Best Operative Conditions for a Swiss Case Study. Energies 2022, 15, 3344. [Google Scholar] [CrossRef]
  184. Calise, F.; Cappiello, F.L.; Cimmino, L.; d’Accadia, M.D.; Vicidomini, M. Optimal design of a 5th generation district heating and cooling network based on seawater heat pumps. Energy Convers. Manag. 2022, 267, 115912. [Google Scholar] [CrossRef]
  185. Calise, F.; Cappiello, F.L.; d’Accadia, M.D.; Petrakopoulou, F.; Vicidomini, M. A solar-driven 5th generation district heating and cooling network with ground-source heat pumps: A thermo-economic analysis. Sustain. Cities Soc. 2022, 76, 103438. [Google Scholar] [CrossRef]
  186. Hirsch, H.; Nicolai, A. An efficient numerical solution method for detailed modelling of large 5th generation district heating and cooling networks. Energy 2022, 255, 124485. [Google Scholar] [CrossRef]
  187. Quirosa, G.; Torres, M.; Chacartegui, R. Analysis of the integration of photovoltaic excess into a 5th generation district heating and cooling system for network energy storage. Energy 2022, 239, 122202. [Google Scholar] [CrossRef]
  188. Mbiydzenyuy, G.; Nowaczyk, S.; Knutsson, H.; Vanhoudt, D.; Brage, J.; Calikus, E. Opportunities for machine learning in district heating. Appl. Sci. 2021, 11, 6112. [Google Scholar] [CrossRef]
  189. Jebamalai, J.M.; Marlein, K.; Laverge, J. Design and cost comparison of district heating and cooling (DHC) network configurations using ring topology—A case study. Energy 2022, 258, 124777. [Google Scholar] [CrossRef]
  190. Revesz, A.; Jones, P.; Dunham, C.; Davies, G.; Marques, C.; Matabuena, R.; Scott, J.; Maidment, G. Developing novel 5th generation district energy networks. Energy 2020, 201, 117389. [Google Scholar] [CrossRef]
  191. Edtmayer, H.; Nageler, P.; Heimrath, R.; Mach, T.; Hochenauer, C. Investigation on sector coupling potentials of a 5th generation district heating and cooling network. Energy 2021, 230, 120836. [Google Scholar] [CrossRef]
  192. Wirtz, M.; Neumaier, L.; Remmen, P.; Müller, D. Temperature control in 5th generation district heating and cooling networks: An MILP-based operation optimization. Appl. Energy 2021, 288, 116608. [Google Scholar] [CrossRef]
  193. Meibodi, S.S.; Loveridge, F. The future role of energy geostructures in fifth generation district heating and cooling networks. Energy 2022, 240, 122481. [Google Scholar] [CrossRef]
  194. Gudmundsson, O.; Schmidt, R.R.; Dyrelund, A.; Thorsen, J.E. Economic comparison of 4GDH and 5GDH systems—Using a case study. Energy 2022, 238, 121613. [Google Scholar] [CrossRef]
  195. Boesten, S.; Ivens, W.; Dekker, S.C.; Eijdems, H. 5th generation district heating and cooling systems as a solution for renewable urban thermal energy supply. Adv. Geosci. 2019, 49, 129–136. [Google Scholar] [CrossRef]
  196. Vivian, J.; Chinello, M.; Zarrella, A.; De Carli, M. Investigation on Individual and Collective PV Self-Consumption for a Fifth Generation District Heating Network. Energies 2022, 15, 1022. [Google Scholar] [CrossRef]
  197. Moallemi, A.; Arabkoohsar, A.; Pujatti, F.; Valle, R.M.; Ismail, K.A.R. Non-uniform temperature district heating system with decentralized heat storage units, a reliable solution for heat supply. Energy 2019, 167, 80–91. [Google Scholar] [CrossRef]
  198. Arabkoohsar, A.; Khosravi, M.; Alsagri, A.S. CFD analysis of triple-pipes for a district heating system with two simultaneous supply temperatures. Int. J. Heat Mass Transf. 2019, 141, 432–443. [Google Scholar] [CrossRef]
  199. Alsagri, A.S.; Arabkoohsar, A.; Khosravi, M.; Alrobaian, A.A. Efficient and cost-effective district heating system with decentralized heat storage units, and triple-pipes. Energy 2019, 188, 116035. [Google Scholar] [CrossRef]
  200. Xu, Q.; Wang, K.; Zou, Z.; Zhong, L.; Akkurt, N.; Feng, J.; Xiong, Y.; Han, J.; Wang, J.; Du, Y. A new type of two-supply, one-return, triple pipe-structured heat loss model based on a low temperature district heating system. Energy 2021, 218, 119569. [Google Scholar] [CrossRef]
  201. Averfalk, H.; Werner, S. Novel low temperature heat distribution technology. Energy 2018, 145, 526–539. [Google Scholar] [CrossRef]
  202. Tańczuk, M.; Skorek, J.; Bargiel, P. Energy and economic optimization of the repowering of coal-fired municipal district heating source by a gas turbine. Energy Convers. Manag. 2017, 149, 885–895. [Google Scholar] [CrossRef]
  203. Hałaj, E.; Kotyza, J.; Hajto, M.; Pełka, G.; Luboń, W.; Jastrzębski, P. Upgrading a District Heating System by Means of the Integration of Modular Heat Pumps, Geothermal Waters, and PVs for Resilient and Sustainable Urban Energy. Energies 2021, 14, 2347. [Google Scholar] [CrossRef]
  204. Matak, N.; Tomić, T.; Schneider, D.R.; Krajačić, G. Integration of WtE and district cooling in existing Gas-CHP based district heating system—Central European city perspective. Smart Energy 2021, 4, 100043. [Google Scholar] [CrossRef]
  205. Ancona, M.A.; Bianchi, M.; Branchini, L.; De Pascale, A.; Melino, F.; Peretto, A. Low temperature district heating networks for complete energy needs fulfillment. Int. J. Sustain. Energy Plan. Manag. 2019, 33–42. [Google Scholar] [CrossRef]
  206. Yang, X.; Svendsen, S. Achieving low return temperature for domestic hot water preparation by ultra-low-temperature district heating. Energy Procedia 2017, 116, 426–437. [Google Scholar] [CrossRef]
  207. Ravina, M.; Gamberini, C.; Casasso, A.; Panepinto, D. Environmental and health impacts of domestic hot water (DHW) boilers in urban areas: A case study from Turin, NW Italy. Int. J. Environ. Res. Public Health 2020, 17, 595. [Google Scholar] [CrossRef]
  208. Leoni, P.; Geyer, R.; Schmidt, R.R. Developing innovative business models for reducing return temperatures in district heating systems: Approach and first results. Energy 2020, 195, 116963. [Google Scholar] [CrossRef]
  209. Bergstraesser, W.; Hinz, A.; Braas, H.; Orozaliev, J.; Vajen, K. Lessons learned from excess flow analyses for various district heating systems. Smart Energy 2021, 1, 100005. [Google Scholar] [CrossRef]
  210. Volkova, A.; Krupenski, I.; Ledvanov, A.; Hlebnikov, A.; Lepiksaar, K.; Latõšov, E.; Mašatin, V. Energy cascade connection of a low-temperature district heating network to the return line of a high-temperature district heating network. Energy 2020, 198, 117304. [Google Scholar] [CrossRef]
  211. Dominković, D.F.; Stunjek, G.; Blanco, I.; Madsen, H.; Krajačić, G. Technical, economic and environmental optimization of district heating expansion in an urban agglomeration. Energy 2020, 197, 117243. [Google Scholar] [CrossRef]
  212. Guelpa, E.; Mutani, G.; Todeschi, V.; Verda, V. Reduction of CO2 emissions in urban areas through optimal expansion of existing district heating networks. J. Clean. Prod. 2018, 204, 117–129. [Google Scholar] [CrossRef]
Figure 1. A screenshot of the heat atlas for the Netherlands from the PETA4 mapping application.
Energies 15 07160 g001
Figure 2. The general cost comparison between individual supply solution and DH supply.
Energies 15 07160 g002
Figure 4. Regional energy use prediction approaches: (a) Top down; (b) Bottom up.
Energies 15 07160 g004
Figure 5. Summary of bottom-up approaches for regional energy use prediction.
Energies 15 07160 g005
Figure 6. Population density of IEA bioenergy member countries, data from FAOSTAT, 2018 data.
Energies 15 07160 g006
Figure 7. Scheme of solar DH systems, (a) centralized, (b) distributed.
Energies 15 07160 g007
Figure 8. Two major feed-in principles for distributed solar DH systems.
Energies 15 07160 g008
Figure 11. The temperature levels for three different DH configurations: LTDH, ULTDH and 5GDHC.
Energies 15 07160 g011
Table 1. Summary of major features for different generations of DH systems.
GenerationDevelopment TimeMediumOperating TemperatureMajor Design Features
1G1880s–1930sSteamSupply: <200 °C; Return: <80 °CAbove-ground steel pipes
2G1930s–1970sWaterSupply: >100 °C; Return: <70 °C
  • Underground insulated steel pipes
  • Heavy on-site units (heat storages, heat exchangers etc.)
3G1970s–nowWaterSupply: <100 °C; Return: <45 °C
  • Pre-insulated steel pipes with casing
  • Prefabricated components
4G2020s–FutureWaterSupply: <70 °C; Return: ~25 °C
  • Higher flexibility
  • A high fraction of renewables
  • High interaction with other energy systems
Table 3. Identified barriers for the utilisation of sustainable resources in DH systems.
Energy SourceIdentified BarriersRole of HP in Its Implementation in DH
GeothermalHigh initial costMore than 70% of installed capacity is reliant on HP [60]
BiomassLong distance between source and potential userNot necessary
Solar
  • Large land use for centralized solar systems
  • Temporal mismatch between production and consumption
The combination of PV/PVT + HP was shown to be the best option for solar energy use
Excess heat
  • Supply risk [61]
  • Low technical maturity [62]
  • Long payback time
Recovery of most excess heat is reliant on HP: industrial surplus heat (50% at low grade 30–100 °C), urban waste heat (mainly at 20–40 °C)
Publisher’s Note: MDPI stays neutral with regard to jurisdictional claims in published maps and institutional affiliations.

