Article

Planning, Operation, and Design of Market-Based Virtual Power Plant Considering Uncertainty

1
Institute for Globally Distributed Open Research and Education (IGDORE), Cleveland, Middlesbrough TS1 4JE, UK
2
School of Computing, Engineering and Built Environment, Glasgow Caledonian University, Glasgow G4 0BA, UK
3
School of Engineering, Technology, and Design, Canterbury Christ Church University, Kent CT1 1QU, UK
*
Author to whom correspondence should be addressed.
Energies 2022, 15(19), 7290; https://doi.org/10.3390/en15197290
Submission received: 7 September 2022 / Revised: 23 September 2022 / Accepted: 28 September 2022 / Published: 4 October 2022
(This article belongs to the Section C: Energy Economics and Policy)

Abstract

:
The power systems of today seem inseparable from clean energy sources such as wind turbines (WTs) and photovoltaics (PVs). However, due to their uncertain nature, operational challenges are expected when WT and PV energy is added to the electricity network. It is necessary to introduce new technologies to compensate for the intermittent nature of renewable energy sources (RESs). Therefore, rationally implementing a demand response (DR) program with energy storage systems (ESSs) in a virtual power plant (VPP) environment is recommended as a way forward to minimize the volatile nature of RESs and improve power system reliability. Our proposed approach aims to maximize social welfare (SW) (i.e., maximization of consumer benefits while minimizing energy costs). Our method assesses the impact of the DR program on SW maximization. Two scenarios are examined, one with and one without a DR program. Stochastic programming theory is used to address the optimization problem. The uncertain behavior of WTs, PVs, and load demand is modeled using a scenario-based approach. The correctness of the proposed approach is demonstrated on a 16-bus UK generic distribution system. Our results show that SW and active power dispatch capacity of WT, PV, and ESS are fairly increased using the proposed approach.

1. Introduction

The fraction of RESs has significantly increased over recent years as a result of the growing global concern about climate change. The benefits of RES are twofold: first, they do not contribute to the environment’s carbonization, and second, they do not cause the warming effects of carbon emissions. Organizations, researchers, academics, and scientists are paying close attention to the migration of traditional energy systems into non-traditional energy systems. This is due to the prevalence of RESs, which are environmentally friendly, pollution-free, and possible to locally manage. To incentivize investment into RES development, a number of countries, particularly the US, the UK, Australia, China, Germany, and Europe, have sponsored incentive-based DR programs. Enabling these small-scale power providers to exchange electricity or offer ancillary services to power networks, minimizes the strain on the grid during peak hours. Hence, improving the reliability of power systems [1,2,3,4,5].
However, integrating RESs into the energy market is rather challenging. The effectiveness of RESs, particularly WTs and PVs, is significantly impacted by climate change. Their generation is unreliable, intermittent, and constrained by location. As a result, the operating efficiency of the electricity system could suffer, leading to grid instability [6,7,8,9,10]. Moreover, RES generation is typically limited, especially when considering PVs, which have a maximum output of 10 kW. This makes it challenging to predict whether RESs will be able to keep up with the stated schedule of the power market.
To overcome these challenges, the concept of a VPP was put into practice. A VPP is a flexible decentralized network of interconnected small to medium power generating units, controlled by a single centralized system. The units could be power sources (such as WT, PV, hydro, biogas, and CHP), power consumers, DR, and energy storage systems. The VPP operator monitors and manages all of the network’s aggregated assets using a centralized control algorithm. The aim of the VPP is to jointly estimate, deliver, and trade the power and flexibility of the assets in the day-ahead energy market. Therefore, small units gain access to the market which would be inaccessible on their own. Although a DR can be described as a shift in the consumer’s energy usage to better balance the demand and supply for energy, it is a viable method of minimizing peak demand. Our literature review includes several studies that support the concept of DR programs under the umbrella of VPPs and show that so implementing these programs has both technical and financial advantages.
A VPP is a fairly new phenomenon that brings together the capacity of renewable and non-renewable energy sources, storage technologies, and CLs to operate in the day-ahead energy market to improve system reliability. It also improves grid reliability by providing utilities with additional distribution-level operational capacity. Therefore, implementing a DR program with ESS is anticipated to have far-reaching positive effects on SW, WTs, PVs, and ESS active power generation and delivery ability. There has been limited prior research done about market-based operational planning of a MB-VPP in the context of the electricity market. Very limited papers have committed to modeling the operational planning problem of VPPs. In this study, we designed and developed a market-based VPP energy trading model with a DR program and ESS that participate in the day-ahead energy market to maximize SW in the context of the energy market environment. The VPP under consideration is made up of a DR scheme, distributed energy resources (DERs), energy storage technologies, and CLs. The scheduling problem determines how much energy will be traded one day ahead of time in the market. In this study, two scenarios are examined, one with and one without a DR program. A scenario-based method is applied to model the uncertainties of WTs, PVs, and load demand. The correctness of the proposed model and approach is demonstrated on a 16-bus UK generic distribution system. This method evaluates the impact of a DR program on SW, WTs, PVs, and ESS and their active power dispatch ability to the load demand over the planning horizon to maximize SW.

1.1. Literature Review

We describe some of the pertinent and closely related work that has been highlighted and proposed in the existing literature to date. The ability of the priced-based DR program was investigated by the authors of [11] to adjust the supply and demand imbalance for the short term. The authors of [12] analyzed the effects of the DR program with ESS on the operational challenges of renewable energy sources. The goal of the study was to reduce operational costs, and it was observed that DR with ESS had a favorable impact on the operational challenges of renewables. With regard to demand response and uncertainties, a risk-based stochastic mechanism for scheduling the energy of a VPP is proposed in ref. [13]. An optimal bidding strategy of a VPP that participates in the day-ahead power market has been proposed by the authors of [14] in order to reduce costs for consumers. The authors of [15] have evaluated the energy trading model of a VPP that consists of dispatchable and non-dispatchable energy sources, electrical loads, and energy storage technologies. Maximizing SW was the main objective, but this ignored the uncertainty of RESs. The authors of [16] examined the interactive characteristics of a VPP in distribution systems that offer flexible support services. Minimizing the operational cost function was the main objective; however, the authors disregarded renewable energy uncertainty. In [17], the authors presented a method for market transactions that included VPP participation and assessed the value of VPP cooperation. However, they disregarded the uncertainties of distributed generators (DGs). Due to uncertainty, the anticipated output of a VPP may deviate from the actual generation. As a result, the VPP’s actual profit may be lower than its expected profit. Therefore, it is important to take DG uncertainties into consideration. Hybrid AC-DC microgrid operational planning has been examined by the authors of [18], taking into account the uncertainties associated with photovoltaics, wind turbines, and electrical loads. Maximizing SW was the main objective. However, the authors overlooked the significance of energy storage systems in the case of renewable generation. The authors of [19] examined the effect of concentrating solar power plants on some other renewable production. The results demonstrate that a renewable system can minimize demand variation and also minimize generation costs. However, the electricity market is disregarded in this study. The authors of [20] evaluated the role of a DR program in the electricity market to minimize peak load demand. However, the importance of uncertainty modeling is often underestimated in the presence of renewable generation, which may lead to differences between estimated and actual output. The authors of [21] proposed a two-stage stochastic programming approach for supporting sustainable power systems under uncertainty. Their methods included minimizing system costs, lowering pollutant emissions, and improving power system reliability. However, the significance of ESS was overlooked. Table 1 shows the comparison of the proposed model with the body of existing literature.

1.2. Contributions and Study Layout

The following are the key contributions of this work regarding the reviewed literature:
  • To design a market trading mechanism for a VPP that trades in the day-ahead energy market with the integration of a DR program and ESS;
  • To develop a market-based computationally efficient model for a VPP that operates in the day-ahead market;
  • To perform a comparative analysis of a case study to demonstrate the effectiveness of the proposed strategy by thoroughly assessing the simulation results.
The remaining layout of this paper is organized as follows: Section 2 describes the aim and methodology of the proposed study. A model of the uncertainties associated with wind speed, solar irradiation, and load demand is presented in Section 3. Section 4 presents the VPP market model. Classification of the demand response program is presented in Section 5. Problem formulation, a case study, and simulation results are provided in Section 6. Section 7 provides concluding remarks.

2. Methodology

The primary objective of this study was to optimize the social welfare of a VPP in the electricity market by integrating a DR program into the proposed model, as shown in Figure 1 Market-based optimal power flow is used to evaluate and solve the operational planning problem of a VPP within the power market. The proposed approach evaluates the effect of the controllable loads participating in the DR program, and its impact on maximizing social welfare and on the active power generation and delivery ability of WTs, PVs, and ESS to the load demand over the planning horizon. The DR program and ESS are good alternatives for resolving the supply and demand imbalance, alleviating the impact of the uncertainties associated with renewable energy sources, as well as mitigating load demand during peak hours. Figure 1 shows a stepwise solution approach to the problem. The stochastic programming approach is used to initialize hour t and gather historical data on the market price, renewable generation, ESS, and load demand. Price-responsive CLs are willing to sell their load curtailment services to VPP operators for the current hour t and the remaining hours of the day. The uncertain behavior of WTs, PVs, and load demand is modeled using a scenario-based approach. The aim of the objective function is to maximize social welfare in (10), subject to the equality and inequality constraints of the system. The correctness of the proposed model and approach is demonstrated on a 16-bus UK generic distribution system. Results of the case study show that SW and active power dispatched by WT, PV, and ESS are fairly increased with a DR approach.

3. Uncertainty Modeling

A scenario-based approach was used to model the uncertainties related to solar irradiation, wind speed, and load demand, where a scenario was defined as a possible realization of an uncertain parameter [1,15]. The probability density function (PDF) was used for each solar irradiation, wind speed, and load demand to generate 24 scenarios.

3.1. Wind Speed Modeling

The wind speed variation in a specific area was modeled using the Weibull PDF [1,18,21]. The PDF function that correlates the wind speed and the WT module output power is expressed by (1).
P D F ( ν ) = k c v c k 1 exp v c k
where v, c, and k represent the wind speed, Weibull PDF scale index, and shape index, respectively. Therefore, the WT module output power can be examined by employing its power curve [22,23,24].
In Equation (2), The Pw and Prated represent the WT output power and rated power, respectively. vci and vco represent the cut-in and cut-out speed, respectively. The rated speed of WT is represented by vr. Figure 2 shows the wind speed power curve of WT.
P w t ( ν ) = 0 , 0 ν v c i P r a t e d , × ν ν c i ν r ν c i , ν c i ν ν r P r a t e d , ν r ν ν c o 0 , ν c o ν  
Therefore, the output power of the WT module at bus i and scenario w can be expressed as follows:
0 P i , w w t γ i , w w t × P i . r a t e d w t
where γ i , w w t is the percentage of active power generated by the WT.

3.2. Modeling of Solar Irradiance

Beta PDF was employed to model solar irradiance, as follows:
P D F ( S ) = Γ ( α + β ) Γ ( α ) + Γ ( β ) × s α 1 × ( 1 s ) β 1 , 0 s 1 , 0 α , β 0 e l s e
The solar irradiance (in kW/m2) was represented by S. The Beta PDF parameters (i.e., α and β) were determined as follows:
β = ( 1 μ ) × μ × ( 1 μ ) σ 2 1
α = μ × β 1 μ
where µ and σ denote the mean value and the standard deviation. Solar irradiation and ambient temperature were the key parameters in determining the PV module output power, expressed by using Equations (7) and (8) [25,26,27].
P P V = P S T C G 100 1 + δ T c e l l 25
T c e l l = T a m b + N O C T 20 800 G
where P P V and P S T C denote the PV module output power in kilowatts and power under standard test conditions in MW, respectively. The power temperature coefficient in (%/°C) is denoted by δ. The cell temperature in °C is represented by T c e l l . The ambient temperature in °C is represented by T a m b , and the nominal operating temperature of the cell in °C is represented by NOCT. G denotes solar irradiance in W/m2 [28,29].

3.3. Load Demand Uncertainty Modeling

The load demand for each bus was modeled using the normal PDF function. The normal distribution PDF for undetermined load l is given by (9), as follows:
P D F ( l ) = 1 σ l 2 π × exp l μ l 2 2 σ l 2
where σƖ is the standard deviation and μƖ is the mean value [30,31,32,33].

4. Proposed Market Model and Method Description

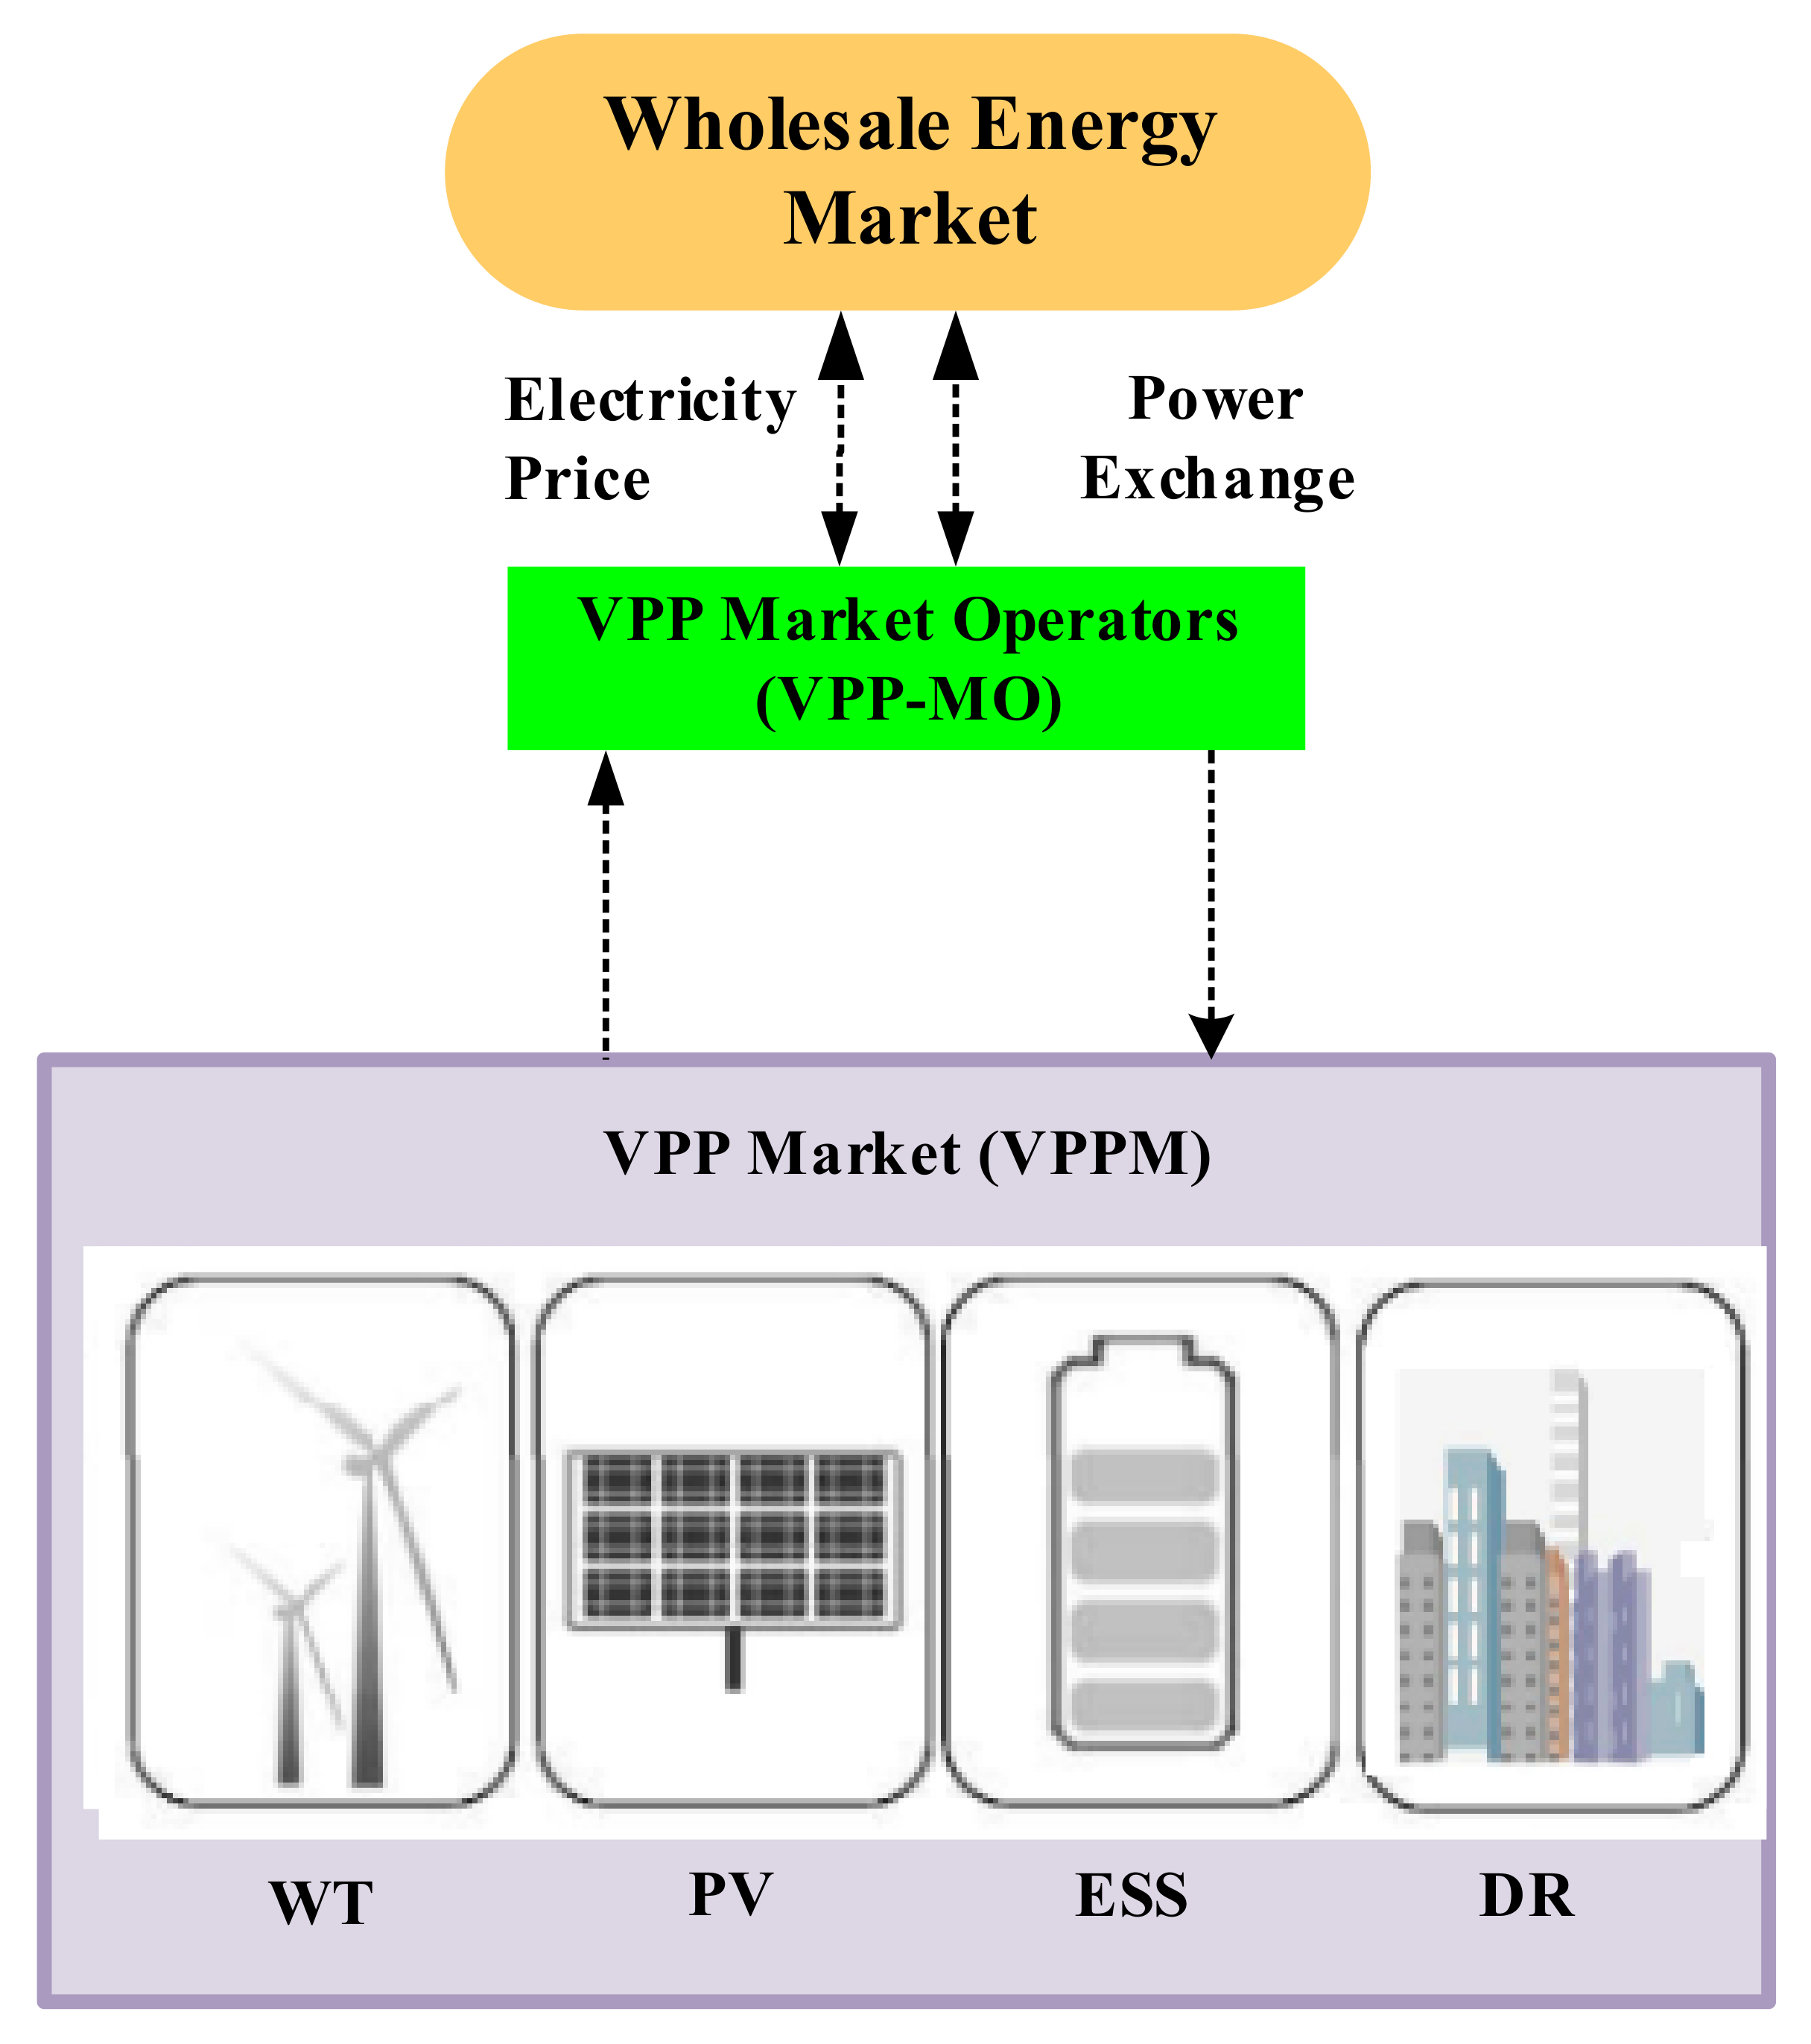
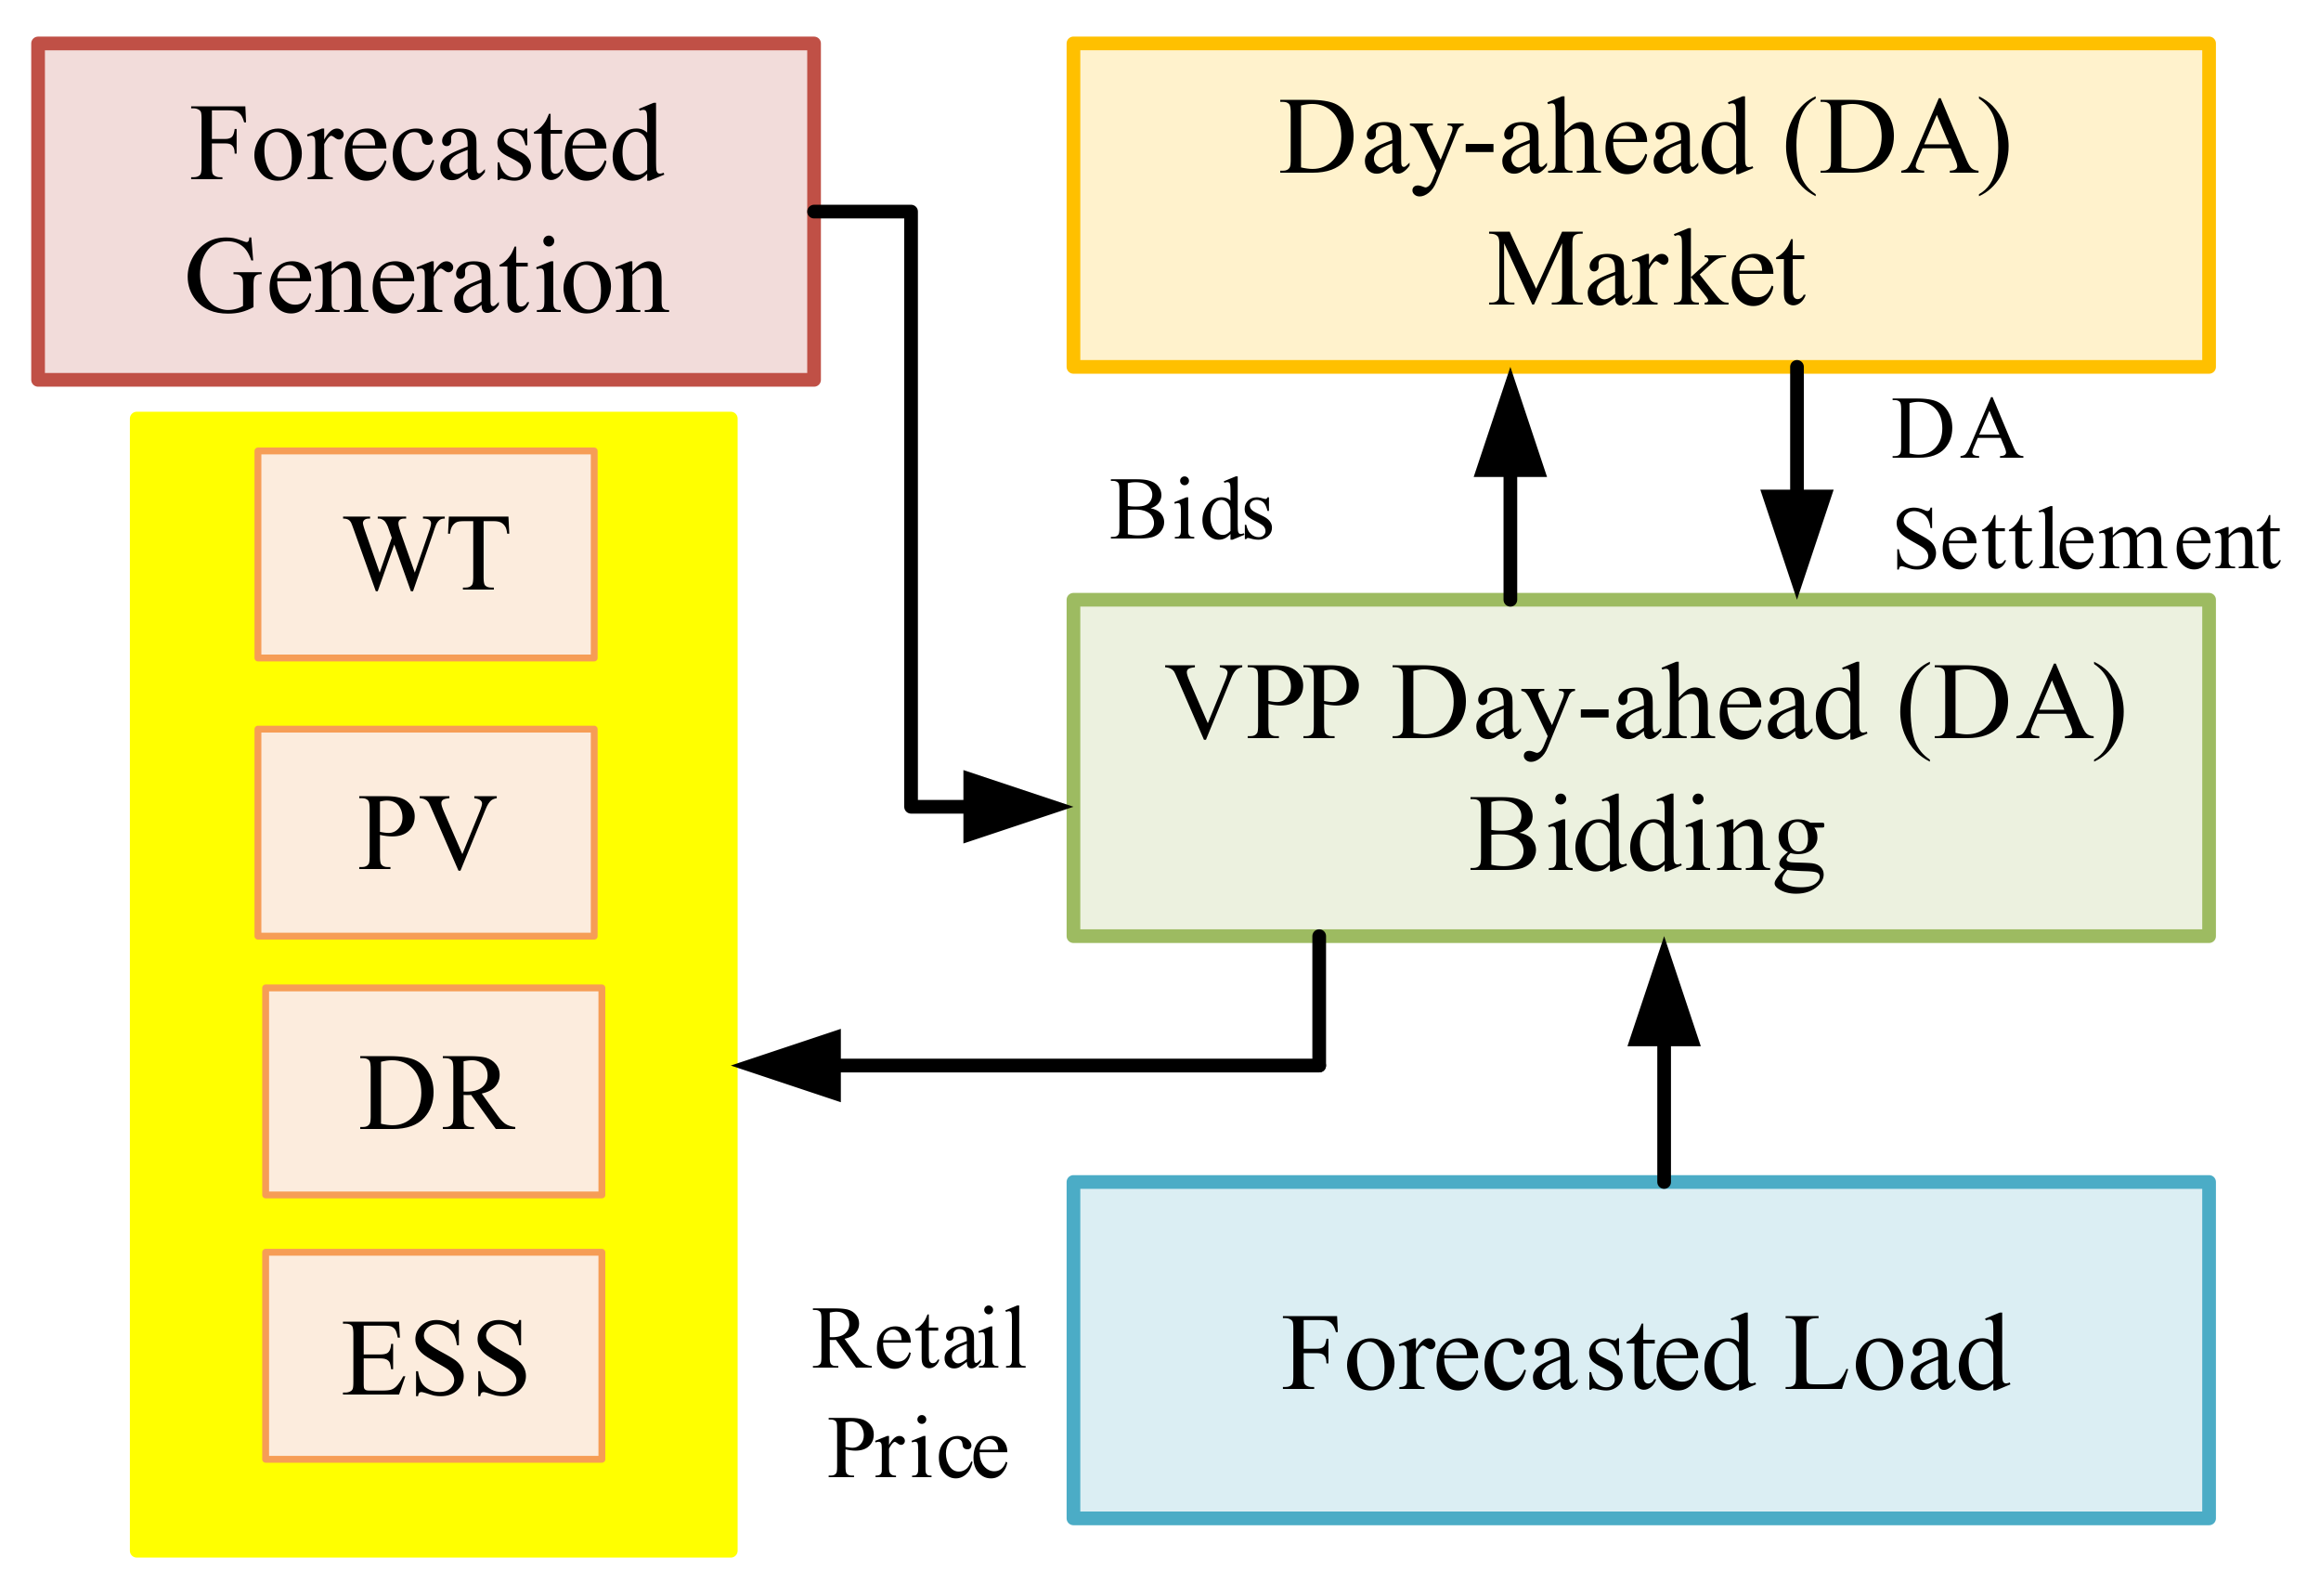
The VPP brings together different distributed energy technologies in the electrical market to improve operational performance and reliability of the power system. In our proposed model, we postulated that we would centrally manage all trading operations taking place inside the VPP structure. Electric energy could be sold and bought on the day-ahead market one day before the scheduled delivery date. Sellers and buyers could present their offers to the market operators for participation in the day-ahead energy market. The owner of the VPP that took part in the day-ahead market (DAM) presented their energy bids and controlled the components of the aggregated bid in a way that maximized overall social welfare. This established how much energy could be purchased or sold on the electricity market. The proposed model is presented in Figure 3 and shows its interaction with the electricity market. The VPP model comprised energy storage, electrical loads, wind farms, photovoltaics, wind, and the DR program. In this study, a direct control method was used to ensure that DERs were coordinated and represented effectively in the market. Figure 4 demonstrates the performance of the VPP market strategy in the day-ahead electricity market.

5. Demand Response Programs

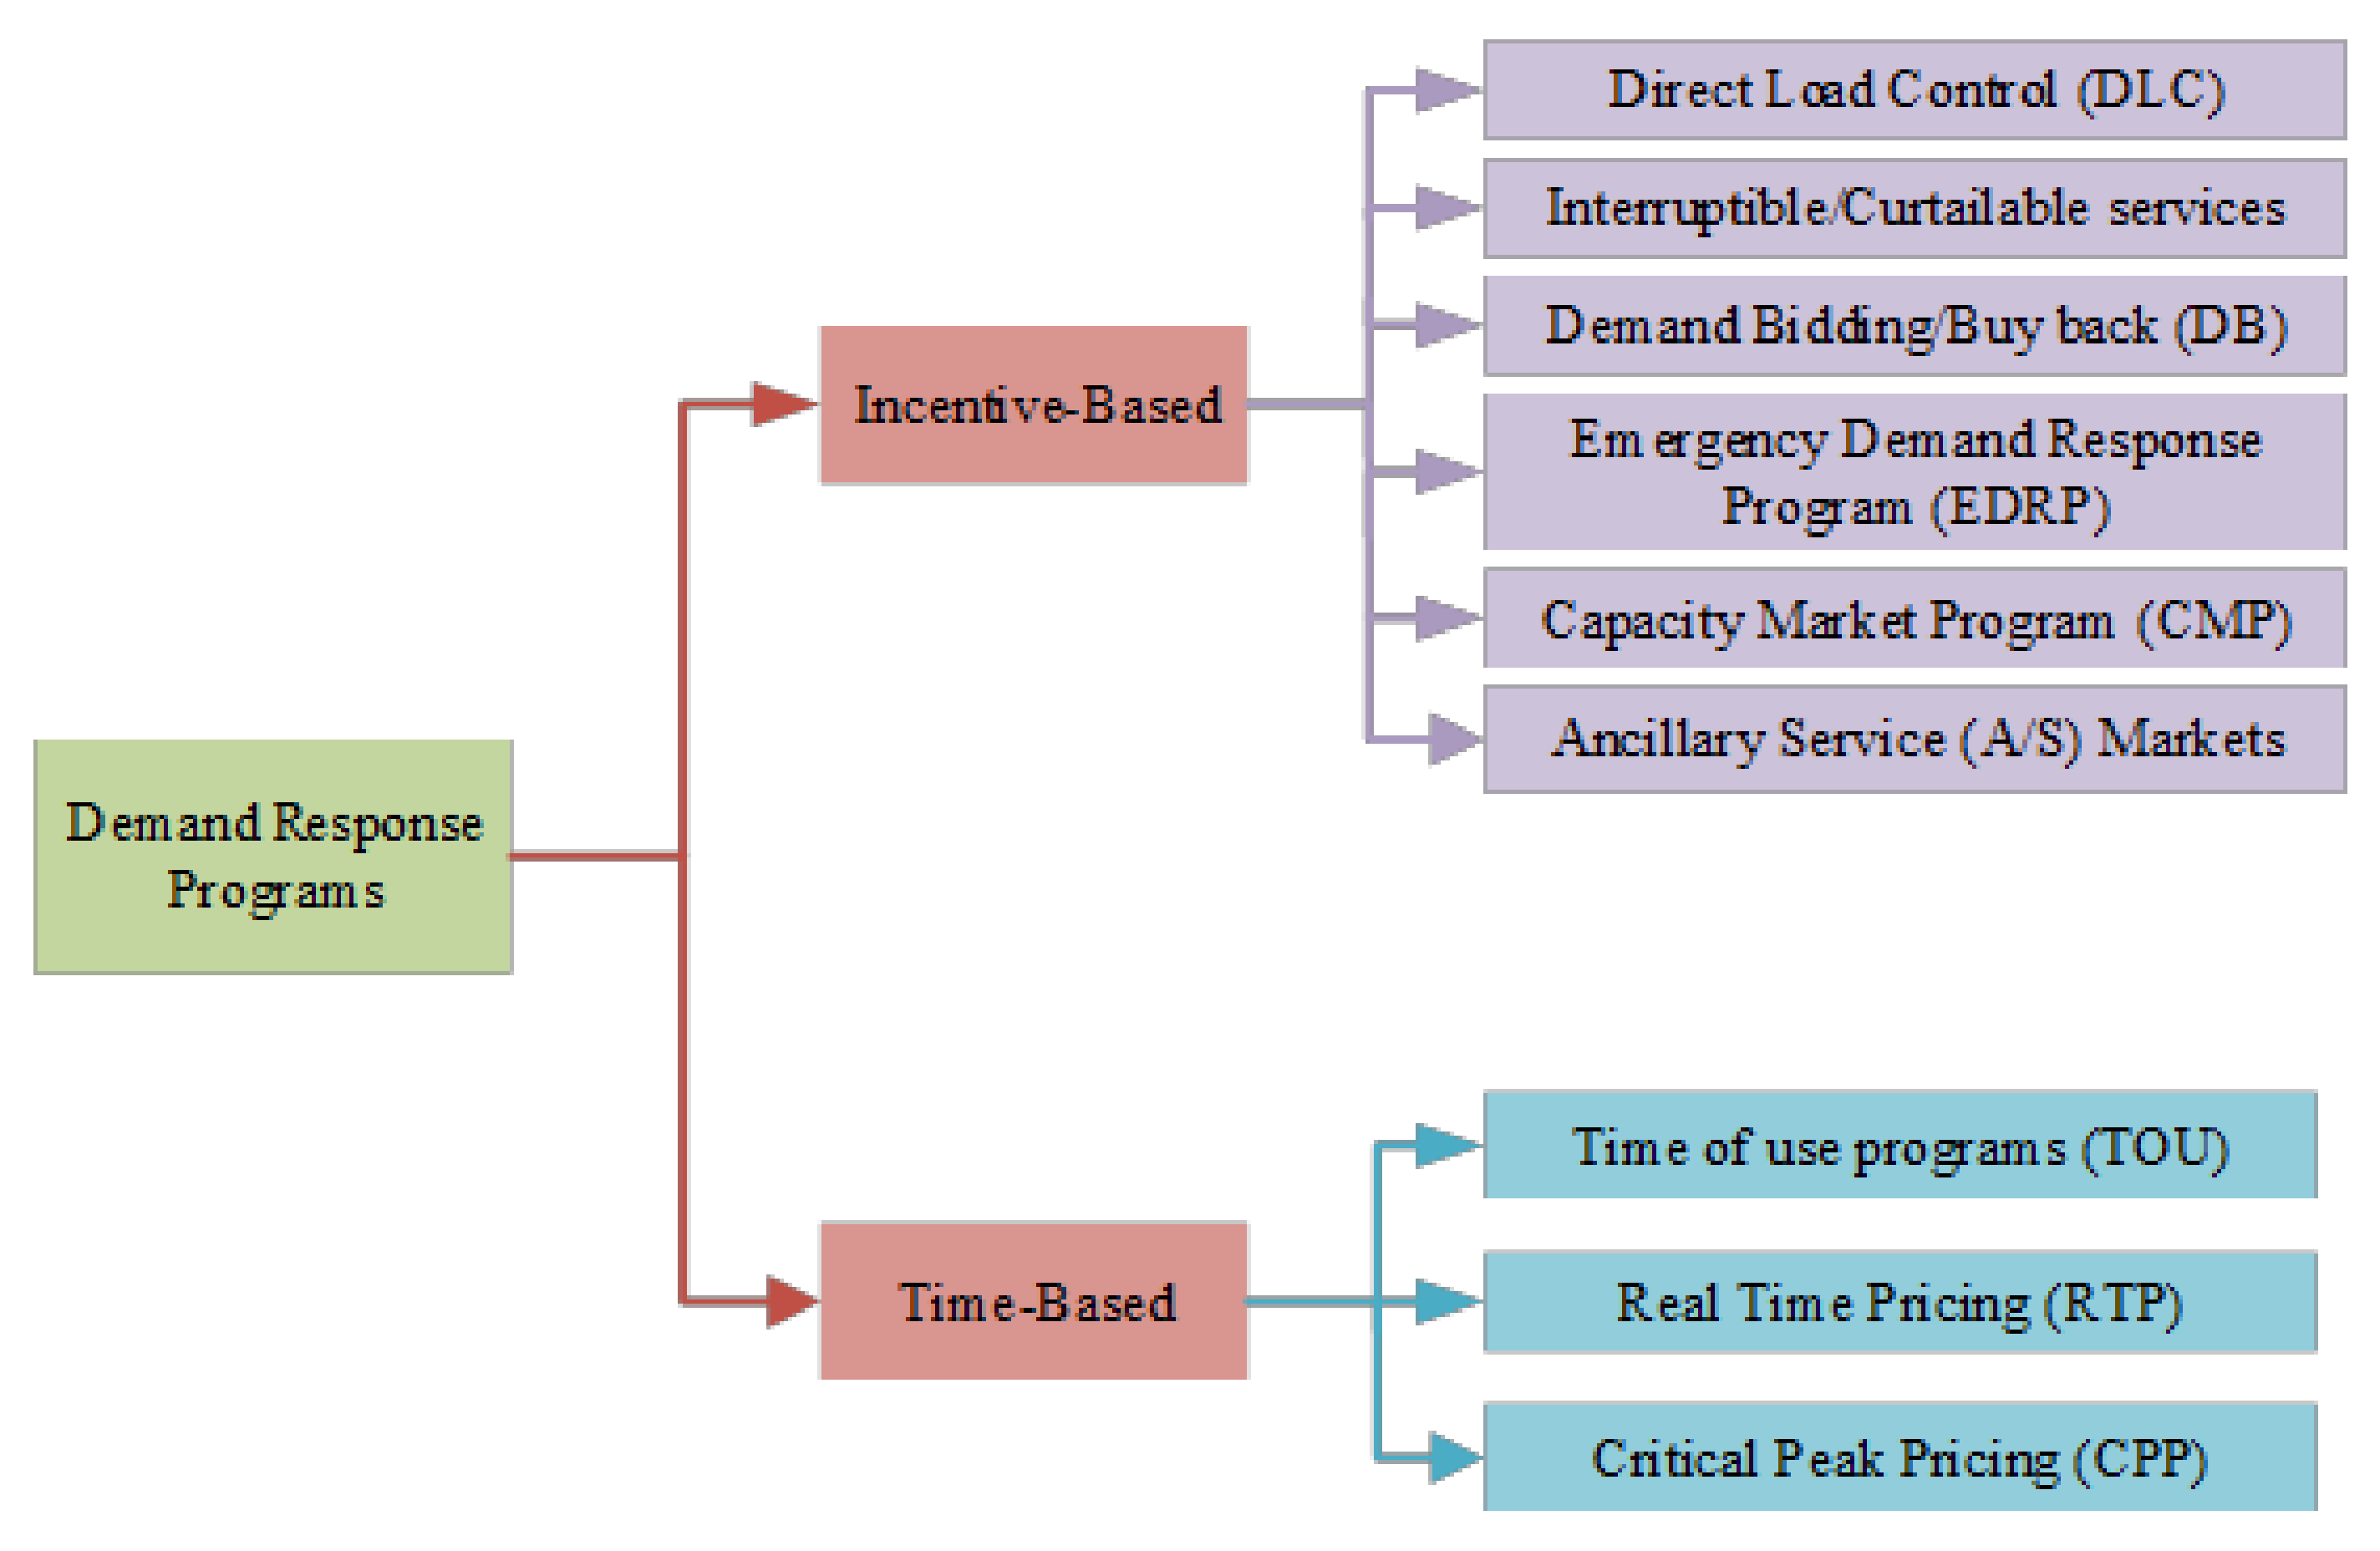
The two basic categories of DR programs are time-based and incentive-based programs. This categorization is illustrated graphically in Figure 5.

5.1. Incentive-Based Programs

Incentive-based programs are sub-categorized into six sections, including (1) direct load control, (2) interruptible/curtailable services, (3) emergency demand response, (4) demand bidding, (5) capacity market, and (6) ancillary service market [34].
The direct load control (DLC) application allows the system operator to remotely manage and alter client consumption. During power system emergencies, customers participating in the “Interruptible/Curtailable” program are obligated to minimize their consumption; otherwise, they risk being punished. In an emergency demand response program, the system operator compensates users for reducing their energy consumption when the system is under stressful conditions. In a demand bidding program, big clients, such as generation corporations, can engage in power markets to gain financial benefits. In the capacity market program, consumers are required to lower their pre-planned loads or face penalties. Consumers in the ancillary service market program inform the system operator of their intention to reduce their consumption. They can then compete in the ancillary service sector as a reserve alternative [34].

5.2. Time-Based Programs

Time-based programs are sub-categorized into three sections, including (1) time of use, (2) real-time pricing, and (3) critical peak pricing.
In a time-of-use program, energy prices fluctuate in line with load consumption. There are generally three basic breakdowns of energy consumption; peak load periods have a high energy price, whereas off-peak and valley periods have average and low prices, respectively.
Real-time pricing (RTP) programs are identical to TOU programs, the primary distinction is in the abundance of pricing ranges available through RTP.
Usage of the critical peak pricing program is limited to emergency circumstances. These kinds of programs are helpful when the system is under heavy demand.

6. Objective Function

The purpose of the MB-VPP operational planning was to maximize SW in (10). It jointly maximizes the well-being of the end-users and minimizes energy generation costs over the planning horizon, which is represented as follows:
Maximise SW = i t w P i , t , w D · C o s t i , t , w D + t w P t , w G R I D · C o s t t , w G R I D   i t w P i , t , w W I N D · C o s t i , t , w W I N D i t w P i , t , w P V · C o s t i , t , w P V i t w P i , t , w D R I n c e n t i , t , w D R + P e s s , t , w D I S η D I S η C H · P e s s , t , w C H C o s t e s s , t , w B
where active power demand is represented by P i , t , w D in the 1st term of the objective function (10), and C o s t i , t , w D represents its bid price that is charged to consumers. The 2nd term, P t , w G r i d , is the quantity of power exchanged with the grid and C o s t t , w G r i d is the price of power exchanged with the grid. Wind power generation and its production costs are represented by the 3rd term, P i , t , w W I N D C o s t i , t , w W I N D , respectively. The 4th term, P i , t , w P V C o s t i , t , w P V , represents PV power generation and its production cost. The 5th term, P i , t , w D R I n c e n t i , t , w D R , represents the demand response program active power reduction and the incentive price offered. The last term of the objective function, P e s s , t , w C H / P e s s , t , w D I S , indicates the charging and discharging of the ESS and its cost is represented by C o s t e s s , t , w C H / C o s t e s s , t , w D I S , respectively. Charging and discharging efficiencies of the ESS is represented by η C H / η D I S .

6.1. Constraints

Wind turbine installed capacity: Equation (11) shows the maximum and minimum installed capacity of WT generators.
P i , t , w W I N D M I N P i , t , w W I N D P i , t , w W I N D M A X
Photovoltaics installed capacity: Equation (12) represents the minimum and maximum generation capacity of PV units.
P i , t , w P V M I N P i , t , w P V P i , t , w P V M A X
Maximum installed capacity: Equation (13) represents the maximum installed capacity of both WTs and PVs.
P i , t , w M A X = N G P i , t , w W I N D + P i , t , w P V
The minimum and maximum permissible energy exchange between the upstream grid and the VPP is limited by Equation (14).
P t , w G R I D M I N P t , w G R I D P t , w G R I D M A X
Demand response constraint: Equation (15) describes contribution from demand response providers as a demand drop in each period of time and scenario.
P i , t , w D R M I N P i , t , w D R P i , t , w D R M A X
Voltage limits: Equation (16) represents the maximum and minimum limits of voltage at each bus.
V i M I N V i V i M A X
Energy storage system operation: The energy storage system operation is presented from Equations (17) to (23).
0 P e s s , t , w C H P e s s , t , w C H ¯ · U t C H
0 P e s s , t , w D I S P e s s , t , w D I S ¯ · U t D I S
E e s s ¯ S O C e s s E e s s ¯
S O C ( t = 0 ) = E e s s I N T I A L
S O C ( t = 24 ) = E e s s F I N A L
U e s s C H + U e s s D I S 1
S O C ( t ) = S O C ( t 1 ) + η C H P t C H Δ t 1 η D I S P t D I S Δ t
where the charging and discharging of the ESS is represented by P e s s , t , w C H and P e s s , t , w D I S , respectively. Maximum charging and discharging of the ESS are represented by P e s s , t , w C H ¯ / P e s s , t , w D I S ¯ , respectively. U e s s C H and U e s s D I S are binary variables, meaning that charging and discharging of the ESS in the same time period is not allowed. E e s s ¯ / E e s s ¯ represents the maximum and minimum energy store in the ESS. The initial and final energy storage levels in the ESS are denoted by E e s s I N I T I A L and E e s s F I N A L , respectively. η C H and η D I S represents the charging and discharging efficiencies of the ESS. S O C ( t ) represents the state of charge of the ESS.
Power balance constraint: Equation (23) represents the power balance constraint that applies to each bus and must be satisfied. It means that the required generation of the VPP and desired amount of power should be met.
P i , t , w W I N D + P i , t , w P V + P i , t , w D R + P t , w G R I D + P e s s , t , w D I S P e s s , t , w C H P i , t , w D

6.2. Case Study

We use a case study to illustrate the effectiveness of the proposed strategy and validate the results. For numerical analysis, a generic 16-bus 33 kV UK generic distribution system (UKGDS) was used. A 16-bus UKGDS single-line diagram is shown in Figure 6. During normal operation, the VPP is connected to the main grid. The ultimate capability of PVs, energy storage systems, and WTs are determined by applying optimal power flow over the planning horizon. In this study, we made the assumption that the distribution network consists of three PV and four WT units. In the distribution network, there are three PV candidate buses with nominal generations of 440 kW, located at positions 12, 14, and 16, and WT candidate buses located at positions 3, 6, 9, and 1,1 with a nominal generation of 660 kW [15]. The 200 kW energy storage system is installed at their chosen candidate bus at position 15. The upper and lower voltage values are regarded as Vmax = 1.06 p.u. and Vmin = 0.94 p.u [10]. The active power cost of the DR program is assumed to be 10 $/kW, which is paid to consumers in order to lower load demand at each bus.
All the relevant data presented in [15,18] have been used with modest modifications for our suggested model. In this study, we looked at the operational planning problem of VPPs within the power market. A VPP operational planning problem in the energy environment is approached in a novel way that maximizes SW while respecting the constraints of the problem. In order to reduce the computational load and increase the efficiency and accuracy of solving the problem, the number of scenarios in this study was restricted to 24. The problem was formulated as a mixed-integer linear programming (MILP) problem using a general algebraic modeling simulation (GAMS), optimization software [35,36], and the CPLEX solver to produce the best outcomes.

6.3. Simulation Results

Busbars with the highest power dispatch for each energy system is shown in Table 2.
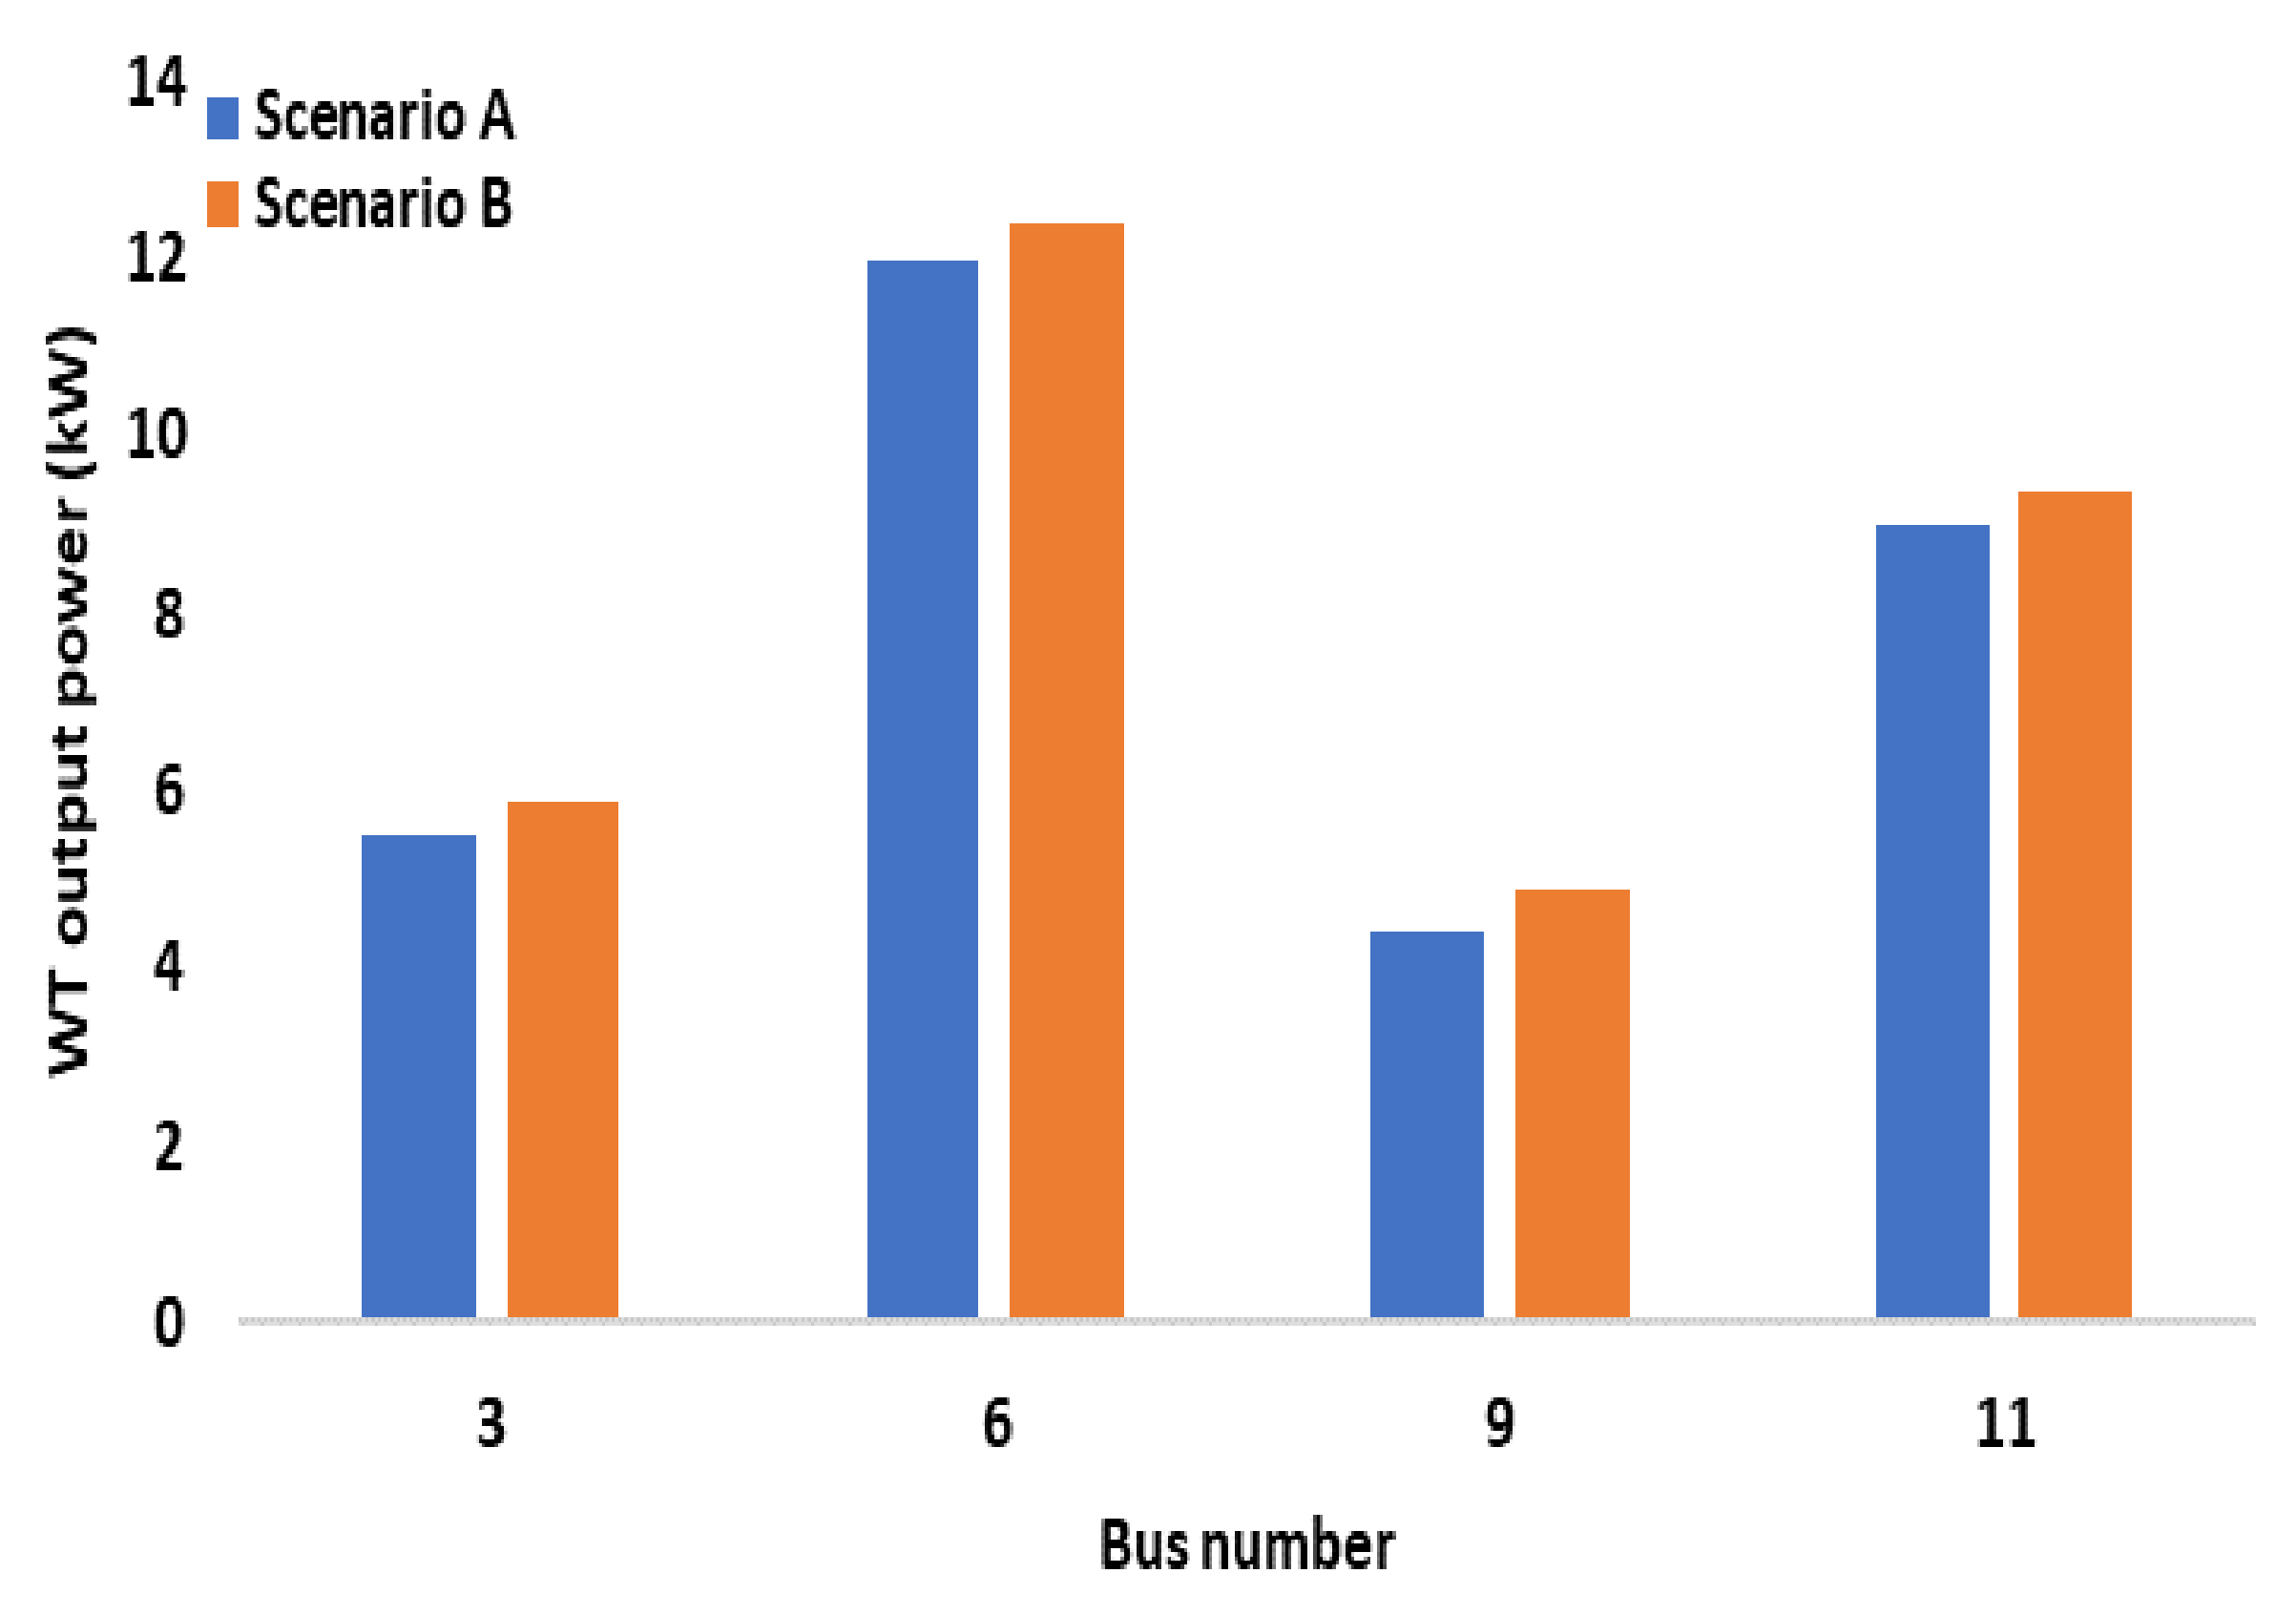
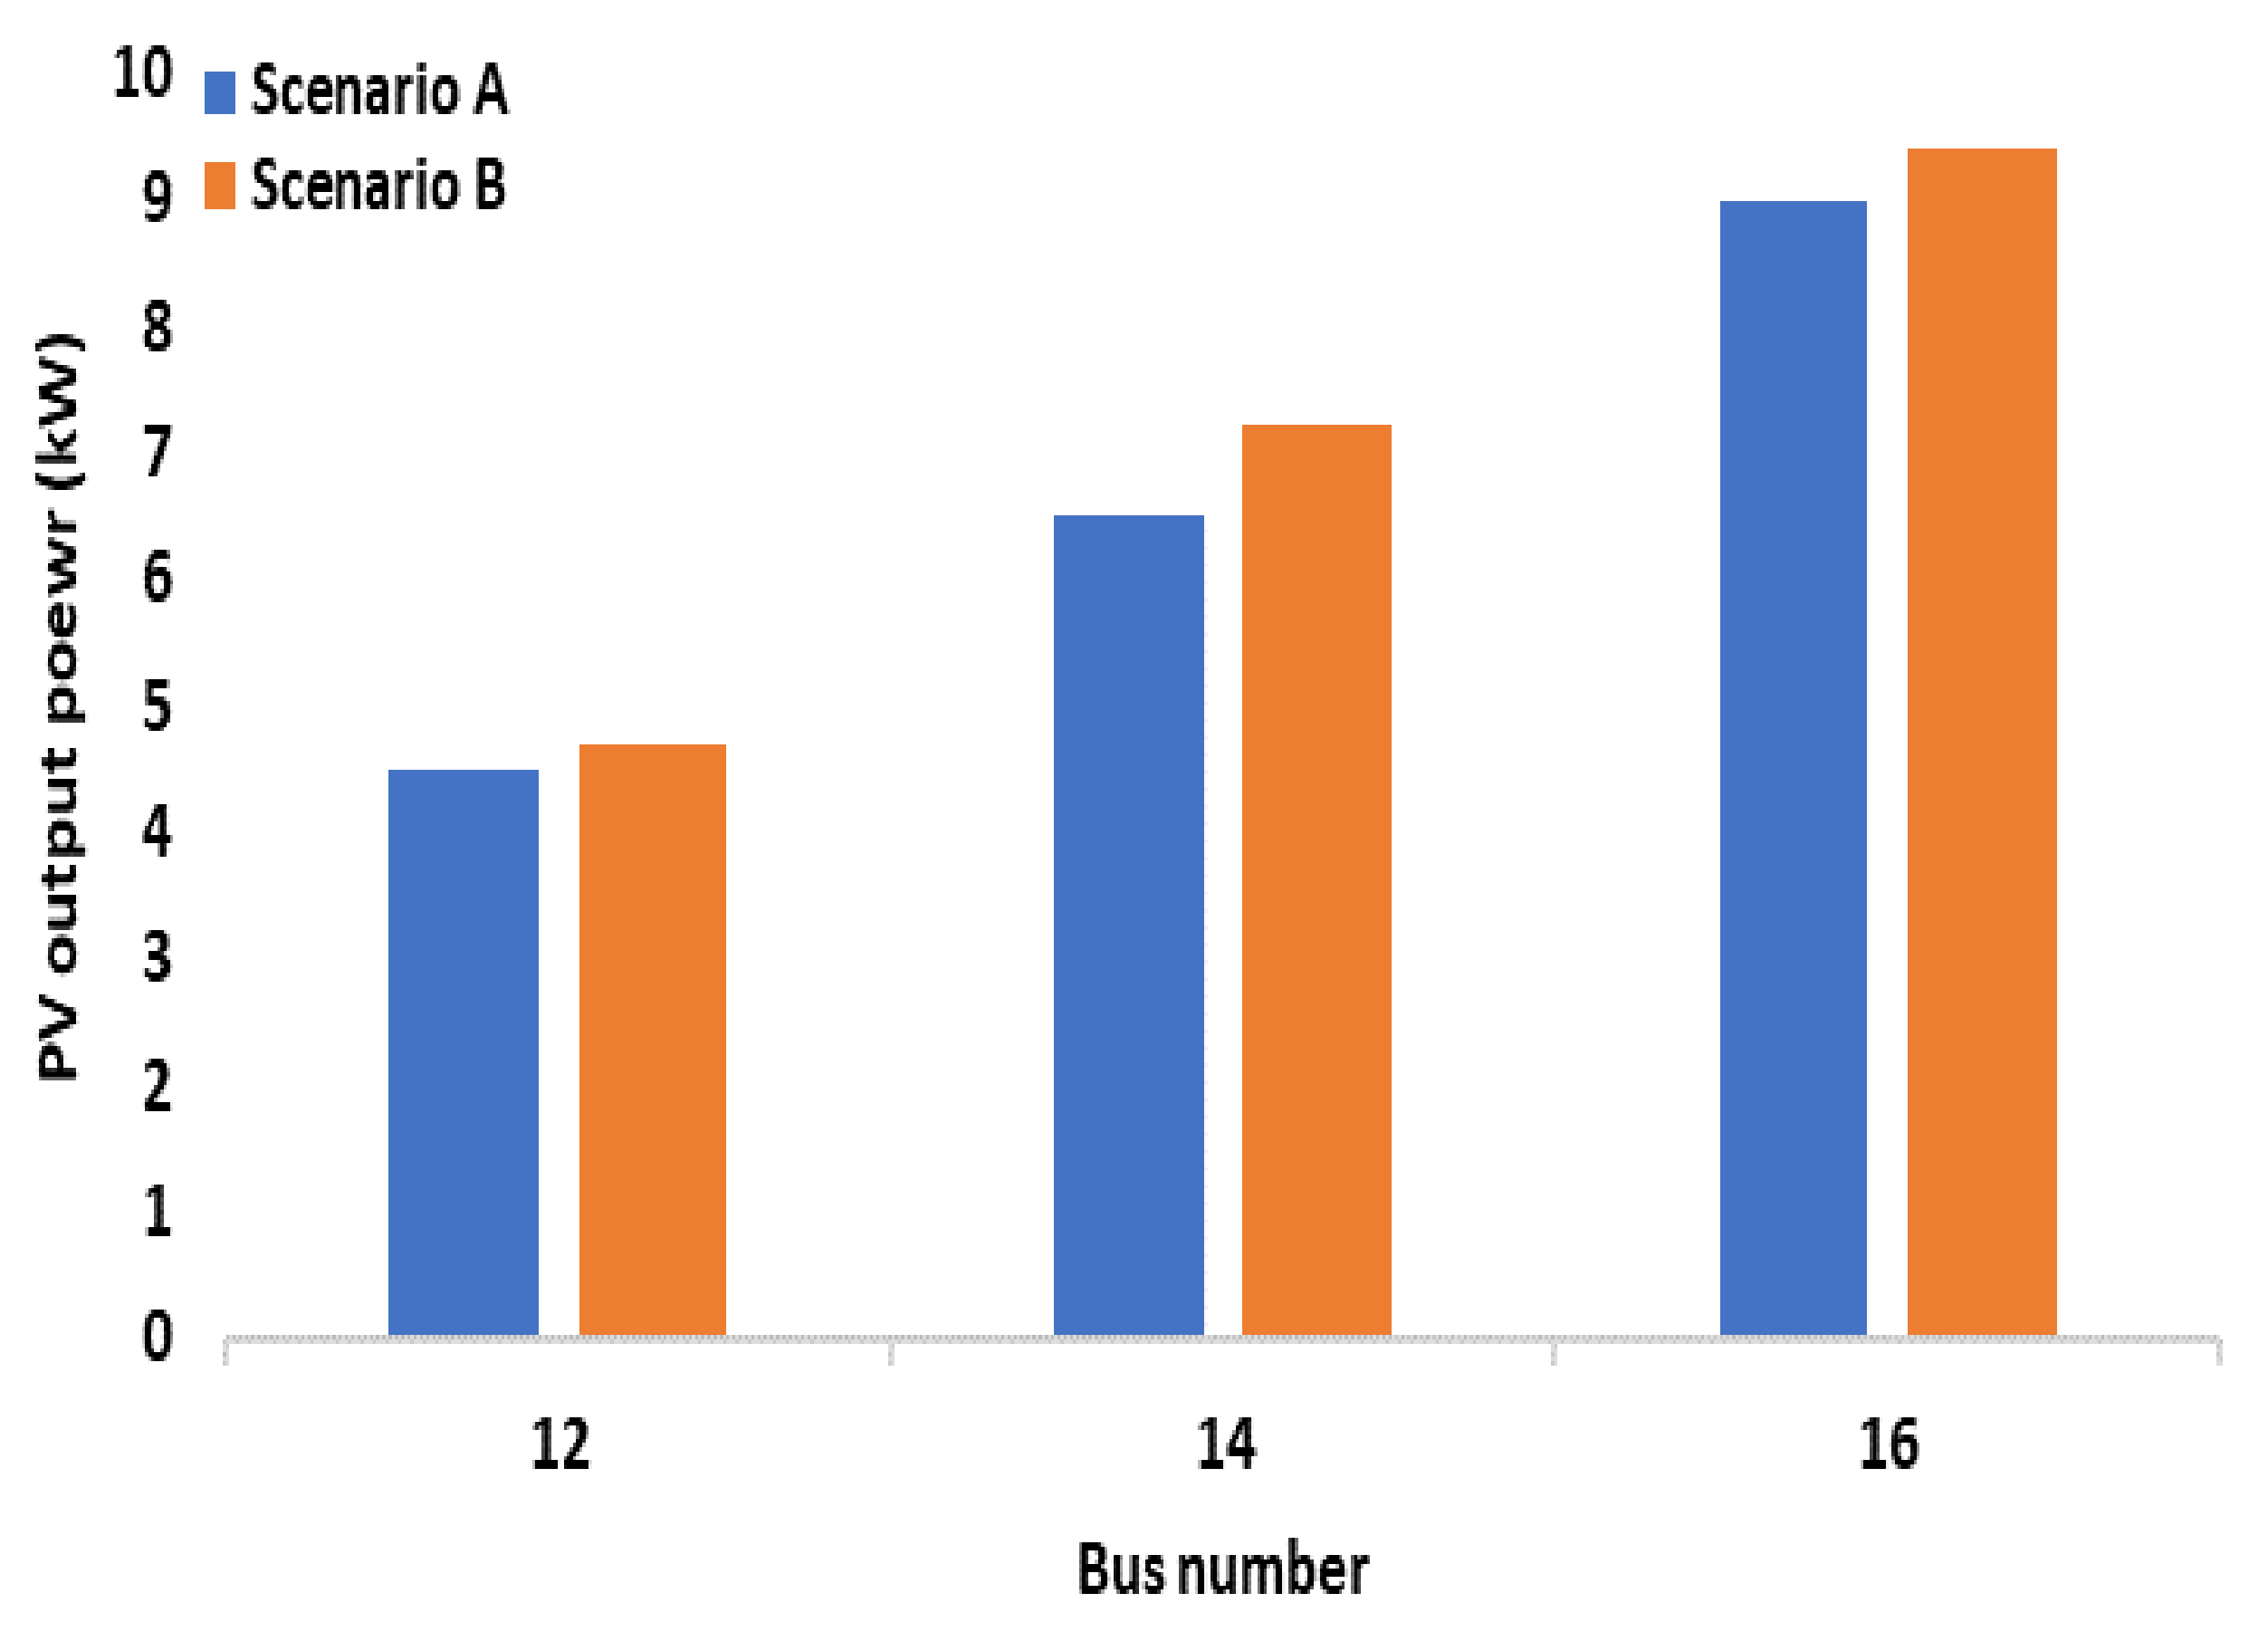
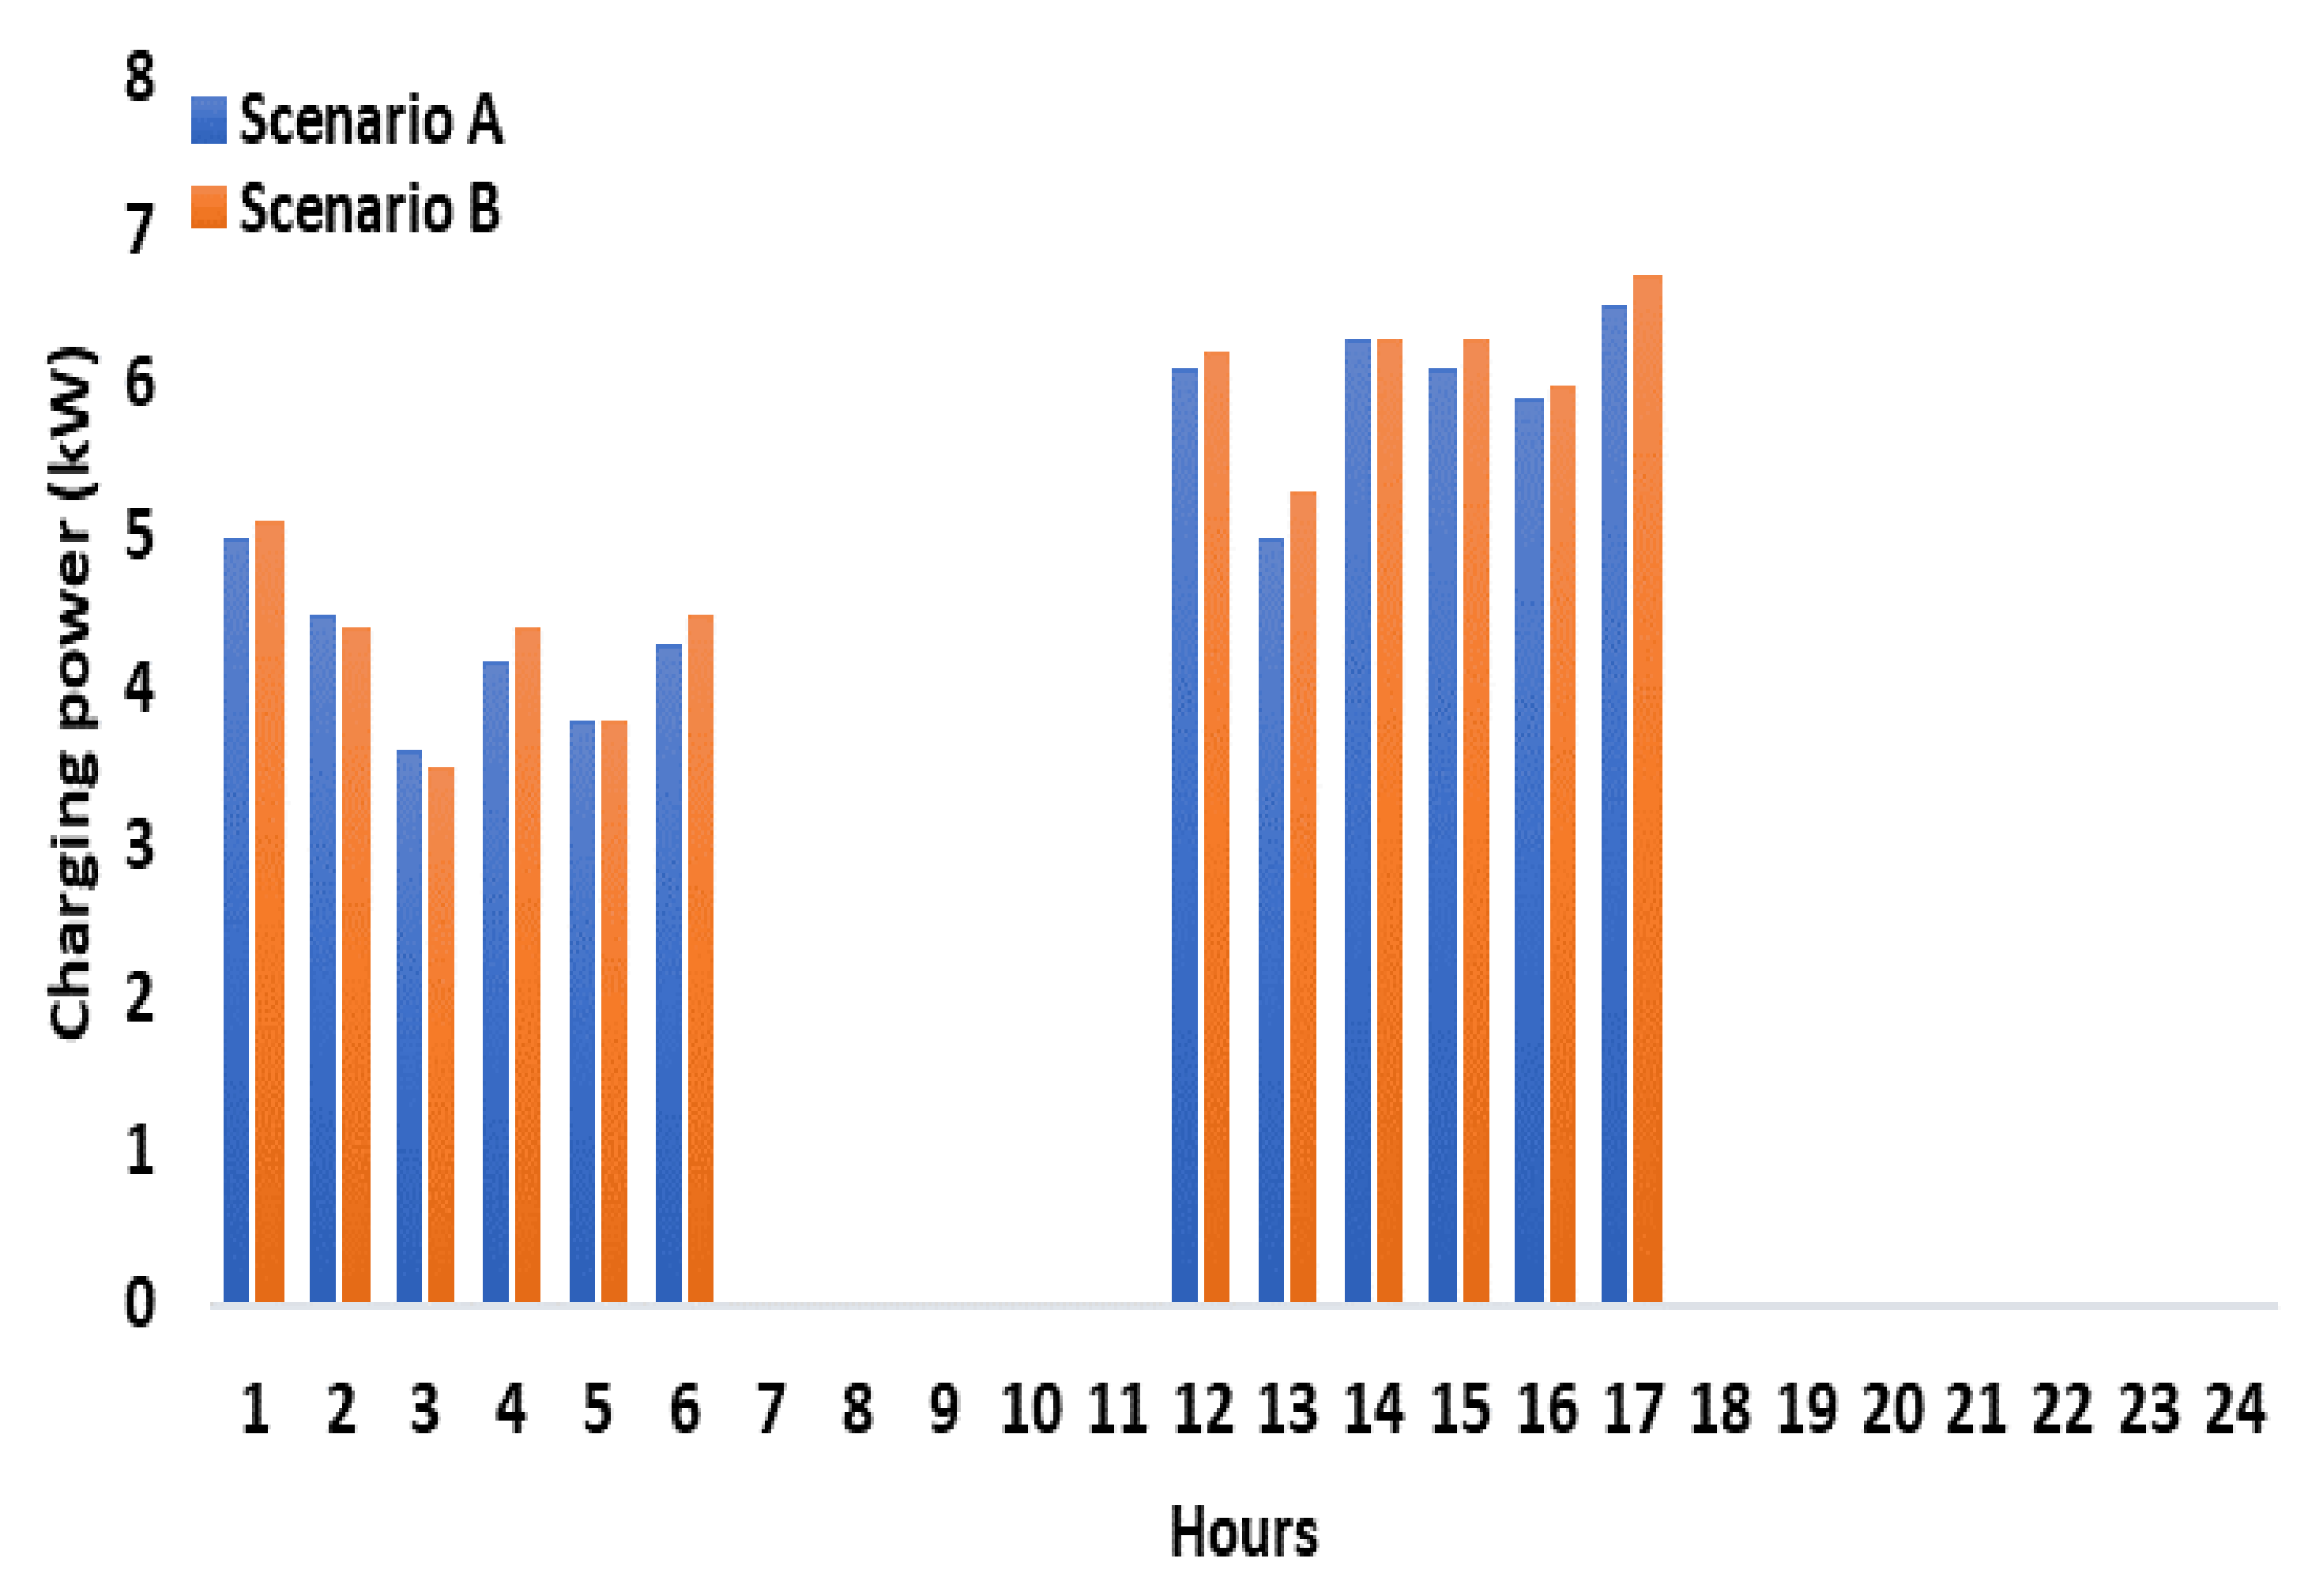
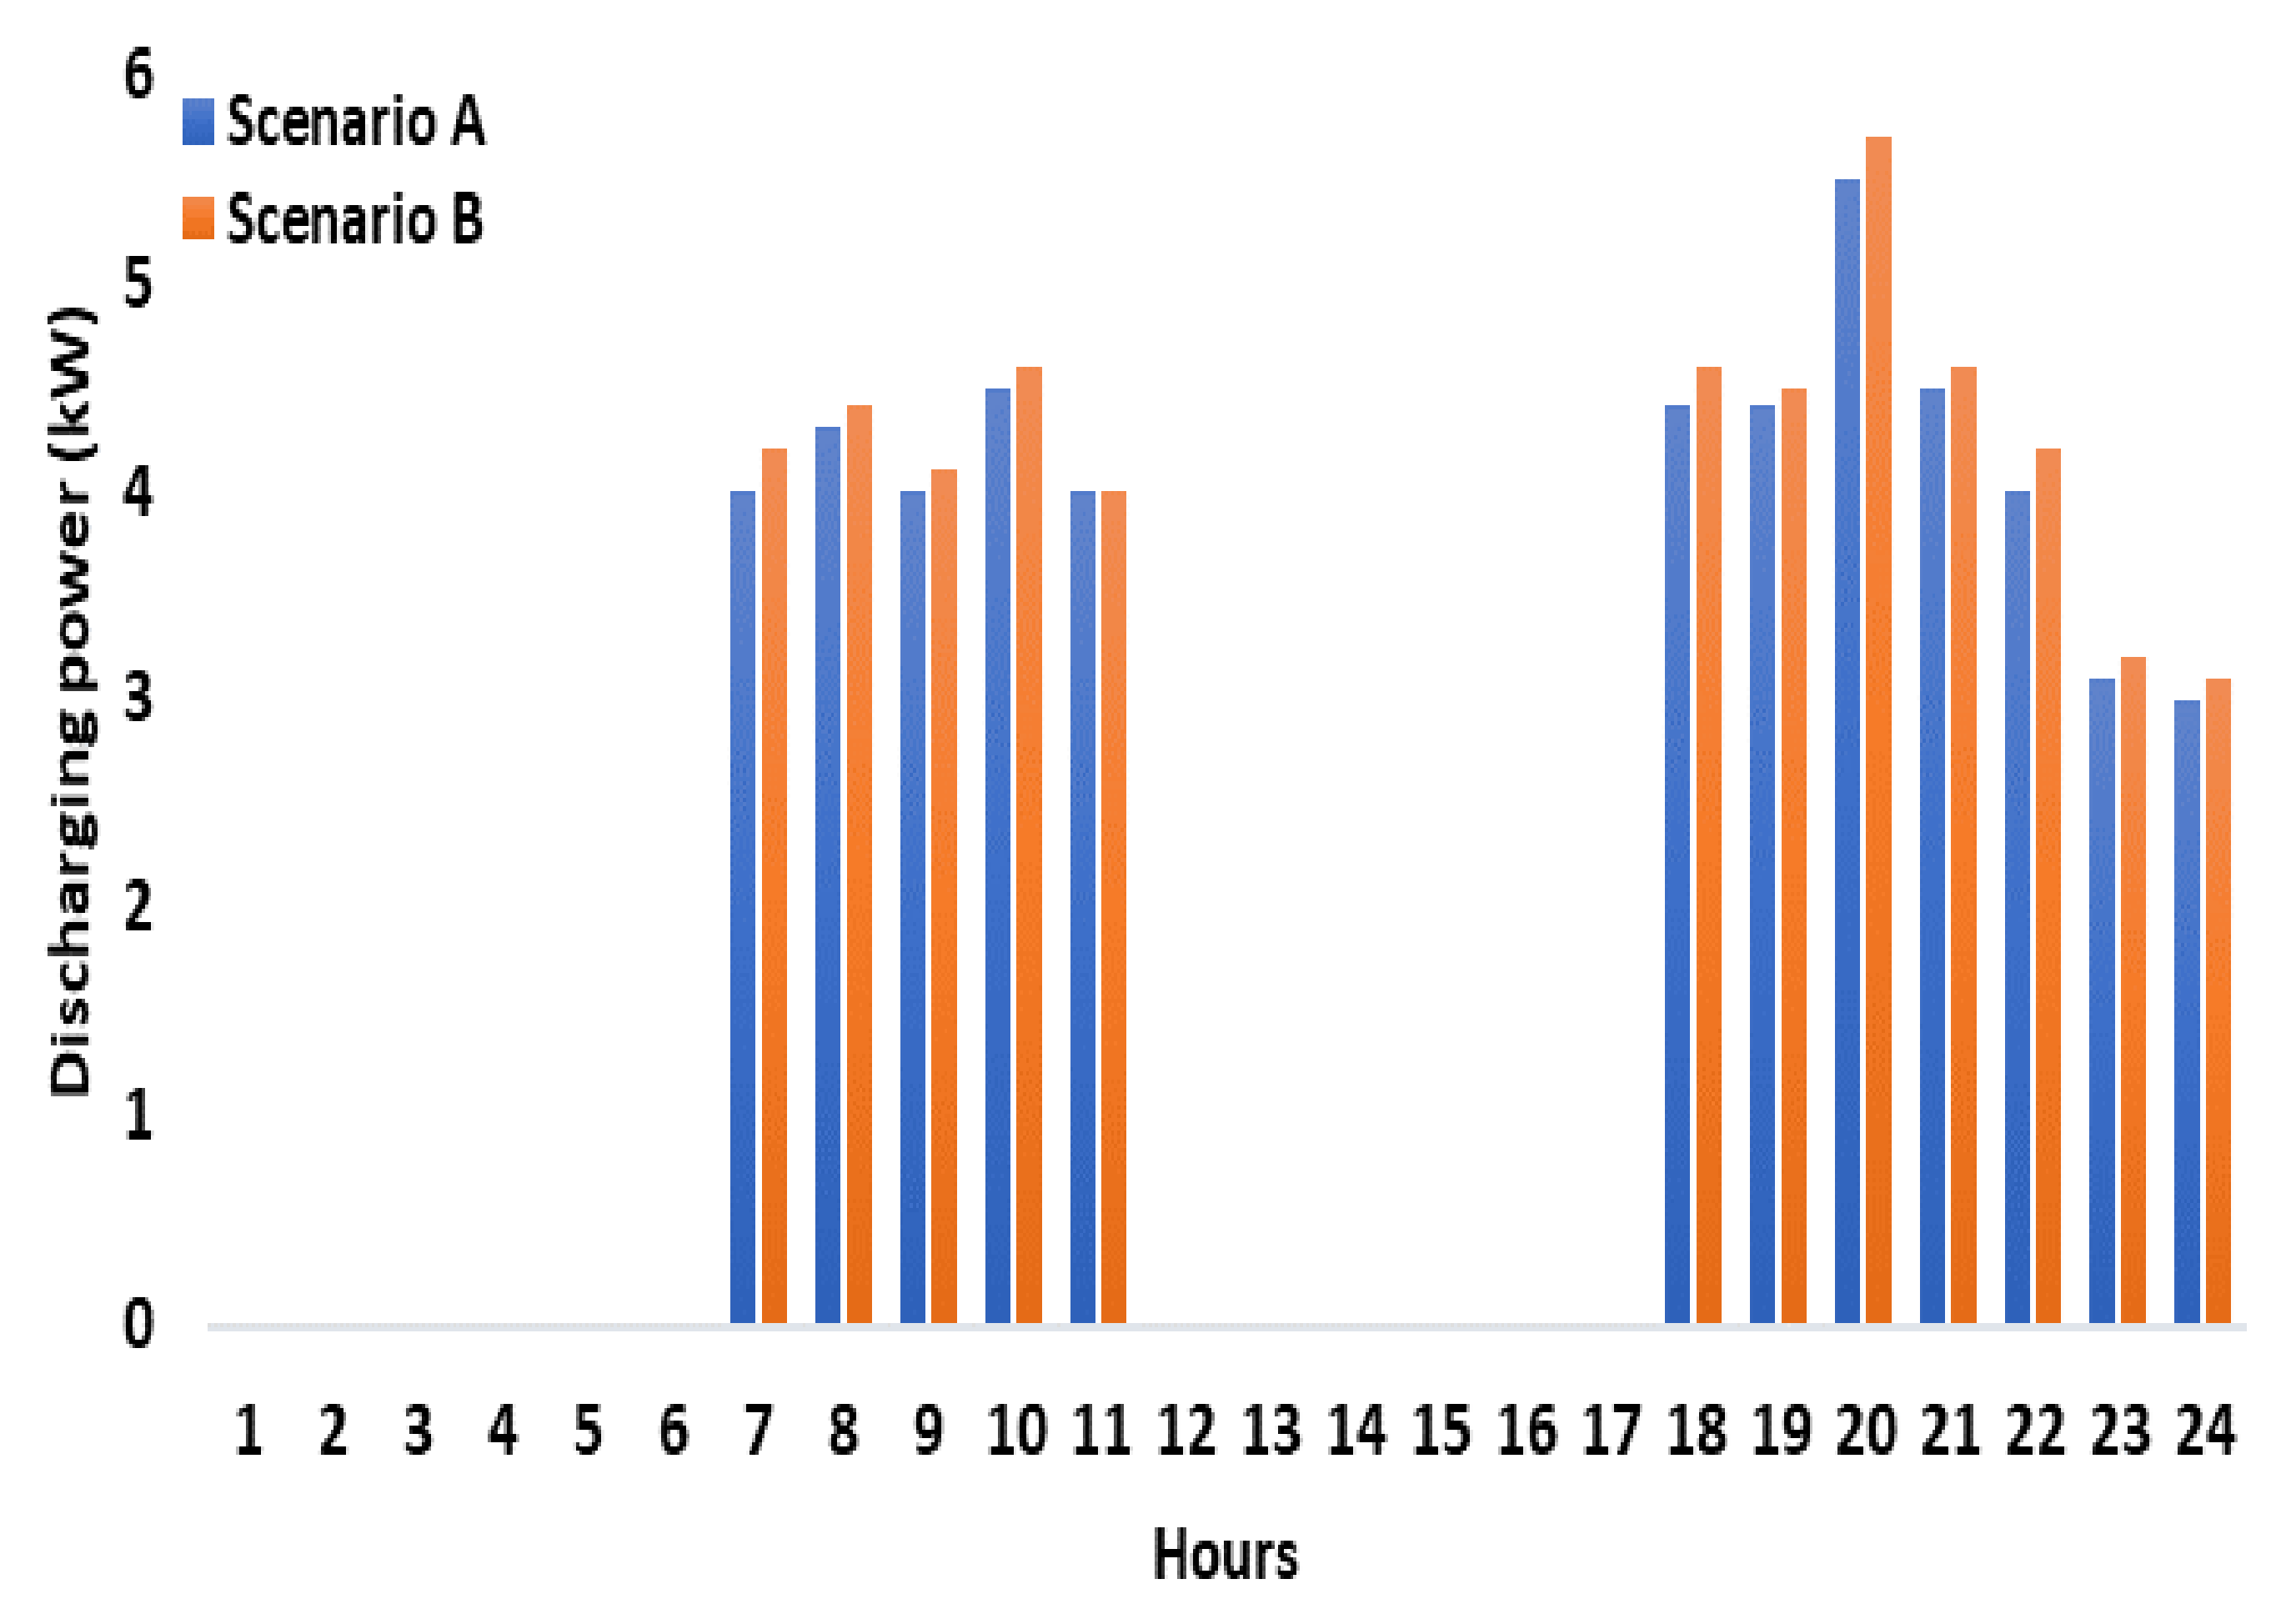
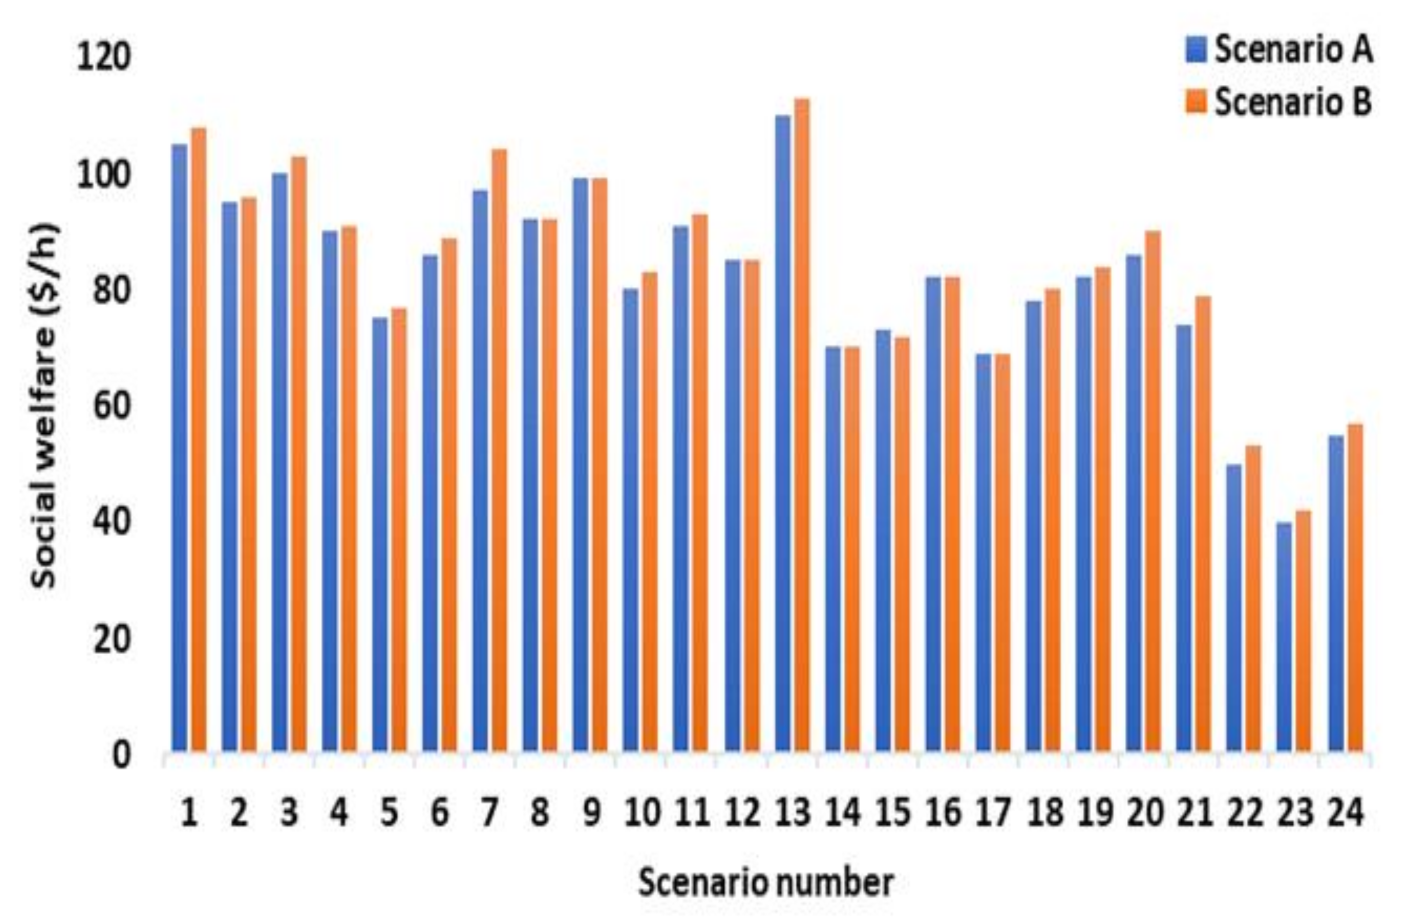
This study considered two different scenarios to assess the influence of the DR scheme on the VPP’s aggregated WT and PV dispatched active power, SW, and the energy storage system, as indicated in Table 1. The total quantity of active power dispatched by WT, PV, and the energy storage system were investigated and compared for scenarios A and B. The total quantity of active power dispatched by WT and PV for scenarios A and B at each candidate bus is shown in Figure 7 and Figure 8. The total quantity of active power delivered by WTs and PV is evidently higher in scenario B, with DR scheme integration, than in scenario A. The justification of busbars with the highest power dispatch for each energy system is shown in Table 3. The energy storage unit has two modes of operation: when energy price is low, it operates as a load and stores energy, and when energy price is high, it operates as a producer of energy and sells it on the market at a profit. Figure 9 and Figure 10 illustrate that scenario B, which employs a demand response strategy, had more charging and discharging of the energy storage unit than in scenario A. This was because the DR scheme allowed for the shifting of some loads to other low-demand periods. Furthermore, according to Figure 9, the ES unit was scheduled to charge at times 1–6 and 12–17 h (off-peak hours). During these hours, the ES unit was charged with a total of 49.3 kW of power. According to Figure 10, the ES unit was scheduled to discharge during times 7–11 and 18–24 h (peak hours). The ES unit discharged a total of 49.2 kW of power. The ESS performed well in terms of flattening the load curve and improving grid stability. This mitigated the dependency of VPP on the utility grid and also lowered its overall energy cost. The social welfare for both scenarios is shown in Figure 11. As can be observed, the SW is greater in scenario B than in scenario A. This is primarily attributed to DR scheme integration and the increased active power dispatched in scenario B, which allowed for a higher SW.

7. Conclusions

In this study, a new MB-VPP energy trading model was presented. It was composed of RESs, controllable loads participating in the DR program, and ESS operating in the day-ahead energy market. The proposed approach examined two different scenarios, one with and one without controllable loads participating in the DR program. The impact of both approaches on SW, WT, PV, and ESS active power dispatch and delivery capacity to load was analyzed. A scenario-based method was applied to model the uncertainties related to WTs, PVs, and load demand. The optimization problem was solved using a CPLEX solver in the GAMS environment. The numerical simulation of the proposed model demonstrated the effectiveness of the MB-VPP in supplying power to loads.
  • The active power dispatch capacity of WT and PV at each candidate bus was improved by 3% in scenario B over the planning horizon, owing to the integration of the DR program in the proposed model.
  • Similarly, the controllable loads participating in the DR program used in scenario B also improved social welfare of the VPP by 3%.
  • The proposed approach could persuade end users to engage in the electricity market to ease peak-period load on the power grid; therefore, contributing to power system reliability.
Further research of environmental goals could be incorporated into the VPP configuration in addition to pure economic optimization.

Author Contributions

Conceptualization, Z.U., A. and H.H.; methodology, Z.U., A.; software, Z.U. and J.C.; validation, J.C. and M.A.A.; formal analysis, A. and M.A.A.; investigateon, Z.U. and H.H.; resources, H.H. and J.C.; data curation, Z.U. and A.; writing—original draft preparation, Z.U. and A.; writing—review and editing, H.H and J.C.; visualization, M.A.A.; supervision, A. and H.H.; project administration, J.C. All authors have read and agreed to the published version of the manuscript.

Funding

This research received no external funding.

Informed Consent Statement

Not applicable.

Conflicts of Interest

The authors declare no conflict of interest.

References

  1. Ullah, Z.; Baseer, M. Operational planning and design of market-based virtual power plant with high penetration of renewable energy sources. Int. J. Renew. Energy Dev. 2022, 11, 620–629. [Google Scholar] [CrossRef]
  2. Naval, N.; Yusta, J.M. Virtual power plant models and electricity markets—A review. Renew. Sustain. Energy Rev. 2021, 149, 111393. [Google Scholar] [CrossRef]
  3. Ullah, Z.; Mirjat, N.H. Virtual power plant: State of the art providing energy flexibility to local distribution grids. In E3S Web of Conferences; EDP Sciences: Copenhagen, Denmark, 2021; Volume 231, p. 01002. [Google Scholar] [CrossRef]
  4. Wang, X.; Liu, Z.; Zhang, H.; Zhao, Y.; Shi, J.; Ding, H. A review on virtual power plant concept, application and challenges. In Proceedings of the 2019 IEEE Innovative Smart Grid Technologies-Asia (ISGT Asia), Chengdu, China, 21–24 May 2019; pp. 4328–4333. [Google Scholar] [CrossRef]
  5. Koza, E.; Öztürk, A. A Literature Review to Analyze the State of the Art of Virtual Power Plants in Context of Information Security. In Environmental Informatics; Springer: Cham, Switzerland, 2021; pp. 49–69. [Google Scholar] [CrossRef]
  6. Ullah, Z.; Mokryani, G.; Campean, F.; Hu, Y.F. Comprehensive review of VPPs planning, operation and scheduling considering the uncertainties related to renewable energy sources. IET Energy Syst. Integr. 2019, 1, 147–157. [Google Scholar] [CrossRef]
  7. Yan, Q.; Ai, X.; Li, J. Low-Carbon Economic Dispatch Based on a CCPP-P2G Virtual Power Plant Considering Carbon Trading and Green Certificates. Sustainability 2021, 13, 12423. [Google Scholar] [CrossRef]
  8. Bhuiyan, E.A.; Hossain, M.Z.; Muyeen, S.M.; Fahim, S.R.; Sarker, S.K.; Das, S.K. Towards next generation virtual power plant: Technology review and frameworks. Renew. Sustain. Energy Rev. 2021, 150, 111358. [Google Scholar] [CrossRef]
  9. Act, C.C. Climate Change Act 2008. 2008. Available online: http://www.legislation.gov.uk/ukpga/2008/27/contents (accessed on 13 November 2013).
  10. Rogelj, J.; Den Elzen, M.; Höhne, N.; Fransen, T.; Fekete, H.; Winkler, H.; Meinshausen, M. Paris Agreement climate proposals need a boost to keep warming well below 2 C. Nature 2016, 534, 631–639. [Google Scholar] [CrossRef] [PubMed] [Green Version]
  11. McKenna, K.; Keane, A. Residential load modeling of price-based demand response for network impact studies. IEEE Trans. Smart Grid 2015, 7, 2285–2294. [Google Scholar] [CrossRef]
  12. Ullah, Z.; Hassanin, H. Modeling, optimization, and analysis of a virtual power plant demand response mechanism for the internal electricity market considering the uncertainty of renewable energy sources. Energies 2022, 15, 5296. [Google Scholar] [CrossRef]
  13. Vahedipour-Dahraie, M.; Rashidizadeh-Kermani, H.; Anvari-Moghaddam, A.; Siano, P. risk-averse probabilistic framework for scheduling of virtual power plants considering demand response and uncertainties. Int. J. Electr. Power Energy Syst. 2020, 121, 106126. [Google Scholar] [CrossRef]
  14. Vahedipour-Dahraie, M.; Rashidizadeh-Kermani, H.; Shafie-Khah, M.; Catalão, J.P. Risk-Averse Optimal Energy and Reserve Scheduling for Virtual Power Plants Incorporating Demand Response Programs. IEEE Trans. Smart Grid 2020, 12, 1405–1415. [Google Scholar] [CrossRef]
  15. Ullah, Z.; Mirjat, N.H. Optimisation and management of virtual power plants energy mix trading model. Int. J. Renew. Energy Dev. 2022, 11, 83–94. [Google Scholar] [CrossRef]
  16. Ullah, Z.; Mirjat, N.H. Modelling and analysis of virtual power plants interactive operational characteristics in distribution systems. Energy Convers. Econ. 2022, 3, 11–19. [Google Scholar] [CrossRef]
  17. Liu, J.; Tang, H.; Xiang, Y.; Liu, J.; Zhang, L. Multi-stage market transaction method with participation of virtual power plants. Electr. Power Constr. 2017, 38, 137–144. [Google Scholar]
  18. Baseer, M.; Mokryani, G.; Zubo, R.H.; Cox, S. Planning of HMG with high penetration of renewable energy sources. IET Renew. Power Gener. 2019, 13, 1724–1730. [Google Scholar] [CrossRef]
  19. Lu, X.; Cheng, L. Day-Ahead Scheduling for Renewable Energy Generation Systems considering Concentrating Solar Power Plants. Math. Probl. Eng. 2021, 2021, 9488222. [Google Scholar] [CrossRef]
  20. Yu, S.; Wei, Z.; Sun, G.Q.; Sun, Y.H.; Wang, D. A bidding model for a virtual power plant considering uncertainties. Autom. Electr. Power Syst. 2014, 38, 43–49. [Google Scholar]
  21. Zhou, C.; Huang, G.; Chen, J. Planning of electric power systems considering virtual power plants with dispatchable loads included: An inexact two-stage stochastic linear programming model. Math. Probl. Eng. 2018, 2018, 7049329. [Google Scholar] [CrossRef]
  22. Aien, M.; Hajebrahimi, A.; Fotuhi-Firuzabad, M. A comprehensive review on uncertainty modeling techniques in power system studies. Renew. Sustain. Energy Rev. 2016, 57, 1077–1089. [Google Scholar] [CrossRef]
  23. Ullah, Z.; Baseer, M. Demand Response Strategy of a Virtual Power Plant for Internal Electricity Market. In Proceedings of the 2022 IEEE 10th International Conference on Smart Energy Grid Engineering (SEGE), Oshawa, ON, Canada, 10–12 August 2022; IEEE: New York, NY, USA, 2022; pp. 100–104. [Google Scholar] [CrossRef]
  24. Ahmed, S.A.; Mahammed, H.O. A statistical analysis of wind power density based on the Weibull and Ralyeigh models of “Penjwen Region” Sulaimani/Iraq. Jordan J. Mech. Ind. Eng. 2012, 6, 135–140. [Google Scholar] [CrossRef]
  25. Reddy, S.S.; Abhyankar, A.R.; Bijwe, P.R. Market clearing for a wind-thermal power system incorporating wind generation and load forecast uncertainties. In Proceedings of the 2012 IEEE Power and Energy Society General Meeting, San Diego, CA, USA, 22–26 July 2012; IEEE: New York, NY, USA, 2012; pp. 1–8. [Google Scholar] [CrossRef]
  26. Jónsdóttir, G.M.; Milano, F. Modeling solar irradiance for short-term dynamic analysis of power systems. In Proceedings of the 2019 IEEE Power & Energy Society General Meeting (PESGM), Atlanta, GA, USA, 4–8 August 2019; IEEE: New York, NY, USA, 2019; pp. 1–5. [Google Scholar] [CrossRef]
  27. Moe, T.T.; Lin, K.M. Solar Irradiance and Power Output Modeling of Photovoltaic Module for Reliability Studies: Case Study of Mandalay Region; ICSTI: Mandalay, Maynmar, 2018; pp. 1–6. [Google Scholar]
  28. Reddy, S.S.; Panigrahi, B.K.; Kundu, R.; Mukherjee, R.; Debchoudhury, S. Energy and spinning reserve scheduling for a wind-thermal power system using CMA-ES with mean learning technique. Int. J. Electr. Power Energy Syst. 2013, 53, 113–122. [Google Scholar] [CrossRef]
  29. Montoya-Bueno, S.; Muñoz-Hernández, J.I.; Contreras, J. Uncertainty management of renewable distributed generation. J. Clean. Prod. 2016, 138, 103–118. [Google Scholar] [CrossRef]
  30. Widén, J. Correlations between large-scale solar and wind power in a future scenario for Sweden. IEEE Trans. Sustain. Energy 2011, 2, 177–184. [Google Scholar] [CrossRef]
  31. Reddy, S.S.; Bijwe, P.R.; Abhyankar, A.R. Joint energy and spinning reserve market clearing incorporating wind power and load forecast uncertainties. IEEE Syst. J. 2013, 9, 152–164. [Google Scholar] [CrossRef]
  32. Reddy, S.S.; Bijwe, P.R.; Abhyankar, A.R. Optimal posturing in day-ahead market clearing for uncertainties considering anticipated real-time adjustment costs. IEEE Syst. J. 2013, 9, 177–190. [Google Scholar] [CrossRef]
  33. Li, Y.; Zio, E. Uncertainty analysis of the adequacy assessment model of a distributed generation system. Renew. Energy 2012, 41, 235–244. [Google Scholar] [CrossRef]
  34. Ajoulabadi, A.; Gazijahani, F.S.; Najafi Ravadanegh, S. Risk-Constrained Intelligent Reconfiguration of Multi-Microgrid-Based Distribution Systems under Demand Response Exchange. In Demand Response Application in Smart Grids; Springer: Cham, Switzerland, 2020; pp. 119–145. [Google Scholar]
  35. Baringo, L.; Rahimiyan, M. Virtual Power Plants and Electricity Markets. In e-Book; Springer Nature: Cham, Switzerland, 2020. [Google Scholar]
  36. Soroudi, A. Power System Optimization Modeling in GAMS; Springer: Cham, Switzerland, 2017; Volume 78. [Google Scholar]
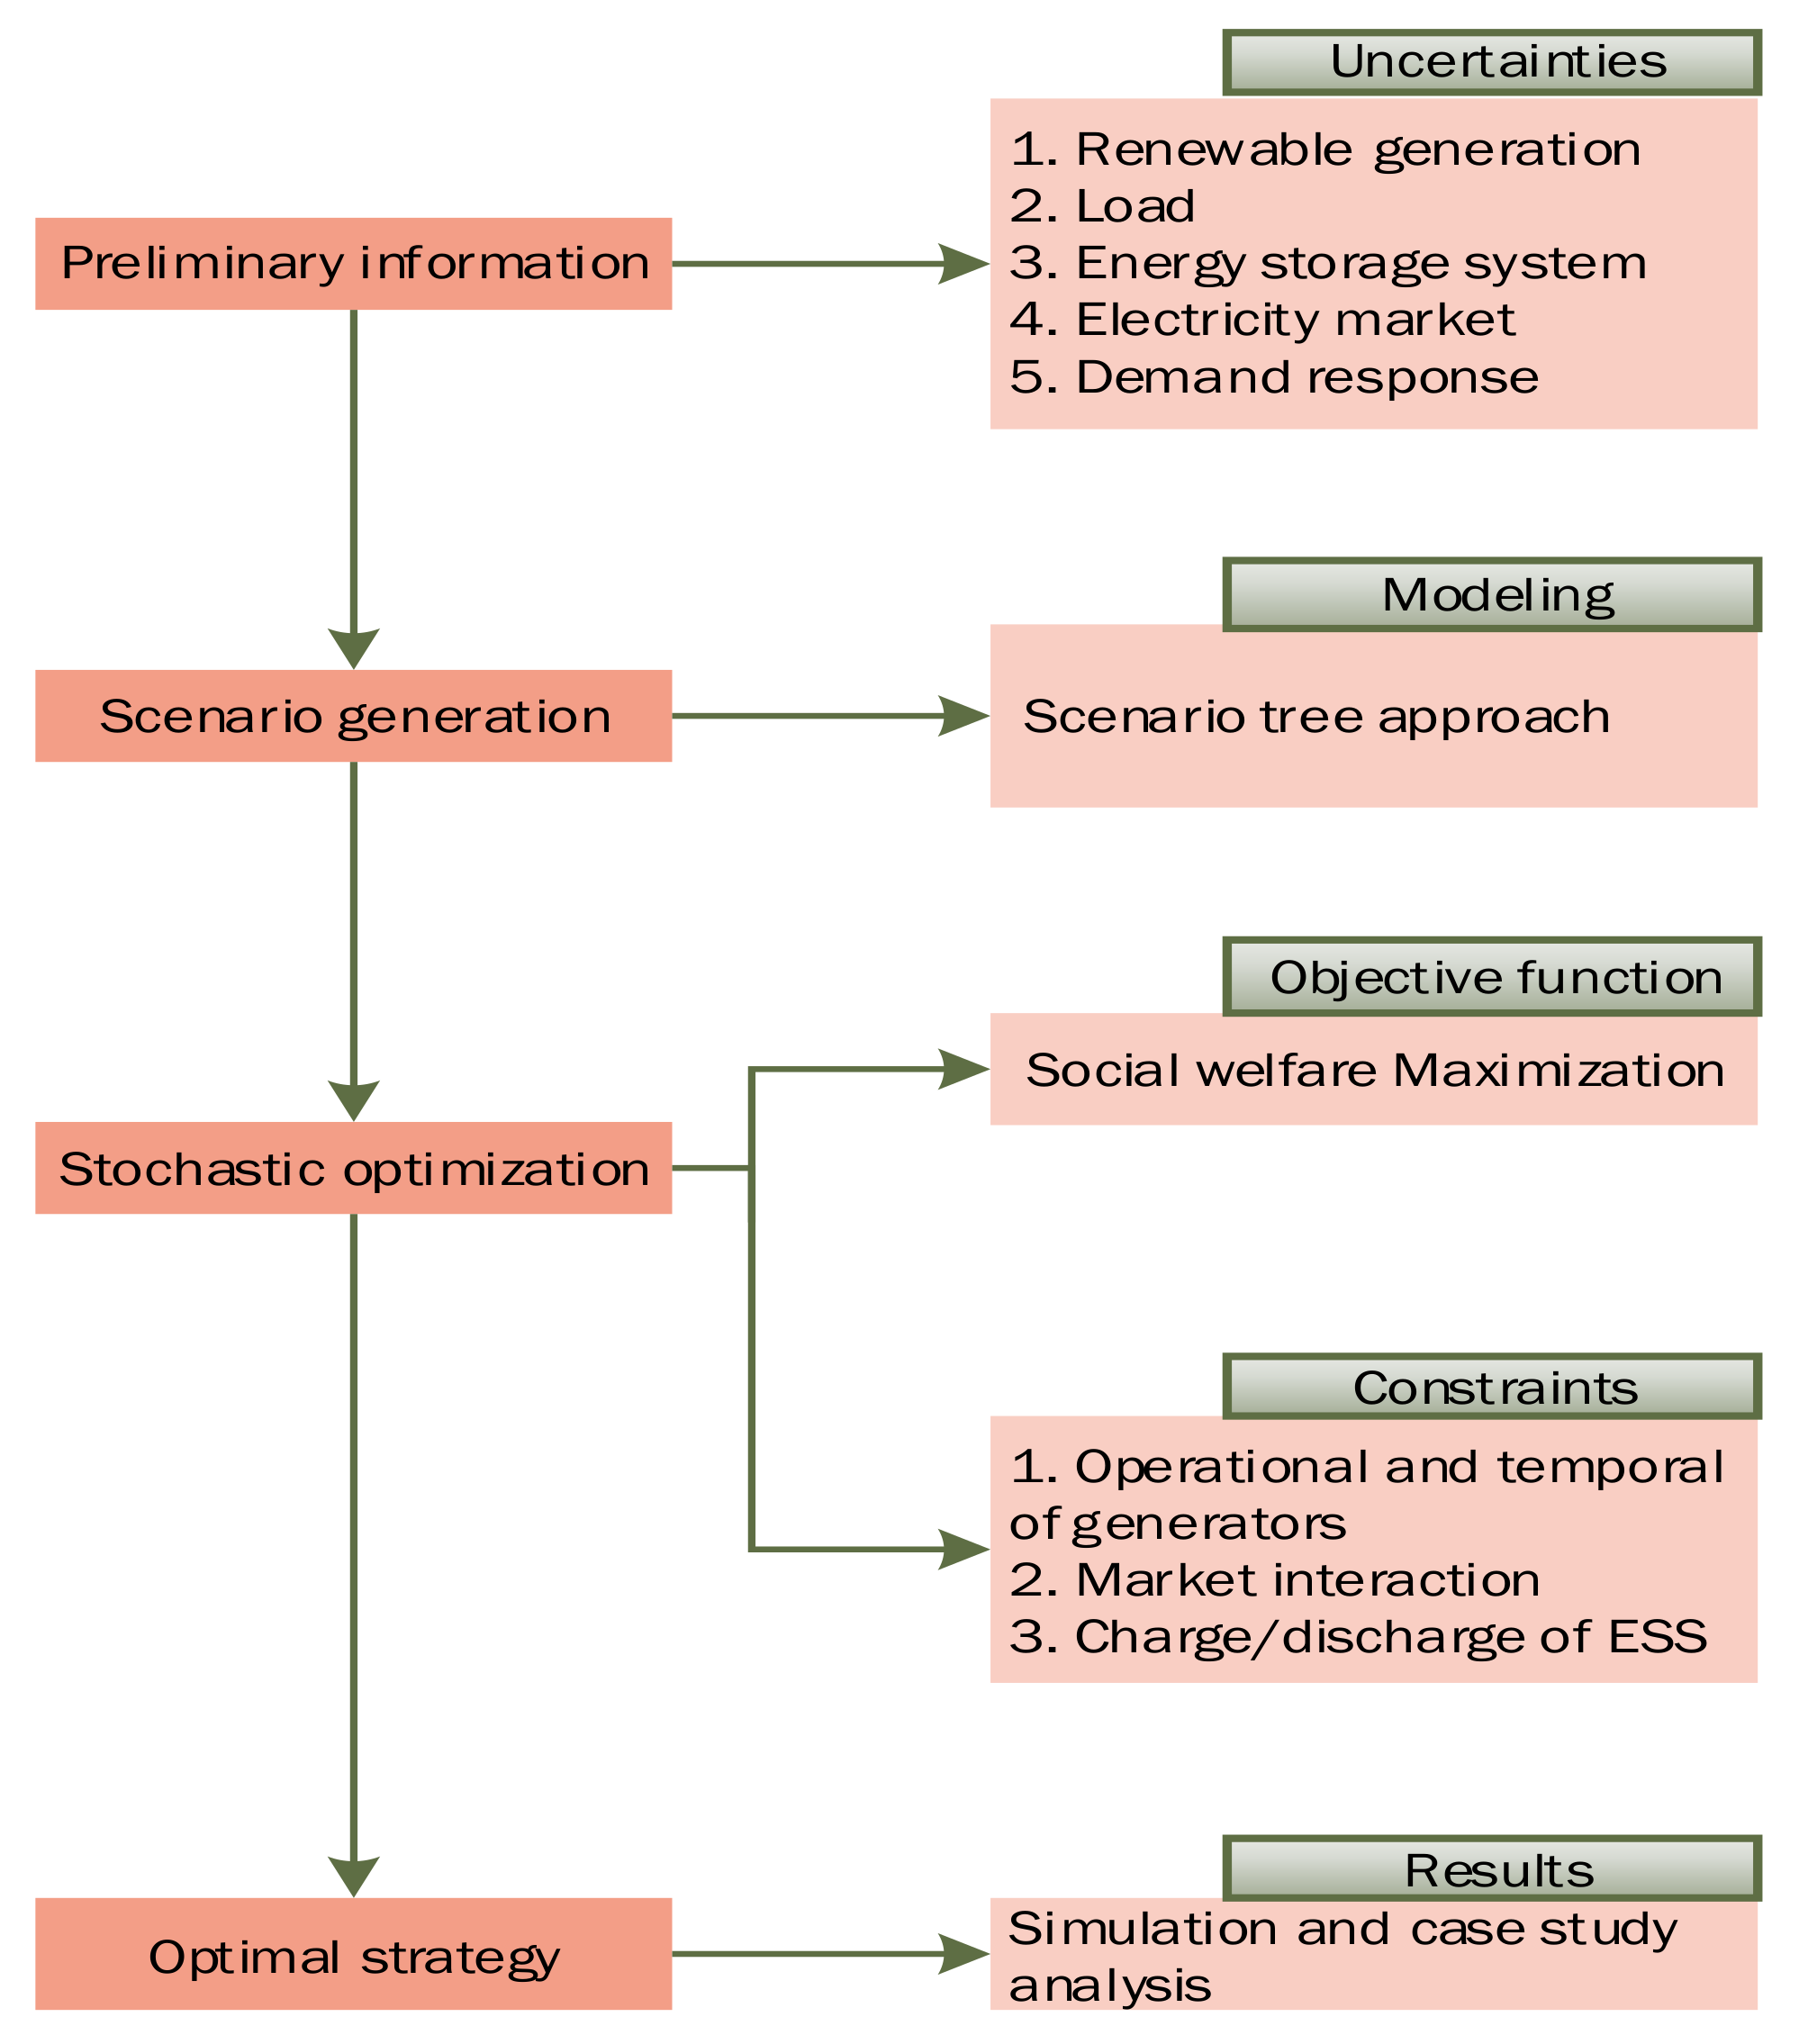
Figure 1. Optimization solution.
Energies 15 07290 g001
Figure 2. WT speed power curve.
Energies 15 07290 g002
Figure 3. Proposed VPP electricity market structure.
Energies 15 07290 g003
Figure 4. The VPP day-ahead market strategy.
Energies 15 07290 g004
Figure 5. Classification of demand response program [34].
Energies 15 07290 g005
Figure 6. Single-line diagram of 16-bus UKGDS.
Energies 15 07290 g006
Figure 7. Total active power dispatched by WTs in all scenarios at candidate buses.
Energies 15 07290 g007
Figure 8. Total active power dispatched by PVs in all scenarios at candidate buses.
Energies 15 07290 g008
Figure 9. Energy storage unit charging times.
Energies 15 07290 g009
Figure 10. Energy storage unit discharging times.
Energies 15 07290 g010
Figure 11. Social welfare for each scenario.
Energies 15 07290 g011
Table 1. Comparison of the proposed method with existing literature.
ReferenceRES ManagementDR ModelESS ModelUncertainty ModelingPower MarketSW
[11]YesYesNoNoNoNo
[12]YesYesYesYesYesNo
[13]YesYesYesYesYesNo
[14]YesYesYesNoYesNo
[15]YesYesYesNoYesYes
[16]YesYesYesNoYesNo
[17]YesYesYesNoYesYes
[18]YesNoNoYesYesYes
[19]YesYesYesYesNoNo
[20]YesYesNoNoNoNo
[21]YesNoNoYesNoNo
This paperYesYesYesYesYesYes
Table 2. Two scenarios without and with DR.
Scenario
AWithout demand response
BWith demand response
Table 3. Busbars with highest power dispatch with justification.
Energy SystemBusbar with Highest Active Power DispatchBusbar with Lowest Active Power DispatchJustification
WTsBus 6Bus 9Quantity of power dispatched by WTs at each bus was constrained by WT offer and bid prices, as well as the thermal limits of the lines
PVsBus 16Bus 12Amount of power dispatched by PVs at each bus was restricted by the offer and bid prices of PVs, as well as voltage limits at each bus
Publisher’s Note: MDPI stays neutral with regard to jurisdictional claims in published maps and institutional affiliations.