Article

Spatiotemporal Distribution and Complementarity of Wind and Solar Energy in China

1
Key Laboratory of Water Cycle and Related Land Surface Processes, Institute of Geographic Sciences and Natural Resources Research, CAS, Beijing 100101, China
2
Key Laboratory of Plateau Geographic Processes and Environment Change of Yunnan Province, Faculty of Geography, Yunnan Normal University, Kunming 650500, China
*
Author to whom correspondence should be addressed.
Energies 2022, 15(19), 7365; https://doi.org/10.3390/en15197365
Submission received: 1 September 2022 / Revised: 29 September 2022 / Accepted: 4 October 2022 / Published: 7 October 2022
(This article belongs to the Special Issue Latest Research in Renewable Energy for Sustainable Development)

Abstract

:
China is rich in wind- and solar-energy resources. In recent years, under the auspices of the “double carbon target,” the government has significantly increased funding for the development of wind and solar resources. However, because wind and solar energy are intermittent and their spatial distribution is uneven, the profits obtained by the developers of wind- and solar-energy resources are unstable and relatively low. For this reason, we analyze in this article the spatiotemporal variations in wind and solar energy resources in China and the temporal complementarity of wind and solar energy by applying a Spearman correlation coefficient based on the Daily Value Dataset of China Surface Climate Data V3.0. Finally, we also strive to harmonize regions where wind and solar resources are less complementary by introducing hydro-energy resources. The results reveal that wind energy and solar energy resources in China undergo large interannual fluctuations and show significant spatial heterogeneity. At the same time, according to the complementarity of wind and solar resources, over half of China’s regions are suitable for the complementary development of resources. Further research shows that the introduction of hydro-energy resources makes it feasible to coordinate and complement the development of wind- and solar-energy resources in areas where the complementarity advantage is not significant. This has a significant effect on increasing the profit generated by the complementary development of two or more renewable resources.

1. Introduction

In recent years, to reduce global warming and overcome the current overdemand for oil, coal, and other resources, many countries and regions have gradually strengthened the development of green and low-carbon energy (such as wind and solar energy) [1,2,3,4]. China is rich in wind- and solar-energy resources, so the Chinese government has significantly increased funding in the past decade for the development of wind and solar resources. According to the China Statistical Yearbook, China’s installed wind power capacity increased from 2958 MW in 2010 to 20915 MW in 2019, which is an increase of 691%. Over the same time, the installed solar power capacity grew from 26 MW in 2010 to 2019 20418 MW (solar energy has only been developed in China since about 2010). The data reflect the rapid development by China of these two renewable resources on a large scale [5].
Because China is a vast country with large differences in elevation and complex terrain, the distribution of wind- and solar-energy resources varies significantly. The data above show that China’s development of these two resources has developed rapidly in the past decade; however, the degree of development and use varies from region to region [6,7]. With the deepening development and use of wind- and solar-energy resources, many researchers have studied and analyzed the spatial distribution of wind- and solar-energy resources in China to quantitatively analyze and evaluate the distribution of these resources in China [8,9,10,11,12]. The results of these studies indicate that the intermittency and volatility of wind and solar resources were gradually amplified, especially after large-scale integration of wind and solar power into the power grid. Therefore, for resource developers, it is urgent to improve the profitability of wind- and solar-energy resources despite their unstable output in time [13,14].
Because wind power and solar energy resources are climate resources, their temporal stability is influenced by natural factors, so an accurate assessment of the development and use of these resources is difficult, which restrains developer profits because the actual utilization efficiency is relatively low [15]. To solve this problem, which stems from the spatial and temporal characteristics of these resources, some researchers have proposed the complementarity of two or more renewable resources to improve their use [16,17,18]. Moreover, many international scholars have studied the time complementarity of wind- and solar-energy resources in the same areas. For example, Jakub et al. evaluated the spatial characteristics of the temporal complementarity of wind- and solar-energy resources in Poland by applying a Spearman coefficient analysis, which demonstrated the facility and effectiveness of this approach to assess complementarity [19]. Puspitarini et al. evaluated the complementarity of solar- and hydro-energy resources in Italy by combining the Pearson coefficient with standard deviation and demand satisfaction [20]. Hen et al. also evaluated the complementarity of solar, wind, and hydro-resources through the Kandall coefficient, and their results also confirmed the validity of the Kandall coefficient in complementarity assessment [21]. Zhang et al. evaluated the benefits of wind- and solar-energy resource complementarity in northwest China, and the results showed that wind- and solar-energy resource complementarity is economically and socially feasible in northwest China [22]. Zhang et al. used the correlation coefficient R to study the suitability of the wind- and solar-energy resource complementary in the coastal areas of China, and the results showed that the wind-energy resource complementary becomes more suitable as the latitude decreases [23]. Therefore, after comparing the suitability of the data and the research methods used in the present work, we adopted the Spearman coefficient to evaluate and analyze the temporal complementarity of wind- and solar-energy resources in China because it ignores the dimensionality of different data, thereby allowing an accurate interpretation of the complementarity of the two resources. In addition, it is easy to calculate.
The aim of this work is to elucidate the spatial and temporal distribution of wind- and solar-energy resources in China and their temporal complementarity. In addition, this work shows that a third renewable resource that is relatively stable in time can be used to coordinate two intermittent and volatile renewable resources in areas where their complementarity is not significant. Of course, the current research draws various conclusions regarding the complementary of two or more renewable resources in time. However, it remains unclear that the low efficiency of the complementary development of various renewable resources is caused by the temporal volatility of different renewable resources [24,25,26,27]. This work strives to quantify and prove this problem by analyzing more data; that is, from the perspective of resource quantity. The results indicate that water-energy resources can serve to coordinate energy supply in regions where wind and solar energy is relatively noncomplementary in time.
Based on the China Surface Climate Data Daily Value Dataset V3.0, we calculate the annual effective wind energy density and annual total solar radiation at 210 meteorological stations from 2010 to 2019 and then visually analyze the spatial and temporal variations in wind- and solar-energy resources in China. On this basis, the Spearman coefficient is used to analyze and evaluate the temporal complementarity of wind- and solar-energy resources in China, and a third renewable-energy resource (water energy in this case) is introduced to coordinate the energy supply in regions where wind- and solar-energy resources are not complementary. Further research shows that it is feasible to coordinate and complement the development of hydropower resources in areas where the complementarity of wind and solar resources is not significant.
Thus, we study the spatial and temporal distributions of wind- and solar-energy resources in China and their complementarity, with the goal being to provide practical assistance to the development of these resources in China. The research results provide an objective and quantitative method for solving the problem of time stability in the development of wind and solar energy resources in China, which helps to improve the profitability of complementary development of renewable resources. These results should help China achieve the dual carbon targets of “carbon neutrality” and “carbon peaking” in the future.

2. Materials and Methods
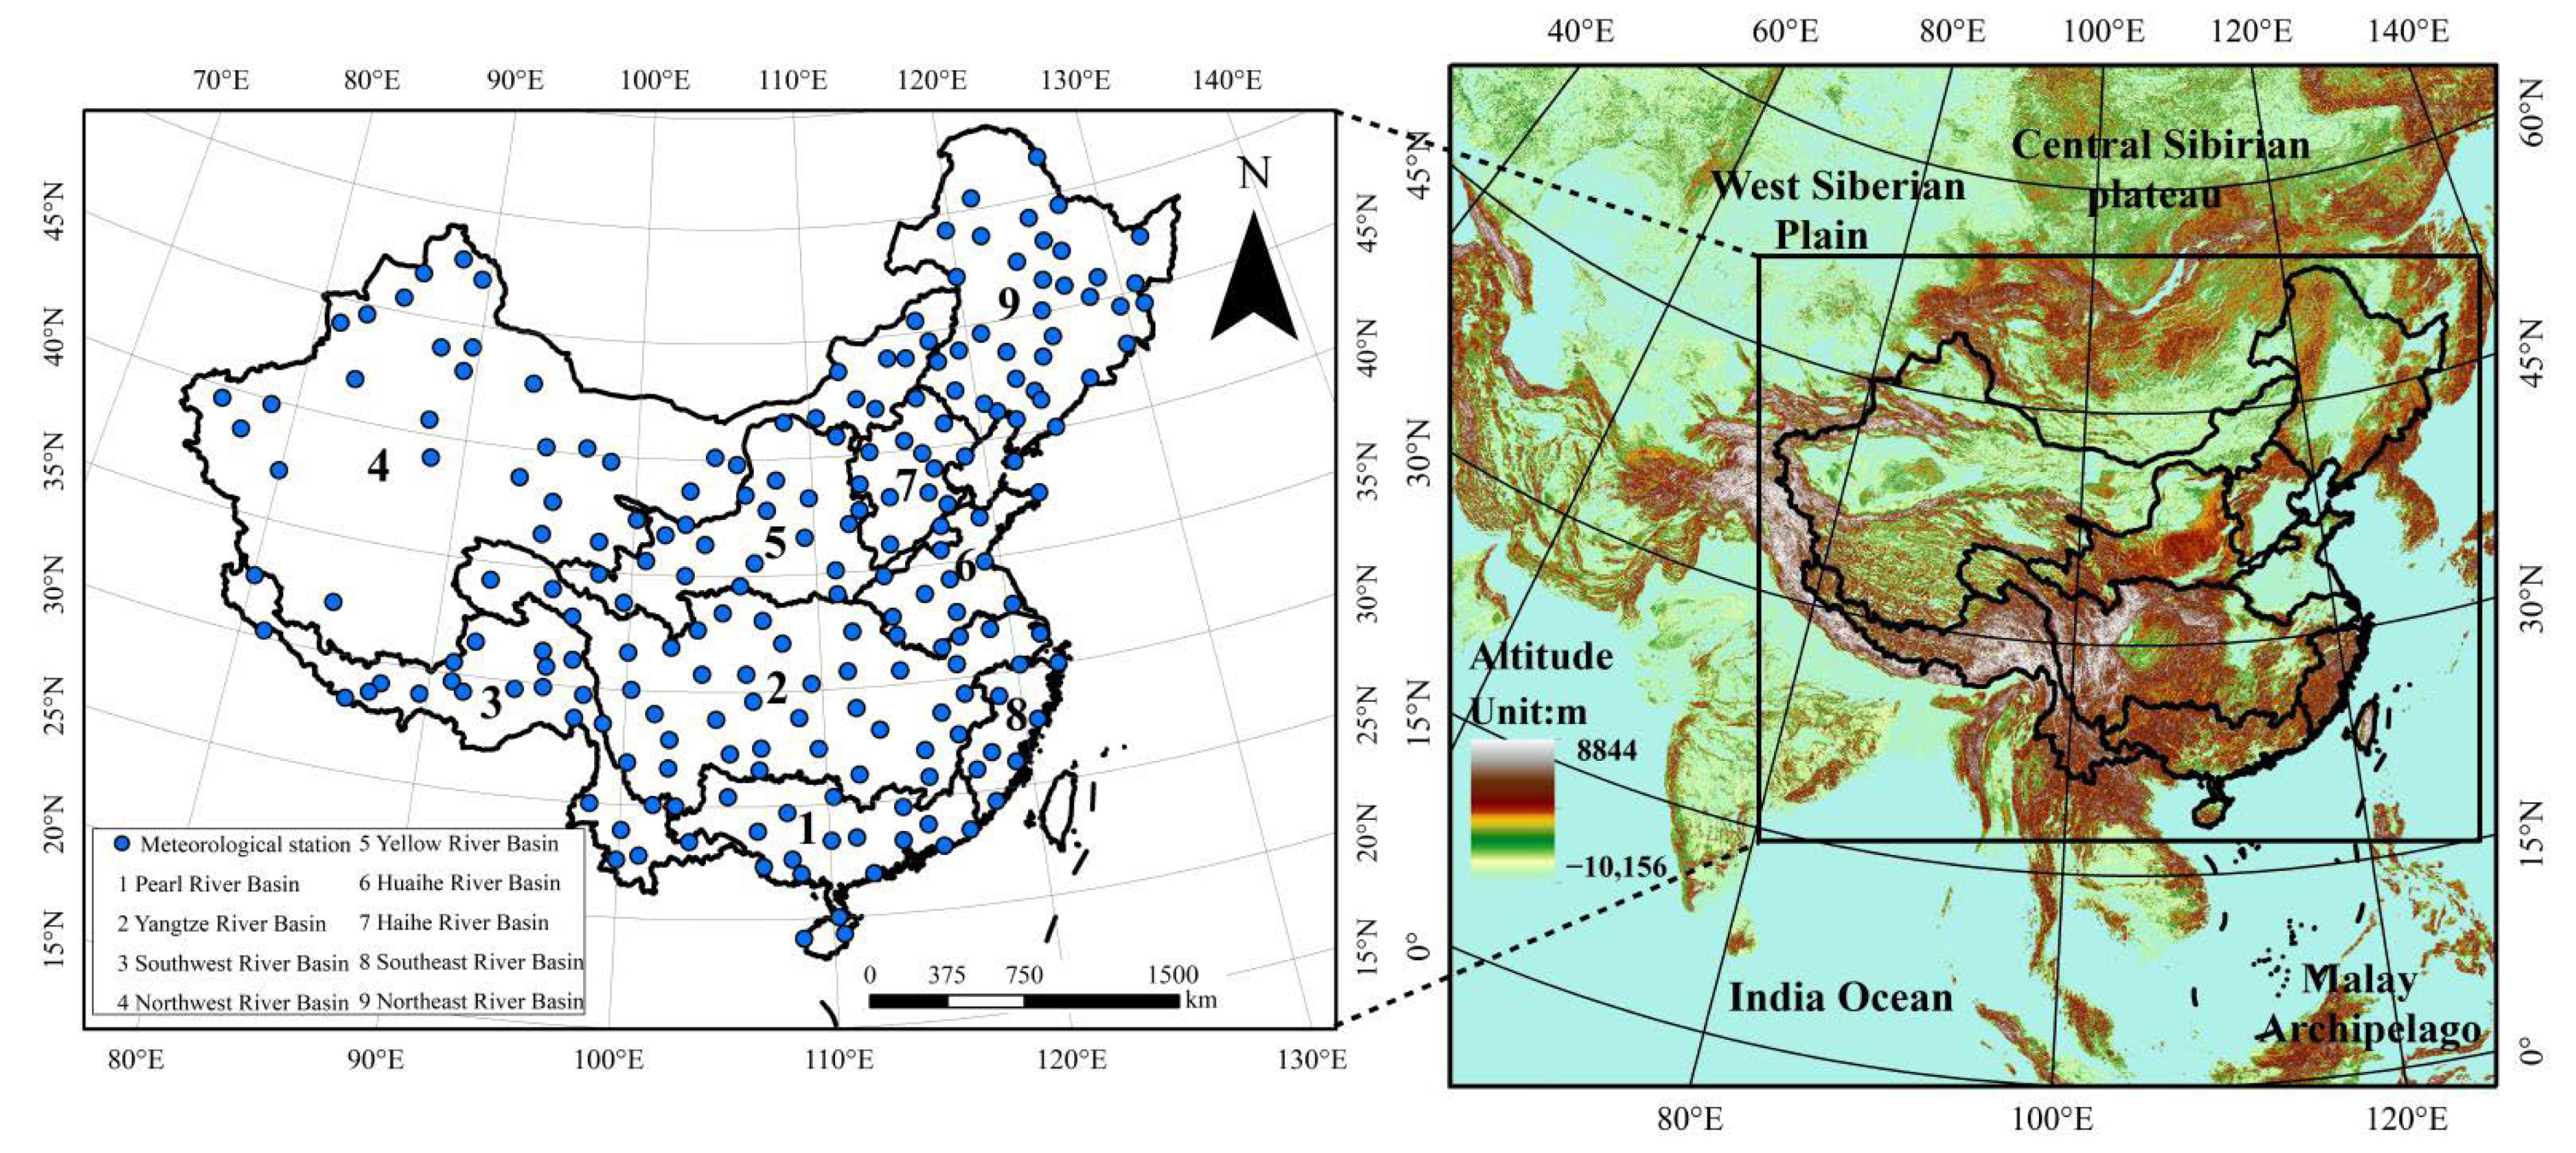
2.1. Study Area

To study the wind- and solar-energy resources in China and discuss the possible coordination and complementarity of water-energy resources in Section 3.3, we start by dividing China into different basins. According to the division of China’s hydro-resources by the Resources and Environment Data Center of the Chinese Academy of Sciences, China is divided into nine river basins. The river basins are the Northeast River Basin, Northwest River Basin, Haihe River Basin, Yellow River Basin, Huaihe River Basin, Yangtze River Basin, Southwest River Basin, Southeast River Basin, and Pearl River Basin. The locations of the study area and the nine basins are shown in Figure 1.

2.2. Data Sources

The data in this paper consist mainly of five indicators: (1) sunshine duration, (2) average wind speed (10 m height), and (3) the reserves of hydraulic resources. The sunshine duration and average wind speed with daily resolution were obtained from the China Surface Climate Data Daily Value Dataset V3.0. The data on theoretical hydropower potential were from the China Water Resources Bulletin. In addition, to facilitate research and comparison and ensure data integrity, we use 2010–2019 as the time series. For the meteorological stations, all except for the Qinghai-Tibet Plateau Station are categorized as general stations. This choice ensures the uniformity of the spatial distribution of meteorological stations and the integrity of the data in the time series. Moreover, as the dataset does not contain the relevant data for Taiwan, this region is not discussed in the study of the Southeast River Basin.
The research process of this paper is shown in Figure 2. In Figure 2, we describe in detail the sources of research data, the ranking of research methods, and the research process.

2.3. Research Methods

2.3.1. Effective wind Energy Density

When the wind speed is 3–20 m/s, the kinetic energy of the airflow per unit area and unit time is called the effective wind-energy density. This work does not consider the spatial and temporal variations in air density, which is assumed to be 1.225 kg/m3. The effective wind-energy density is
P = 1 2 n i = 1 n ρ V i 3
where P is the effective wind-energy density (W/m2), ρ is the air density (kg/m3), V is the average wind speed (m/s), and n is the total number of days when the average wind speed is within 3–20 m/s. As the effective wind energy density is calculated based on the 24 h hourly wind speed data, and the data in this paper are calculated based on the average daily wind speed, we revise the calculated effective wind energy density. The revised method comes from the study of Li et al. and consists of dividing the annual average effective wind energy density into three grades: 0–30, 30–60, and >60 W/m2, and multiplying by the revised coefficients 1.2, 1.8, and 2.4, respectively [9,28,29,30].

2.3.2. Total Solar Radiation

Based on the sunshine hours, this article uses the research methods of Cao and Zhu et al. to calculate the total solar radiation, and then calculates the annual average total solar radiation through the method of accumulation and mean [31,32,33,34]. The formula is
Q = i = 1 n R i S i
where Q is the total solar annual radiation (MJ/m2), R is the daily total solar radiation (MJ/m2), S is sunshine percentage, and n is the ordinal number of days in a year. R is given by
R = I S C · E O ω s i n Φ s i n δ + c o s Φ s i n ω / π
where R is the daily total solar radiation (MJ/m2), E is the average distance between the sun and Earth, which is 14,966 × 106 m, δ is the solar declination, Φ is the geographical latitude, and ω is the hour angle at sunset. The value of π is 3.1415926, and I is the solar constant, which is 1367 W/m2 (118.109 MJ·m−2·d−1) in this article.
The sunshine percentage S is
S = H 2 / 15 ω
where H is the sunshine duration (h) and ω is the hour angle at sunset.

2.3.3. Spearman Coefficient

We use the Spearman coefficient to study the time complementarity of wind-energy resources and solar-energy resources because it ignores the units of different indicators and it is easy to compute. The Spearman coefficient ranges from −1 to 1: when it approaches −1, wind- and solar-energy resources have good temporal complementarity. Conversely, a Spearman coefficient close to 1 indicates that wind- and solar-energy resources follow the same variational pattern in time [19,35,36]. The Spearman coefficient is calculated as follows:
ρ = 1 6 d i 2 n n 2 1
where ρ is the Spearman rank correlation, di is the difference between ranks of corresponding variables, and n is the number of observations. Among them, the interpretation of Spearman’s coefficient for the complementarity of two renewable resources comes from the interpretation theory based on sine waves in [19].

2.3.4. Other Research Methods

We also adopt other research methods, such as the rate of climate change and spatial interpolation, with deference to the relevant literature [37,38,39].

3. Results

In recent years, many countries and regions have taken wind energy resources and solar energy resources as the priority renewable resources for development, because these two energy resources have the characteristics of abundant resources, wide distribution, and clean resources [40,41]. Since 1960, many scholars have studied the development and use of wind- and solar-energy resources in China [6,7,8,9,10,11,12]. However, research is lacking on the complementarity of wind- and solar-energy resources in China, especially from the perspective of resource quantity. Therefore, this section is divided into three parts to discuss and analyze these issues. The first part analyzes the spatial and temporal characteristics of wind- and solar-energy resources in China. The second part discusses the complementarity of wind- and solar-energy resources in China. The third part shows that coordinated complementarity of hydropower resources is possible in a macro-region.

3.1. Spatial and Temporal Variability in Wind- and Solar-Energy Resources

We now calculate the effective wind-energy density and annual solar radiation in the nine river basins of China from 2010 to 2019 based on the data of China Surface Climate Data Daily Value Dataset V3.0. The results reveal the spatial and temporal distribution of wind- and solar-energy resources in different river basins. The temporal distribution of wind- and solar-energy resources (Figure 3 and Figure 4) show that wind- and solar-energy resources in China fluctuate strongly from year to year. These resources have the same large interannual fluctuations in the Pearl River Basin, Southwest River Basin, Northwest River Basin, Yangtze River Basin, and Yellow River Basin. In some basins, the resource varies excessively between years. For example, the wind-energy resources were high in the Pearl River Basin, the Yangtze River Basin, the Southwest River Basin, the Huaihe River Basin, and the Southeast River Basin in 2017 but low in 2016 and 2018 (about 50% less than in 2017). In 2013, the solar-energy resources were high in the Yangtze River Basin, Southwest River Basin, Northwest River Basin, Huaihe River Basin, and Southeast River Basin but low in 2012 and 2014.
These results reveal a very significant difference between wind- and solar-energy resources in individual years, which means that the interannual volatility of wind and solar resources prevents resource developers from accurately estimating the value of wind and solar energy. If developers increase their investment in wind and solar resources, the final profits are likely to be much less than the average pre-development estimate. Therefore, to develop wind- and solar-energy resources, developers need to increase the estimated capital input required and reduce the estimated profit for wind- and solar-energy resources.
According to the spatial distribution of wind- and solar-energy resources in China (Figure 5 and Figure 6), the regions with the most abundant wind-energy resources are the Northeast River Basin, the west coast of Hainan Island in the Pearl River Basin, the Shandong Peninsula in the Huaihe River Basin, the Northwest River Basin, and the Inner Mongolia Plateau in the Haihe River Basin. The annual average wind-energy density in these regions is at least 150 W/m2. The regions with the most abundant solar-energy resources are the Southwest River Basin and the Qinghai-Tibet Plateau in the Northwest River Basin, where the annual average total solar radiation is at least 6500 MJ/m2. The spatial distributions of both resources are consistent with the findings of Li and Tao and Zhao et al., who all use data from weather stations to calculate effective wind density and annual solar radiation through algorithmic models [7,9,10,11]. This indicates that the research data and research methods used herein are reliable.
The spatial distribution of these two resources also shows that the spatial distribution of these two renewable resources in China’s nine river basins is very different. For example, the wind energy resources in Hainan Island and Shandong Peninsula are at least 200 W/m2, which is far more abundant than other areas in the same basin. The solar energy resources in South Tibet are at least 7000 MJ/m2, which is far more abundant than other areas in the same basin. In the same river basin, the average annual wind- and solar-energy resources also differ considerably. For example, the wind-energy resources are much greater in the Northeast River Basin than are the solar-energy resources. However, the solar-energy resources are much greater in the Southwest River Basin than are the wind-energy resources. This raises the question of whether the wind and solar resources in a given region can be developed in a complementary way on an interannual scale. If so, the different types of renewable energy could be developed and used more efficiently. Therefore, we now study the complementarity of wind- and solar-energy resources in different river basins on an interannual scale. To test our hypothesis, Section 3.2 presents a quantitative assessment of the temporal complementarity of wind and solar resources.

3.2. Complementarity of Solar and Wind Resources

After analyzing the spatial and temporal characteristics of wind- and solar-energy resources in China in the previous section, we now strive to improve the efficiency of the development and use of different types of renewable energy. Toward this end, we propose a method whereby the wind and solar resources in each region are developed in a complementary way on an interannual time scale. To test this method, we use the Spearman correlation coefficient to study the complementarity of wind- and solar-energy resources on the interannual time scale.
To further explore the possibility of complementary development of wind- and solar-energy resources in China on an interannual time scale, we calculate the interannual variation in the annual total of wind- and solar-energy resources in China, and the final results are shown in Figure 7. On the interannual time scale, 54.29% of all meteorological stations show opposite trends for the two resources. On the contrary, 45.71% of the meteorological stations report the same trend for the two resources. These results show that, although 45.71% of the weather stations are not suitable for complementary development of wind- and solar-energy resources on the interannual time scale, 54.29% of the weather stations are capable of complementary development on the given time scale. Therefore, the complementarity of wind- and solar-energy resources in China merits further study. Over half of the regions in China are feasible for complementary development of wind and solar power.
Based on the results above, we now study the complementarity of wind- and solar-energy resources in China at the interannual scale. Figure 8 shows the spatial distribution of the complementarity of wind- and solar-energy resources. The green area shows where the two resources have good complementarity on the interannual time scale. The yellow area shows where the complementarity of the two resources is very weak or does not exist on the interannual scale. The red area indicates that the two resources have the same trend on the inter-annual scale. This is not conducive to the complementary development of the two resources. The figure clearly shows that the regions with good complementarity include the southern part of the Pearl River Basin, the southwest Yunnan-Guizhou Plateau in the Southwest River Basin, the southern part of the North China Plain in the Huaihe River Basin, the Jinjing-tang area in the Haihe River Basin, the Zhejiang coastal area in the Southeast River Basin, and the south-central region of the Northeast River Basin.
The results show that the temporal complementarity of wind- and solar-energy resources in China is spatially heterogeneous. In some areas, the complementarity of these two resources on the interannual scale is very weak or does not exist. Therefore, on the large spatial scale of China, the profit generated by the complementary development of the two resources may be less than estimated. To solve this problem, we propose the introduction of a stable renewable resource to coordinate and supplement the complementary development of wind- and solar-energy resources to overcome the deficiency of development and thereby improve the profitability of complementary development. We thus introduce in Section 3.3 the water-energy resource as the third renewable resource, with the goal exploiting the three renewable resources to improve the profit of complementary development. In other words, we take advantage of a third, relatively stable renewable resource and develop it in a coordinated way in areas where the complementarity of wind and solar resources are weak, thereby improving the profit generated by the complementary development. Therefore, in the following section, we analyze our hypothesis by statistical methods.

3.3. Coordination and Complementarity of Water-Energy Resources

Because the temporal complementarity of wind- and solar-energy resources in China is spatially heterogeneous, the profit generated by the complementary development of these two resources may be less than estimated. To overcome this problem, we introduce a third renewable resource to complete the complementarity of these two resources and improve the profit earned by the complementary development of multiple renewable resources. After some consideration, we suggest that water-energy resources (the proxy indicator is the reserves of hydraulic resources (MW)) can be used as the third renewable resource because they involve a mature technology and are stable over long timescales.
According to the percent of wind-, water-, and solar-energy resources in each of the nine river basins in China (Figure 9), the fraction of hydro-resources in each basin is significant. The share of wind-energy resources is relatively low, and solar energy contributes the least. For example, the Yangtze River Basin and the Southwest River Basin account for over 70% of China’s water resources. However, wind- and solar-energy resources in a considerable part of the Yangtze River Basin and the Southwest River Basin do not offer advantages in complementary development. Thus, the abundant water-energy resources in the basin can be used to coordinate the regions where wind- and solar-energy resources are noncomplementary and poorly developed. In addition, we want to better compare the amount of wind-, solar-, and hydro-energy resources in each basin. In Figure 9, we normalize the fractions given in Figure 8 of the three resources in each basin to 100%.
Figure 10 shows the fraction of wind-, hydro-, and solar-energy resources. The fraction of wind- and solar-energy resources in each basin is approximately the same, but the amount of hydro-energy resources differs. For example, minimal hydro-resources are available in the Huaihe River Basin and the Haihe River Basin. However, the Huaihe River Basin and the Haihe River Basin are relatively rich in wind- and solar-energy resources. Moreover, the advantages of complementary development of wind and solar energy in these two basins are relatively significant, but the urgency to coordinate and complement them is not obvious. For this reason, we suggest that the development of wind- and solar-energy resources should be coordinated and complemented with the third renewable resource (i.e., hydro-energy) in areas with insignificant complementary advantages. This method would significantly improve the profitability of the complementary development of these renewable-energy sources.
Although we have no way to quantify the coordination of hydropower resource complementary, the statistical results of Figure 9 show that there are quite a number of regions where hydropower resource coordination complementarity is possible, which can greatly improve the utilization rate of the development of renewable resources, which would raise the profits of the resource developers.

4. Discussion

Based on the China Surface Climate Data Dataset V3.0, we analyze herein the spatial and temporal distribution in wind- and solar-energy resources in China and evaluate via the Spearman coefficient the temporal complementarity of wind- and solar-energy resources in China. We also discuss the possibility of coordinating hydro-energy resources with wind- and solar-energy resources in regions that lack complementarity. Previous studies have shown that more research focuses on assessing the amount of renewable resources in a river basin or a region of China [6,7,8,9,10,11,12]. No direct assessment and analysis exist for the two types of renewable resources in China, and in-depth complementary research is still lacking on the two types of renewable resources (i.e., wind and solar) [16,17,22,23]. Therefore, the objective of this work is to quantitatively analyze the spatial and temporal distribution of wind- and solar-energy resources in China on the scale of a river basin and to quantitatively assess the complementarity of these two renewable resources on the interannual scale.
For this reason, we use as an indicator the Spearman coefficient analysis rather than the Pearson coefficient and the Kendall coefficient because, according to relevant research, the different indicators for evaluating wind and light energy complementarity follow the same trends. However, the Spearman coefficient of complementary strength is better than the other indicators. In addition, we use wind energy density and solar radiation as proxies for wind energy and solar energy. Spearman’s coefficient can ignore the unit attributes of the two indicators, and we can improve the efficiency of data processing and analysis without affecting the research results.
Wind energy and solar energy are typical climate resources, but they are not the only renewable resources in China, which also has hydro-energy resources, geothermal-energy resources, tidal-energy resources, and so on [40,41,42,43,44]. Therefore, we hope to coordinate wind- and solar-energy resources in areas where the complementarity advantage is not obvious by using hydro-energy, which is temporally stable, widely distributed, and easily accessible to improve the profit from the actual complementary development [44,45,46]. The evaluation results of water energy resources in nine basins in China show that it is possible to coordinate and complement water energy resources. Our statistical analysis shows that hydropower resources provide a third type of energy as a possible complementary resource, and in macroscopic areas, hydropower resources are suitable for coordinated and complementary renewable resources. However, because water resources have the property of stability, we cannot model them to quantify the value of hydropower resource coordination and complementarity. In addition, the development and use of hydro-energy resources are mainly limited to freshwater resources [47,48]. In future work, we should consider the reduction in freshwater resources caused by drought and human society. In addition, the regional hydro-resources of China’s nine large river basins should be quantitatively evaluated to better understand how various renewable resources complement each other to reduce the development cost and increase the profitability of complementary resource development [49,50,51].
Although this study only considers the theoretical availability of wind and solar energy in China from the perspective of the amount of renewable resources, it does not specifically analyze the problems in the process of energy conversion of renewable resources. This does not diminish the value of this study, because the paper can still go up from the perspective of resource quantity, the space–time characteristics of wind- and solar-energy resources, and in this article, combined with the coordination of the complementary characteristics of hydropower-resource complementary with wind and solar energy resource assessment, to a certain extent for the realization of the “carbon peaking and carbon neutrality” to provide theoretical results.

5. Conclusions

This paper analyzes the spatial and temporal distribution of wind- and solar-energy resources in China and their complementarity by considering wind-energy density, total annual solar radiation, and the Spearman coefficient. The results lead to the following three main conclusions:
(1)
Wind-energy resources and solar-energy resources in China fluctuate strongly on the interannual scale. Moreover, the greatest interannual variations occurred in 2017 for wind-energy resources and in 2013 for solar-energy resources. The spatial distribution of these two resources also varies significantly. The greatest spatial variations in the distribution of wind-energy resources are in Hainan Island and Shandong Peninsula, and the distribution of solar-energy resources varies most significantly in southern Tibet.
(2)
In China, 54.29% of the weather stations have good complementarity of wind- and solar-energy resources on the interannual scale, but 45.71% of the weather stations are not suitable for complementary development of wind- and solar-energy resources on the interannual time scale. The regions with better complementarity of wind- and solar-energy resources include the southern part of the Pearl River Basin, the southwest Yunnan-Guizhou Plateau in the Southwest River Basin, the southern part of the North China Plain in the Huaihe River Basin, the Jinjing-tang area in the Haihe River Basin, the Zhejiang coastal area in the Southeast River Basin, and the south-central region of the Northeast River Basin.
(3)
An analysis of resource quantity shows that hydro-energy resources are very rich in river basins where wind- and solar-energy resources are lacking and their complementarity is poor. On the contrary, wind- and solar-energy resources are abundant and complementary in river basins where hydro-energy resources are relatively poor. Therefore, it is feasible to coordinate and complement the development of wind- and solar-energy resources in the areas where the complementarity advantage is not significant. Such a strategy can improve the profits obtained from the actual complementary development of wind- and solar-energy resources.

Author Contributions

Conceptualization, A.L.; methodology, A.L. and T.L.; software, A.L. and T.L.; validation, T.L. and Y.L.; formal analysis, A.L. and T.L.; investigation, T.L. and Y.L.; resources, A.L. and W.Z.; data curation, A.L., T.L., and W.Z.; writing—original draft preparation, A.L.; writing—review and editing, A.L. and W.Z.; visualization, A.L. and T.L.; supervision, W.Z.; project administration, A.L. and W.Z.; All authors have read and agreed to the published version of the manuscript.

Funding

This research was supported by the Third Xinjiang Scientific Expedition and Research Program (2021xjkk0203) and the Strategic Priority Research Program of the Chinese Academy of Sciences (XDA20010201).

Data Availability Statement

Data used in this study are publicly available in the article.

Acknowledgments

We thank the editor and anonymous reviewers for their very helpful comments and suggestions for improving the quality of the article.

Conflicts of Interest

The authors declare no conflict of interest.

References

  1. Shen, L.; Liu, L.; Gao, T.; Xue, J.; Chen, F. The quantity, flow and functional zoning of energy resources in China. Resour. Sci. 2012, 34, 1611–1621. [Google Scholar]
  2. Papaefthymiou, G.; Dragoon, K. Towards 100% renewable energy systems: Uncapping power system flexibility. Energy Policy 2016, 92, 69–82. [Google Scholar] [CrossRef]
  3. Vasilis, F.; James, E.M.; Ken, Z. The technical, geographical, and economic feasibility for solar energy to supply the energy needs of the US. Energy Policy 2008, 37, 387–399. [Google Scholar]
  4. John, B.; Lado, K.; Daniele, P.; Allen, B. The potential of solar electric power for meeting future US energy needs: A comparison of projections of solar electric energy generation and Arctic National Wildlife Refuge oil production. Fuel Energy Abstr. 2004, 45, 268. [Google Scholar]
  5. Gilberto, P.; Arno, K.; Fausto, A. Canales. Complementarity Maps of Wind- and solar-energy resources for Rio Grande do Sul, Brazil. Energy Power Eng. 2017, 9, 489–504. [Google Scholar]
  6. Zhu, R.; Wang, Y.; Xiang, Y.; Sun, C.; Chang, R.; Hu, G.; Gao, Z. Study on climate characteristics and development potential of wind energy resources in China. Acta Energ. Sol. Sin. 2021, 42, 409–418. [Google Scholar]
  7. Zhao, D.; Luo, Y.; Gao, G.; Zhu, C. Essential characteristics of solar direct radiation over recent 50 years in China. Acta Energ. Sol. Sin. 2009, 30, 946–952. [Google Scholar]
  8. Liao, S.; Liu, K.; Li, Z. Estimation of grid based spatial distribution of wind energy resource in China. J. Geo-Inf. Sci. 2008, 10, 551–556. [Google Scholar]
  9. Li, K.; He, F.; Xi, J. An Analysis of utilization potential distribution of wind power in Mainland China. Resour. Sci. 2010, 32, 1672–1678. [Google Scholar]
  10. Li, K.; He, F. Analysis on mainland China’s solar energy distribution and potential to utilize solar energy as an alternative energy source. Prog. Geogr. 2010, 29, 1049–1054. [Google Scholar]
  11. Tao, S.; Qi, Y.; Shen, S.; Li, Y.; Zhou, Y. The spatial and temporal variation of solar radiation over China from 1981 to 2014. J. Arid. Land Resour. Environ. 2016, 30, 143–147. [Google Scholar]
  12. Feng, Y.; Que, L.; Feng, J. Spatiotemporal characteristics of wind energy resources from 1960 to 2016 over China. Atmos. Ocean. Sci. Lett. 2020, 13, 136–145. [Google Scholar] [CrossRef] [Green Version]
  13. Huang, Q.; Guo, Y.; Jiang, J.; Ming, B. Development pathway of China’s clean electricity under carbon peaking and carbon neutrality goals. J. Shanghai Jiaotong Univ. 2021, 55, 1499–1509. [Google Scholar]
  14. Ma, B.; Jia, L.; Yu, Y.; Wang, H.; Chen, J.; Zhong, S.; Zhu, J. Geoscience and carbon neutralization:current status and development direction. Geol. China 2021, 48, 347–358. [Google Scholar]
  15. Zhang, T.; Chai, X.; Li, Z. Management of climate resources and sustainable development. Chin. J. Agric. Resour. Reg. Plan. 2007, 6, 26–30. [Google Scholar]
  16. Liu, Y.; Xiao, L.; Wang, H.; Lin, L.; Dai, S.; Qi, Z. Temporospatial Complementarities Between China’s Wide-area Wind and Solar Energy at Different Time Scales. Proc. CSEE 2013, 33, 20–26+6. [Google Scholar]
  17. Wen, X.; Sun, Y.; Tan, Q.; Lei, X.; Ding, Z.; Liu, Z.; Wang, H. Risk and Benefit Analysis of Hydro-wind-solar Multi-energy System Considering the One-day Ahead Output Forecast Uncertainty. Adv. Eng. Sci. 2020, 52, 32–41. [Google Scholar]
  18. Wei, S.; Harrison, G.P. Wind-solar complementarity and effective use of distribution network capacity. Appl. Energy 2019, 247, 89–101. [Google Scholar]
  19. Jurasz, J.; Mikulik, J.; Dabek, P.; Guezgouz, M.; Kaźmierczak, B. Complementarity and ‘Resource Droughts’ of Solar and Wind Energy in Poland: An ERA5-Based Analysis. Energies 2021, 14, 1118. [Google Scholar] [CrossRef]
  20. Handriyanti, D.P.; Baptiste, F.; Mattia, Z.; Casey, B.; Marco, B. The impact of glacier shrinkage on energy production from hydropower-solar complementarity in alpine river basins. Sci. Total Environ. 2020, 719, 137488. [Google Scholar]
  21. Han, S.; Zhang, L.; Liu, Y.; Zhang, H.; Yan, J.; Li, L.; Lei, X.; Wang, X. Quantitative evaluation method for the complementarity of wind–solar–hydro power and optimization of wind–solar ratio. Appl. Energy 2019, 236, 973–984. [Google Scholar] [CrossRef]
  22. Zhang, J.; Zhang, M.; Zhao, W. Benefit evaluation of developing wind-solar complementary irrigation model in Northwest China. China Rural. Water Hydropower 2017, 02, 43–46. [Google Scholar]
  23. Zhang, M.; Wang, Z.; Yang, C. Study on adaptability of coastal wind-solar complementary system to load demand. Distrib. Energy 2021, 6, 47–55. [Google Scholar]
  24. Ming, B.; Liu, P.; Cheng, L.; Zhou, Y.; Wang, X. Optimal daily generation scheduling of large hydro-photovoltaic hybrid power plants. Energy Convers. Manag. 2018, 171, 528–540. [Google Scholar] [CrossRef]
  25. Li, F.; Qiu, J. Multi-objective optimization for integrated hydro-photovoltaic power system. Appl. Energy 2016, 167, 377–384. [Google Scholar] [CrossRef]
  26. DeCarolis, J.F.; Keith, D.W. The economics of large-scale wind power in a carbon constrained world. Energy Policy 2006, 34, 395–410. [Google Scholar] [CrossRef]
  27. Kempton, W.; Pimenta, F.; Veron, D.; Colle, B. Electric power from offshore wind via synoptic-scale interconnection. Proc. Natl. Acad. Sci. USA 2010, 107, 7240–7245. [Google Scholar] [CrossRef] [Green Version]
  28. GB/T18710-2002; Wind Energy Resource Assessment Method for Wind Farms. Standards Press of China: Beijing, China, 2002; The National Standards of People’s Republic of China.
  29. Peterson, E.W.; Hennessey, J.P., Jr. On the Use of Power Laws for Estimates of Wind Power Potential. J. Appl. Meteorol. 1978, 17, 390–394. [Google Scholar] [CrossRef]
  30. Bailey, B.H.; McDonald, S.L. Wind Resource Assessment Handbook; AWS Scientific, Inc.: New York, NY, USA, 1997. [Google Scholar]
  31. Zhu, R. Evaluation of solar and wind energy resources in China. Meteorol. Mon. 1984, 10, 19–23. [Google Scholar]
  32. Cao, W.; Shen, S. Estimation of daily solar radiation in China. Trans. Atmos. Sci. 2008, 26, 587–591. [Google Scholar]
  33. Yang, K.; Toshio, K.; Baisheng, Y. Improving estimation of hourly, daily, and monthly solar radiation by importing global data sets. Agric. For. Meteorol. 2006, 137, 43–55. [Google Scholar] [CrossRef]
  34. He, Q.; Xie, Y. Research on the climatological calculation method of solar radiation in china. Journal of Natural Resources 2010, 25, 308–319. [Google Scholar]
  35. Jurasz, J.; Canales, F.A.; Kies, A. A review on the complementarity of renewable energy sources: Concept, metrics, application and future research directions. Sol. Energy 2020, 195, 703–724. [Google Scholar] [CrossRef]
  36. Yan, J.; Qu, T.; Han, S.; Liu, Y.; Lei, X.; Wang, H. Reviews on characteristic of renewables: Evaluating the variability and complementarity. Int. Trans. Electr. Energy Syst. 2020, 30, e12281. [Google Scholar] [CrossRef]
  37. Jones, P.D. Hemispheric surface air temperature variations: Recent trent and updata to 1978. J. Clim. 1998, 1, 654–660. [Google Scholar] [CrossRef]
  38. Uddin, M.S.; Czajkowski, K.P. Performance Assessment of Spatial Interpolation Methods for the Estimation of Atmospheric Carbon Dioxide in the Wider Geographic Extent. J. Geovisualization Spat. Anal. 2022, 6, 10. [Google Scholar] [CrossRef]
  39. Longo, M.G.; Vanella, D.; Consoli, S.; Pappalardo, S.; Ramírez, C. Assessing the use of ERA5-Land reanalysis and spatial interpolation methods for retrieving precipitation estimates at basin scale. Atmos. Res. 2022, 271, 106131. [Google Scholar] [CrossRef]
  40. Zekai, Ş. Solar energy in progress and future research trends. Prog. Energy Combust. Sci. 2004, 30, 367–416. [Google Scholar]
  41. Argüeso, D.; Businger, S. Wind power characteristics of Oahu, Hawaii. Renew. Energy 2018, 128, 324–336. [Google Scholar] [CrossRef]
  42. Wang, X. Distribution & suggestions on exploitation and utilization of geothermal resources at areas along Yellow river of Henan province. Yellow River 2020, 42, 130–135. [Google Scholar]
  43. Wu, H.; Wang, X.; Li, S. Advance in the study of assessment and utilization pf tidal energy resources in China. Mar. Sci. Bull. 2015, 34, 370–376. [Google Scholar]
  44. Lv, A.; Han, Y.; Zhu, W.; Zhang, S.; Zhao, W. Risk Assessment of Water Resources Carrying Capacity in China. JAWRA J. Am. Water Resour. Assoc. 2021, 57, 539–551. [Google Scholar] [CrossRef]
  45. Jia, S.; Lv, A.; Yan, H.; Long, Q.; Yan, H. Water Resources Security Report of China; Science Press: Beijing, China, 2014. [Google Scholar]
  46. Tang, Q.; Lei, W.; Jia, S.; Yang, D.; Sun, S.; Liu, X.; Zhang, X.; Xia, J.; Liu, C. Terrestrial Water Cycle and Water Resources; Springer: Singapore, 2017. [Google Scholar]
  47. Liang, Y.; Lv, A. Risk assessment of water resource security in China. Resour. Sci. 2019, 41, 775–789. [Google Scholar]
  48. Yan, J.; Jia, S.; Lv, A.; Zhu, W. Spatial-temporal variation characteristics of China terrestrial water storage in the last ten years. South-to-North Water Transf. Water Sci. Technol. 2016, 14, 21–28. [Google Scholar]
  49. Campana, P.E.; Zhang, T.; Yao, T.; Andersson, S.; Landelius, T.; Melton, F.; Yan, J. Managing agricultural drought in Sweden using a novel spatially-explicit model from the perspective of water-food-energy nexus. J. Clean. Prod. 2018, 197, 1382–1393. [Google Scholar] [CrossRef]
  50. Magdalena, B.; Grazia, B.; Józef, P. Time-Series PV Hosting Capacity Assessment with Storage Deployment. Energies 2020, 13, 2524. [Google Scholar]
  51. Zhang, F.; Wu, Z.; Di, D.; Jiang, M.; Wang, H.; Chen, X. Social values of water resources: Analyzing its spatial distribution characteristics and influencing factors using an ESSR model. Ecol. Indic. 2022, 142, 109200. [Google Scholar] [CrossRef]
Figure 1. Distribution of nine river basins and meteorological stations in China.
Energies 15 07365 g001
Figure 2. Flow chart of research method.
Energies 15 07365 g002
Figure 3. Interannual variation in average effective wind-energy density in nine river basins of China from 2010 to 2019.
Energies 15 07365 g003
Figure 4. Interannual variation in annual surface solar radiation in nine river basins of China from 2010 to 2019.
Energies 15 07365 g004
Figure 5. Spatial distribution of annual average effective wind energy density in Chinese river basins.
Energies 15 07365 g005
Figure 6. Spatial distribution of annual mean solar radiation over Chinese river basins.
Energies 15 07365 g006
Figure 7. Interannual trends of wind and solar energy at each meteorological site in a watershed in China.
Energies 15 07365 g007
Figure 8. Spatial distribution of complementarity of wind-energy resources and solar-energy resources based on total available resources per year in Chinese river basins.
Energies 15 07365 g008
Figure 9. The fraction of wind-, hydro-, and solar-energy resources to total resources in the nine river basins in China.
Energies 15 07365 g009
Figure 10. Percent of wind-, hydro-, and solar-energy resources in the nine river basins of China.
Energies 15 07365 g010
Publisher’s Note: MDPI stays neutral with regard to jurisdictional claims in published maps and institutional affiliations.

