Article

Effect of Water Injection on Turbine Inlet under Different Flight Conditions

China Aerodynamics Research and Development Center, Mianyang 621000, China
*
Author to whom correspondence should be addressed.
Energies 2022, 15(19), 7447; https://doi.org/10.3390/en15197447
Submission received: 28 August 2022 / Revised: 23 September 2022 / Accepted: 4 October 2022 / Published: 10 October 2022
(This article belongs to the Special Issue Heat and Thermal Fluid Flow for Advanced Aerospace Propulsion)

Abstract

:
Numerical simulations were conducted to research the pre-cooling effects of water injection on the turbine inlet of a turbine-based combined cycle (TBCC) engine under different flight conditions. Then, the performance of the water injection pre-compressor cooling (WIPCC) engine was calculated by mathematical modelling with different water to air ratios (WAR). It was the first time that the mass injection field of the turbine inlet of a TBCC engine was simulated, and it was also the first time that the performance of a subcomponent turbine engine of a TBCC was assessed. The calculation results showed the relationship of the inlet temperature with respect to WAR, inlet length and flight Mach number. The strategy for inlet length and water mass flow was proposed in order to meet the requirements of pre-cooling. When the length of the turbine inlet was 10 times the diameter of the inlet exit, the air could be cooled by 167.5 K with WAR = 0.09. The highest evaporation ratio reached at 93%. Finally, the calculation results revealed the performance of the water-pre-cooled turbine engine, of which the flight envelope was expanded to Ma3.0 from Ma2.3 by pre-cooling. The engine thrust as well as the specific impulse were significantly improved. The thrust reached at 0.9 times the characteristic thrust meeting the TBCC mode transition requirement of thrust and working speed spectrum.

1. Introduction

The turbine-based combined cycle (TBCC) engine is the most attractive power source for high-speed vehicles. The TBCC engine is one of the ideal power systems for multi-stage-to-orbit (MSTO) vehicles and high-speed aircraft. However, there is a thrust gap when the operation mode transforms from turbine engine to ramjet, because the highest flight velocity of the turbine engine is about Ma2.3, and the lowest start velocity of the ramjet is about Ma2.5.
Pre-compressor cooling by mass injection in the turbine inlet is an effective approach to eliminate the thrust gap. The MSE Technology Applications, Inc. firstly proposed the concept of the mass injection pre-compressor cooling (MIPCC) engine [1], as shown in Figure 1. The MIPCC engine comprises a compressor, combustor, turbine, afterburner and nozzle. Compared with a conventional turbine engine, more mediums can be injected into the engine, such as water, liquid air (LAir), and some oxidizers. Sometimes, different mediums will be injected into both the combustor and afterburner with the purpose of expanding the working speed spectrum and stabilizing the flame. The strategy of MIPCC aimed to cool the inlet airflow by injecting cooling water into the inlet duct ahead of the compressor [2]. If the injected materials only contain pure water, it will be named as a water injection pre-compressor cooling (WIPCC) engine. However, excessive cooling water might result in unstable combustion [3] and even quenching in both combustor and afterburner. The study from MSE Technology Application, Inc. by Balepin showed that the mass fraction of oxygen in the main combustor decreased obviously after water injection in the engine inlet [4]. Therefore, oxidizer was injected into the inlet combined with cooling water or into the afterburner individually, which helped to stabilize and sustain the combustion. The cooling water not only cooled the airflow and augmented the amount of the captured air, but also itself contributed to the mass flow that entered the engine. The thrust was thus improved since it was proportional to the total mass through the engine [5].
The MSE Technology Applications, Inc. analyzed different combinations of water/oxidizer [6], and found that liquid oxygen (LOX) appeared to be the best reasonable oxidizer [7]. They also explored the capability of the Steamjet, and demonstrated that the Steamjet could provide sufficient thrust from sea level static (SLS) condition to Ma6+ [8]. The Defense Advanced Research Projects Agency (DARPA) initiated the Responsive Access Small Cargo Affordable Launch (RASCAL) program in 2002, aiming at the key technology of the MIPCC engine. The test of the MIPCC-enhanced F-100 engine indicated that the thrust can be improved by 11~34% [9,10,11]. NASA Dryden Flight Research Center carried out an experiment on MIPCC-enhanced F-4 and F-15 airplanes, and the flight tests determined that the capability of both F-4 and F-15 can be improved by an MIPCC-enhanced engine to deliver a usable payload [12].
Liang, Z.X. [13] built a mathematical model to study the characteristics of the Steamjet engine, then the velocity and altitude performance of the Steamjet engine with afterburner were calculated and analyzed. The computation results indicated that the water injection turbojet could operate up to as high as 30 km at Ma6.0, and the Steamjet with an afterburner which met the requirement of high-speed flight had better thrust characteristics compared with the Steamjet without an afterburner. Tu, H.Y. [14] researched the effects of water-to-air ratio on injection characteristics of WIPCC engine by numerical model incorporating the physical properties correction method, and then validated the calculated results with the available experimental data. The maximum relative deviation was lower than 3%, which showed high consistency. The numerical calculation found that the maximum cooled temperature was about 140 K at water-to-air ratio 0.07, and the absolute evaporation distance was 10 times the diameter of the injection chamber at water-to-air ratio 0.03.
Liu, X.F. [15] designed an MIPCC vehicle with high evaporation efficiency and low resistance based on a traditional turbine engine to investigate the injection characteristics of liquid water by experimental tests. The results demonstrated that the cooled temperature and evaporation efficiency rose as the inlet temperature increased. The temperature ahead of the fan remained within 353~393 K by adjusting the injection flow rate, and the total pressure loss of MIPCC appeared to be no more than 4%.
Lin, A.Q. [16,17,18,19] simulated the flow and heat transfer characteristics in an MIPCC engine pre-compressor section. The simulation accuracy of the numerical procedure was qualified by comparing with the experimental data. The numerical results indicated that the temperature drop was 7.3~135.5 K after water injection in the pre-compressor section. The geometry structures of the spray apparatus were optimized, but there was no significant difference in the droplet evaporation characteristics and air temperature drop. However, the geometric structure in his study was a straight circular tube. In fact, a practical engine inlet is not so uniform, the air duct shape was usually irregular.
Lv, C.K. and Chang, J.T. [20,21] proposed a new high-Mach-number turbine scheme, it is an MIPCC that applied ammonia as coolant. The thermodynamic model incorporating the ammonia mass injection pre-compressor cooling was developed to evaluate the engine performance. The evaluation results showed that the ammonia MIPCC engine has an advantage in specific impulse, but a disadvantage in specific thrust.
Most of the previous research studies did not take the practical TBCC inlet structure and flow field into account, the studies on the WIPCC engine based on a practical TBCC turbine inlet structure and flow field are still lacking. This paper employed a practical TBCC inlet as a geometric model, in which the cross-section shape at different axial positions of the inlet is variable. It is still a problem to determine the inlet length and the mass of water that is injected into the inlet to ensure a high working speed and thrust of the TBCC turbine engine. The requirement of water mass that needs to be injected into the inlet at different flight Mach numbers is still uncertain. Therefore, a numerical simulation was conducted using self-developed software (NNW) which is used for computational fluid dynamics to simulate the evaporation characteristics of injected water in the practical TBCC turbine inlet. It was the first time that the mass injection field of the turbine inlet of a TBCC engine was simulated. Then, a mathematical model for the WIPCC engine was developed based on a general engine performance program to calculate the influence of water injection on the performance of the turbine engine.

2. Inlet Model and Numerical Method

2.1. TBCC Turbine Inlet Model

The practical TBCC inlet structure was designed first, as shown in Figure 2. This TBCC contained two subsidiary engines, namely, a ramjet engine at the upper side and a turbine engine at the other side. Water injection was operated only in the turbine inlet channel. Eighteen injectors were employed at the cross-section in the rear of entrance, from which pure water with a temperature of 288 K was injected into the turbine inlet channel as coolant. In order to reduce the amount of calculation, a half-model was adopted for simulations of water injection, as shown in Figure 3.
The shape of the cross-section of the turbine inlet at the entrance was similar to a rectangle, then the shape transformed into a circle at the exit of turbine inlet channel. The diameter at the turbine channel exit was employed as the characteristic length, hence, the length of the turbine channel was nondimensionalized as 10 times the characteristic length precisely, namely, X = 10 D. The injectors of coolant were installed at the entrance cross-section.

2.2. Numerical Method

The incoming air is continuous phase. The continuity equation for the compressible flow can be written as follows:
ρ t + x i ρ u i = S m
The last item S m is the source item, which represents the mass injected into the continuous phase from the dispersed phase.
Equation (2) describes the conservation of momentum for continuity phase:
t ρ u i + x j ρ u i u j = p x i + τ i j x j + ρ g i + F i
where p is the static pressure, τ i j is the stress tensor, ρ g i and F i represent gravitational body force and external body forces, respectively. F i contains the interaction with the dispersed phase. The energy equation is written as follows:
t ρ E + x i u i ρ E + p = x i k eff T x i j h j J j + u j τ i j eff + S h
where k eff is effective conductivity, J j is the diffusion flux of species J . The last item of Equation (3) on the right hand includes volumetric heat sources from the injected water, and the rest of the items on the right-hand side represent energy transfer due to conduction, species diffusion, and viscous dissipation, respectively.
Water served as the discrete phase. Cone injector was applied in the simulation. Figure 4 illustrates the schematic of the cone injector. The radius of the cone was 0.25 mm, the cone direction was kept on the X-axis. The angle between the injection direction and X-axis was set to θ = 75°. The Rosin–Rammler law was used for the diameter distribution of droplets, the minimum, maximum and mean diameters were set as 10 μ m , 30 μ m and 50 μ m , respectively.
Some water droplets might break up after the heat transformation and aerodynamic interaction with incoming flow successively. Dynamic drag model was utilized to calculate the droplet drag coefficient, accounting for droplet deformation. Wave model was adopted to evaluate second breakup. When the water droplet was ejected from the injector, it would be heated first, then evaporated, and finally continued to absorb heat. The process of heat exchange between air and water was described in the following equation:
m p c p d T p d t = h A p ( T T p ) d m p d t h fg
where m p represents mass of a droplet; c p and T p represent droplet heat capacity and temperature, respectively; h represents convective heat transfer coefficient; T is the temperature of continuous phase; h fg represents latent heat of the droplet, and d m p / d t means the rate of evaporation.
The piecewise-polynomial method was selected to calculate the specific heat, and viscosity was computed using Sutherland’s equation. The flow field was solved using a density-based and transient solver.
After the simulations for WIPCC engine inlet, an engine performance program for WIPCC engine was utilized to calculate the performance of WIPCC engine [22]. The air temperature and pressure that flowed into the compressor should be revised in advance in the engine performance program, because the injected water cooled the incoming air and led to total pressure loss. The thermodynamic parameters variation of the air that flowed into the compressor were determined by simulations for WIPCC engine inlet:
T t _ 2 ' = T t _ 2 Δ T t _ 1
p t _ 2 ' = σ p t _ 2
The total temperature T t _ 2 ' and total pressure p t _ 2 ' correspond to the air thermodynamic state at inlet channel exit after water injection. T t _ 2 and p t _ 2 represent air total temperature and total pressure at the inlet entrance, Δ T t _ 1 is the cooled temperature by water injection in the inlet, σ represents total pressure recovery coefficient.
Another influence of the injected water on the incoming gas was the physical property, so the property of the mixed gas was revised according to the gas-mixing law [23].

2.3. Boundary Conditions

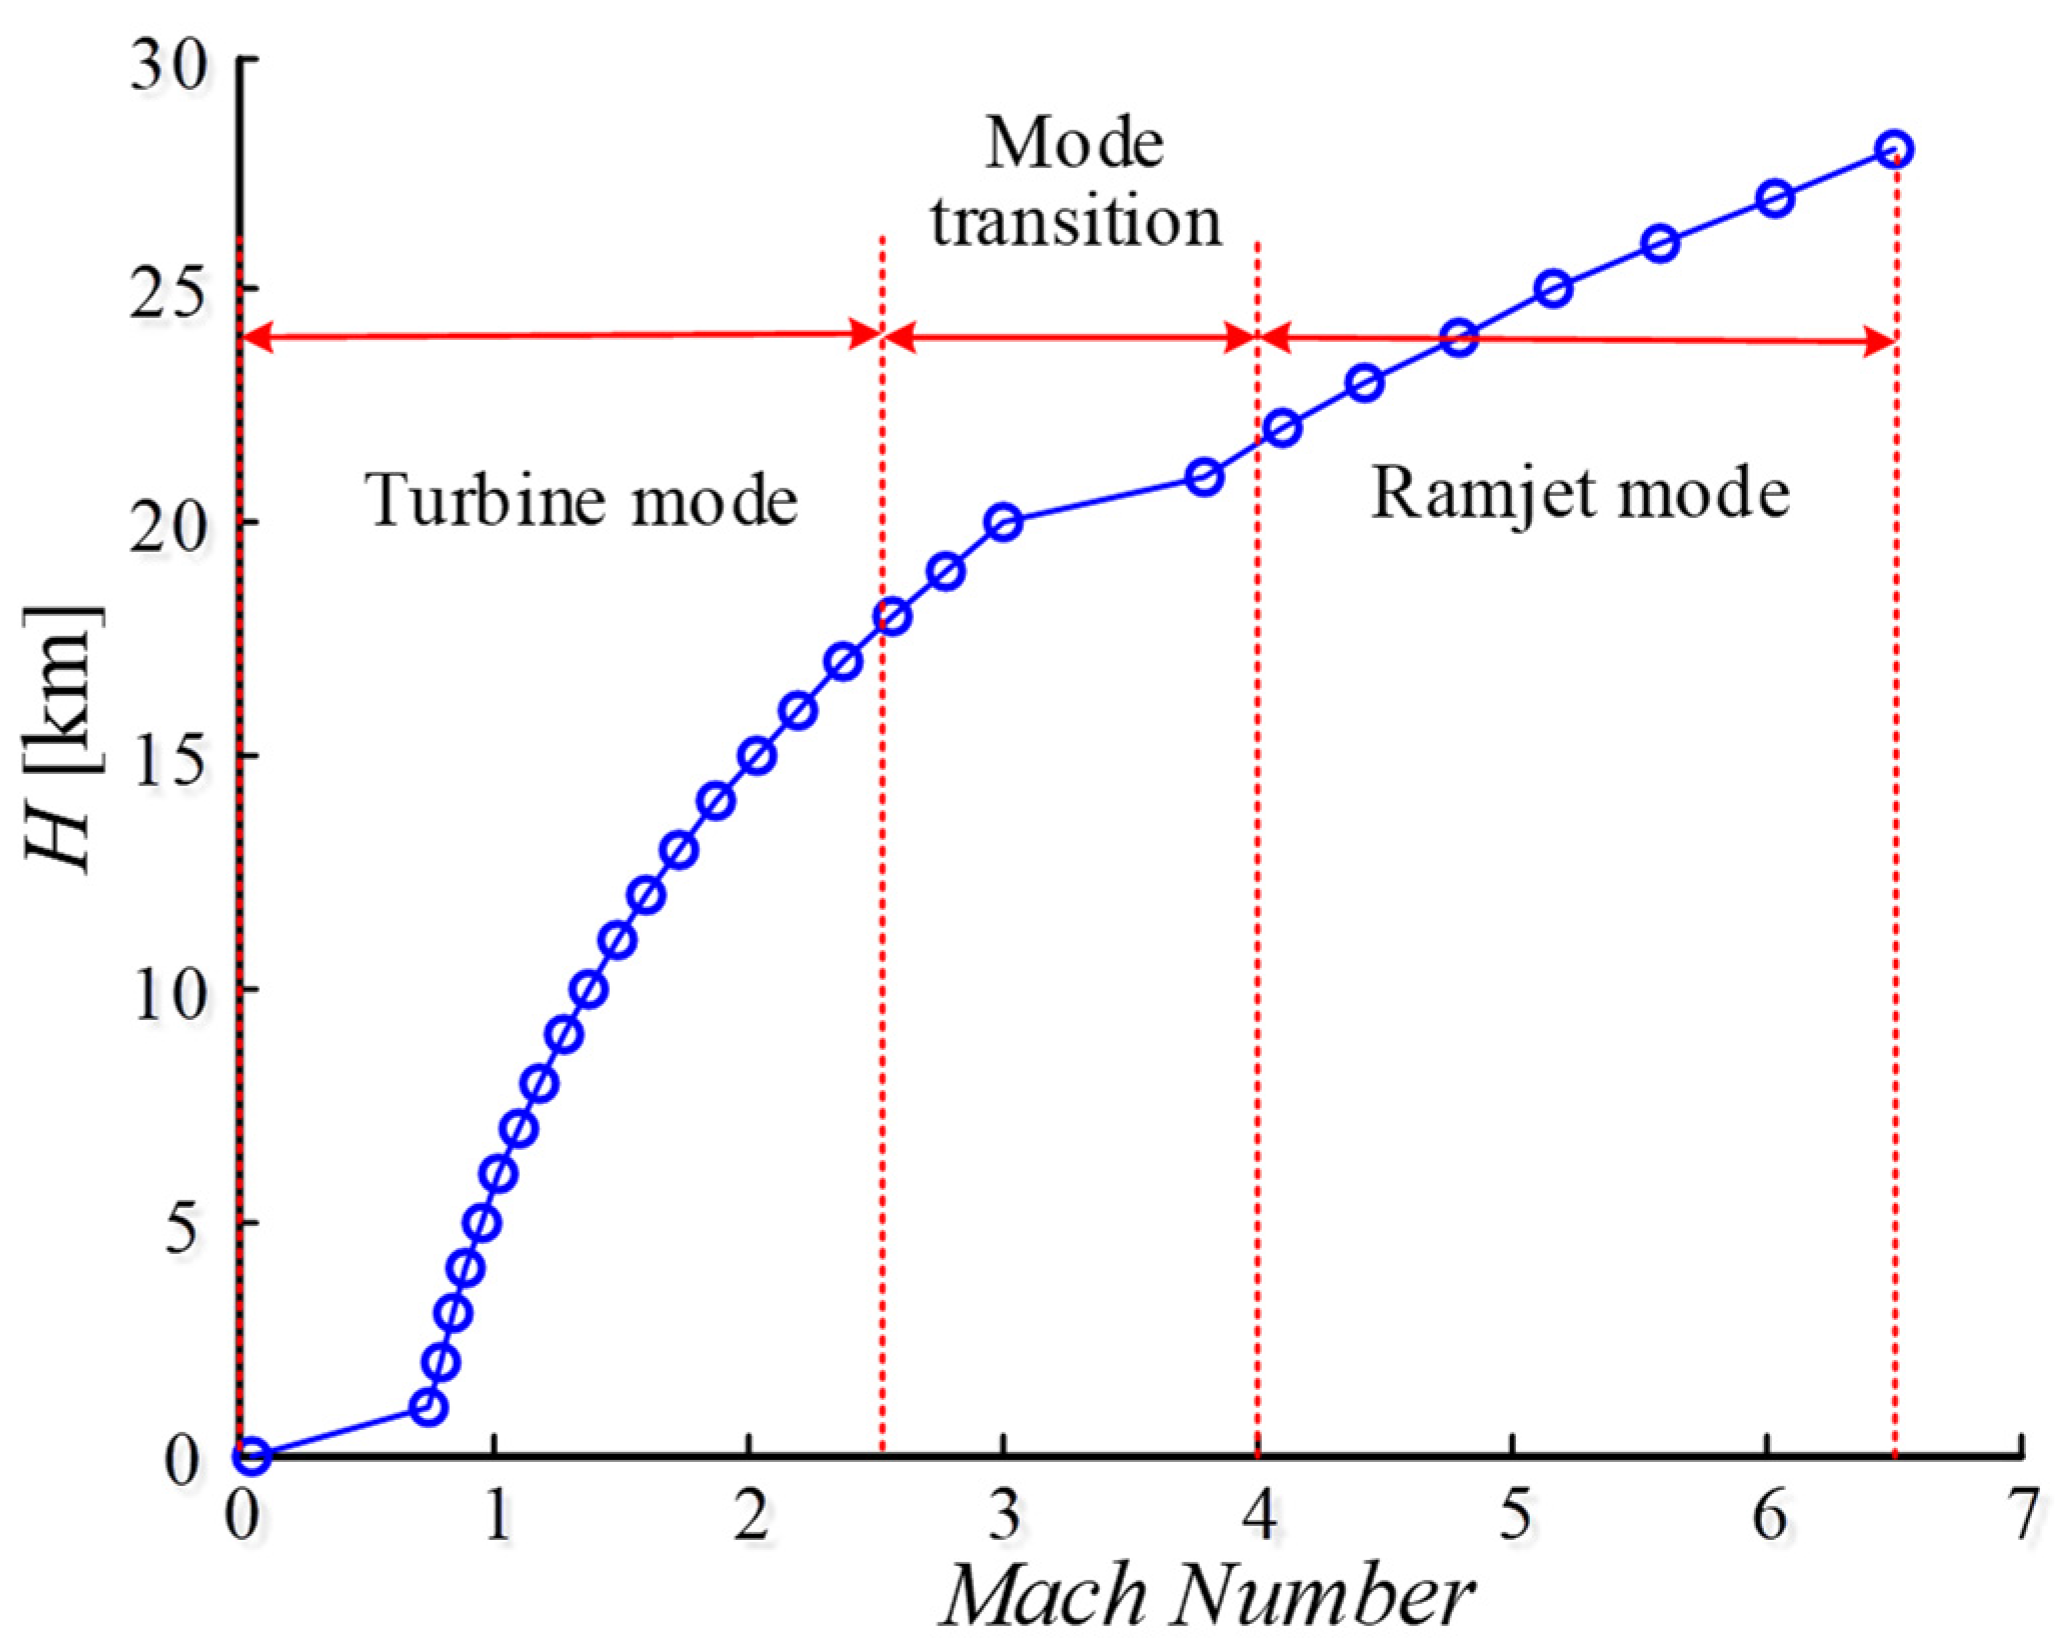
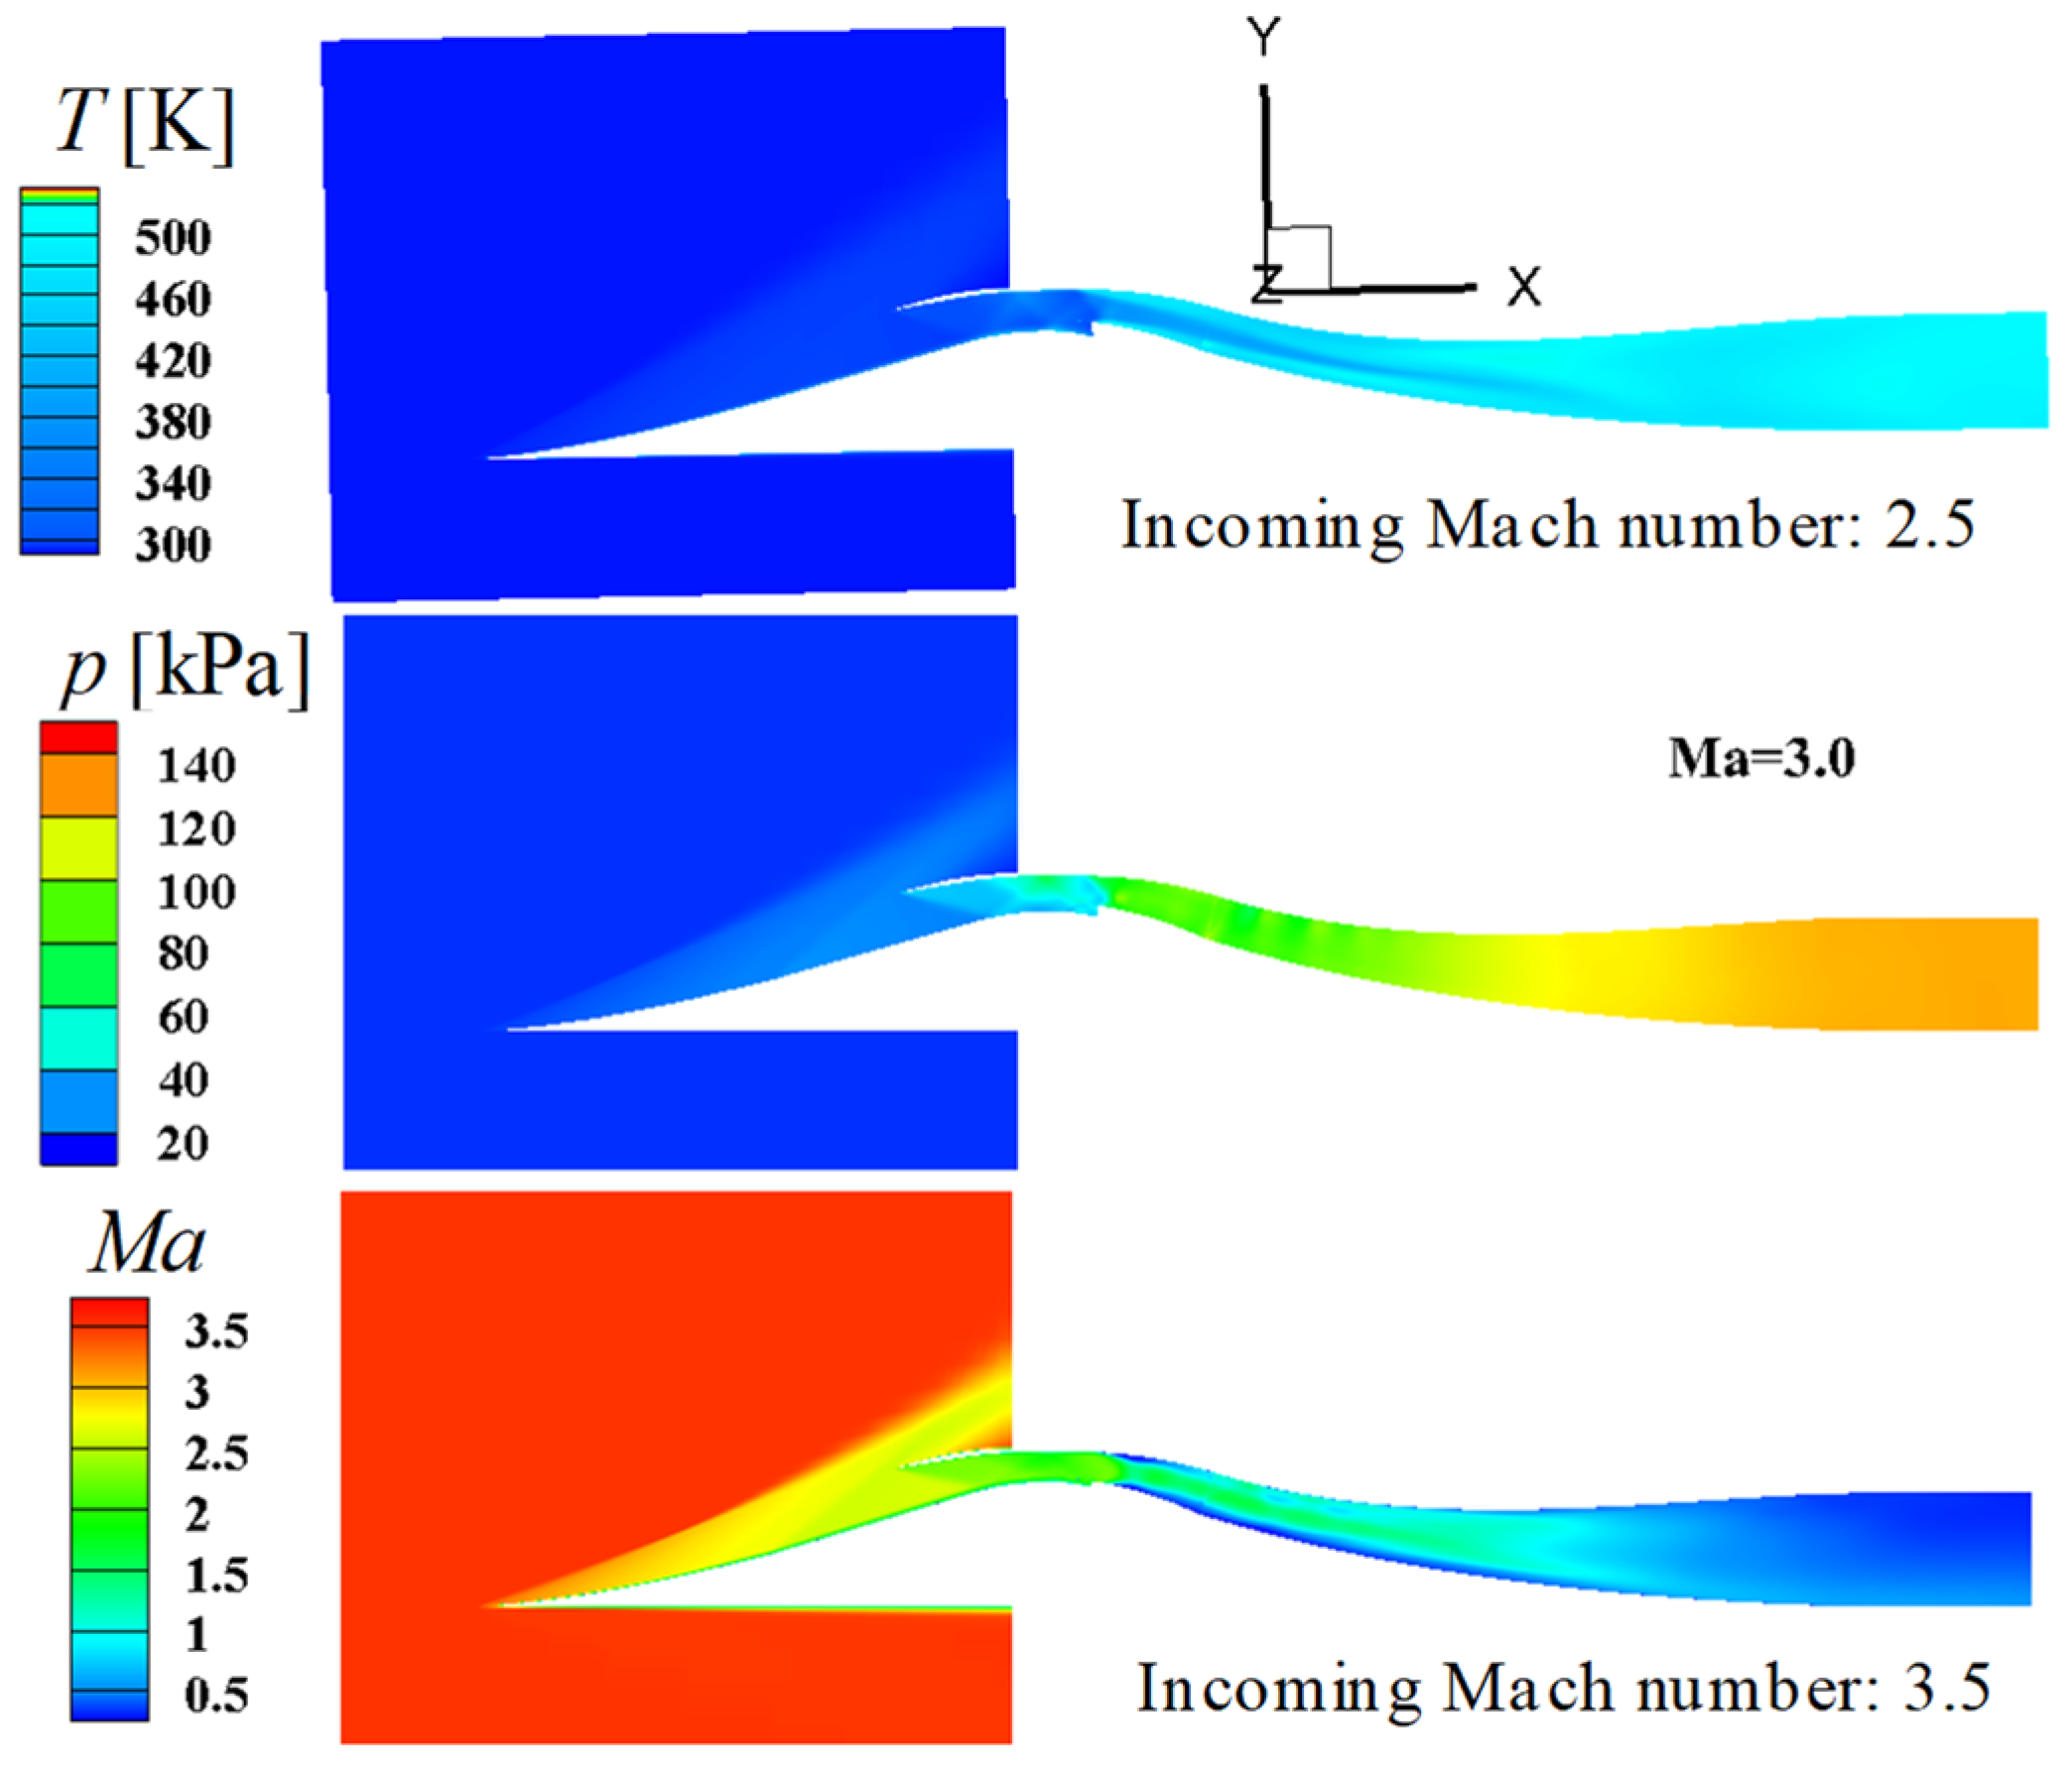
The trajectory of a TBCC vehicle was chosen as shown in Figure 5. During turbine mode, the vehicle kept the constant dynamic pressure at 34.8 kPa, then transformed from turbine mode to ramjet mode at Ma3.0, and next kept the dynamic pressure at 48.0 kPa. The inlet boundary conditions were defined based on this trajectory. The simulation was divided into two phases. At first, three-dimensional domain of the whole practical TBCC inlet was simulated without water injection, and the results are shown in Figure 6.
After the first phase, the simulations of water injection in the WIPCC inlet channel were carried out. The data at the location of the injection were extracted from the first simulation phase to specify the initial field of the WIPCC inlet. Table 1 shows the simulations boundary condition for water injection.
As for this engine, the limit temperature before the low-pressure compressor was assumed at 470 K, and the limit temperature at the last stage of the high-pressure compressor was assumed at 928 K. For different working conditions, the maximum temperature at the exit of the combustor and the afterburner was limited at 1665 K and 2050 K, respectively, by adjusting the shaft rotation speed and fuel supply.

3. Grid Independence and Numerical Model Validation

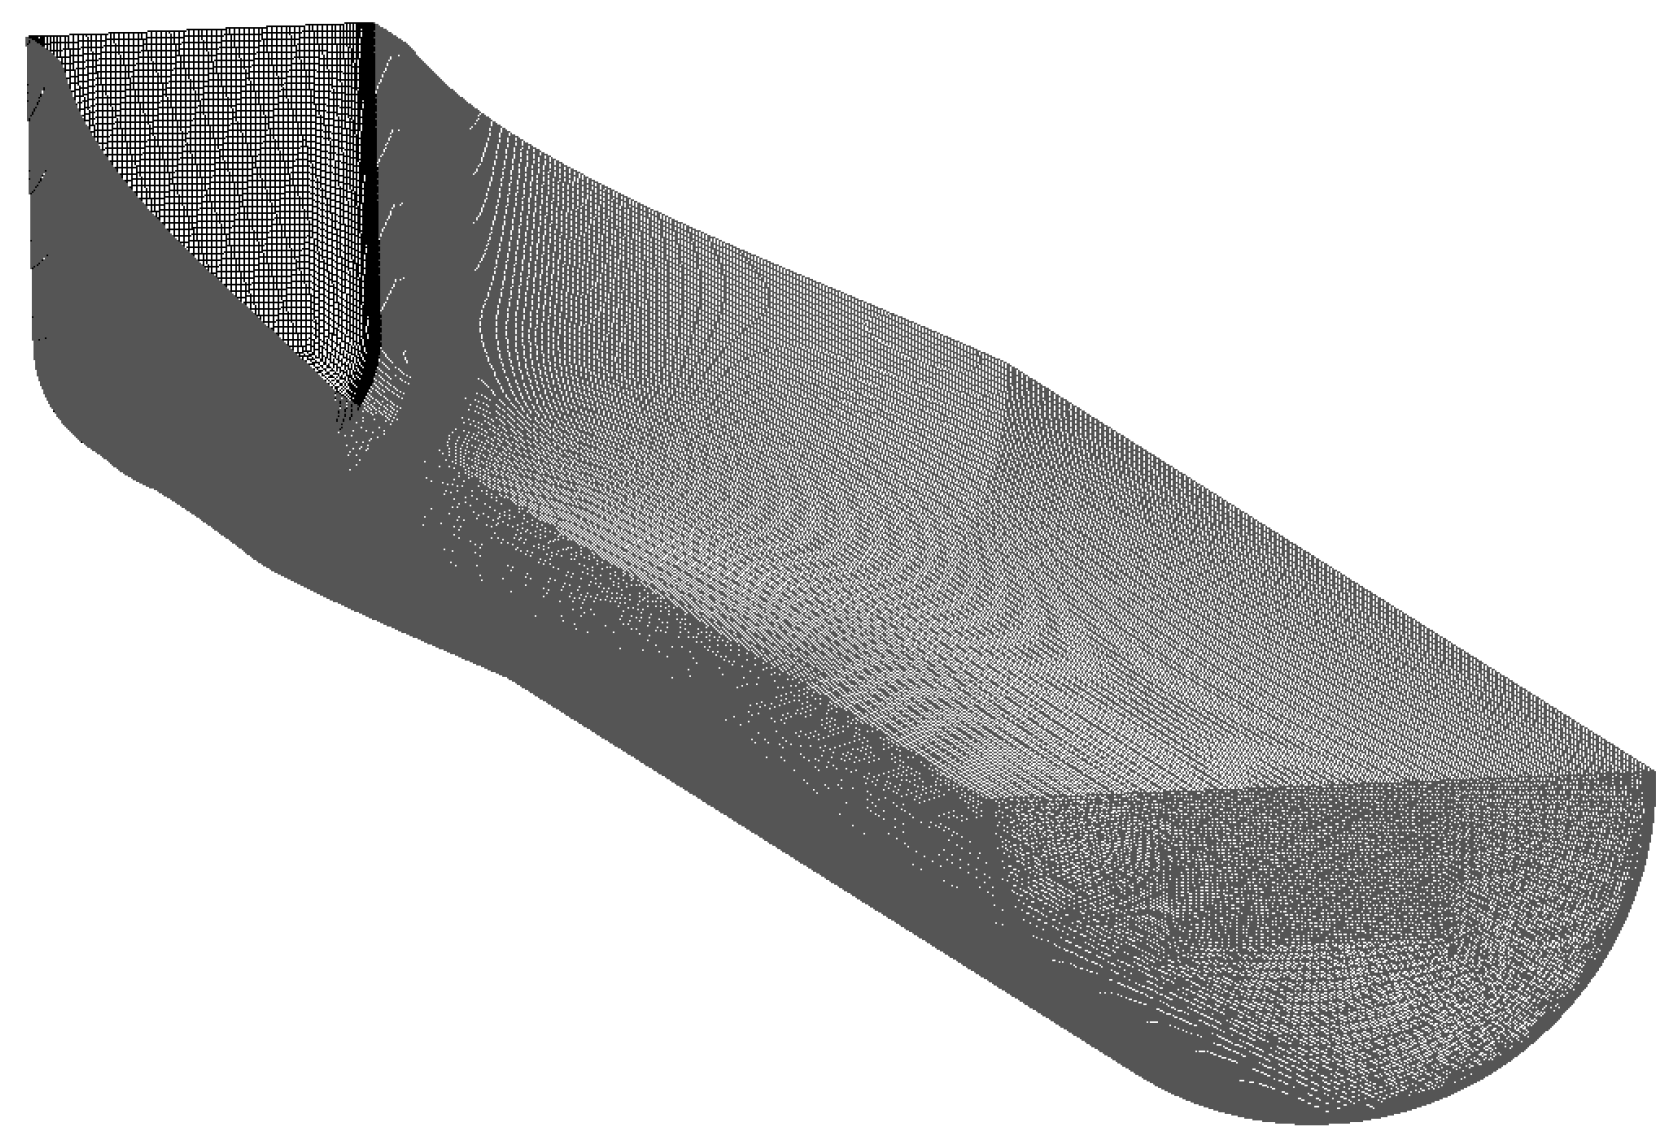
The grid independence was verified by a sequence of multi-block structured grids. The average edge length of densest grid, fine grid and coarse grid in the direction perpendicular to the incoming flow were specified as 1.0 × 10⁻³, 2.26 × 10⁻³, and 5 × 10⁻³ m, respectively. Figure 7 shows part of the fine grid. In order to simulate the flow area of the boundary layers correctly, the grid size declined gradually from the freestream to the adjacent area of the walls. The height of the nearest grid from the wall was set as 1 × 10⁻⁵ m, and the typical value of y+ kept no more than 10 for most cells.
The water-to-air ratio and inflow total temperature were specified as 0.03 and 606 K, respectively. The average total temperature along the inlet of different grids was compared as shown in Figure 8. Good consistency can be seen between the results from different grids, in all of which the relative deviation was lower than ± 1.0%. In view of the cost of numerical simulations as well as the precision, the fine grid was adopted for the subsequent simulation cases.
In order to validate the accuracy of the numerical method, simulation of the water spray in a wind tunnel diffuser was conducted and compared with the experimental data.
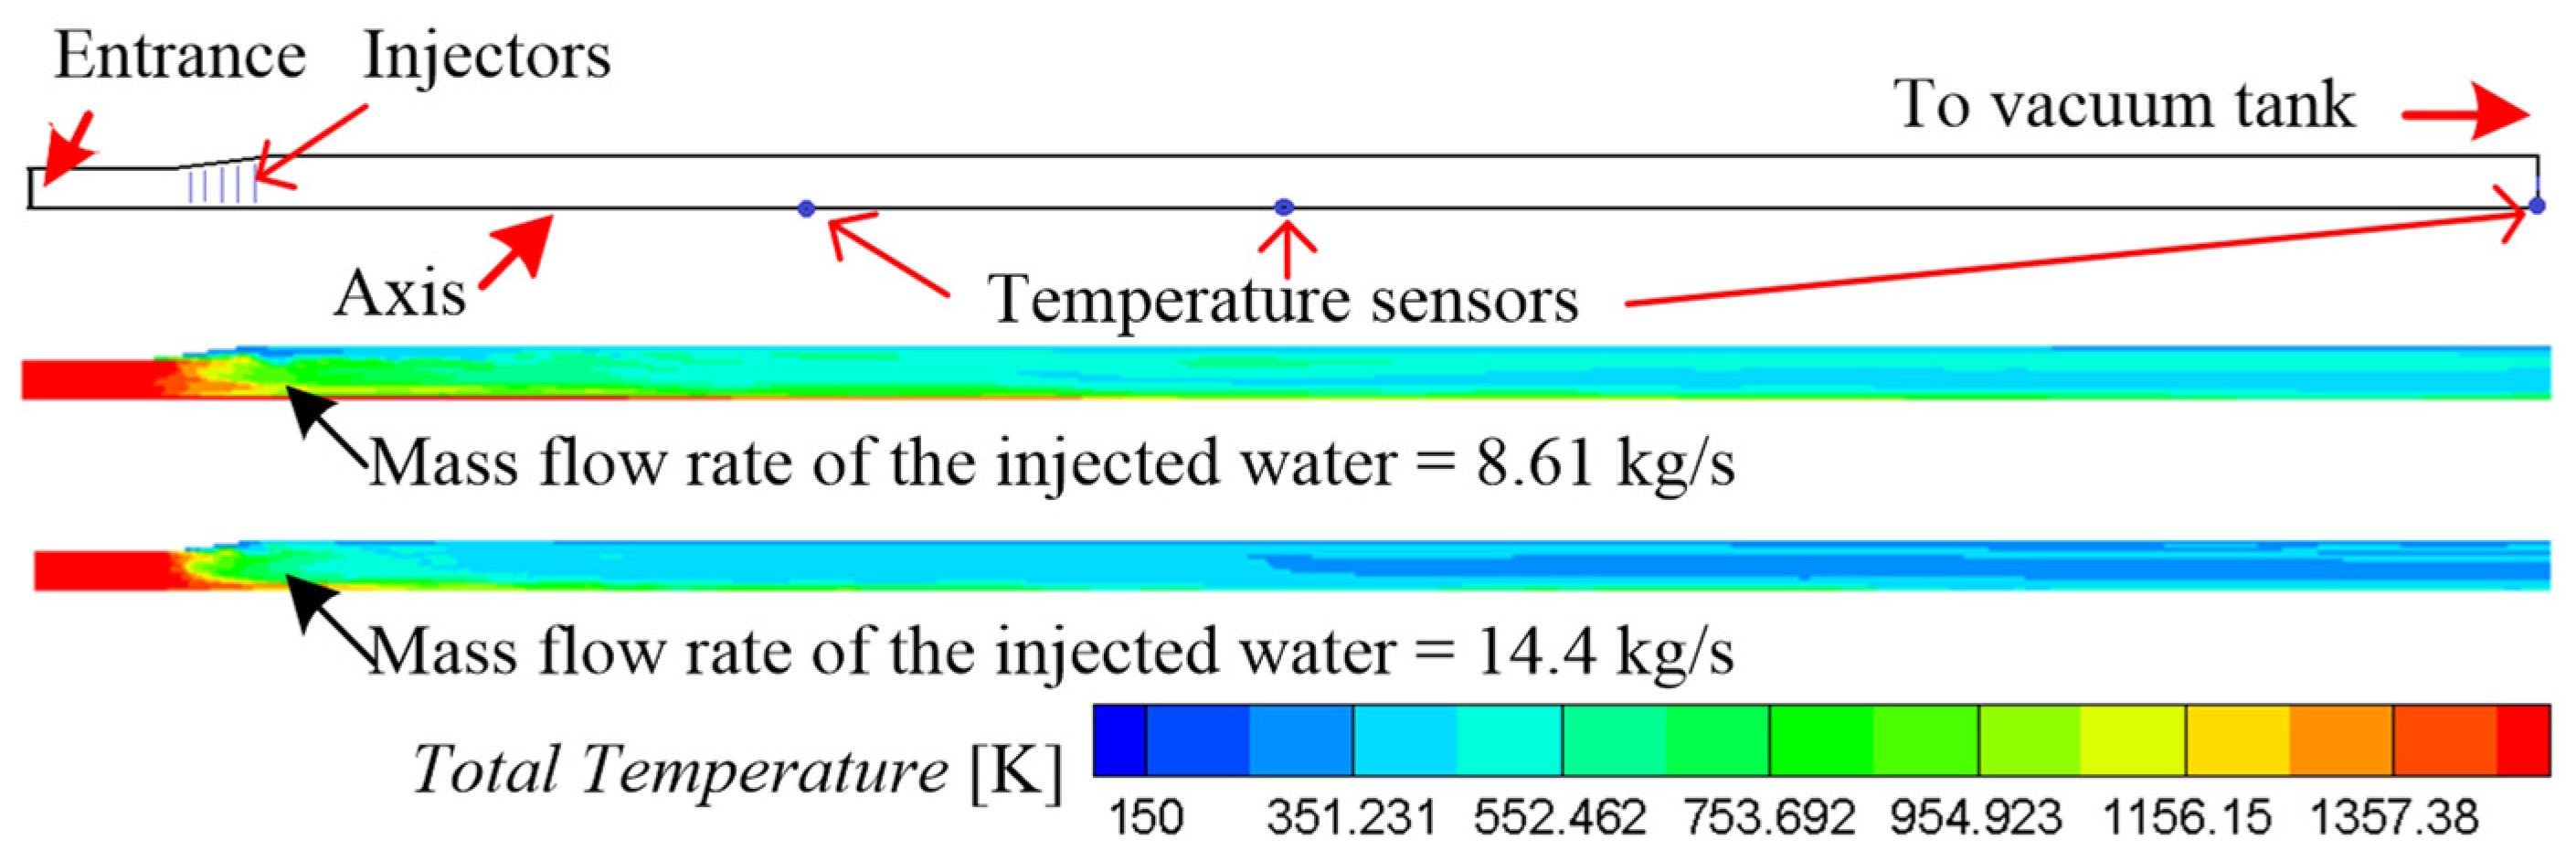
As shown in the upper part of Figure 9, the configuration of the experimental model was a diffuser of a pulse combustion wind tunnel. A bundle of injectors was assembled at the expanded section, as the blue lines show in the top left corner of Figure 9. The incoming fluid was subsonic gas with the total temperature of 1458 K. The mass flow rate of incoming gas was 15.44 kg/s. Pure water served as the coolant with mass flow rate of 8.61 kg/s and 14.4 kg/s, respectively. Several temperature sensors were mounted along the duct at central height, the blue spots show the locations of the temperature sensors in the upper region of Figure 9. The lower part of Figure 9 shows the numerical simulation results.
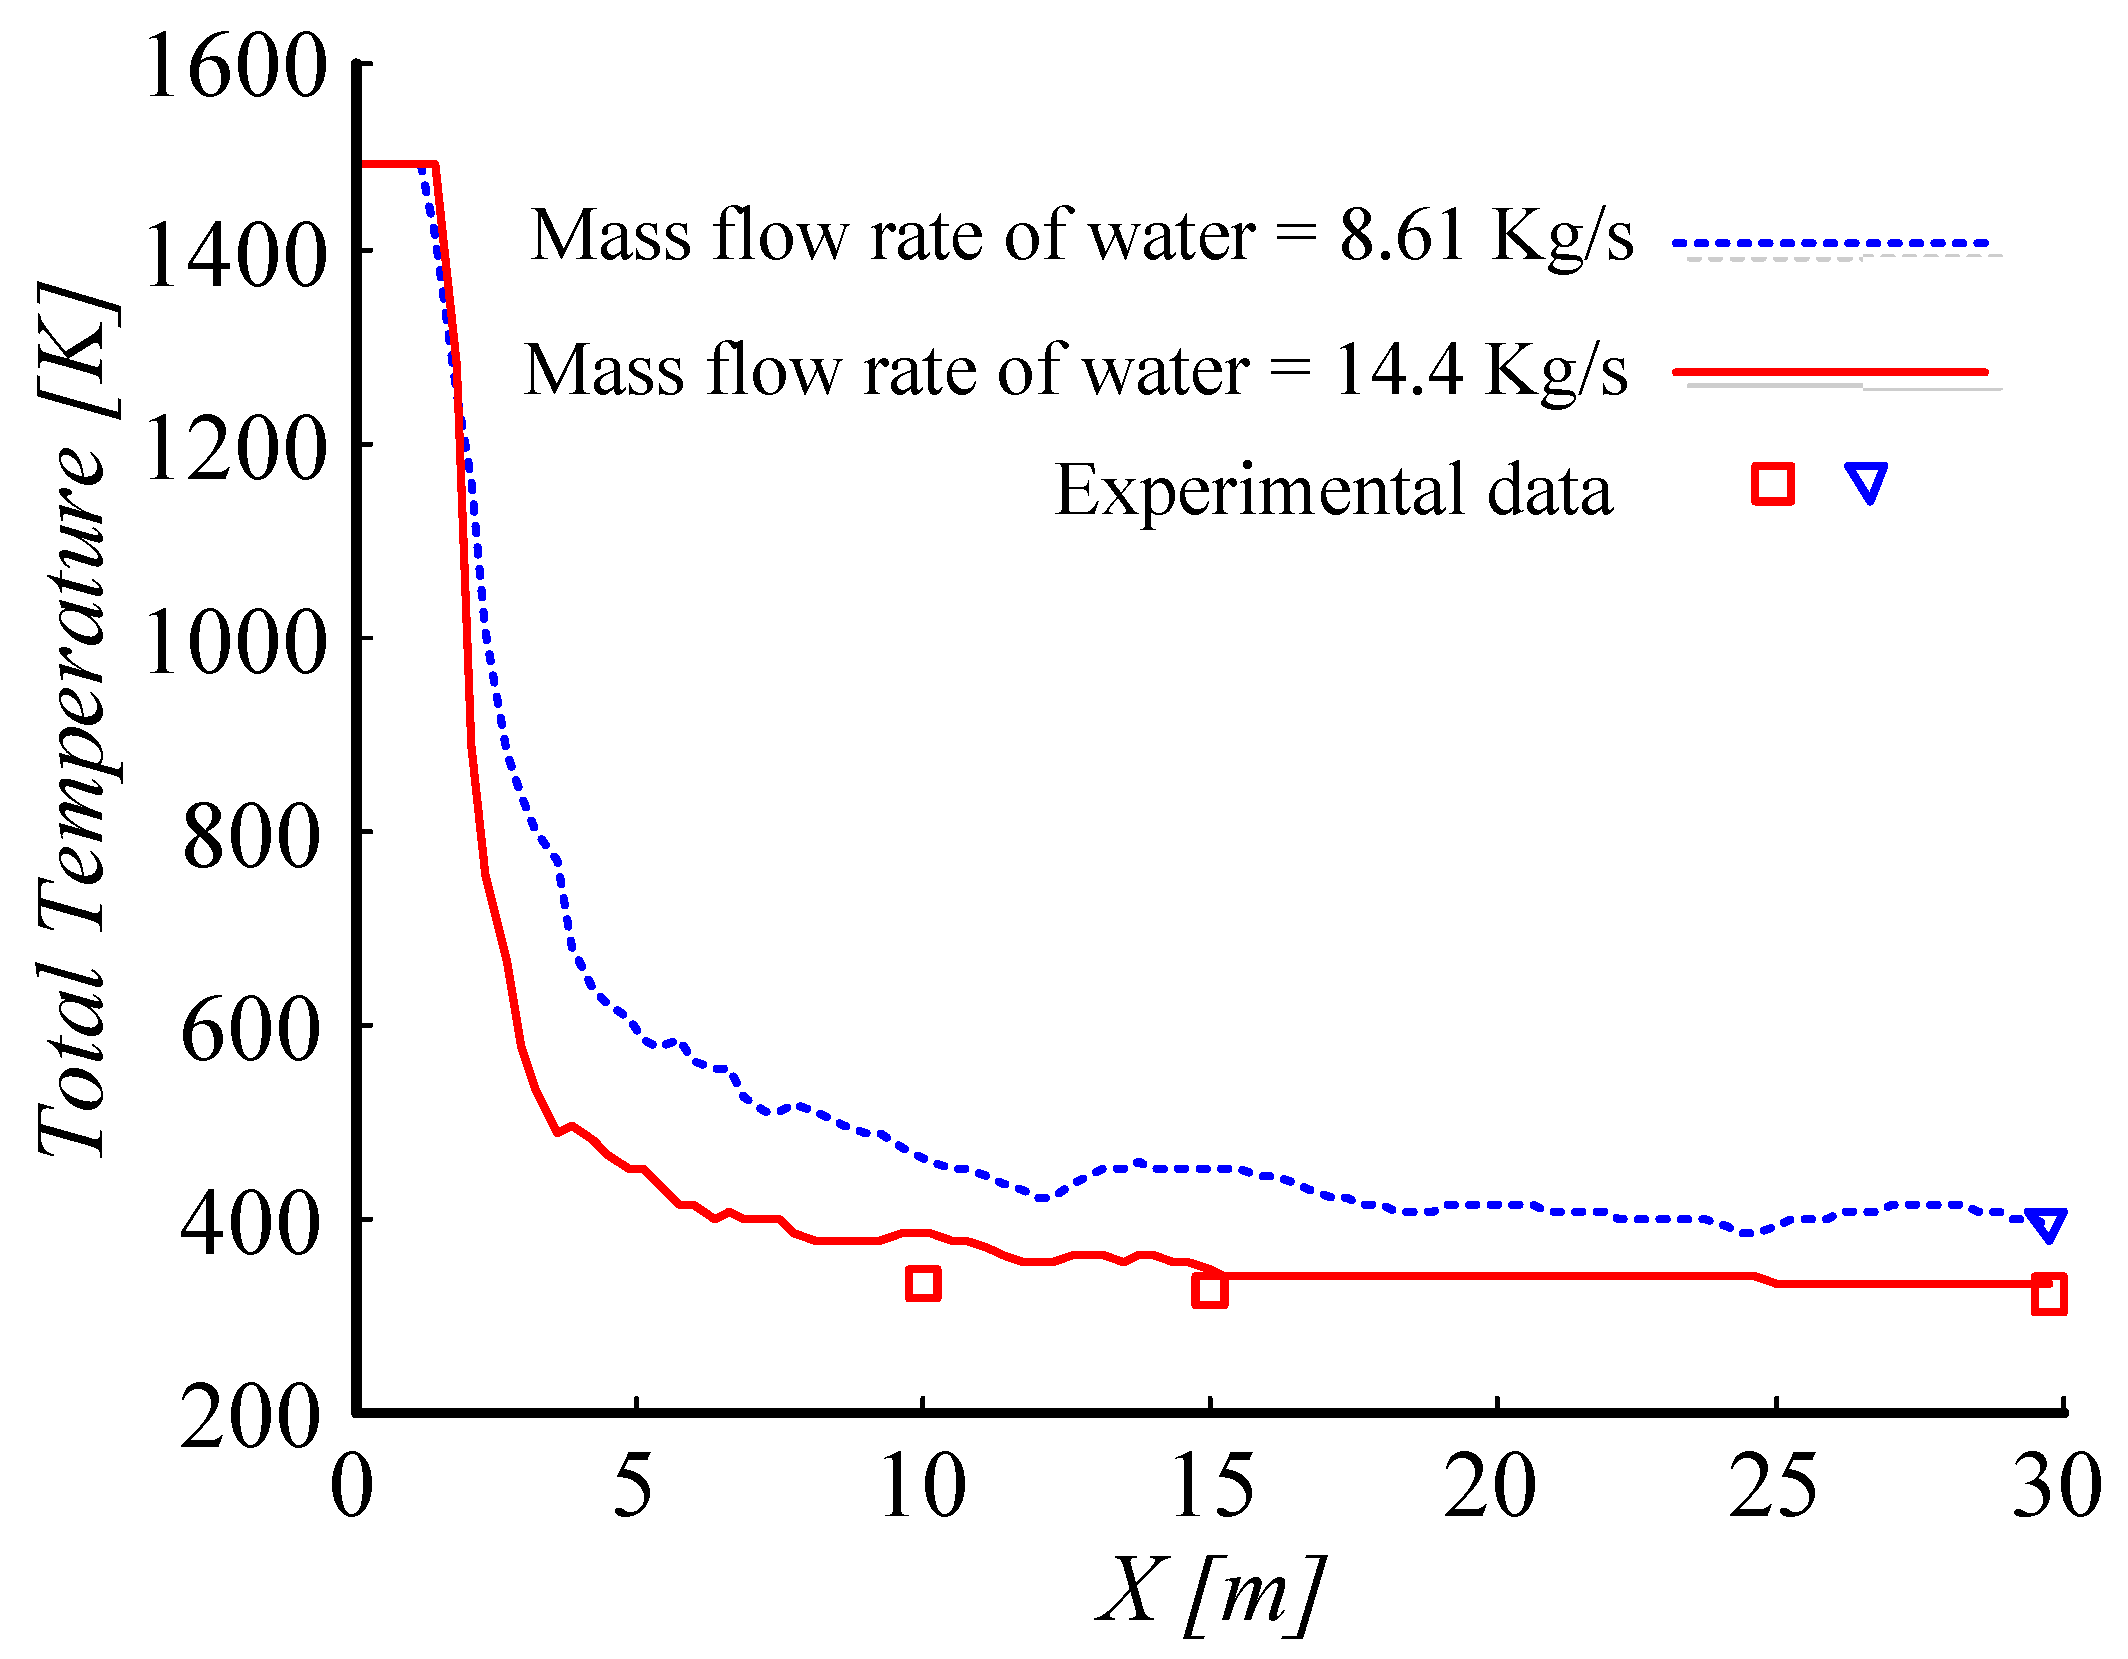
It can be seen from Figure 9 that the total temperature of the gas dropped sharply once the cooling water was injected into the diffuser, Figure 10 confirmed this phenomenon, which illustrated the variation of total temperature along the diffuser. The total temperature of the gas was cooled at lower than 500 K after X = 10 m, then the trend became gentle. It implied that the water droplets evaporated mainly in the first half of the diffuser, hence the gas was cooled efficiently, after that the temperature became slightly lower.
Figure 10 also compared the numerical results with the experimental data. The experimental total temperature at the tunnel exit was 406.2 K as the injected mass flow rate of the cooling water was 8.61 kg/s. While the injected mass flow rate of cooling water altered to 14.4 kg/s, the total temperature at the exit of the tunnel declined to 326.2 K. In contrast, the numerical results were 394.7 K and 336.9 K correspondingly. Good consistency could be observed from the comparison. The maximal relative deviation at the wind tunnel exit was lower than 3.5%.

4. Results and Discussions

4.1. Influence of Inlet Length on Evaporation Characteristics

The process of evaporation and pre-cooling are analyzed by taking Ma = 2.6 as an example. Figure 11 shows the contours of evaporation ratio at different sections with various water-to-air ratios (WAR), and the local evaporation ratio at equally spaced transverse sections with WAR = 0.03. Figure 12 shows the distribution of the corresponding total temperature at the same locations as Figure 11. We can see from Figure 11 that local evaporation ratio rises gradually along the inlet, while the droplets spread across almost the entire transverse section at X = 4 D and the gaseous water likewise evenly diffuses at the inlet exit (X = 10 D). This proves that the distribution of injectors is reasonable for the droplets to diffuse over the whole inlet. It can be seen from Figure 11 and Figure 12 that it requires a longer distance for higher WAR to achieve the same evaporation ratio, but the incoming high-temperature gas is cooled in a shorter distance. There is more vaporized water near the inlet wall, and the reason is that the air velocity near the wall is slower than the central area, therefore, temperature distortion is inevitable.
Figure 13a,b shows the distribution of the local evaporation ratio and the vaporized mass (half-model) of the injected water along the inlet at Ma2.6. The length of the inlet is 10 times the diameter of the inlet exit. As we can see, the local evaporation ratio increases slowly for each WAR, but the gradient of WAR = 0.03 is the steepest. When the WAR increases, the evaporation ratio becomes lower, and the highest evaporation ratio is 76.28% with WAR = 0.03 while the lowest evaporation ratio is 34.16% with WAR = 0.09. Although the evaporation ratio drops as WAR increases, the local vaporized mass of the injected water still increases slightly, as shown in Figure 13b. The local vaporized mass in this paper has been revised as a relevant nondimensional parameter. It can be seen in Figure 13b that the vaporized mass is rather close when the WAR alters from 0.05 to 0.09, which substantiates the notion that the amount of vaporized water that the incoming air could contain is limited under a specific condition, so it is not recommend to facilitate the vaporized mass only by increasing the WAR when the air is nearly in saturation state. Figure 13c indicates the variation of total temperature along the inlet, and Figure 13d indicates the cooled amplitude of the temperature along the inlet. According to the results from Figure 13c,d, we can conclude that higher WAR contributes to lower total temperature at the inlet exit, and the effect of WAR on the total temperature is more significant when WAR is lower than 0.05. The trend of the case that WAR = 0.03 is noticeable, which appears to be smooth while X position is greater than 6 D. This phenomenon implies that the latent heat of the droplets is nearly consumed up, hence the length of the inlet is not the dominant factor affecting the evaporation characteristics anymore. Nevertheless, prolonging the length of the inlet is still an available method for higher WAR to improve the evaporation ratio and boost the pre-cooling effect.
Detailed results regarding the evaporation characteristics versus the length of the inlet are plotted in Figure 14. Figure 14a shows the distribution of the evaporation ratio at the inlet exit versus the length of the inlet duct with WAR = 0.09 at different flight Mach number, and Figure 14b indicates the influence of the inlet length on the total temperature at the inlet exit. It is very clear that the evaporation ratio at the inlet exit is improved significantly when the inlet length is lengthened, for instance, the evaporation ratio with X = 10 D is nearly 2.5 times the evaporation ratio with X = 2 D and almost 2 times the evaporation ratio with X = 4 D. The temperature requirement of the low-pressure compressor for inlet length is analyzed in Figure 14b, where the limitation temperature that the low-pressure compressor can tolerate is assumed as 470 K. The incoming total temperature will reach 470 K as the flight Mach number reaches around Ma2.4 if no water is injected into the inlet, as shown by the dotted line AB in Figure 14b, thus prolonging the inlet length and injecting water which are demanded for pre-cooling the high-temperature gas. As we can see in Figure 14b, the flight Mach number is expanded to Ma2.56 with X = 2 D and WAR = 0.09. The dotted line BC in Figure 14b reveals that the inlet length must continue to be lengthened if the vehicle flies at a higher Mach number. When the inlet length is 10 times the diameter of the inlet exit, the vehicle is competent to fly at Ma3.0, as shown by point C in Figure 14b. The dotted line CD in Figure 14b shows the lowest total temperature at the inlet exit with X = 10 D and WAR = 0.09, this line determines the deepest pre-cooled temperature for the inlet.
Overall, in this section the evaporation and pre-cooling progress are revealed. The temperature range at the inlet exit with water-pre-cooling under the condition of different Mach numbers and inlet channel lengths is obtained. The water droplets demand at least X = 4 D to diffuse to all parts of the cross-section. The length of the inlet is supposed to be 10 times the diameter of inlet exit if the working point of the turbine engine reaches at Ma3.0.

4.2. Influence of WAR and Mach Number on Evaporation Characteristics

In order to analyze the optimal pre-cooling effect, all the numerical results in the following sections are extracted with X = 10 D.
The total temperature in the inlet varies with flight Mach number, which contributed to the discrepant evaporation ratio. Numerical simulations illustrate the contours of evaporation ratio and total temperature distribution at the inlet exit with WAR = 0.03 at different flight Mach numbers, as shown in Figure 15. When the flight Mach number is low, the evaporation ratio remains at a low level. However, when the flight Mach number transforms to Ma3.2, the evaporation ratio surges to 0.9 over the entire cross-section. Therefore, the injected water works more efficiently for higher flight Mach numbers. Although the evaporation ratio at the inlet exit grows gradually with the increase in the flight Mach number, the total temperature at the inlet exit increases slowly as usual.
Comprehensive results about the evaporation characteristics with regard to WAR are plotted in Figure 16, where Figure 16a presents the variation of the evaporation ratio at the inlet exit with different WAR, and the corresponding vaporized mass of the injected water is depicted in Figure 16b. The distribution of the total temperature with different WAR at different Mach numbers is shown in Figure 16c,d, which illustrates the distribution of the cooled temperature under the conditions of different WAR and Mach numbers. It can be concluded from Figure 16a,b that the evaporation ratio experiences a mild downward trend at any specific Mach numbers as WAR increases, the maximum evaporation ratio reaches 93% with WAR = 0.3 at Ma3.2, and the minimum evaporation ratio appears with WAR = 0.09 at Ma2.2. Figure 16a reveals that the vaporized mass does not persistently climb when the Mach number is lower than 2.6 after the WAR reaches 0.05. As for higher Mach numbers, the vaporized mass increases as usual until reaching the maximum amount of 1.93 times the characteristic mass with WAR = 0.09 at Ma3.2. The reason why the vaporized mass remains horizontal when Ma < 2.6 and WAR > 0.5 is that the air becomes saturated, unless there is an increase in the flight Mach number. The distribution of the total temperature at the inlet exit witnesses a similar trend with the vaporized mass, as shown in Figure 16c. It was obvious that the temperature trend in the case of Ma3.2 maintains downward, so we can infer that the total temperature would keep dropping if the inlet was injected with more water, and Figure 16d also validates this inference. The effect of WAR on the total temperature becomes quite slight when WAR is greater than 0.05 for lower Mach numbers, whereas the cooled temperature sustains an upward trend for higher Mach numbers, so the WAR can cool the incoming air as usual. The maximum cooled total temperature appears to be 167.5 K with WAR = 0.09 at Ma3.2.
Briefly, when the air is unsaturated, namely, when the flight Mach number is slower than 2.6 and WAR is lower than 0.05, the water-pre-cooling effect is proportional to WAR. More water will evaporate with the increase in flight Mach number. Water-pre-cooling works better at higher Mach numbers and higher WAR. The air can be cooled by 167.5 K at most.

4.3. The Performance of WIPCC Engine

The numerical results of the simulations are utilized to evaluate the performance of the WIPCC engine using the engine performance programs. Some momentous findings are obtained. Figure 17 illustrates the range of the total temperature before the compressor. Values of 470 K and 928 K are assumed as the limit temperature of the low-pressure compressor and the limit temperature at the last stage of the high-pressure compressor, respectively.
The trajectory line AB in Figure 17 shows the variation of the total temperature without any water injection before the compressor with the increase in the flight Mach number, as well as the total temperature before the low-pressure compressor reaches the maximum temperature that the low-pressure compressor can tolerate once the flight Mach number achieves at about Ma2.4. Then, more water injection is demanded to keep the total temperature before the low-pressure compressor at a constant value 470 K until WAR = 0.09. Moreover, the flight Mach number is extended to Ma3.0, as shown by the trajectory line BC in Figure 17. In fact, the vehicle cannot operate along the trajectory line BC, because the total temperature at the last stage of the high pressure has already exceeded the maximum temperature it can endure while the flight Mach number reaches about Ma2.3, so water injection must be carried out at Ma2.3. Then, a growing amount of the injected water is demanded when the flight Mach number increases to keep the total temperature at the last stage of the high-pressure compressor at a constant value of 928 K, and the trajectory line EC in Figure 17 shows this process. The maximal flight Mach number to which the WIPCC engine can be extended appears at Ma3.0 with WAR = 0.09, as shown by point C in Figure 17. Therefore, trajectory line A–E–C can be employed as the working boundary of the vehicle. Finally, the line CD shows the trajectory with highest WAR, namely, in which the total temperature of the pre-cooled gas is the lowest. As a result, the trajectory line A–E–C–D indicates the working boundary of the WIPCC engine.
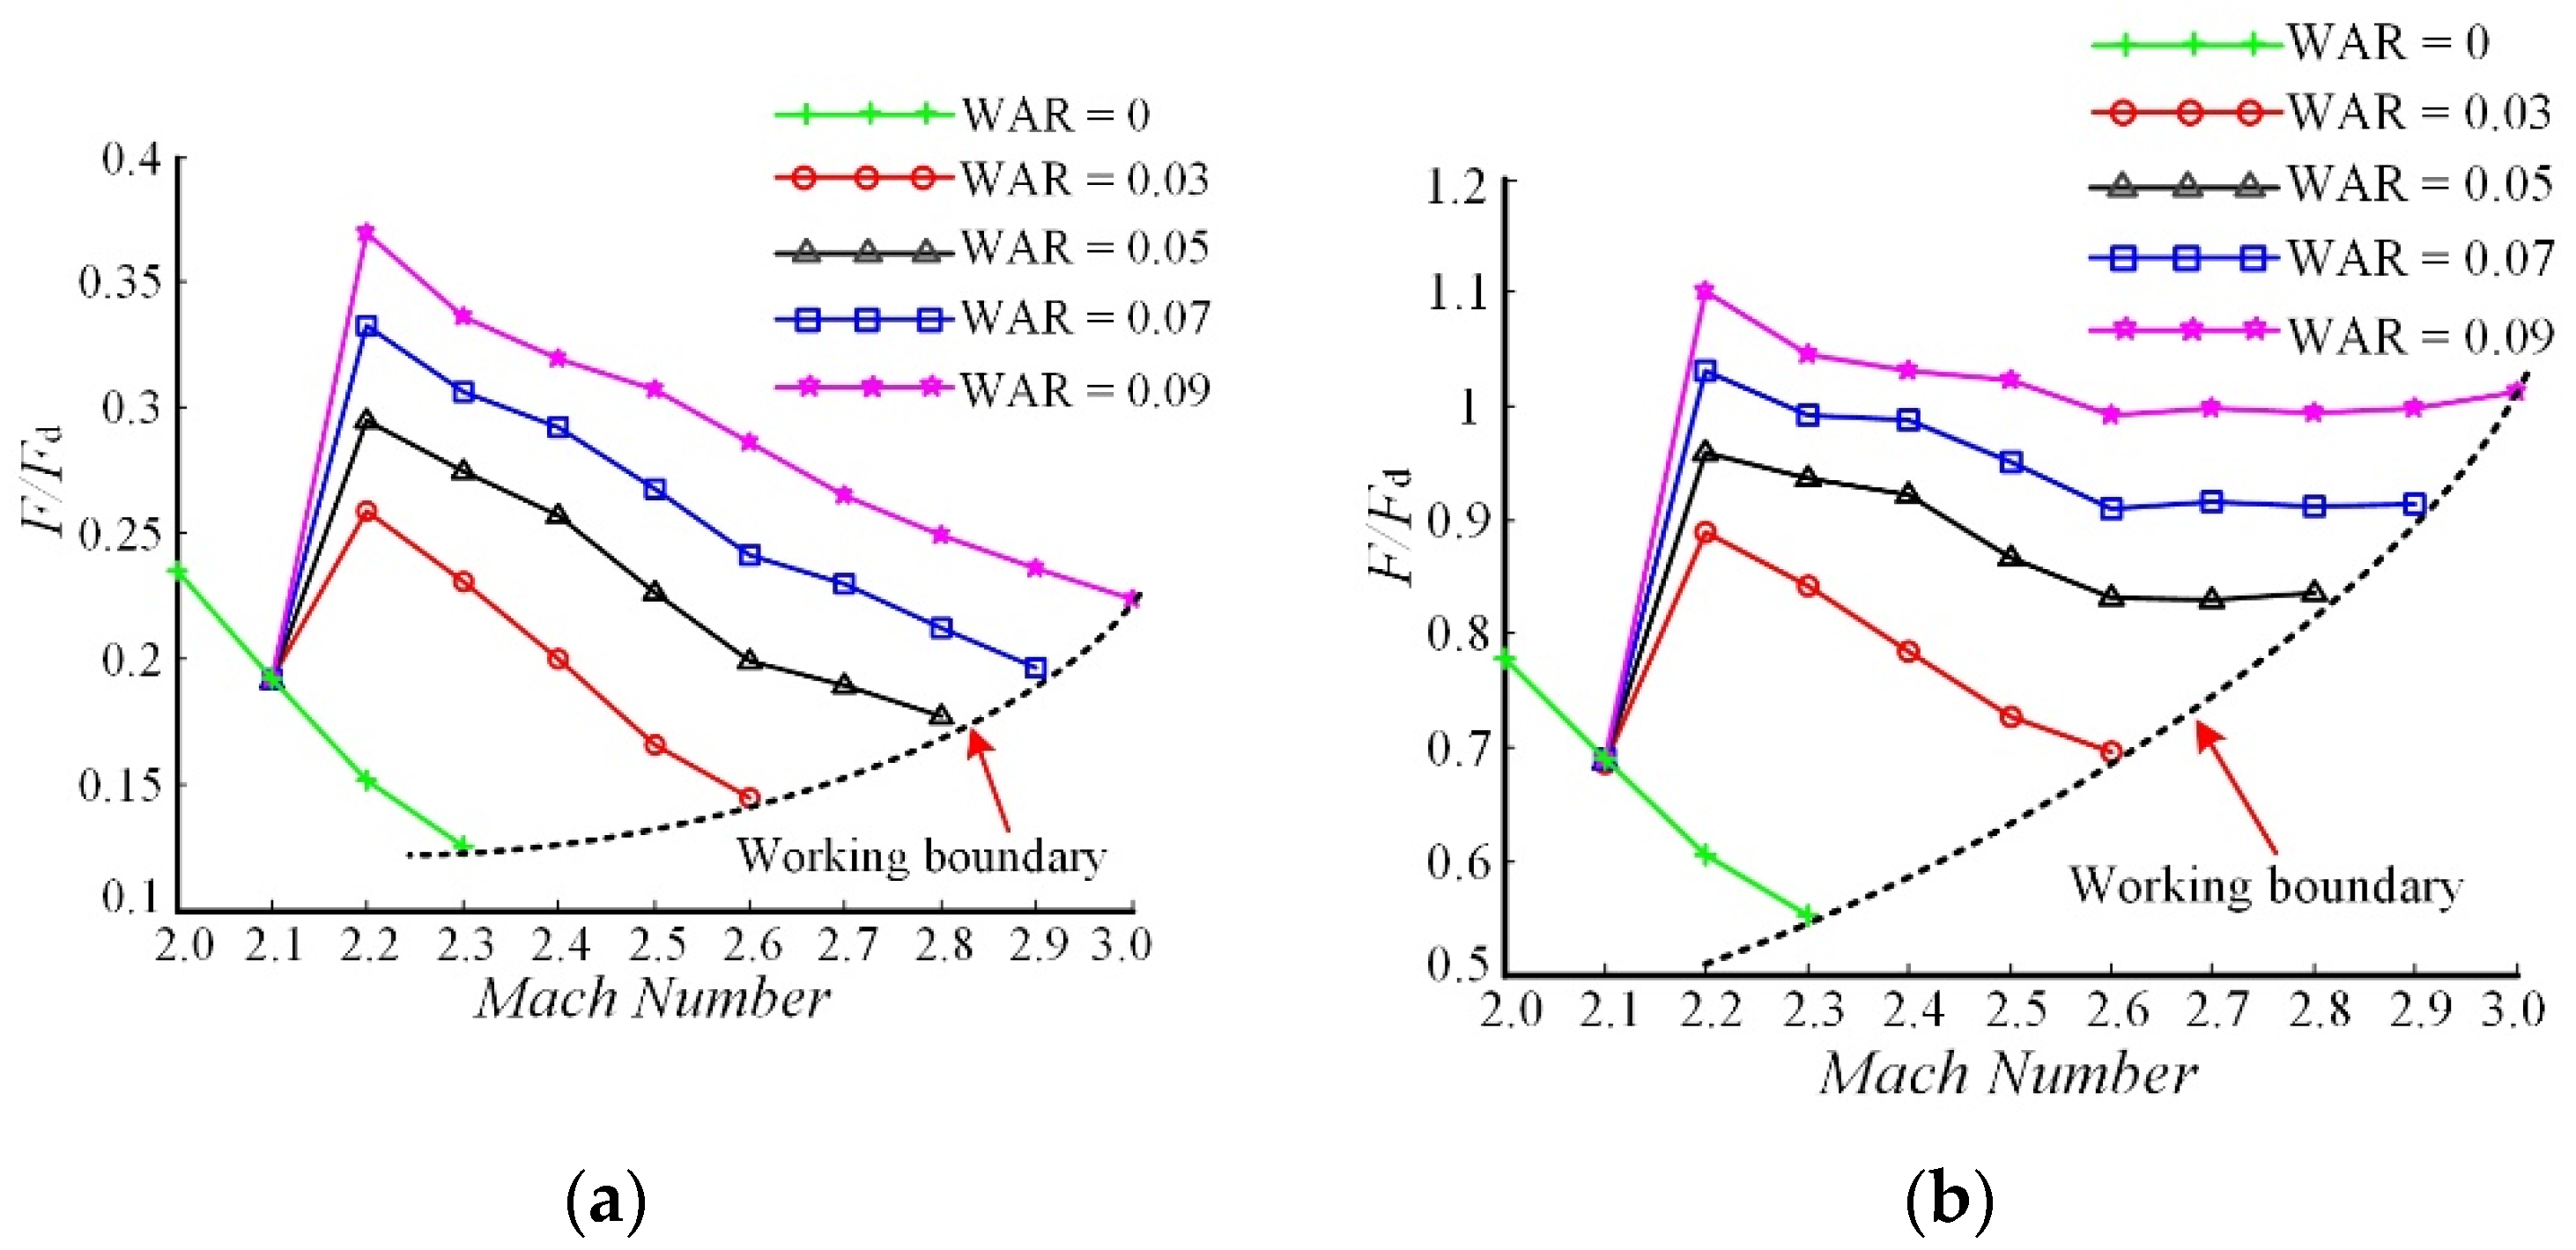
Figure 18 depicts the evaluation results of the WIPCC engine which operates by the trajectory that is shown in Figure 5, where Figure 18a indicates the variation of the turbine engine thrust without afterburning versus the flight Mach number, and Figure 18b indicates the variation of the turbine engine thrust with afterburning versus the flight Mach number. In order to compare the relative relation between the performance without afterburning and with afterburning, the thrust F d and specific impulse I sp _ d without afterburning and water injection at the designed point are employed as the characteristic values. The cooling water is injected from Ma2.2 to the working boundary of the engine. What can be found clearly is that the thrust is boosted dramatically once the incoming air is pre-cooled by the cooling water, and the thrust becomes higher with higher WAR. When the afterburner does not work, as shown in Figure 18a, the thrust with WAR = 0.09 is more than 2 times the thrust without water injection, the thrust is still far below the thrust requirement for TBCC mode transition. When the afterburner is working, the thrust with WAR ≥ 0.07 is improved to be at least 0.9 times the characteristic thrust, which could provide sufficient thrust for TBCC mode transition, as shown in Figure 18b. The maximum thrust can be improved to about 1.0 times the characteristic thrust. In addition, the flight Mach number can also be extended from approximately Ma2.3 to Ma3.0, which can meet the velocity requirement for ramjet initiation.
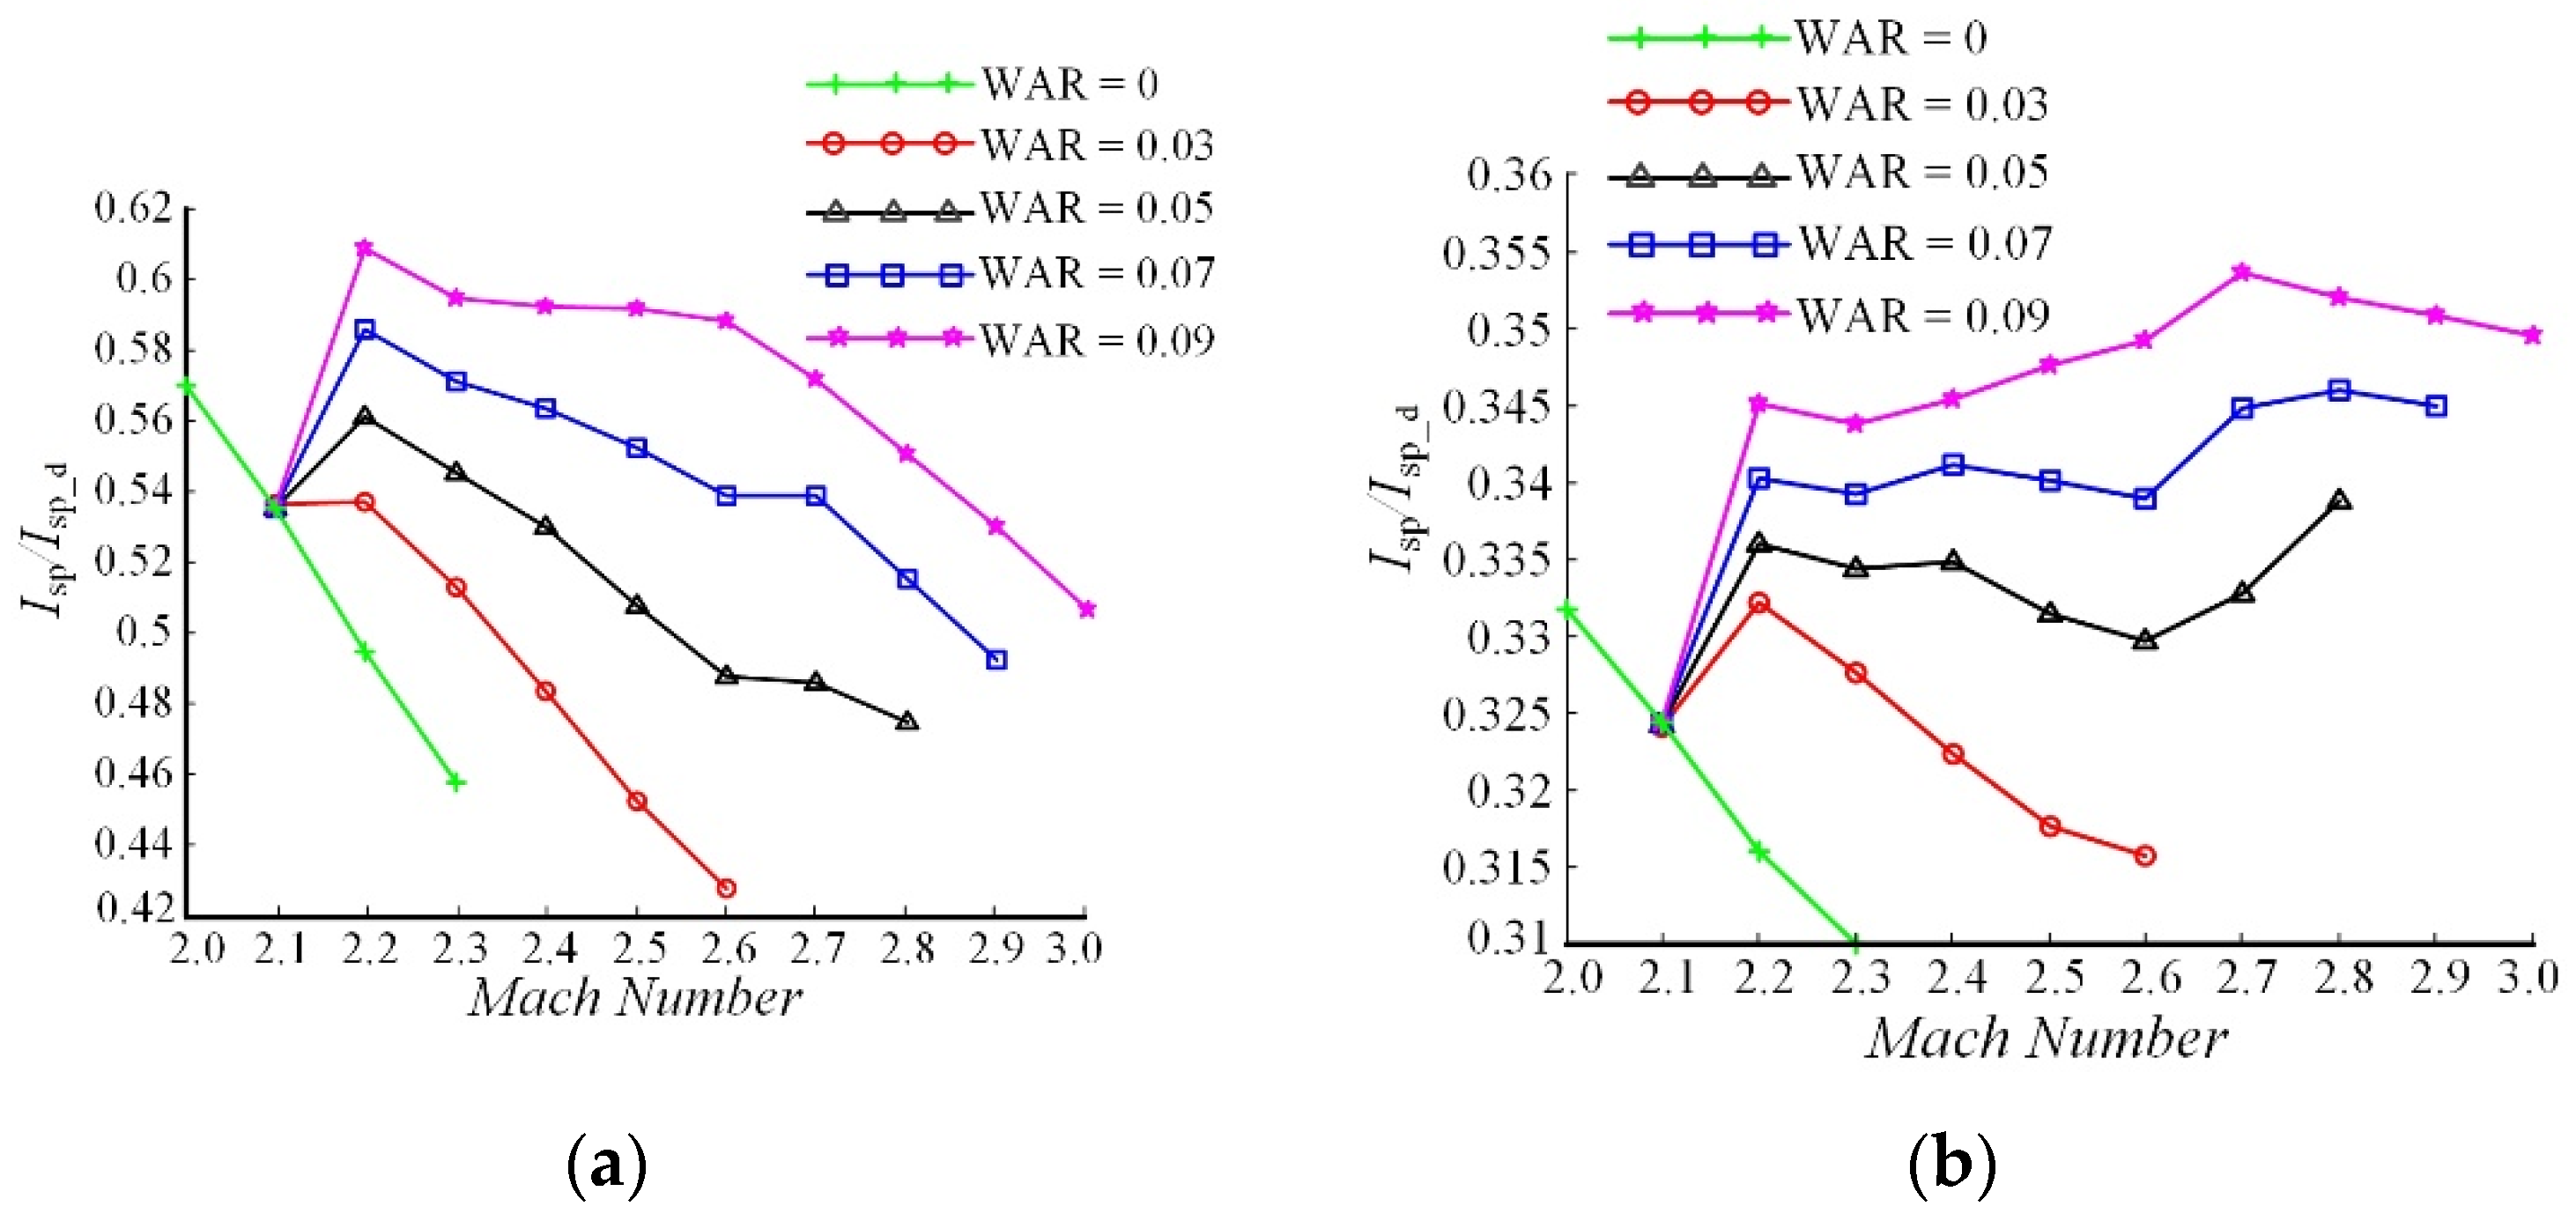
Improved performance of the WIPCC engine is calculated with afterburning, as shown in Figure 19. The specific impulse rises with the increase in WAR, which is more than 0.5 times the characteristic impulse as WAR ≥ 0.07, as shown in Figure 19a, and as a result it demonstrates that the WIPCC engine is competent to fly for a longer distance with the same amount of fuel. It can be concluded from Figure 19b that the WIPCC engine with afterburning has a lower specific impulse, but water injection will improve the specific impulse by about 10%, which implies that the WIPCC engine can provide more impulse for the TBCC with the same mass flow of fuel. Although the WIPCC engine can work at a high flight Mach number, the consumption of water is massive, and it will bring an increased load burden for the vehicle if required to cruise with water injection for a long time.
Overall, water injection promotes the comprehensive performance of the turbine engine, which is beneficial to TBCC mode transition.

5. Conclusions

According to the simulations regarding the WIPCC engine with a practical structure, the process of water-pre-cooling for the turbine inlet is revealed. The performance of the WIPCC engine is analyzed. The main conclusions are as follows:
(1)
It is the first time that the mass injection field of turbine inlet of the TBCC engine was simulated. The air can be cooled by 167.5 K with WAR = 0.09, and the water droplets can evaporate by 93% at most. The effect of water-pre-cooling in the TBCC turbine inlet is proportional to the injected water mass when the flight speed is slower than Ma2.8, more water will not strengthen the pre-cooling effect even if the WAR exceeds 0.05. This is because that the air becomes saturated. However, a higher flight Mach number can improve the saturation point. Prolonging the inlet length is a feasible approach to enhancing the pre-cooling effect if the evaporation ratio is low.
(2)
The interaction between the cooled temperature and WAR at different flight Mach numbers was revealed. The range of the pre-cooled temperature by water injection is obtained, which reveals the requirements of the water mass flow and inlet channel length under a certain temperature limitation of the compressor. Water injection must be performed when the flight Mach number exceeds Ma2.3. The highest working speed of the turbine engine can be extended to Ma2.6 with WAR = 0.03. When the mass flow of the water climbs to WAR = 0.09, the working speed spectrum of the turbine engine can be extended to Ma3.0, and the temperature of the air remains lower than 470 K under this condition.
(3)
Water injection not only extends the working speed spectrum of the conventional turbine engine, but also improves the engine thrust and specific impulse. The thrust can be augmented to nearly 1.0 times the characteristic thrust at Ma3.0 with WAR = 0.09, which meets the thrust requirement of mode transition of the TBCC engine. However, mass injection reduces the specific impulse of the turbine engine, especially at high flight Mach numbers. Therefore, it is recommended that the WIPCC engine work at a high speed for a long time, because it will consume much water.
(4)
The simulation results of the study contribute to the inlet design of the TBCC engine. Due to the fact that the physics model of the inlet is a practical model, it is beneficial engineering applications. The evaluation provides a mass injection strategy for the MIPCC engine, which can promote the advancement of the engine design.

Author Contributions

Data curation, S.H. and W.Z.; Formal analysis, J.L.; Investigation, J.L.; Methodology, J.L. and S.H.; Resources, Z.M.; Funding acquisition, S.H.; Software, J.L.; Validation, S.Y. and W.Z.; Visualization, S.H. and S.Y. All authors have read and agreed to the published version of the manuscript.

Funding

This work is supported by the National Natural Science Foundation of China (NSFC) (Nos. 52207179).

Data Availability Statement

Not applicable.

Conflicts of Interest

The authors declare no conflict of interest.

Nomenclature

TBCCTurbine-Based Combined Cycle
SLSSea Level Static
LOXLiquid Oxygen
MIPCCMass Injection Pre-Compressor Cooling
WIPCCWater Injection Pre-Compressor Cooling
WARWater-to-Air Ratio
MSTOMulti-Stage-to-Orbit

References

  1. Balepin, V. Method and Apparatus for Reducing the Temperature of Air Entering a Compressor of a Turbojet Engine by Variably Injecting Fluid into the Incoming Air. U.S. Patent 6,202,404, 20 March 2001. [Google Scholar]
  2. Mehta, U.; Bowles, J.; Melton, J. Water injection pre-compressor cooling assist space access. Aeronaut. J. 2015, 119, 145–171. [Google Scholar] [CrossRef] [Green Version]
  3. Xu, C.C.; Cho, H. Effect of methanol/water mixed fuel compound injection on engine combustion and emissions. Energies 2021, 14, 4491. [Google Scholar] [CrossRef]
  4. Balepin, V.; Bruno, C.; Ingenito, A. Evaluation of the combustion process in the mass injection precompression cooling engine. In Proceedings of the International Symposium on Air Breathing Engines, ISABE-2003-1127, Renaissance Cleveland Hotel, Cleveland, OH, USA, 31 August–5 September 2003. [Google Scholar]
  5. Kim, K.H.; Perez, B.H. An Assessment of High-Fogging Potential for Enhanced Compressor Performance. In Proceedings of the Turbo Expo: Power for Land, Sea, and Air, GT 2006-90482, Barcelona, Spain, 8–11 May 2006. [Google Scholar]
  6. Balepin, V.; Engers, R.; Terry, S. MIPCC technology development. ISABE-2005-1297. In Proceedings of the 12th AIAA International Space Planes and Hypersonic Systems and Technologies, Norfolk, Virginia, 15–19 December 2003. [Google Scholar]
  7. Cater, P.H.; Balepin, V. Mass injection and pre-compressor cooling engines analyses. In Proceedings of the 38th AIAA/ASME/SAE/ASEE Joint Propulsion Conference & Exhibit, AIAA-2002-4127, Indianapolis, IN, USA, 7–10 July 2002. [Google Scholar]
  8. Balepin, V.; Liston, G.W. The Steamjet: Mach 6+ turbine engine with inlet air conditioning. In Proceedings of the 37th Joint Propulsion Conference and Exhibit, AIAA-2001-3238, Salt Lake City, UT, USA, 8–11 July 2011. [Google Scholar]
  9. Lopata, J.; Carter, P. DARPA’s RASCAL: Status, challenges, and accomplishments. In Proceedings of the 18th Annual AIAA/USU Conference on Small Satellites, AIAA-SSC04-X-2, Logan, UT, USA, 9–12 August 2004. [Google Scholar]
  10. Carter, P.; Brown, O.; Rice, T.; Tardy, J. RASCAL: DARPA’s solution to responsive, affordable, micro-satellite space access. In Proceedings of the 17th Annual AIAA/USU Conference on Small Satellites, AIAA-SSC03-I-1, Logan, UT, USA, 11–14 August 2003. [Google Scholar]
  11. Young, D.A.; Olds, J.R. Responsive Access Small Cargo Affordable Launch (RASCAL) independent performance evaluation. In Proceedings of the AIAA/CIRA 13th International Space Planes and Hypersonics Systems and Technologies Conference, AIAA-2005-3241, Capua, Italy, 16–20 May 2005. [Google Scholar]
  12. Kloesel, K.; Clark, C. Preliminary MIPCC-Enhanced F-4 and F-15 performance characteristics for a first stage reusable launch vehicle. In Proceedings of the AIAA Space 2013 Conference and Exposition, AIAA-2013-5528, San Diego, CA, USA, 10–12 September 2013. [Google Scholar]
  13. Liang, Z.X.; Chen, Y.C.; Huang, X.L. Performance simulation of Steamjet with afterburner. J. Aerosp. Power 2010, 25, 1316–1321. [Google Scholar]
  14. Tu, H.Y.; Deng, Y.H.; Kang, S. Numerical simulation for effects for water/air ratio on injection characteristics with water injection pre-compressor cooling. J. Propuls. Technol. 2017, 38, 1302–1309. [Google Scholar]
  15. Liu, X.F.; Chang, H.W.; Xue, H.K. Investigation on temperature drop and flow resistance characteristics of mass injection pre-compressor cooling device. Aeroengine 2018, 44, 81–86. [Google Scholar]
  16. Lin, A.; Zhou, J.; Fawzy, H.; Zhang, H.; Zheng, Q. Evaluation of mass injection cooling on flow and heat transfer characteristics for high-temperature inlet air in a MIPCC engine. Int. J. Heat Mass Transf. 2019, 135, 620–630. [Google Scholar] [CrossRef]
  17. Lin, A.; Zheng, Q.; Jiang, Y.; Lin, X.; Zhang, H. Sensitivity of air/mist non-equilibrium phase transition cooling to transient characteristics in a compressor of gas turbine. Int. J. Heat Mass Transf. 2019, 137, 882–894. [Google Scholar] [CrossRef]
  18. Lin, A.; Zheng, Q.; Fawzy, H.; Luo, M.; Zhou, J.; Zhang, H. Effect of water injection cooling on flow field characteristics in the cooling section of precooled turbine-based combined cycle engine. Int. J. Heat Mass Transf. 2019, 141, 615–626. [Google Scholar] [CrossRef]
  19. Lin, A.; Liu, G.; Chen, Y.; Feng, Q.; Zhang, H. Evaluation and analysis of evaporation cooling on thermodynamic and pressure characteristics of intake air in a precooled turbine engine. Int. J. Hydrog. Energy 2021, 46, 24410–24424. [Google Scholar] [CrossRef]
  20. Lv, C.; Xu, H.; Quan, F.; Chang, J.; Yu, D. Thermodynamic modeling and analysis of ammonia injection pre-compressor cooling cycle: A novel scheme for high Mach number turbine engines. Energy Convers. Manag. 2022, 265, 115776. [Google Scholar] [CrossRef]
  21. Lv, C.; Xu, H.; Chang, J.; Wang, Y.; Chen, R.; Yu, D. Mode transition analysis of a turbine-based combined-cycle considering ammonia injection pre-compressor cooling and variable-geometry ram-combustor. Energy 2022, 261, 125324. [Google Scholar] [CrossRef]
  22. Mattingly, J.D.; Heiser, W.H.; Pratt, D.T. Aircraft Engine Design; AIAA Education Series; AIAA: Reston, VA, USA, 2002. [Google Scholar]
  23. Hill, P.G. Aerodynamic and thermodynamic effects of coolant injection on axial compressors. Aeronaut. Q. 1963, 14, 331–348. [Google Scholar] [CrossRef]
Figure 1. Configuration of an MIPCC engine.
Energies 15 07447 g001
Figure 2. The baseline of the TBCC inlet.
Energies 15 07447 g002
Figure 3. Half-model of turbine inlet channel from the TBCC inlet.
Energies 15 07447 g003
Figure 4. The schematic of the injector.
Energies 15 07447 g004
Figure 5. Trajectory of the TBCC vehicle.
Energies 15 07447 g005
Figure 6. Flow field of the practical TBCC turbine inlet.
Energies 15 07447 g006
Figure 7. Computational grid of turbine inlet.
Energies 15 07447 g007
Figure 8. The comparison of different grids.
Energies 15 07447 g008
Figure 9. The configuration the experimental model and the corresponding numerical results.
Energies 15 07447 g009
Figure 10. Comparison of total temperature between numerical and experimental data.
Energies 15 07447 g010
Figure 11. Local evaporation ratio at different sections.
Energies 15 07447 g011
Figure 12. Total temperature at different sections.
Energies 15 07447 g012
Figure 13. The evaporation and temperature along the inlet (a) local evaporation ratio, (b) local vaporized mass, (c) total temperature, (d) cooled total temperature.
Energies 15 07447 g013
Figure 14. Distribution of evaporation ratio and total temperature with different inlet length at different Mach number (a) evaporation ratio with WAR = 0.09, (b) total temperature of the air with WAR = 0.09.
Energies 15 07447 g014
Figure 15. Contours of total temperature and evaporation ratio at different Mach numbers.
Energies 15 07447 g015
Figure 16. Distribution of evaporation and temperature with respect to WAR and Mach number (a) evaporation ratio, (b) vaporized mass, (c) total temperature, (d) cooled total temperature.
Energies 15 07447 g016
Figure 17. The range of the total temperature before the compressor.
Energies 15 07447 g017
Figure 18. The thrust variation of the WIPCC engine (a) without afterburning, (b) with afterburning.
Energies 15 07447 g018
Figure 19. The specific impulse variation of the WIPCC engine (a) without afterburning, (b) with afterburning.
Energies 15 07447 g019
Table 1. Boundary condition for water injection simulations.
Flight Mach NumberCross-Section at Water InjectionInlet Channel Exit
Static Pressure
(kPa)
Total Temperature
(K)
Incoming
Mach Number
Static Pressure
(kPa)
Ma2.298.2426.20.541109.1
Ma2.4100.0466.40.559112.5
Ma2.6104.7509.50.5962119.1
Ma2.8109.4556.20.6326128.8
Ma3.0113.8606.50.669132.5
Ma3.2119.3662.70.710141.4
Publisher’s Note: MDPI stays neutral with regard to jurisdictional claims in published maps and institutional affiliations.