Article

Influence of Longitudinal Fin Tubes Arrangement in LNG Ambient Air Vaporizers on the Wind Load

1
Department of Machine Design and Composite Structures, Cracow University of Technology, ul. Warszawska 24, 31-155 Cracow, Poland
2
Department of Applied Informatics, Cracow University of Technology, ul. Warszawska 24, 31-155 Cracow, Poland
*
Author to whom correspondence should be addressed.
Energies 2022, 15(2), 405; https://doi.org/10.3390/en15020405
Submission received: 20 October 2021 / Revised: 17 November 2021 / Accepted: 23 December 2021 / Published: 6 January 2022
(This article belongs to the Special Issue Computational Thermal, Energy, and Environmental Engineering)

Abstract

:
The article presents the results of computational fluid dynamics (CFD) analysis of the wind action on liquefied natural gas (LNG) ambient air vaporizers (AAVs). A study concerning AAV with a 6 × 6 tubes array is presented to demonstrate how the distribution of longitudinal finned tubes and wind direction affect the average load and wind pressure acting on the vaporizer structure. The main goal of the study is to estimate the wind load on the structure and wind pressure on individual tubes depending on the pitch of the tubes arrangement. The above parameters are crucial for the strength analysis of the vaporizer structure. The derived analysis results provide important data on the variation of pressure on individual tubes, wind velocity inside AVV structure and indicate a significant increase in the average wind load acting on the structure for a wind direction of 45 degrees compared to a perpendicular direction.

1. Introduction

Global energy consumption has significantly increased in recent years. According to statistical data, the increase in demand is observed with respect to all energy sources. Natural gas and renewables are at the lead. However, the increase is especially noticed for natural gas (NG), which is considered as the cleanest fossil fuel [1]. There are huge reserves of natural gas in the world, which makes NG the most probable source of clean energy that can satisfy the long-term market demands. The production peak is expected to be around 2060, and about 2040 NG is predicted to replace oil as the most used energy source in the world [2]. Despite the fact that natural gas burning is not a non-carbon option of energy production, the emission of carbon dioxide is 25–30% less than for oil and 40–45% less than for coal. At the same time, the emission of nitrogen oxides and dust is significantly lower, while emission of sulphur dioxides is negligible. Moreover, compared to fossil fuels such as coal or oil, natural gas has a higher calorific value per cubic meter by 8000–8500 kcal, which is equivalent to 10 kWh of electricity [3]. Natural gas has become a popular fuel in electricity production processes with its relatively clean combustion. In industry, NG is used both as a fuel and a raw material in production processes. In residential sectors, NG is also used for heating of space and water as well as cooling by means of gas–powered air–condition systems. Also, in the transport sector, the share of natural gas vehicles (NVGs) powered by compressed natural gas (CNG) or LNG is increasing [4]. Natural gas can be delivered by pipelines, by sea and overland. As the costs of the pipelines increase with their length, this is not the most efficient method of delivering gas over long distances. Nowadays, the key technology for long distance delivery is LNG. The LNG supply chain consists of four main stages: exploration, extraction, liquefaction, transport, regasification and distribution [5]. During the liquefaction process, the natural gas is chilled to a temperature of about 160 °C below zero and a liquid state is obtained. It results in the volume reduction of about 600 times. Long–distance deliveries to LNG terminals are carried out by maritime transport involving large LNG carriers. In contrast, liquefied natural gas is delivered to end users overland in insulated LNG cryogenic tanks [6,7]. Regasification is required before final use of the gas. This stage is crucial in the energy conversion efficiency. In addition, it can be strongly influenced by geography and meteorology, which in turn determines the choice of technology [8,9,10]. Regasification is a process that requires energy input, namely heat. The more popular energy sources in heat exchange technologies include ambient air, sea water, cooling towers water, steam, electricity or combustion of gas itself. The use of ambient air as an energy source is of great interest because of its infinite free capacity, zero environmental impact and no operational complexity of devices [11].

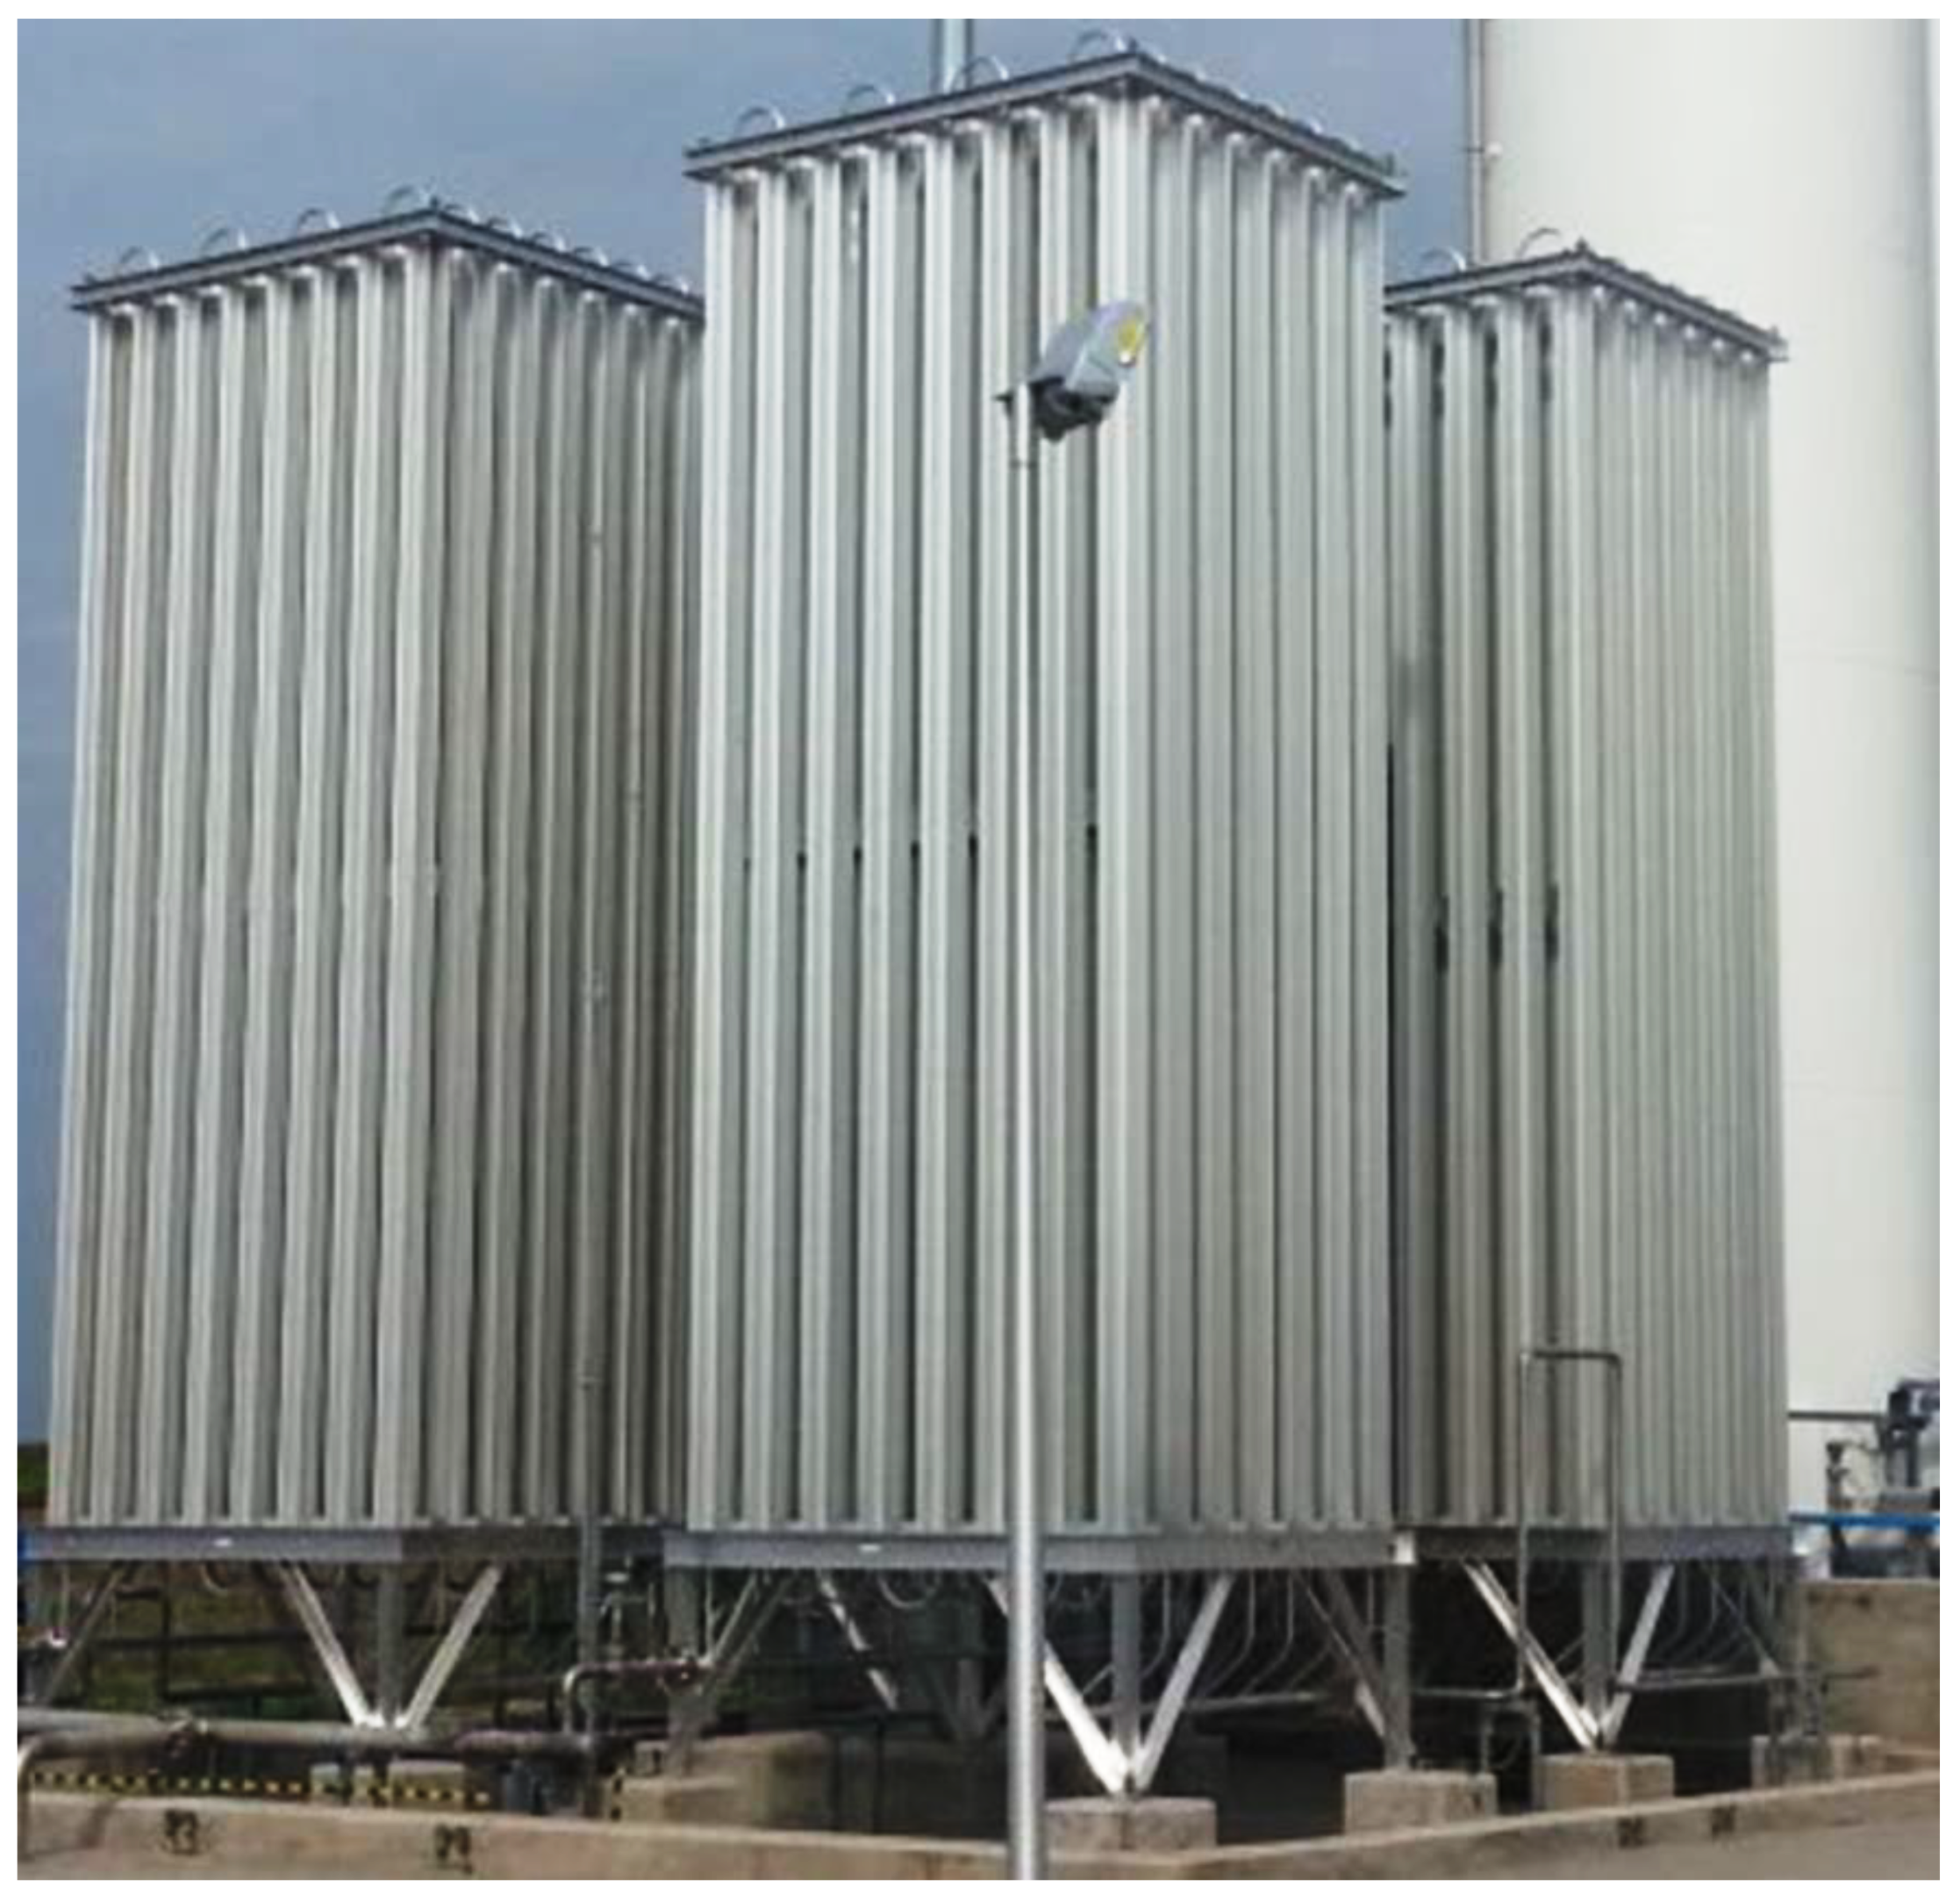
1.1. Ambient Air Vaporizers Design Issues

LNG ambient air vaporizers are usually designed for pressures up to 40 bars, that enable the use of aluminum alloys in their construction. A typical AAV structure contains a number of finned tubes arranged vertically in a matrix. LNG regasification stations can be operated with a single ambient air vaporizer or with a block consisting of several selectively operating units as shown in Figure 1.
Several problems related to ambient air vaporizers design were reported in previous publications. The studies on convective heat transfer coefficients and heat transfer in order to obtain optimal thermal performance were one of the essential design considerations. In 2009, Jeong et al. [12] presented an estimation of natural convection heat transfer coefficient for longitudinally finned tube based on CFD analysis. The flow of nitrogen was considered inside the tube while the heat source was ambient air. Based on the obtained results, the authors proposed a relation for the Nusselt number outside the tube. In turn, in 2019, Kopeć et al. [13] presented the results of an experimental study on heat transfer coefficients on the outer surface of longitudinal finned tube under natural and forced convection conditions. An aluminum tube with eight longitudinal fins was analyzed. In addition, fin efficiency was verified using CFD analysis. In 2018, Sun et al. [14] analyzed the heat transfer between ambient air and LNG under supercritical pressure conditions. Heat transfer performance of AVV and optimal fin configurations were investigated based on the CFD modelling. In 2018, Lee et al. [15] presented the methodology of designing ambient air vaporizers including time-series weather conditions. The proposed method included temperature and humidity fluctuations and was used for the AVV optimization considering weather conditions within a one-year period.
Another problem raised by the authors was the formation of frost during the operation of ambient air vaporizers. In 1997, Lee et al. [16] delivered a one-dimensional analytical model of frost formation on a cold, flat surface. The model was developed taking into account the molecular diffusion of water and vapor as well as heat generation by sublimation from the frost layer. The analytical model was validated by experiment. In 2006, Jeong et al. [17] presented the research on optimal geometry of longitudinal finned tubes. Such parameters of fins as number, height and thickness were considered. The numerical results were compared with experiential tests. As a result of the analysis, the optimal dimensions of fins were proposed due to heat exchange with and without the deposited frost. In contrast, in 2013, Chen et al. [18] presented the analysis of thermal conductivity of frost within the finned tube applying the fractal method. It was proved that the thermal conductivity of the frost determined by this method coincided with the experimental values. In contrast, research by Kuang et al. (2015) [19], Liu et al. (2016) [20], Liu et al. (2017) [21], Lee et al. (2018) [22] and Liu et al. (2020) [23] referred to analyses of the ambient air vaporizers operation including frosting conditions and their influence on AVVs thermal performance. In turn, the formation of the fog clouds around ambient air vaporizers was analyzed by Gavelli in 2010 [24]. CFD modelling was involved to predict the formation and dispersion of the fog clouds caused by operation of the array of six AVVs.
Depending on the required efficiency, AVV arrays can reach up to a dozen meters in height. Ambient air vaporizers placed in an open space are exposed to wind. Air circulation has a positive impact on heat exchange with the environment. On the other hand, especially in large vaporizers, the wind can cause significant structural loads depending on its speed. This paper presents one more design problem related to ambient air vaporizers, which is the wind action on the structure. CFD modelling was applied to analyze the average wind load and pressure on longitudinal finned tubes of the LNG ambient air vaporizer. The distribution of longitudinal finned tubes and the effect of wind direction were studied on example of ambient air vaporizer with 6 × 6 tubes array.

1.2. The Object of Study

For the construction of LNG ambient air vaporizers, manufacturers propose aluminum profiles with longitudinally extruded fins. Typical longitudinal finned tubes for AAV applications have usually from 2 to 16 fins. Technologies for manufacturing extruded aluminum tubes make it possible to produce fins with a radius several times greater than the diameter of the central pipe. With the central pipe diameter of 30 mm, the span of the fins can reach up to 200 mm. Thus, a single fin with a length of several meters has a large surface area. This area is advantageous for heat transfer, which is a key issue for vaporizers design. However, it is also a significant surface area that can be affected by wind. For the purposes of the analysis in this study, tubes with a central pipe diameter of 30 mm and external dimensions of 175 mm × 175 mm were accepted as shown in Figure 2. AVVs arrays of 6 × 6 longitudinal finned tubes equally spaced with pitch s = {200, 350, 500} mm were considered.

2. CFD Analysis of Air Flow

CFD analysis of wind action on the structure of ambient air vaporizer was carried out using ANSYS/Fluent software. In order to carry out the analysis, the type of flow had to be specified. For the air flow through the ambient air vaporizer structure, there are no conditions for the laminar flow to occur due to the geometry of the longitudinal finned tubes. Therefore, the standard k-ε turbulence model of flow was accepted in the simulations. The kinetic energy of the turbulence and dissipation factor were computed on the basis of the transport Equations (1) and (2).
( ρ k ) t + ( ρ k u i ) x i = x j [ ( μ + μ t σ k ) k x j ] + G k + G b ρ ε Y M + S k
( ρ ε ) t + ( ρ ε u i ) x i = x j [ ( μ + μ t σ k ) ε x j ] + C 1 ε ε k ( G k + C 3 ε G b ) C 2 ε ρ ε 2 k + S ε
where Gk is the increase in the kinetic energy of turbulence caused by gradient of average velocities, Gb stands for the energy generated by the phenomenon of buoyancy, Ym is the energy associated with the fluid compressibility. C1ε, C2ε and C3ε are constants of the model, whereas Sk, Sε are respectively the turbulent Prandtl numbers. The turbulence specificity is determined by the parameters given by Equations (3)–(5), which are: intensity I, length scale l and turbulent velocity μt.
I = 0.16 · R e 0.125
l = 0.07 · D H
μ t = ρ · C μ · k 2 · ε 1
where Re is Reynolds number, ρ stands for fluid density and DH is relevant hydraulic diameter. The model constants were accepted using values recommended by ANSYS [25]: C1ε = 1.44, C2ε = 1.92, Cμ = 0.09, σk = 1.0 and σε = 1.3.

2.1. Discrete Model and Analysis Assumptions

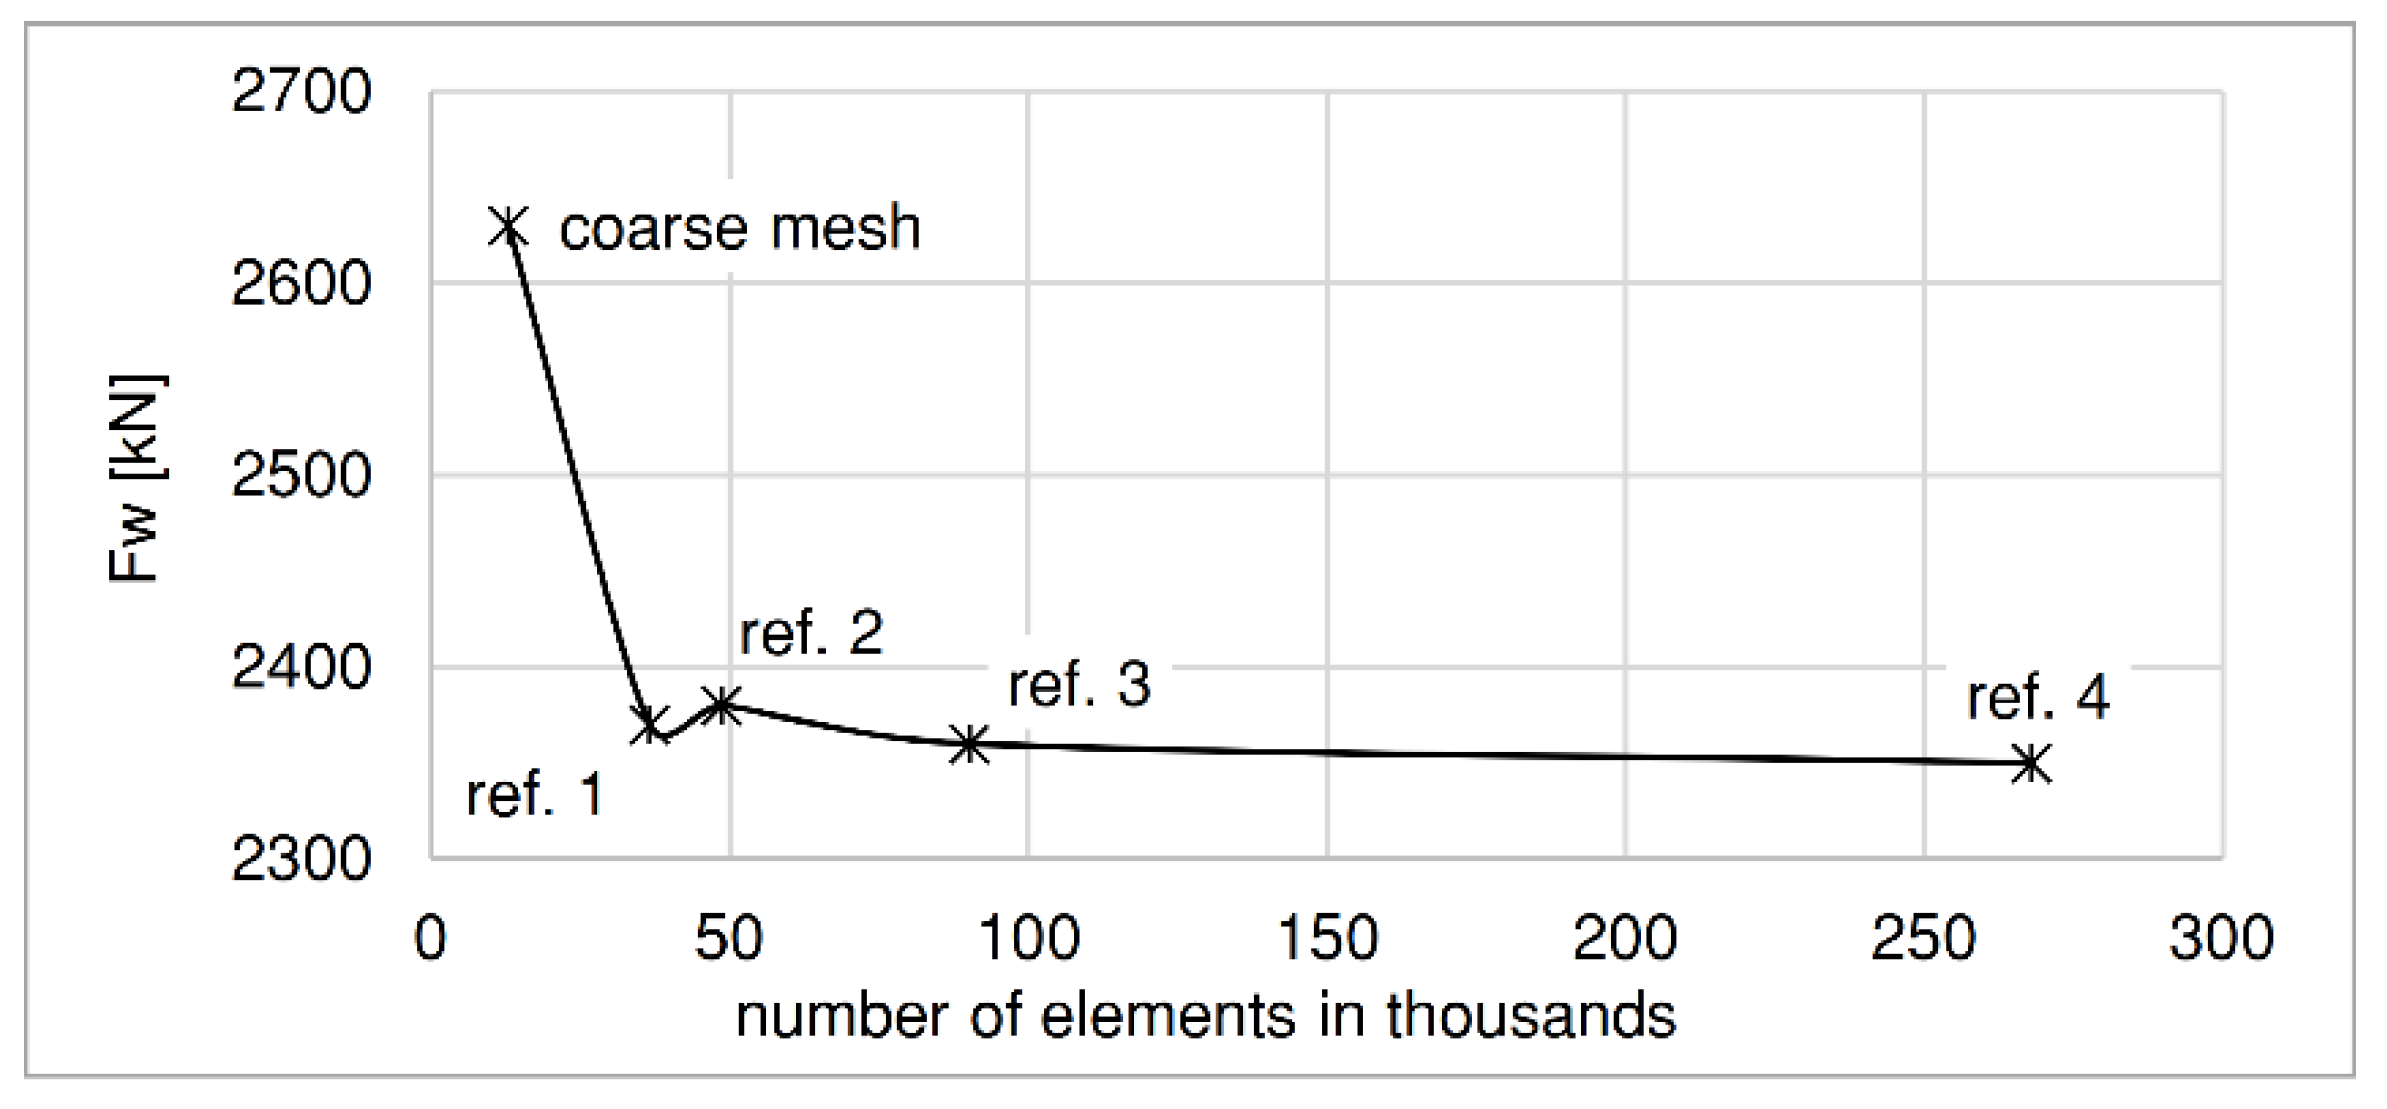
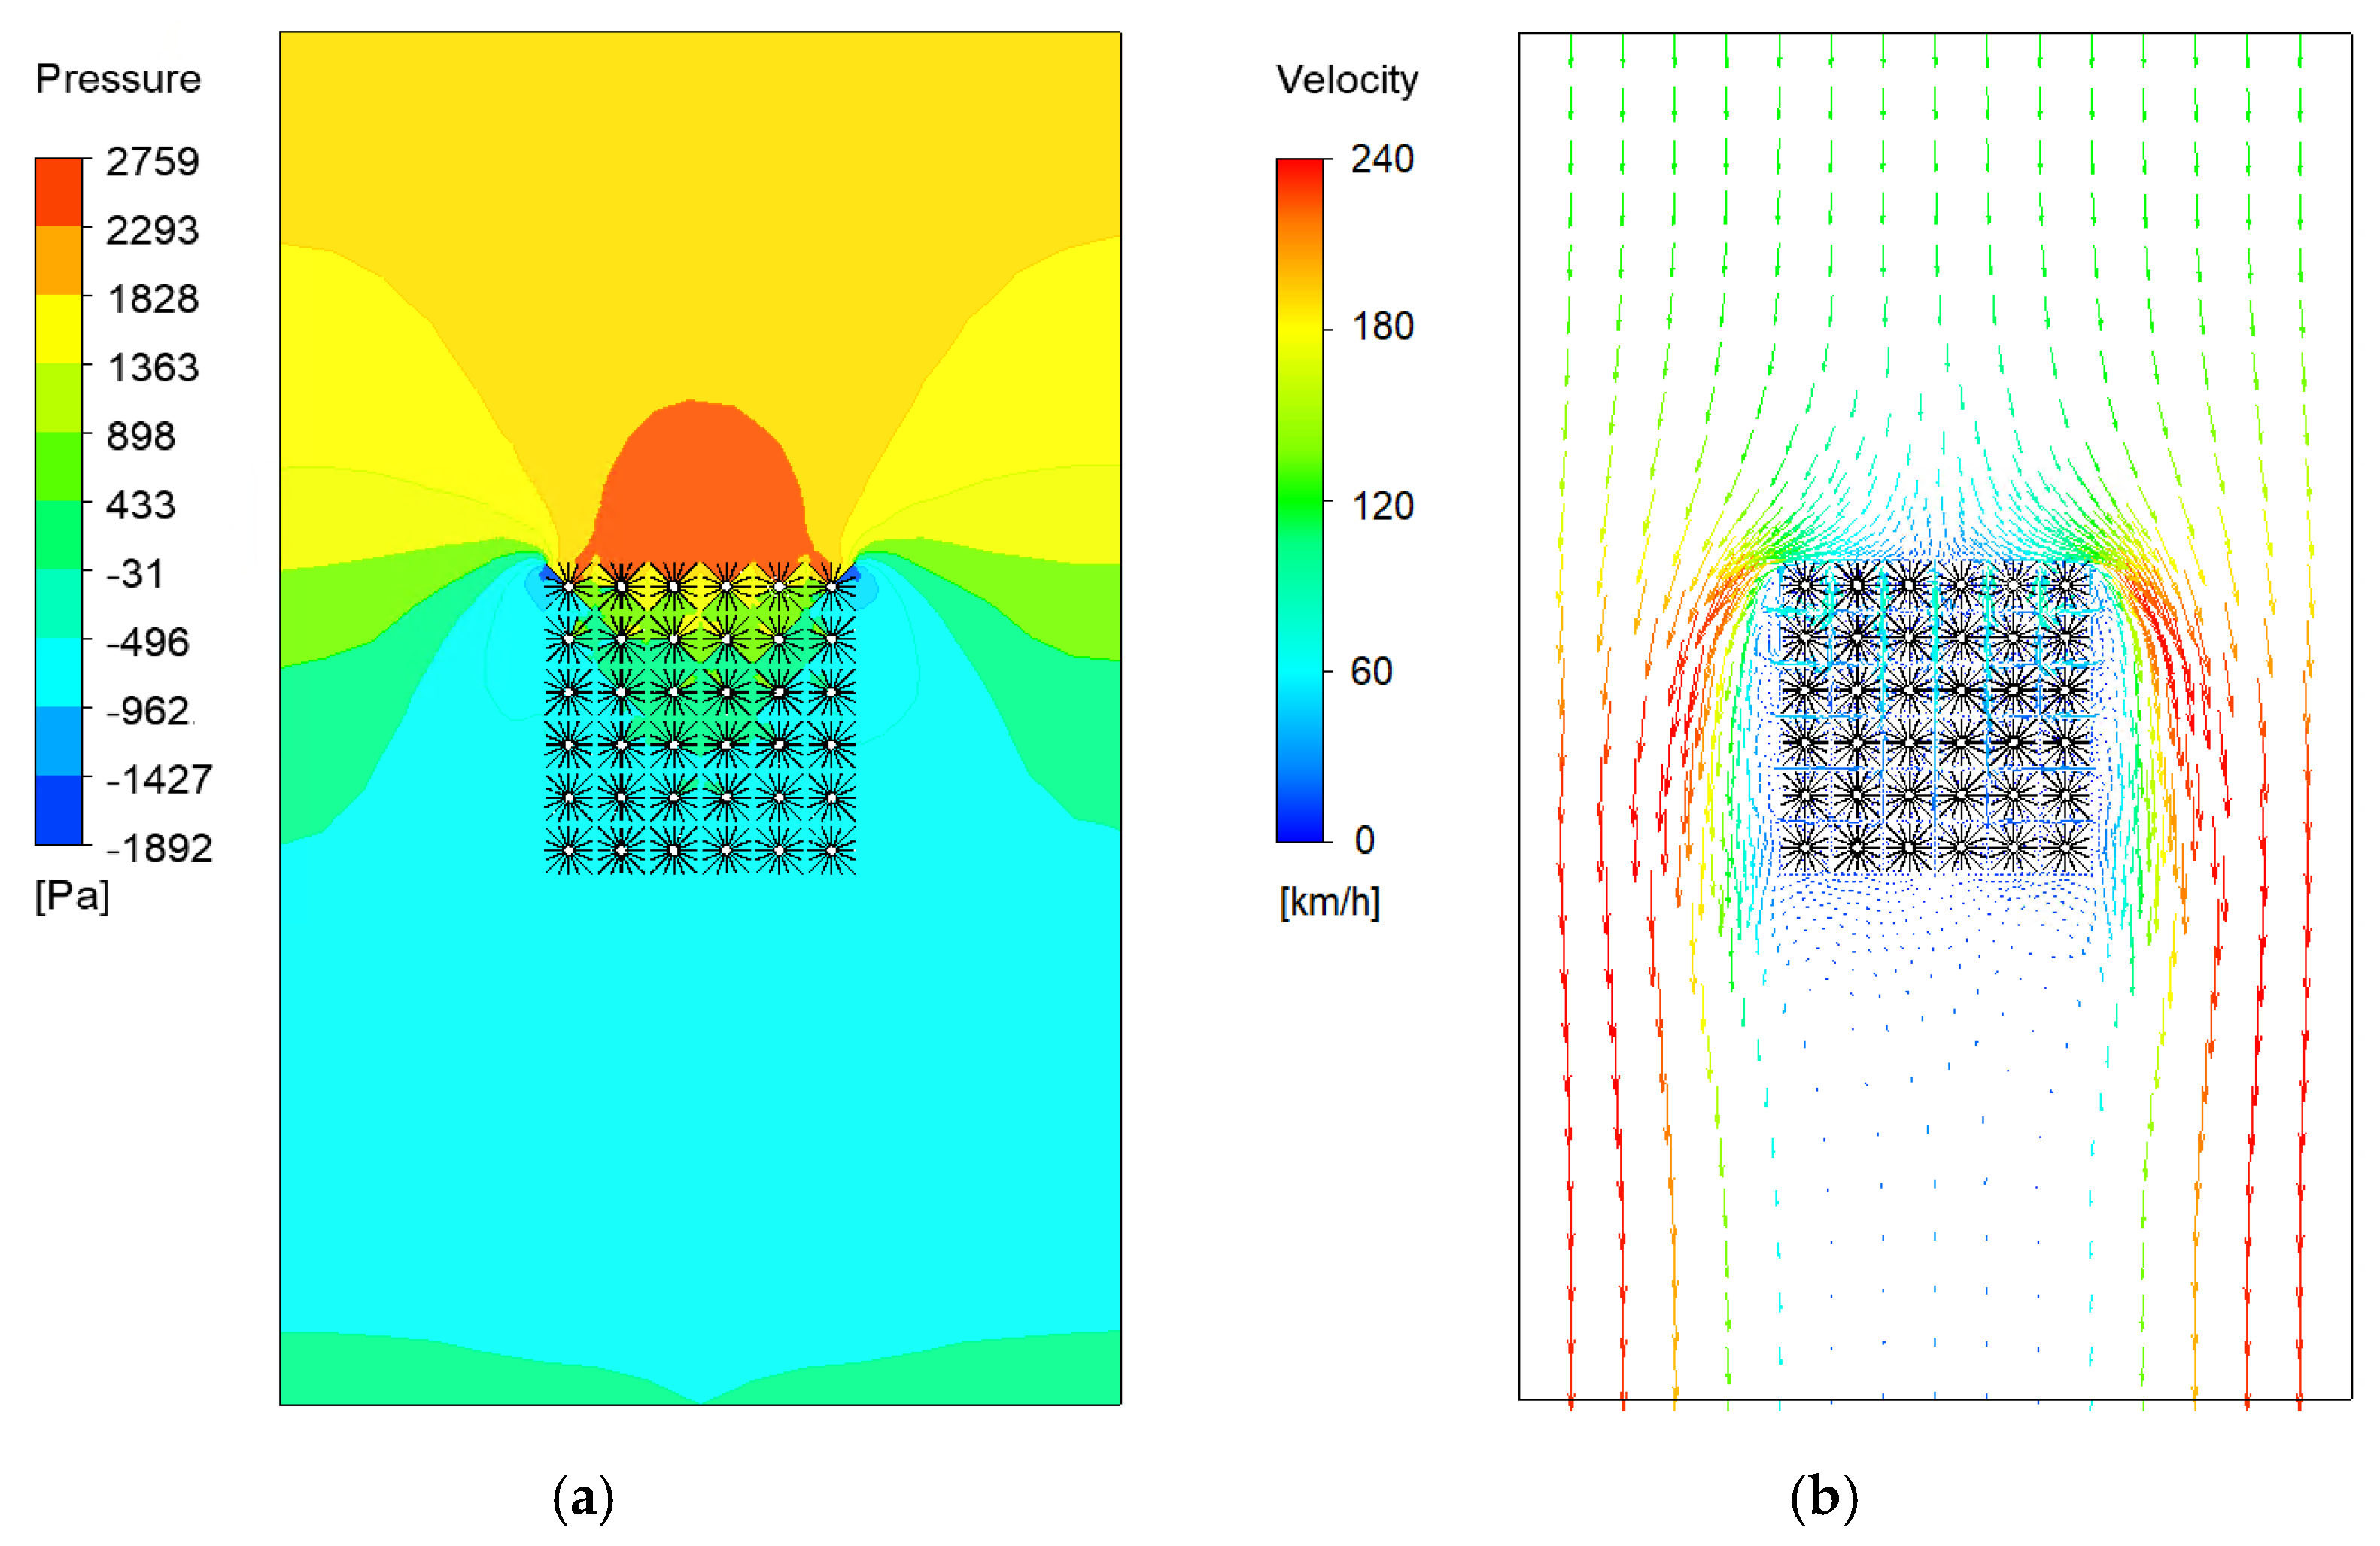
  • Considering that the wind velocity component in front of the vaporizer has only one flow direction and two flow directions within the vaporizer structure, the use of the 2D model was sufficient for the considered problem. The models were prepared for analyses including wind directions α of 90° and 45°. Discrete models with boundary condition for the example of the vaporizer with tubes distribution pitch of 350 mm and wind directions of 90° and 45° are shown in Figure 3, where vinlet is the wind velocity and patm stands for atmospheric pressure. Dimensions in Figure 3 are in mm. The mesh independence test was performed at the preliminary study. The results of mesh independence test for the example of the vaporizer with tubes distribution pitch of 350 mm, wind directions of 90° and wind speed of 120 km/h are shown in Figure 4.
It could be noticed that a convergent solution was obtained for the third mesh refinement (ref. 3) with respect to the initial coarse mesh. The same level of mesh refinement was applied consistently in all the other analyses.
The following assumptions were accepted for CFD analysis:
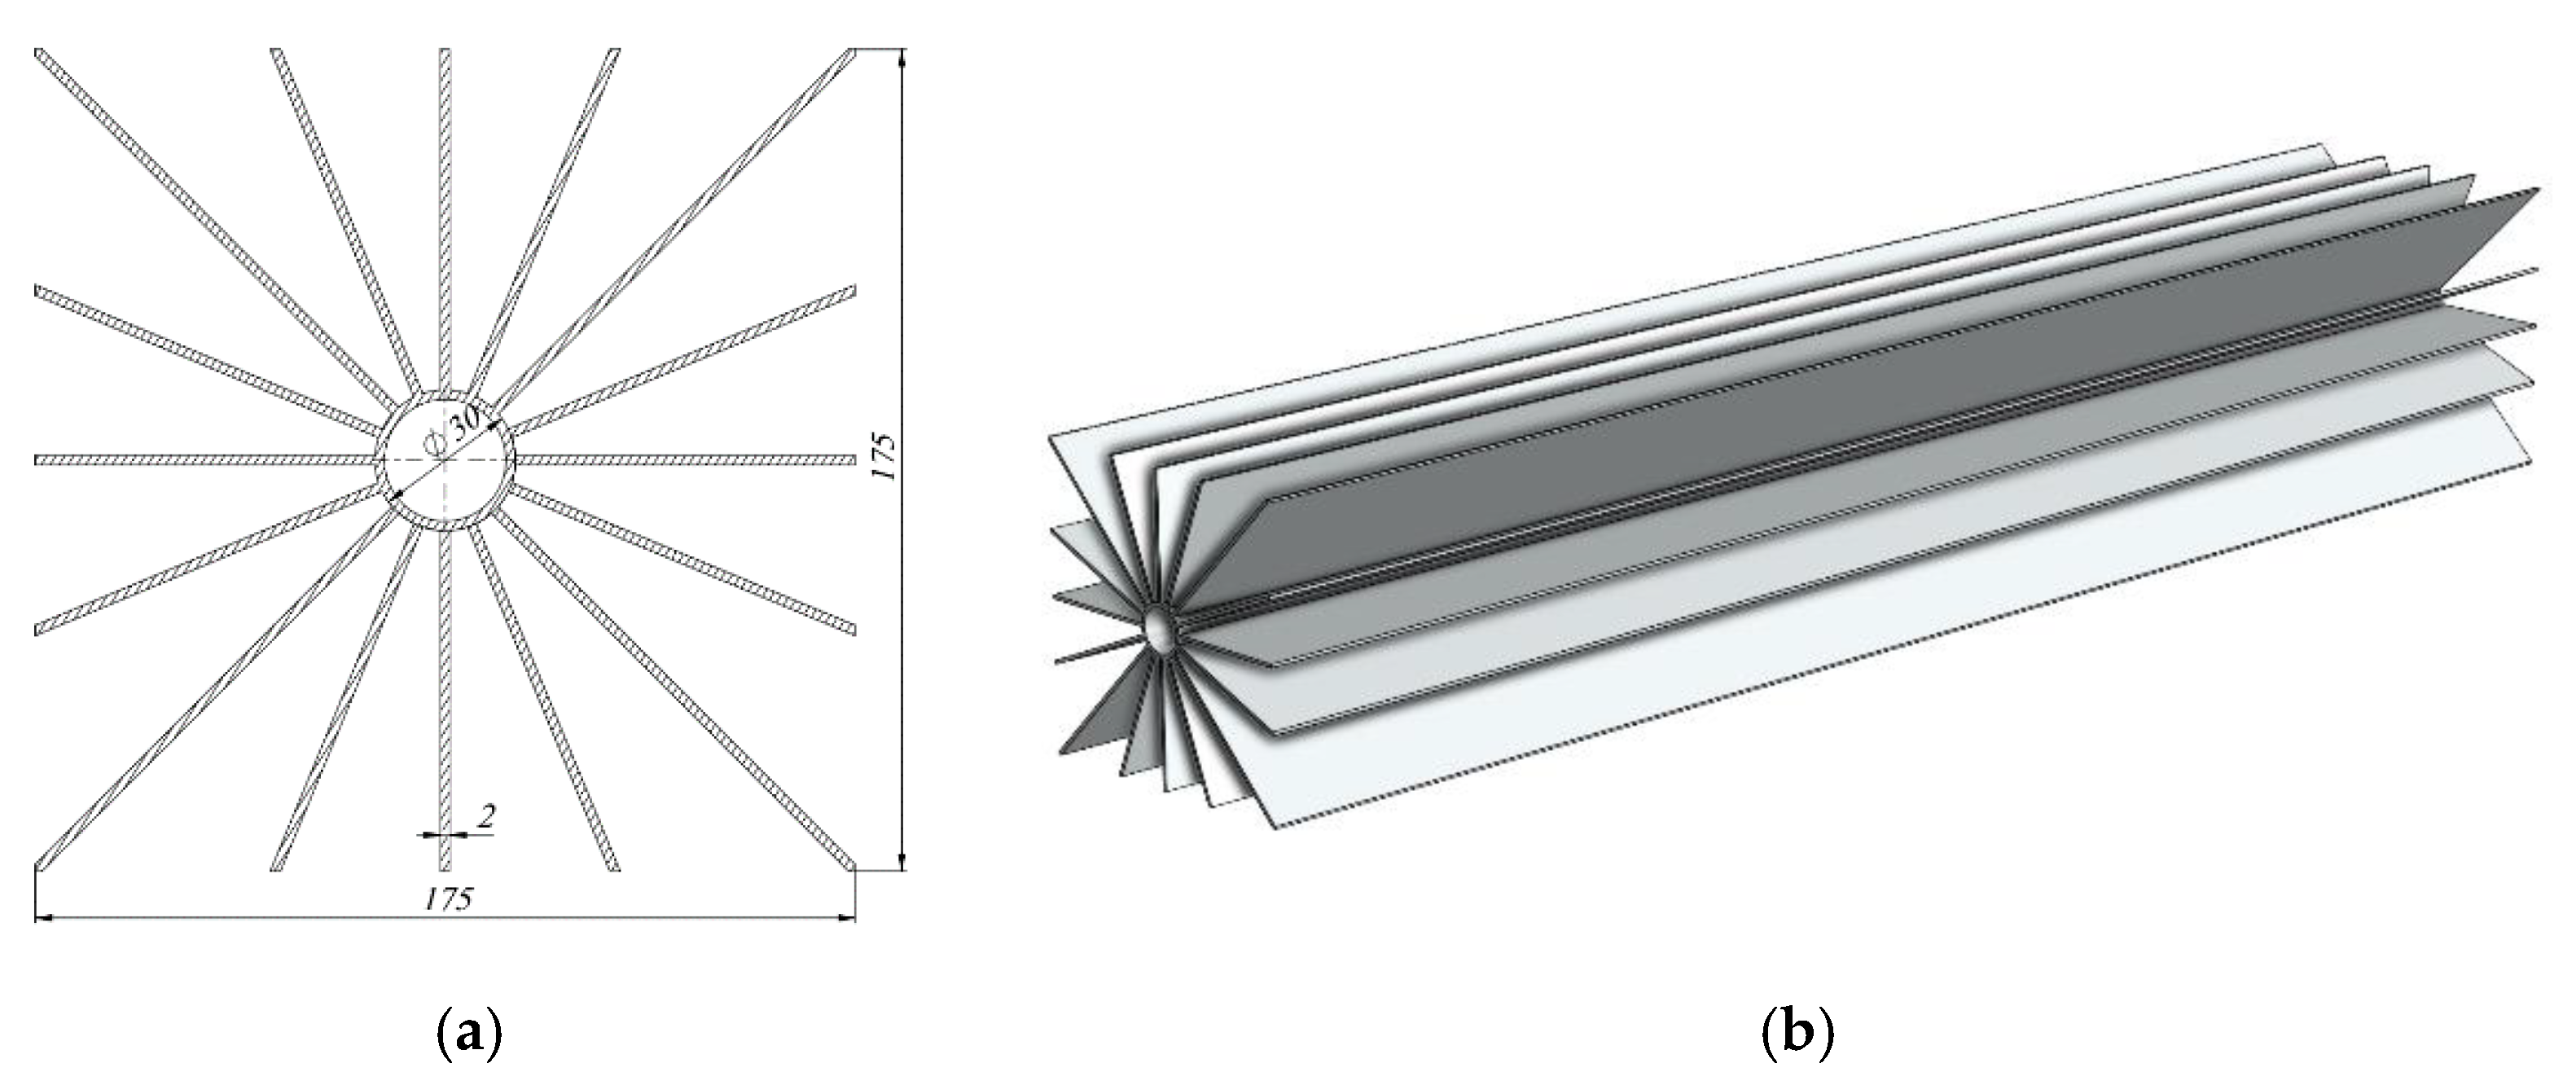
  • All longitudinal finned tubes in the vaporizer were of the same cross-section.
  • There were no other objects in front of and behind the vaporizer.
  • There were no other objects on the sides of vaporizer at least at a distance of 1 m.
  • The air velocity was constant at a distance of 2 m in front of the vaporizer.
  • Air density ρ = 1.225 kg/m3.
  • Air viscosity μ = 1.7894 × 10⁵ kg/ms.
With the above assumptions, simulations of the air flow through the ambient air vaporizers were carried out for wind velocities of vinlet = {50, 100, 150, 200} km/h concerning wind directions of 90° and 45°.

2.2. Results and Discussion

All results of the CFD analyses were related to 1 m of longitudinal finned tube length. The results were summarized in the form of graphs comparing the average wind load Fw at all finned tubes of vaporizer as a function of inlet wind velocity. Figure 5a presents results for wind direction of 90°, whereas Figure 5b refers to wind direction of 45°.
The results concerning finned tube distribution pitch of 200, 350 and 500 mm were compared. It can be noticed that for both wind directions 90° and 45°, the average load on the vaporizer increased with the wind velocity. Concerning the wind direction of 90°, the effect of finned tubes arrangement on wind load was not so significant. In contrast, for wind direction of 45°, increasing the finned tube spacing pitch resulted in a considerable increase in the average wind load on the vaporizer. This was because, for a wind direction of 90°, as the tube pitch increased, the effective wind area remained the same because the tubes were arranged in a straight line one behind the other. Therefore, differences in the average wind load acting on the structure were not significant. On the other hand, for a wind direction of 45°, the tubes were placed overlapping and the effective wind area increased as the pitch of tube arrangement increased. Therefore, the average load on the structure also increased. Figure 6, Figure 7, Figure 8, Figure 9, Figure 10 and Figure 11 present respectively the obtained pressure distribution and wind velocity distribution for the wind direction of 90° and 45°. For all of the analyzed cases, the maximum pressure for the wind direction of 45° was larger than for the wind direction of 90°, which was caused by different effective wind areas. For direction of 45°, the effective wind area of the vaporizer structure was larger.
When analyzing the pressure distributions obtained for wind direction 90°, it can be noticed that for each of the analyzed tube spacing pitches, the highest pressure occurred on the tubes in the first row with respect to the wind direction. The highest wind pressure on the individual tubes occurred for the smallest pitch of the tube arrangement, which was 200 mm. The wind suction load on the opposite side of the vaporizer was the highest as well. The local values of the maximum wind velocity around the vaporizer were also the highest in this case.
The arrangement of the finned tubes also affected the streamlines of the wind flow. It can be noticed that for wind direction of 90°, if the tubes were placed close to each other, the streamlines were drawn around the vaporizer (Figure 6b). Increasing the spacing of tube (Figure 8b) resulted in the air flowing through the vaporizer with streamlines parallel to the wind direction and increasing the air flow velocity inside the vaporizer. On the other hand, for wind direction 45°, due to the overlapping tube arrangement, the streamlines were mostly drawn around the vaporizer. Increasing the pitch of tube placement did not significantly increase the airflow velocity inside the vaporizer in this case.
When considering the wind direction of 45°, it can be observed that the most loaded element of the vaporizer was the first corner tube with respect to the wind direction. For the smallest analyzed tube distribution pitch, which was 200 mm, the pressure acting on this element was more than double the average pressure on the first row of tubes for wind direction of 90°. The maximum local pressure value decreased with increasing tube distribution pitch. A similar trend was observed for the local maximum velocity of the air flowing around the vaporizer.

3. Conclusions

  • In view of the possibility of achieving large overall dimensions and the large surface area on which the wind can pressurize, considerable mechanical loads occur in the construction of ambient air vaporizers. For constant wind speed, the value of average wind load on the vaporizer structure and the maximum load acting locally on individual tubes depends on their arrangement in the array and wind direction.
  • In this study, the average load per 1 m length of finned tubes was determined by applying CFD analysis. The obtained results should be considered in terms of several design aspects. The first of these is the average wind load acting on the whole structure of the vaporizer. This load must be considered in the mechanical design of the supporting structure and for its anchorage to the ground. Another aspect concerns the maximum load on individual tubes, which should be designed concerning the maximum load that can occur on any single one.
  • It was revealed that for a wind direction of 90°, the pitch of finned tube arrangement slightly affects the average load of the vaporizer. On the other hand, for a wind direction of 45°, the effect of varying the pitch of finned tubes arrangement on the average load is significant due to the change in effective wind area.
  • From a mechanical strength point of view, it is advantageous that the variation in wind load on all tubes is as low as possible. Increasing the distance between the finned tubes increases the overall dimensions of the vaporizer, but the maximum pressure can be reduced by up to 50%. However, the average wind load on the structure simultaneously increases. Particularly for a wind direction of 45°, this load can increase by several times with increasing pitch of the finned tubes arrangement.
  • Considering the above aspects, it can be concluded that the distribution of longitudinal finned tubes in the vaporizer structure should be determined by an optimization process, which can be considered as a direction for further research.

Author Contributions

Conceptualization, F.L. and E.L.; methodology, F.L. and E.L.; software, E.L.; validation, F.L.; formal analysis, F.L. and E.L.; investigation, F.L. and E.L.; writing—original draft preparation, F.L.; writing—review and editing, F.L.; visualization, F.L. and E.L.; supervision, E.L.; project administration, F.L. All authors have read and agreed to the published version of the manuscript.

Funding

This research received no external funding.

Institutional Review Board Statement

Not applicable.

Informed Consent Statement

Not applicable.

Data Availability Statement

Not applicable.

Conflicts of Interest

The authors declare no conflict of interest.

References

  1. BP Statistical Review of World Energy, 2019, 68th Edition. Available online: https://www.bp.com/content/dam/bp/business-sites/en/global/corporate/pdfs/energy-economics/statistical-review/bp-stats-review-2019-full-report.pdf (accessed on 20 April 2021).
  2. Cainenga, Z.; Qunb, Z.; Guoshengb, Z.; Bob, X. Energy revolution: From a fossil energy era to a new energy era. Nat. Gas Ind. 2016, B3, 1–11. [Google Scholar] [CrossRef] [Green Version]
  3. Ma, X. Natural gas and energy revolution: A case study of Sichuane Chongqing gas province. Nat. Gas Ind. 2017, B4, 91–99. [Google Scholar] [CrossRef] [Green Version]
  4. Leung, G.C.K. Natural Gas as a Clean Fuel. In Handbook of Clean Energy Systems; John Wiley & Sons: Hoboken, NJ, USA, 2015. [Google Scholar] [CrossRef]
  5. Grønhaug, R.; Christiansen, M. Supply Chain Optimization for the Liquefied Natural Gas Business. In Innovations in Distribution Logistics. Lecture Notes in Economics and Mathematical Systems; Nunen, J., Speranza, M., Bertazzi, L., Eds.; Springer: Berlin/Heidelberg, Germany, 2019; Volume 619. [Google Scholar] [CrossRef]
  6. Lisowski, E.; Lisowski, F. Study on thermal insulation of liquefied natural gas cryogenic road tanker. Therm. Sci. 2019, 23 (Suppl. 4), S1381–S1391. [Google Scholar] [CrossRef] [Green Version]
  7. Lisowski, F.; Lisowski, E. Design of internal supports for double-walled liquefied natural gas road tanker. Heat Transf. Eng. 2021, 8, 1–10. [Google Scholar] [CrossRef]
  8. Agarwal, R.; Rainey, T.J.; Rahman, S.M.A.; Steinberg, T.; Perrons, R.K.; Brown, R.J. LNG Regasification Terminals: The Role of Geography and Meteorology on Technology Choices. Energies 2017, 10, 2152. [Google Scholar] [CrossRef] [Green Version]
  9. Tiana, X.; Jiaoa, W.; Rena, L.; Liub, S.; Liua, T. Research on climate zoning indicators for operating environment of liquefied natural gas ambient air vaporizer. Sustain. Cities Soc. 2020, 60, 102186. [Google Scholar] [CrossRef]
  10. Jeong, H.M.; Chung, H.S.; Djajadiwinata, E.; Kim, P.H.; Lee, Y.H. Experimental study on the characteristics of longitudinal fin air-heating vaporizers in different seasons. J. Mech. Sci. Technol. 2008, 22, 981–990. [Google Scholar] [CrossRef]
  11. Cryogenic Industries. The Advantages of Using Ambient Air Vaporizers throughout the Entire LNG Market. Frostbyte, a Newsletter from Cryogenic Industries, Winter 2015. Available online: https://cryoind.com/wp-content/uploads/2015/03/2015_Winter_FrostByte_low_res_FINAL1.pdf (accessed on 10 June 2020).
  12. Jeong, H.M.; Lee, Y.H.; Ji, M.K.; Bae, K.Y.; Chung, H.S. Natural convection heat transfer estimation from a longitudinally finned vertical pipe using CFD. J. Mech. Sci. Technol. 2009, 23, 1517–1527. [Google Scholar] [CrossRef]
  13. Kopeć, P.; Niezgoda-Żelazko, B. Heat transfer on the outer Surface of vertical longitudinally finned tubes. IOP Conf. Ser. Earth Environ. Sci. 2019, 214, 012058. [Google Scholar] [CrossRef]
  14. Sun, B.; Wadnerkar, D.; Utikar, R.P.; Tade, M.; Kavanagh, N.; Faka, S.; Evans, G.M.; Pareek, V.K. Modeling of Cryogenic Liquefied Natural Gas Ambient Air Vaporizers. Ind. Eng. Chem. Res. 2018, 57, 9281–9291. [Google Scholar] [CrossRef]
  15. Lee, Y.; Na, J.; Lee, W.B. Robust design of ambient-air vaporizer based on time-series clustering. Comput. Chem. Eng. 2018, 118, 236–247. [Google Scholar] [CrossRef]
  16. Lee, K.-S.; Kim, W.-S.; Lee, T.-H. A one-dimensional model for frost formation on a cold flat surface. Int. J. Heat Mass Transf. 1997, 40, 4359–4365. [Google Scholar] [CrossRef]
  17. Jeong, H.-M.; Chung, H.-S.; Lee, S.-C.; Kong, T.-W.; Yi, C.-S. Optimum design of vaporizer fin with Liquefied Natural Gas by numerical analysis. J. Mech. Sci. Technol. 2006, 20, 545–553. [Google Scholar] [CrossRef]
  18. Chen, S.; Yao, S.; Xie, F. Analysis of Thermal Conductivity of Frost on Cryogenic Finned-tube Vaporizer Using Fractal Method. Energy Power Eng. 2013, 5, 109–115. [Google Scholar] [CrossRef]
  19. Kuang, Y.; Yi, C.; Wang, W. Numerical simulation of frosting behavior and its effect on a direct-contact ambient air vaporizer. J. Nat. Gas Sci. Eng. 2015, 27, 55–63. [Google Scholar] [CrossRef]
  20. Liu, S.; Jiao, W.; Wang, H. Three-dimensional numerical analysis of the coupled heat transfer performance of LNG ambient air vaporizer. Renew. Energy 2016, 87, 1105–1112. [Google Scholar] [CrossRef]
  21. Liu, S.; Jiao, W.; Ren, L.; Wang, H.; Zhang, P. Dynamic heat transfer analysis of liquefied natural gas ambient air vaporizer under frost conditions. Appl. Therm. Eng. 2017, 110, 999–1006. [Google Scholar] [CrossRef]
  22. Lee, Y.; Park, J.; Han, C. Modeling and Analysis of Frost Growth in Pilot-Scale Ambient Air Vaporizer. Ind. Eng. Chem. Res. 2018, 57, 5933–5943. [Google Scholar] [CrossRef]
  23. Liu, S.; Jiao, W.; Ren, L.; Tian, X. Thermal resistance analysis of cryogenic frosting and its effect on performance of LNG ambient air vaporizer. Renew. Energy 2020, 149, 917–927. [Google Scholar] [CrossRef]
  24. Gavelli, F. Computational fluid dynamics simulation of fog clouds due to ambient air vaporizers. J. Loss Prev. Process. Ind. 2010, 23, 773–780. [Google Scholar] [CrossRef]
  25. Ansys Academic Research, Release 18, Help System, Design Optimization; ANSYS Inc.: Canonsburg, PA, USA, 2018.
Figure 1. Block of four ambient air vaporizers in LNG regasification station.
Energies 15 00405 g001
Figure 2. Aluminum finned tube with 16 fins, (a) Cross-section dimensions; (b) 3D geometry.
Energies 15 00405 g002
Figure 3. Mesh for wind direction of: (a) 90°, (b) 45°; Mesh detail around longitudinal finned tube for: (c) ref.1, (d) ref.3, (e) ref.4.
Energies 15 00405 g003
Figure 4. Mesh independence test.
Energies 15 00405 g004
Figure 5. Average wind load depending on finned tubes distribution pitch for wind direction: (a) α = 90°, (b) α = 45°.
Energies 15 00405 g005
Figure 6. (a) Pressure distribution, (b) Velocity distribution (s = 200 mm, vinlet = 120 km/h, α = 90°).
Energies 15 00405 g006
Figure 7. (a) Pressure distribution, (b) Velocity distribution (s = 350 mm, vinlet = 120 km/h, α = 90°).
Energies 15 00405 g007
Figure 8. (a) Pressure distribution, (b) Velocity distribution (s = 500 mm, vinlet = 120 km/h, α = 90°).
Energies 15 00405 g008
Figure 9. (a) Pressure distribution, (b) Velocity distribution (s = 200 mm, vinlet = 120 km/h, α = 45°).
Energies 15 00405 g009
Figure 10. (a) Pressure distribution, (b) Velocity distribution (s = 350 mm, vinlet = 120 km/h, α = 45°).
Energies 15 00405 g010
Figure 11. (a) Pressure distribution, (b) Velocity distribution (s = 500 mm, vinlet = 120 km/h, α = 45°).
Energies 15 00405 g011
Publisher’s Note: MDPI stays neutral with regard to jurisdictional claims in published maps and institutional affiliations.

