Article

Screening of Surfactants for Flooding at High-Mineralization Conditions: Two Production Zones of Carbonate Reservoir

by
Aleksei O. Malahov
1,*,
Emil R. Saifullin
1,*,
Mikhail A. Varfolomeev
1,*,
Sergey A. Nazarychev
1,
Aidar Z. Mustafin
1,
Chengdong Yuan
1,*,
Igor P. Novikov
2,
Dmitrii A. Zharkov
1,
Rustam N. Sagirov
1 and
Rail I. Kadyrov
1
1
Department of Petroleum Engineering, Kazan Federal University, 420008 Kazan, Russia
2
Tatnefteprom JSC, RF, 423450 Almetyevsk, Russia
*
Authors to whom correspondence should be addressed.
Energies 2022, 15(2), 411; https://doi.org/10.3390/en15020411
Submission received: 18 November 2021 / Revised: 19 December 2021 / Accepted: 28 December 2021 / Published: 6 January 2022

Abstract

:
The selection of effective surfactants potentially can mobilize oil up to 50% of residuals in mature carbonate oilfields. Surfactants’ screening for such oilfields usually is complicated by the high salinity of water, high lipophilicity of the rock surface, and the heterogeneous structure. A consideration of features of the oilfield properties, as well as separate production zones, can increase the deep insight of surfactants’ influence and increase the effectiveness of surfactant flooding. This article is devoted to the screening of surfactants for two production zones (Bashkirian and Vereian) of the Ivinskoe carbonate oilfield with high water salinity and heterogeneity. The standard core study of both production zones revealed no significant differences in permeability and porosity. On the other hand, an X-ray study of core samples showed differences in their structure and the presence of microporosity in the Bashkirian stage. The effectiveness of four different types of surfactants and surfactant blends were evaluated for both production zones by two different oil displacement mechanisms: spontaneous imbibition and filtration experiments. Results showed the higher effect of surfactants on wettability alteration and imbibition mechanisms for the Bashkirian cores with microporosity and a higher oil displacement factor in the flooding experiments for the Vereian homogeneous cores with lower oil viscosity.

Graphical Abstract

1. Introduction

In the Tatarstan Republic (Russia), most of the oilfields are at the last stage of development, and about 40% of hydrocarbons remain in carbonate reservoirs [1,2]. Most of these carbonate reservoirs are located in the southeast of the Volga region and are confined to the Carboniferous and Devonian systems [3,4]. These reservoirs are characterized by high heterogeneity, natural fracture, low hydrophilicity of the rock, and, as a result, the premature breakthrough of water and high water cut. Development of these oilfields is also complicated by the ultra-high salinity of formation water (>200 g/L), high viscosity of oil, and low oilfield temperature [5,6]. All these conditions negatively affect the efficiency of the development of these reservoirs.
Improving the profitability of such reservoirs is possible through the use of chemical enhanced oil recovery (EOR) methods. The leading technology of chemical EOR is aqueous solutions of surfactants’ injection or surfactant flooding. Surfactant flooding is a tertiary development method that can help to produce up to 50% residual oil [7,8]. Injection of surfactants mobilizes trapped or residual oil stacked in the mature or oil-wet reservoirs by decreasing the interfacial tension (IFT) value and changing rock wettability to hydrophilic [9,10,11]. The addition of surfactants decreases the capillary pressure of water with decreasing IFT according to the Young–Laplace equation. However, there are other mechanisms of oil displacement during spontaneous imbibition, which improves by low IFT values. Adsorption of surfactants in the oil/water interface decreases interfacial tension (N/m), or energy, required to increase the oil/water interfacial surface (J/m2). This decreasing allows oil drops to stretch or reshape, which mobilizes trapped oil. Moreover, in the case of ultralow IFT, solubilization of oil can occur through the creation of microemulsions [12]. Another mechanism of surfactant flooding is wettability changing through surfactant adsorption on the rock surface. Carbonate rocks are characterized by hydrophobicity and a high contact angle at the water-rock interface. In this case, the vector of capillary pressure is directed from oil to injected water. Surfactant injection makes it possible to increase hydrophilicity by the adsorption of surfactants on the surface of the rock. Consequently, capillary pressure promotes the penetration of water into the pores, that is, increasing the injectivity of the rock. Thus, changing the direction of capillary pressure mobilizes oil in the pores, activating spontaneous imbibition [13]. To estimate roughly necessary parameters of surfactants and predict their efficiency, the concept of “capillary number” is used [14,15].
Surfactants are amphiphilic molecules, which are conventionally divided into lipophilic (organic tale) and hydrophilic (surfactants head) parts. Depending on the charge of the head, the surfactant can be classified as nonionic (absence of charge) or ionic, such as cationic (positive charge), anionic (negative charge), and amphoteric (zwitterionic) [16]. The absence of charge reduces the influence of cations and anions of inorganic salts on the nonionic surfactants, which makes it possible to use them in formations with high mineralization [17]. However, ionic surfactants usually have a higher surface activity and the ability to reduce interfacial tension to ultralow values [18]. Several works reported about the synergy effect and high efficiency of nonionic-ionic blends [19,20], which are preferable for surfactant flooding in reservoirs with high water mineralization, where ionic surfactants effectively decrease IFT, change wettability, and, at the same time, nonionic surfactants can increase the salt tolerance of surfactants’ blend.
High mineralization of formation water limits the use of chemical reagents [21]; in this regard, the problem of the selection of surfactants arises [22,23,24]. In high salinity carbonate reservoirs, many problems arise, including surfactant sedimentation [25], high surfactant adsorption [26], and, in view of this, the selection of an effective surfactant is complicated not only by salinity, reservoir type, temperature, but also by the type and properties of the oil [27]. A large number of studies such as the “bulk test” (solubility, thermal stability, IFT measures, wettability alteration, and static adsorption tests) and core flooding experiments (spontaneous imbibition, dynamic adsorption, and oil displacement experiments) of surfactants were carried out in conditions of different salinity and temperatures [13,28,29]. However, more often, to reduce the time and costs of research, the screening of surfactants is carried out according to the averaged parameters of the oilfield, not considering production zones and their parameters separately.
Thus, the success of surfactant flooding depends on the individualized selection of surfactants not only for the conditions of the individual oilfield but also separately for each production zone. Despite small differences in the parameters of production zones, upon detailed study, there is a strong influence of various parameters on the effectiveness of the selected surfactants. This work is devoted to the selection of surfactants and the assessment of the effectiveness of surfactant flooding at two production zones (Bashkirian and Vereian) of the Ivinskoe carbonate oilfield complicated by the high salinity of formation water. X-ray scanning of core samples was used to reveal structural differences between both production zones. Two different oil displacement mechanisms of ionic surfactants and ionic-nonionic surfactant blends were evaluated for both production zones.

2. Materials and Methods

2.1. Fluids and Reservoir Conditions

A lot of oilfields in Tatarstan (Russia) are characterized by a low temperature and high mineralization reservoir conditions. Surfactant screening was carried out for Ivinskoe oilfield characterized by high water mineralization and low-temperature carbonate reservoirs. Two reservoirs of the Ivinskoe oilfield were considered—Bashkirian stage (B) and Vereian horizon (V). Both of them are characterized by low temperatures, 21 °C and 22 °C (in the tests we used 22 °C), and ultra-high mineralization of water, 268 g/L, with a high divalent cations (Ca2+ and Mg2+) content (Table 1). The formation water type is chloride-calcium-sodium.
Crude oil from both production zones is characterized as heavy and high-viscosity (Table 2). Nevertheless, there is a difference in these parameters for the presented production zones which can affect the interaction between surfactant and oil.

2.2. Core Study

Absolute permeability and porosity of cores were measured by porosimeter and permeameter (Table A1). Average permeability did not differ a lot and was 800 mD of Vereian and 700 mD for Bashkirian cores. The D2 Phaser diffractometer (Brucker, Germany) was used for determining mineral compounds. The quantity of mineral compound was determined by the interpretation of the intensity of the diffraction signal which recalculates to the volume percent concentration. Results showed that there is no significant difference in rock samples’ mineral composition, and both rock samples are 99% calcite (Figure 1).
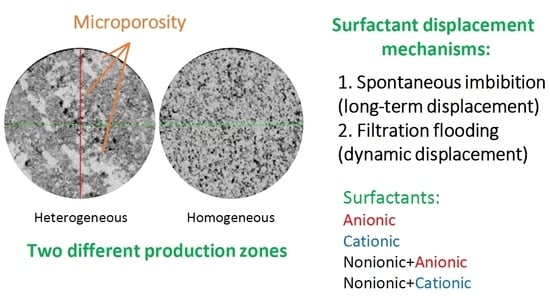
To determine the characteristics of the pore space of standard core samples from the presented production zones, a micro and nanofocus research X-ray system for computed tomography General Electric v|tome| XS 240 was used. The survey of standard core samples for this study was carried out using a microfocus tube at a voltage of 140 kV, a current of 130 mA, and a survey resolution of 57 μm.
Despite the same mineral composition, the configuration of the pore space in the presented horizons is different. According to the results of computed tomography, the void-pore space of the samples of the (V) is more homogeneous, in contrast to the (B), where there are areas with microporosity (Figure 2a,b).

2.3. Surfactants

The list of the tested surfactants’ samples includes commercial surfactants that were already successfully applied in various oilfields of the Russian Federation, as well as surfactant compositions evaluated in Kazan Federal University (Table 3).
The main parameters that affect the choice and efficiency of the surfactant used to improve waterflooding efficiency [15]:
  • reservoir type (sandstone, carbonate, etc.);
  • temperature;
  • pH, salinity, and composition of formation water;
  • chemical composition (average length of the alkyl tail, acid number, physicochemical properties of oil, content of paraffin and resins).
According to these parameters, two compositions and two individual surfactants were selected for the screening (Table 3).

2.4. Solubility and Thermal Stability

To assess solubility and long-term stability, 100 mL of 0.3 wt% surfactant solutions by active content were prepared. Such a surfactant concentration is sufficient to achieve maximum efficiency, since an increase in concentration does not affect a decrease in IFT and is economically unprofitable. The visual method was used to assess the homogeneity of the solution at a reservoir temperature for 14 days.

2.5. IFT Measurements

The investigation of interfacial tension (IFT) in the surfactant solution/crude oil (two types for (B) and (V)) system was carried out by the spinning drop method on the Kruss SDT tensiometer at 22 °C and a surfactant concentration of 0.3 wt%. The spinning drop method makes it possible to determine ultralow values of IFT. This is an important condition in the analysis of the effectiveness of surfactant solutions, which significantly reduce the values of IFT relative to the initial level. Initial IFT between brine and crude oil was measured at the formation water-oil interface, which was considered a reference sample. The measurement of interfacial tension at the surfactant solution-oil continued until stabilization.

2.6. Wettability Measurements

Wettability is another important factor that strongly influences oil displacement efficiency in surfactant flooding, especially for oil-wet carbonate formations. Wettability was measured by the contact angle method (KRUSS DSA 100) at surfactants’ concentration of 0.3 wt% by the active substance.
To achieve the highest quality of the studied image, the investigated water droplet is shone from one side, and the contour of the droplet is observed on the other side. Thus, in the course of a laboratory experiment, a scaled image of a drop with a graphically applied wetting edge angle is observed on the monitor screen. On the wetted surface, the aqueous phase spreads, while the contact angle tends to zero. If the surface is not wetted, a spherical drop forms, and the contact angle approaches 180°. Therefore, the most effective wetting agents provide the smallest contact angle.
All cores were aged in oil. For each core, three contact angle measurements were performed. The first measurement of wettability was water drop and surfactant solution drop on the aged core. Then, cores were placed in surfactant solution for 1, 4, and 24 h, and the contact angle of water was measured again.

2.7. Imbibition in Amott Cells

Generally, surfactants increase oil displacement during spontaneous imbibition by wettability alteration to water-wet (increasing hydrophilicity) and increasing water capillary pressure. The process of capillary displacement of oil with a surfactant solution is enhanced by the effect of oil solubilization in a surfactant solution with the formation of a microemulsion [12]. This process is accompanied by phase inversion at the moment when the interfacial tension is extremely low. This effect contributes to the transfer of residual oil into a mobile state, which increases oil recovery. The formation of microemulsions in the cells confirms this phenomenon and determines the best properties of certain surfactant models.
The oil displacement coefficient during spontaneous imbibition (KIORF) was determined as the ratio of the sum of the total volume of displaced oil (VIo) and volume of oil contained in the microemulsion (VIme) to the OOIPI—original oil in place (1):
KIORF = (VI0 + VIme)/OOIPI

2.8. Filtration Experiments

The multicomponent composition of the rock, which is represented by core samples, as well as complex reservoir conditions, can have a great impact on the effectiveness of aqueous surfactant solutions when used in a real field. Therefore, to compare the best surfactant samples, a series of filtration studies was carried out for the experimental modeling of the surfactant flooding technology.
Filtration experiments were carried out on a typical filtration setup (Figure 3).
Dried core samples, cleaned of hydrocarbons and inorganic impurities, were saturated with formation water under vacuum for 24 h. Water saturated cores were placed in the core holder, and reservoir conditions were created. After that, water was injected through the cores with volumetric rates 5, 10, and 20 mL/min to determine phase permeability by water (kw) (2). After that, the cores were saturated with kerosene and aged for 2 h. Kerosene is a more mobile liquid than oil, displaces water from the smallest pores, and also restores the wettability of the extracted rock (according to Russian standards). Thus, at the next stage, the oil not only displaces kerosene but also replaces it in the smallest pores as a result of diffusion. After oil saturation, the cores were aged in reservoir conditions for 16 h for the final restoration of wettability.
kw = (qμwL)/(F∙∆P)
where q—volumetric flow, μw—viscosity of water, L—length of core, F—cross-section area of core, ∆P—pressure drop.
The first stage of the filtration experiment was the oil displacement stage by 0.2 mL/min water injection. Water injection continued until 100% water cut at the outlet, but not less than 5 pore volumes (PV). Based on the results of this stage, the Oil recovery factor (ORF) (3) and injectivity parameter of the core samples (I1) (4) were calculated.
ORF = Vd/OOIP
I = (qμwL)/(∆Pkw)
where Vd—volumes of oil displaced by water, OOIP—original oil in place.
The second stage involved injection of 3 PV surfactant solution at 0.2 mL/min; the third—water injection at the same rate until full water cut at the outlet, but not less than 5 pore volumes (PV). At this stage, the additional oil recovery factor (AORF) and injectivity parameter (I2) were calculated by the Formula (5):
AORF = Vro/OOIP
where Vro—the volume of displaced oil after surfactant solution injection.
The efficiency of surfactants was estimated by the coefficient (KORF) which was defined as the ratio of the total volume of displaced oil at both stages (before and after surfactant slug injection) to the volume of displaced oil after surfactant injection (6):
KORF = AORF/(ORF + AORF)
The effect of the surfactant on the change in the rock wettability was also assessed by the relative parameter, which considered the injectivity before and after the surfactant injection—the coefficient of injectivity change (KI) (7):
KI = I2/I1
where I1 is injectivity of the sample during water flooding; I2 is injectivity during subsequent water flooding after the surfactant slug injection.

3. Results and Discussion

3.1. Solubility and Thermal Stability

During dissolving of Composition-2, some cloudiness was observed (Table 4) while maintaining the homogeneity of solutions without phase separation. The cloudiness of the solution decreased over time. In general, the results of studies of the solubility and long-term stability of surfactants in brine showed that almost all surfactants are stable, despite the high salinity of water (267.98 g/L).

3.2. IFT Measurements

Due to the high salinity, the reference measurements between both oils and brine showed fairly low IFT values (Table 5). All surfactants retain their activity in high-mineralization water and allow the decrease in IFT for both production zones more than 16 times. The cationic-nonionic surfactant composition (Composition-1) showed a higher decrease in IFT values down to 0.05–0.08 mN/m.
The dynamic of IFT reduction versus time showed a high adsorption rate of surfactant molecules on the oil/water interface. The IFT value stabilization for all surfactant solutions occurred already at 12 min (Figure 4). Composition-2 stabilized within the first minute; the rest of the surfactants reached a plateau in the fourth minute. The results show the dependence of the viscosity and density of oil from different horizons on the IFT value: most of the values for (B) turned out to be lower, except for Composition-2, where the difference in the IFT value is insignificant for both production zones. Comparing the obtained results of IFT values with other works, it can be concluded that the selected surfactants are able to reduce IFT effectively down to values of 10−2 mN/m, as in previous works for reservoirs with similar conditions [30,31].

3.3. Wettability Alteration

An example of wettability measurement photos is shown in Figure 5.
According to the contact angle of the brine drop, the initial wettability of Bashkirian cores is less hydrophobic and of the Vereian horizon more hydrophobic. The dynamics and rate of adsorption of all surfactants were estimated by the ability change contact angle in 1 h in comparison of the initial (brine). After 4 h, all surfactants change the contact angle to zero. The only exception is Composition-2, whose contact angle for both zones remains substantially large (Table 6 and Table 7).

3.4. Imbibition in Amott Cells

The high salinity brine displaced up to 7% of oil from the samples. However, as can be seen from the size of the oil droplets on the core surface (Figure 6), the brine did not significantly reduce the work of the adhesion forces, i.e., wettability of the core remained hydrophobic. The oil droplets on the core surface after surfactants’ treatment were significantly smaller, indicating a wettability change to hydrophobic.
Based on the recovery factor of spontaneous imbibition (Table 8), it can be concluded that the Composition-1 surfactant turned out to be the most effective for the Bashkirian and Vereian production zones.
It is also worth noting the high rate of oil displacement by SAA-2 and Composition-1 surfactants from Bashkirian stage cores (Figure 7a). Most of the oil was displaced by these surfactants in the first 5–10 days. The Composition-2 graph shows a more linear pattern of oil displacement. This is due to the gradual action of capillary forces and their increase due to the change in wettability to hydrophobic. The nature of fluid displacement by surfactant solutions of SSA-1 was longer, and the total volume of displaced fluids was several times less. Composition-1 showed a significant emulsion generation (3.2 mL); SAA-2 (1.46 mL) can also be noted. It can be observed from the emulsion displacement rate (Figure 7b) the transition of a less stable emulsion back to oil (for SSA-2 and Composition-1). It is worth noting the displacement rate of Composition-1 and SSA-2—the most volume of the fluids was displaced during the first 10 days of the experiment.
However, there was no significant difference in the displacement rate compared to the Vereian cores (Figure 8). A similar, but less emulsion volume was generated by Composition-1 (2.8 mL) and SAA-2 (1.2 mL).
The dynamics of oil displacement efficiency (KIORF) for the Bashkirian stage and Vereian horizon are shown in Figure 7c and Figure 8c. These graphs show the overall effectiveness of each surfactant and composition for the represented production zones. Thus, it can be observed that, with a similar nature, the effectiveness of surfactants, in particular Composition-1, is higher for the Bashkirian stage than for the Vereian horizon.

3.5. Filtration Experiments

The low initial ORF at the Bashkirian stage confirms the presence of low permeability zones in the core from which oil was not displaced during filtration experiments. (Table 9). Based on the results of filtration studies at two production zones, the oil recovery factor coefficient (KORF) and injectivity changes coefficient (KI) were calculated, which makes it possible to draw conclusions about the effectiveness of surfactants. For core models of the Bashkirian stage, the higher KORF as well as KI were achieved using surfactant compositions Compositon-1 (KORF = 0.19, KI = 1.97) and Composition-2 (KORF = 0.11, KI = 1.179).
For all surfactants’ efficiency oil displacement, the Vereian core models turned out to be higher. Composition-1 (KORF = 0.4, KI = 1.35) and Composition-2 (KORF = 0.26, KI = 1.556) also showed better results. However, surfactant SSA-1 had a higher KI (1.52); moreover, SSA-1 showed almost no oil displacement efficiency. This fact means that SSA-1 adsorbed on the rock surface but did not mobilize oil and did not involve a new area in the flooding process.

4. Discussion

The effectiveness of surfactants for two horizons was evaluated by two main parameters: changing the wettability of the rock surface from hydrophobic to hydrophilic and measuring the effectiveness of spontaneous imbibition (Figure 9), as well as assessing the ability to reduce the interfacial tension and enhance the oil displacement process by water (Figure 10).
The core analysis showed that there is almost no difference in chemical composition between the cores of both production zones, but their structure is different. According to the 3D scanning, cores of the Bashkirian stage are characterized by a heterogeneous structure and pronounced areas with microporosity. The cores of the Vereian horizon are more homogeneous and have higher average permeability. These differences in structure affect the effectiveness of surfactants on both horizons:
  • Higher AORF in the filtration experiments for Vereian horizon cores: During filtration experiments, areas with microporosity in the Bashkirian stage were not involved, because the pore structure are more complicated; the filtration of fluid goes through tortuous and bigger pores, and the influence of the surfactant is not so high, which explains the lower AORF value. Moreover, the lower oil viscosity of the Vereian horizon influenced the higher AORF.
  • Higher KIORF in spontaneous imbibition experiments for Bashkirian stage cores: Since all considered surfactants change the wettability to hydrophilic, they have a greater effect on oil displacement in channels with a smaller radius. Moreover, the cores were treated by surfactants in Amott cells longer compared to filtration experiments, which allowed the surfactant solution to reach micropores and reduce the capillary pressure for water, which made it possible to displace more oil.
  • Results for Bashkirian cores during waterflooding experiments’ filtration forces cannot mobilize oil contained in the microporosity zone. Capillary forces hold the oil, and short-term treatment of the surfactant cannot decrease this capillary pressure. However, during the spontaneous imbibition experiments for the heterogeneous core with the microporosity zone, we can see that the long-term treatment of the surfactant changed the wettability of the core and expulsed oil from micropores.

5. Conclusions

In this work, the screening of different types of surfactants and the investigation of the mechanisms affecting oil recovery for two carbonate type production zones of the Ivinskoe oilfield with high-salinity conditions were carried out. The main results are as follows:
  • Based on the “bulk tests” results, nonionic-ionic surfactant compositions showed higher efficiency to reduce IFT to low values (10−2 mN/m). All surfactants showed an ability to change the carbonate rock wettability from hydrophobic to hydrophilic in 24 h.
  • Based on the core study results, it was determined that the Bashkirian stage core samples are characterized by low-permeability and low-porosity zones—“microporosity”, which contains trapped oil.
  • According to filtration experiments, the oil displacement coefficient (KORF) for the Bashkirian stage turned out to be lower than for the Vereian horizon, characterized by higher permeability and homogeneity. The lower additional oil recovery factor in the filtration experiments connected with higher oil viscosity and the presence of microporosity of Bashkirian stage cores.
  • The higher oil displacement coefficient during spontaneous imbibition experiments (KIORF) for Bashkirian stage cores was associated with the presence of microporosity and higher initial hydrophilicity. Long-term surfactant treatment allows for the change in the rock wettability and increases the oil displacement rate, especially in the microporosity zones with a lower channel radius.

Author Contributions

Conceptualization, E.R.S., A.Z.M., S.A.N. and A.O.M.; methodology, C.Y.; formal analysis, R.I.K., R.N.S.; investigation, D.A.Z., R.N.S., S.A.N. and A.O.M.; writing—original draft preparation, E.R.S., A.O.M. and A.Z.M.; writing—review and editing, E.R.S. and A.O.M.; visualization, R.I.K.; supervision, M.A.V. and C.Y.; project administration, M.A.V. and I.P.N. All authors have read and agreed to the published version of the manuscript.

Funding

This work was supported by the Ministry of Science and Higher Education of the Russian Federation under agreement No. 075-15-2020-931 within the framework of the development program for a world-class Research Center “Efficient development of the global liquid hydrocarbon reserves”.

Institutional Review Board Statement

Not applicable.

Informed Consent Statement

Not applicable.

Conflicts of Interest

The authors declare no conflict of interest.

Nomenclature

EORenhanced oil recovery
IFTinterfacial tension
KIORFoil displacement coefficient during capillary impregnation during Amott cell experiment
VIosum of the volume of displacement oil during Amott cell experiment
VImevolume of displacement microemulsion during Amott cell experiment
CIo.mecoefficient of oil content during Amott cell experiment
OOIPIoriginal oil in place during spontaneous imbibition experiments
kwphase permeability by water
qvolumetric flow
μwviscosity of water
Llength of core
Fcross-section area of core sample
Ppressure drop
ORFoil recovery factor
Vdvolumes of oil displaced by water
OOIPoriginal oil in place
AORFadditional oil recovery factor
Vrovolume of oil displaced after surfactant solution injection
KORFpart of displaced oil produced as a result of surfactant injection
KIcoefficient of injectivity change
I1injectivity of the sample during water flooding
I2injectivity during subsequent water flooding after surfactant slug injection

Appendix A

Table A1. Core samples.
Surfactant№ CoreVoid Ratio, % (Proportion of Pores > 57 μm in Size)/Column AverageGas Permeability, mD/Column Average
Bashkirian stage
1SSA-136p5.404.57408.59597.9
29p3.73787.20
2SSA-242p4.674.11467.02627.13
40p3.54787.24
3Composition-131p4.376.05506.20840.58
33p7.721174.96
4Composition-232p6.414.16487.85720.22
43p1.91952.58
Vereian horizon
1SSA-118p4.605.05579.90965.36
16p5.491350.81
2SSA-219p4.706.9350.34642.3
2p9.10934.26
3Composition-125p4.547.82592.211045.55
5p11.101498.89
4Composition-220p6.756.15299.78544.23
17p5.55788.68

References

  1. Ahmadi, M.A.; Shadizadeh, S.R. Implementation of a high-performance surfactant for enhanced oil recovery from carbonate reservoirs. J. Pet. Sci. Eng. 2013, 110, 66–73. [Google Scholar] [CrossRef]
  2. Muslimov, R.K. Neftegazonosnost Respubliki Tatarstan Geologiya i Razrabotka Neftyanykh Mestorozhdeniy. In Georesursy; FEN Publ.: Kazan, Russia, 2008; Volume 4, ISBN 978-5-9690-00083-4. [Google Scholar]
  3. Kayukova, G.P.; Kosachev, I.P.; Mikhailova, A.N.; Vakhin, A.V.; Isakov, D.R. Hydrothermal transformation of heavy oil and organic matter from carbonate rocks of oil fields of Tatarstan. Pet. Sci. Technol. 2019, 37, 528–534. [Google Scholar] [CrossRef]
  4. Yusupova, T.N.; Ganeeva, Y.M.; Tukhvatullina, A.Z.; Romanov, G.V.; Muslimov, R.K.; Kruglov, M.P. Composition of oils in Vereiskian and Bashkirian carbonate reservoirs of the Akanskoe oilfield in the Republic of Tatarstan. Pet. Chem. 2012, 52, 215–220. [Google Scholar] [CrossRef]
  5. Galimov, E.M.; Kamaleeva, A.I. Source of hydrocarbons in the supergiant Romashkino oilfield (Tatarstan): Recharge from the crystalline basement or source sediments? Eur. Spine J. 2015, 53, 95–112. [Google Scholar] [CrossRef]
  6. Kamaleeva, A.I.; Kodina, L.A.; Vlasova, L.N.; Bogacheva, M.P.; Galimov, E.M. “Anomalous” oils of Tatarstan: Genetic correlations and possible origin. Dokl. Earth Sci. 2014, 458, 1132–1135. [Google Scholar] [CrossRef]
  7. Kamal, M.S.; Hussein, I.A.; Sultan, A.S. Review on Surfactant Flooding: Phase Behavior, Retention, IFT, and Field Applications. Energy Fuels 2017, 31, 7701–7720. [Google Scholar] [CrossRef]
  8. Foster, W.R. Low-Tension Waterflooding Process. JPT J. Pet. Technol. 1973, 25, 205–210. [Google Scholar] [CrossRef]
  9. Ahmadi, M.A.; Shadizadeh, S.R. Experimental investigation of adsorption of a new nonionic surfactant on carbonate minerals. Fuel 2013, 104, 462–467. [Google Scholar] [CrossRef]
  10. Chen, P.; Mohanty, K.K. Surfactant-mediated spontaneous imbibition in carbonate rocks at harsh reservoir conditions. SPE J. 2013, 18, 124–133. [Google Scholar]
  11. Ge, J.; Wang, Y. Surfactant Enhanced Oil Recovery in a High Temperature and High Salinity Carbonate Reservoir. J. Surfactants Deterg. 2015, 18, 1043–1050. [Google Scholar] [CrossRef]
  12. Wang, S.; Li, Z.; Liu, B.; Zhang, X.; Yang, Q. Molecular mechanisms for surfactant-aided oil removal from a solid surface. Appl. Surf. Sci. 2015, 359, 98–105. [Google Scholar] [CrossRef]
  13. Zhang, F.; Yang, S.; Ma, D.; Lv, J.; Zhang, Q.; Luo, W.; Zhou, Z.; Tian, M.; Cai, H. Study on chemical combination formulations for high temperature and high salinity carbonate reservoirs. In Proceedings of the Society of Petroleum Engineers—Abu Dhabi International Petroleum Exhibition and Conference 2018, ADIPEC 2018, Abu Dhabi, United Arab Emirates, 12–15 November 2018. [Google Scholar]
  14. Ayirala, S.C.; Rao, D.N. Multiphase flow and wettability effects of surfactants in porous media. Colloids Surf. A Physicochem. Eng. Asp. 2004, 241, 313–322. [Google Scholar] [CrossRef]
  15. Chatzis, I.; Morrow, N.R. Correlation of capillary number relationships for sandstone. Soc. Pet. Eng. J. 1984, 24, 555–562. [Google Scholar] [CrossRef]
  16. Shosa, J.D.; Schramm, L.L. Surfactants: Fundamentals and Applications in the Petroleum Industry. Palaios 2001, 16, 614–615. [Google Scholar] [CrossRef]
  17. Massarweh, O.; Abushaikha, A.S. The use of surfactants in enhanced oil recovery: A review of recent advances. Energy Rep. 2020, 6, 3150–3178. [Google Scholar] [CrossRef]
  18. Myers, D. Surfactant Science and Technology, 3rd ed.; John Wiley & Sons: Hoboken, NJ, USA, 2005. [Google Scholar]
  19. Nandwani, S.K.; Chakraborty, M.; Bart, H.J.; Gupta, S. Synergism, phase behaviour and characterization of ionic liquid-nonionic surfactant mixture in high salinity environment of oil reservoirs. Fuel 2018, 229, 167–179. [Google Scholar] [CrossRef]
  20. Kesarwani, H.; Saxena, A.; Mandal, A.; Sharma, S. Anionic/nonionic surfactant mixture for enhanced oil recovery through the investigation of adsorption, interfacial, rheological, and rock wetting characteristics. Energy Fuels 2021, 35, 3065–3078. [Google Scholar] [CrossRef]
  21. Yang, H.; Britton, C.; Liyanage, P.J.; Solairaj, S.; Kim, D.H.; Nguyen, Q.; Weerasooriya, U.; Pope, G.A. Low-cost, high-performance chemicals for enhanced oil recovery. In Proceedings of the SPE—DOE Improved Oil Recovery Symposium Proceedings, Tulsa, OK, USA, 24–28 April 2010; Volume 2. [Google Scholar]
  22. Jia, H.; Leng, X.; Hu, M.; Song, Y.; Wu, H.; Lian, P.; Liang, Y.; Zhu, Y.; Liu, J.; Zhou, H. Systematic investigation of the effects of mixed cationic/anionic surfactants on the interfacial tension of a water/model oil system and their application to enhance crude oil recovery. Colloids Surfaces A Physicochem. Eng. Asp. 2017, 529, 621–627. [Google Scholar] [CrossRef]
  23. Zhang, L.; Liu, Z.Y.; Li, Z.Q.; Song, X.W.; Zhang, J.C.; Zhang, L.; Zhao, S. Dynamic interfacial tensions of binary nonionic-anionic and nonionic surfactant mixtures at water-alkane interfaces. Fuel 2014, 135, 91–98. [Google Scholar] [CrossRef]
  24. Mulqueen, M.; Blankschtein, D. Theoretical and experimental investigation of the equilibrium oil-water interfacial tensions of solutions containing surfactant mixtures. Langmuir 2002, 18, 365–376. [Google Scholar] [CrossRef]
  25. Karnanda, W.; Benzagouta, M.S.; AlQuraishi, A.; Amro, M.M. Effect of temperature, pressure, salinity, and surfactant concentration on IFT for surfactant flooding optimization. Arab. J. Geosci. 2013, 6, 3535–3544. [Google Scholar] [CrossRef]
  26. Belhaj, A.F.; Elraies, K.A.; Mahmood, S.M.; Zulkifli, N.N.; Akbari, S.; Hussien, O.S.E. The effect of surfactant concentration, salinity, temperature, and pH on surfactant adsorption for chemical enhanced oil recovery: A review. J. Pet. Explor. Prod. Technol. 2020, 10, 125–137. [Google Scholar] [CrossRef] [Green Version]
  27. Negin, C.; Ali, S.; Xie, Q. Most common surfactants employed in chemical enhanced oil recovery. Petroleum 2017, 3, 197–211. [Google Scholar] [CrossRef]
  28. Kurnia, I.; Zhang, G.; Han, X.; Yu, J. Zwitterionic-anionic surfactant mixture for chemical enhanced oil recovery without alkali. Fuel 2020, 259, 116236. [Google Scholar] [CrossRef]
  29. Manrique, E.; Gurfinkel, M.; Muci, V. Enhanced Oil Recovery Field Experiences in Carbonate Reservoirs in the United States EOR in U.S. Carbonate Reservoirs. In Proceedings of the 25th Annual Workshop & Symposium Collaborative Project on Enhanced Oil Recovery, International Energy Agency, Stavanger, Norway, 5–8 September 2004. [Google Scholar]
  30. Varfolomeev, M.A.; Ziniukov, R.A.; Yuan, C.; Khairtdinov, R.K.; Sitnov, S.A.; Sudakov, V.A.; Zhdanov, M.V.; Mustafin, A.Z.; Usmanov, S.A.; Sattarov, A.I.; et al. Optimization of carbonate heavy oil reservoir development using surfactant flooding: From laboratory screening to pilot test. In Proceedings of the Society of Petroleum Engineers—SPE Russian Petroleum Technology Conference 2020, RPTC 2020, Virtual, 26–29 October 2020. [Google Scholar]
  31. Aoudia, M.; Al-Maamari, R.S.; Nabipour, M.; Al-Bemani, A.S.; Ayatollahi, S. Laboratory study of alkyl ether sulfonates for improved oil recovery in high-salinity carbonate reservoirs: A case study. Energy Fuels 2010, 24, 3655–3660. [Google Scholar] [CrossRef]
Figure 1. XRD analysis of the mineralogical composition of core material for Bashkirian (a) and Vereian (b) production zones.
Energies 15 00411 g001
Figure 2. X-ray scans of cores used in the experiments from different production zones: (a) Bashkirian stage, (b) the Vereian horizon. Black area—voids, gray area—the texture core.
Energies 15 00411 g002
Figure 3. Schematic diagram of the filtration setup. PP-1, PP-2—high pressure plunger pumps; V1–V18—needle valves; C1–C4—piston liquid containers; P1–P5—gauge pressure sensors; DD—differential pressure sensor; CH-1—core holder; CC—climate chamber; MC—measuring cylinder; MHP—manual hydraulic pump; BPR—back pressure regulator.
Energies 15 00411 g003
Figure 4. IFT measurements of 0.3% surfactant solutions. Square dots—Bashkirian stage, round dots—Vereian horizon.
Energies 15 00411 g004
Figure 5. Contact angle of formation water drop at Bashkirian stage core: (a) Initial (the core is saturated with brine); (b) After 1 h of aging in Composition-1 solution; (c) After 4 h of aging in Composition-1 solution; (d) After 24 h of aging in Composition-1 solution.
Energies 15 00411 g005
Figure 6. Photo of cores (Bashkirian stage) and displaced oil in the Amott cells: (a) Initial (brine) after 1 day; (b) After 1 day of aging in Composition-1 solution; (c) After 10 days of aging in Composition-1 solution; (d) After 19 days of aging in Composition-1 solution; (e) After 30 days of aging in Composition-1 solution; (f) General view of the Amott cells.
Energies 15 00411 g006
Figure 7. Displacement rate and oil displacement coefficient during capillary impregnation for Bashkirian stage cores of: (a) oil; (b) microemulsion; (c) dynamic of oil displacement coefficient during Amott cell experiment, KIORF unit fraction.
Energies 15 00411 g007
Figure 8. Displacement rate and oil displacement coefficient during spontaneous imbibition for Vereian horizon cores of: (a) oil; (b) microemulsion; (c) dynamic of oil displacement coefficient during Amott cell experiment, KIORF unit fraction.
Energies 15 00411 g008
Figure 9. Comparison of the effect of surfactants on injectivity and oil displacement coefficient during spontaneous imbibition (KIORF).
Energies 15 00411 g009
Figure 10. Comparison of the effect of surfactants on IFT and additional oil recovery. Rectangles—Vereian horizon, Circles—Bashkirian stage.
Energies 15 00411 g010
Table 1. Water analysis.
IonsIon Content, mg/L
HCO3−146.45
SO42−7308.04
Cl159,570
Ca2+9819.6
Mg2+5958.4
Na+84529.6
K+56.63
ParameterValue
Density, g/cm31.15
pH7.18
Table 2. Crude oil properties.
Production ZonesDensity, g/cm3Dynamic Viscosity, mPa·s
(V)0.9251133.42
(B)0.9313155.73
Table 3. Surfactants’ properties.
SurfactantTypeActive Matter Concentration, %
1SAA-1Anionic100
2SAA-2Cationic31.5
3Composition-1Cationic + Nonionic98
4Composition-2Anionic + Nonionic98
Table 4. Results of tests for solubility and long-term stability.
SurfactantSolubilityStability (after 14 Days)
1SAA-1TransparentTransparent
2SAA-2TransparentTransparent
3Composition-1TransparentTransparent
4Composition-2CloudySlight Cloudy
Table 5. Results of IFT measurements.
SurfactantOil TypeStabilized IFT (mN/m)
1No surfactant (brine)(B)14.7
(V)8.2
2SAA-1(B)0.511
(V)0.537
3SAA-2(B)0.321
(V)0.360
4Composition-1(B)0.050
(V)0.080
5Composition-2(B)0.139
(V)0.140
Table 6. Measurement of the contact angle for Bashkirian stage.
SurfactantBrine1 h4 h24 h
SAA-193.157.200
SAA-296.586.600
Composition-1104.588.500
Composition-296.799.238.937.6
Table 7. Measurement of the contact angle for Vereian horizon.
SurfactantBrine1 h4 h24 h
SAA-1112.961.600
SAA-2100.979.800
Composition-1110.48000
Composition-2123.3102.92412.6
Table 8. Spontaneous imbibition results.
SurfactantSample Oil Content (Voj), mLOil Displaced (Vo), mLMicroemulsion Volume (Vme), mLOil Recovery Factor during Imbibition (KIORF)
Bashkirian stage
1Brine4.050.2900.36
2SAA-13.970.3800.1
3SAA-25.432.331.460.46
4Composition-13.761.33.20.78
5Composition-24.932.120.10.43
Vereian horizon
1Brine6.710.2800.04
2SAA-13.450.70.50.22
3SAA-25.640.491.20.11
4Composition-15.730.62.80.35
5Composition-24.490.340.980.23
Table 9. Experimental data on filtration experiments’ surfactant concentration 0.3% mass.
SurfactantORF, %AORF, %ORF+AORF, %KIKORF
Bashkirian stage
1SSA-10.500.000.501.1380.00
2SSA-20.580.040.621.0690.07
3Composition-10.390.090.491.970.19
4Composition-20.560.070.631.1790.11
Vereian horizon
1SSA-10.300.000.301.520.01
2SSA-20.450.080.531.0240.16
3Composition-10.420.270.691.350.40
4Composition-20.490.170.661.5560.26
Publisher’s Note: MDPI stays neutral with regard to jurisdictional claims in published maps and institutional affiliations.

