
Effect of Different Plenum-Chamber Coefficients on the Frosting of Air-Cooler

 ,
,  ,
, 
Abstract
:1. Introduction
2. Materials and Methods
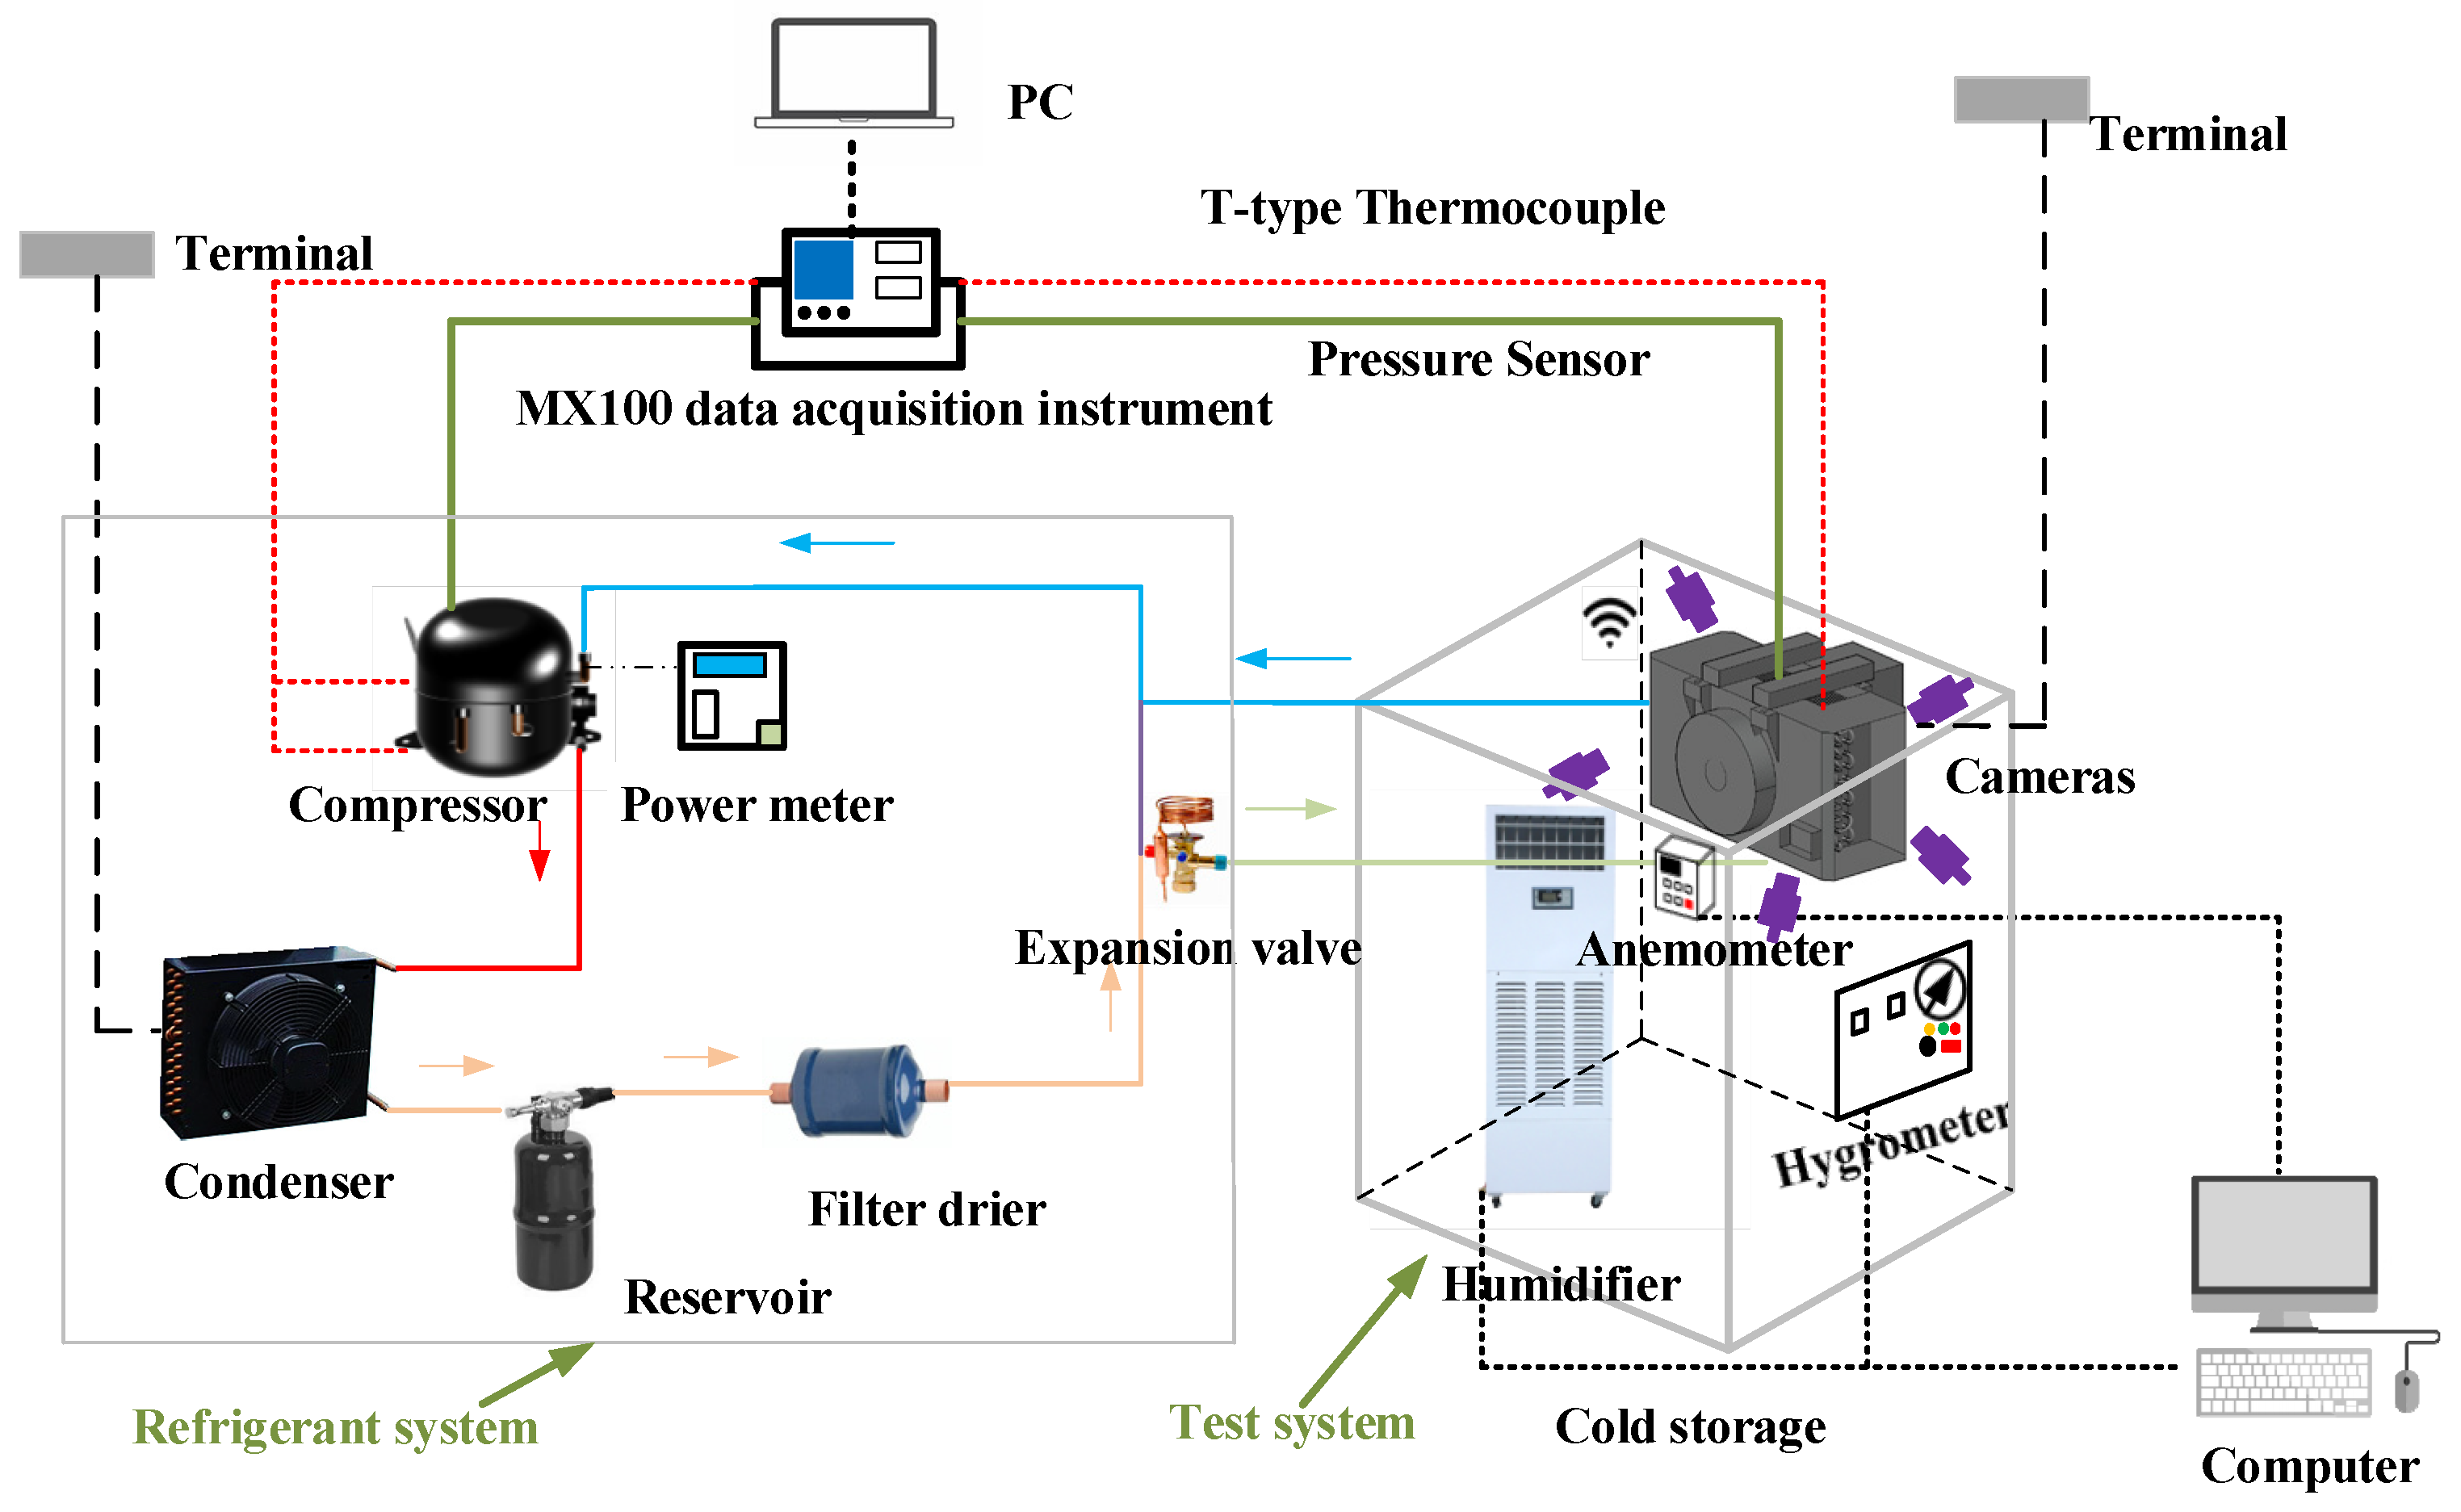
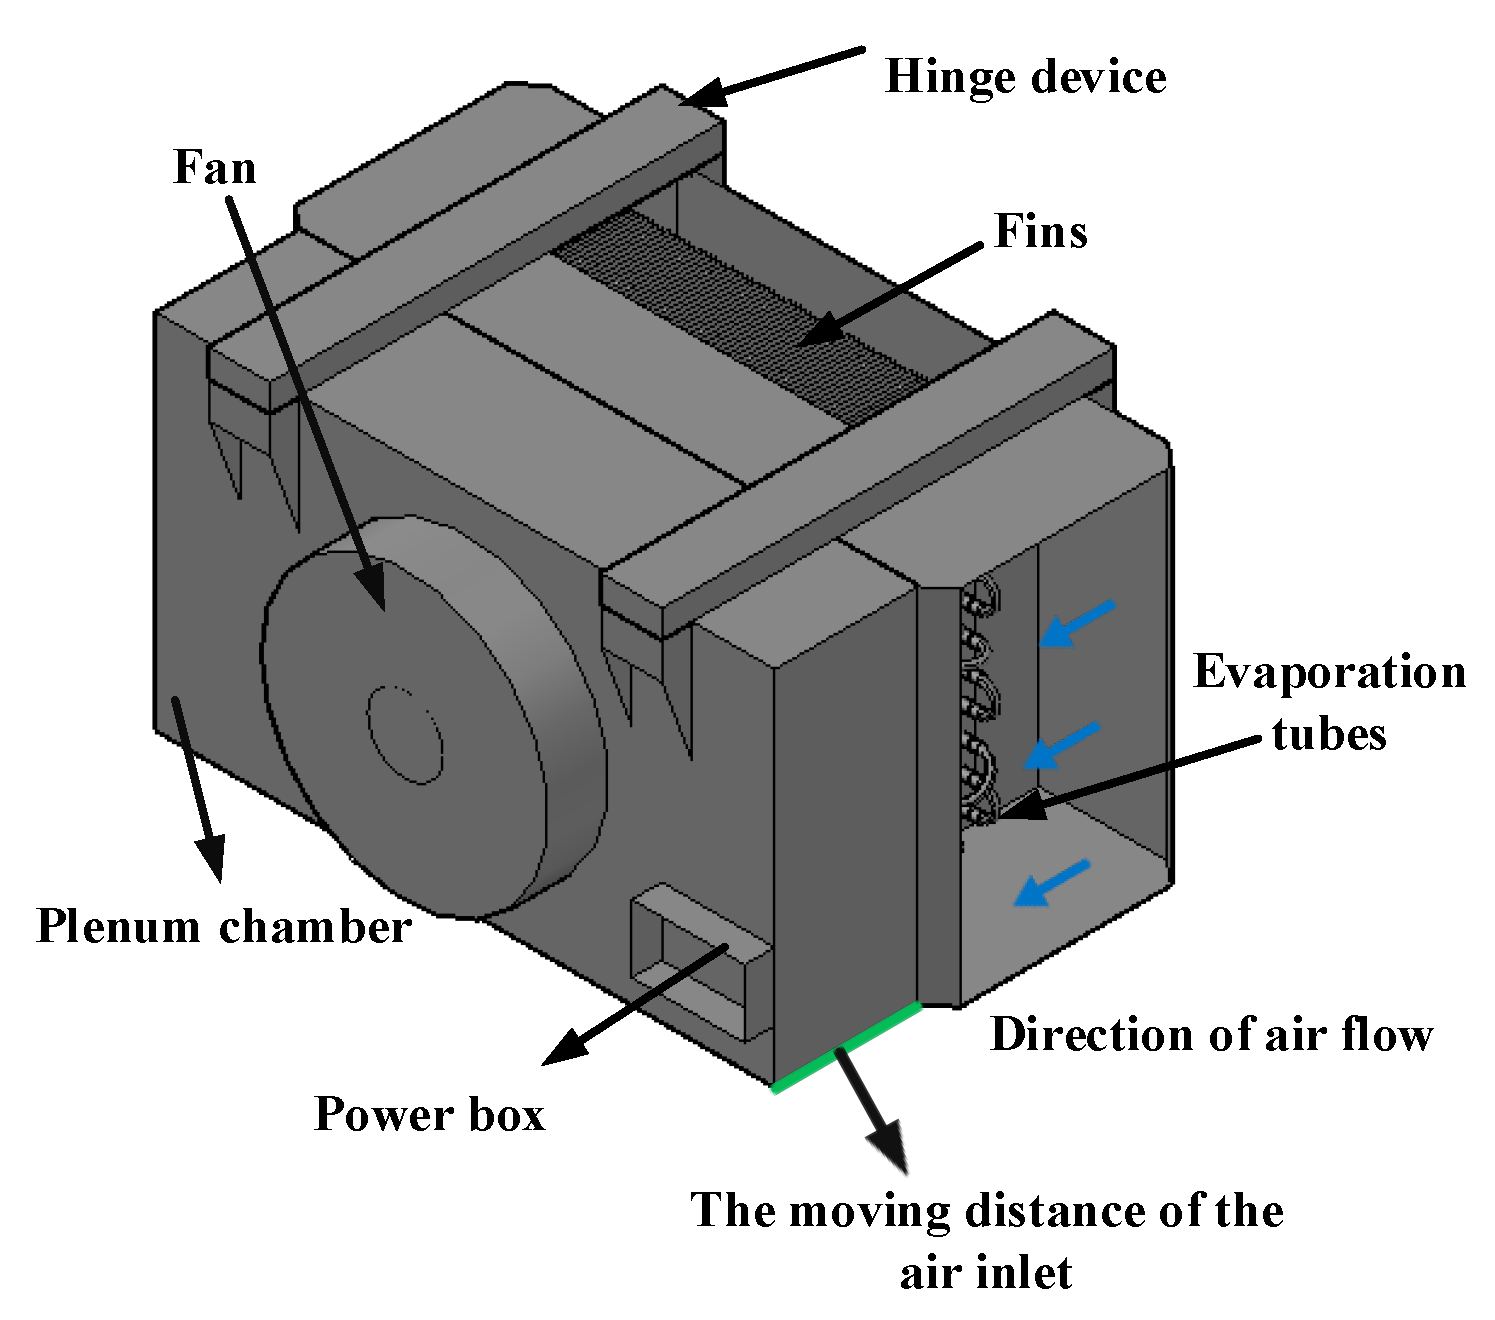
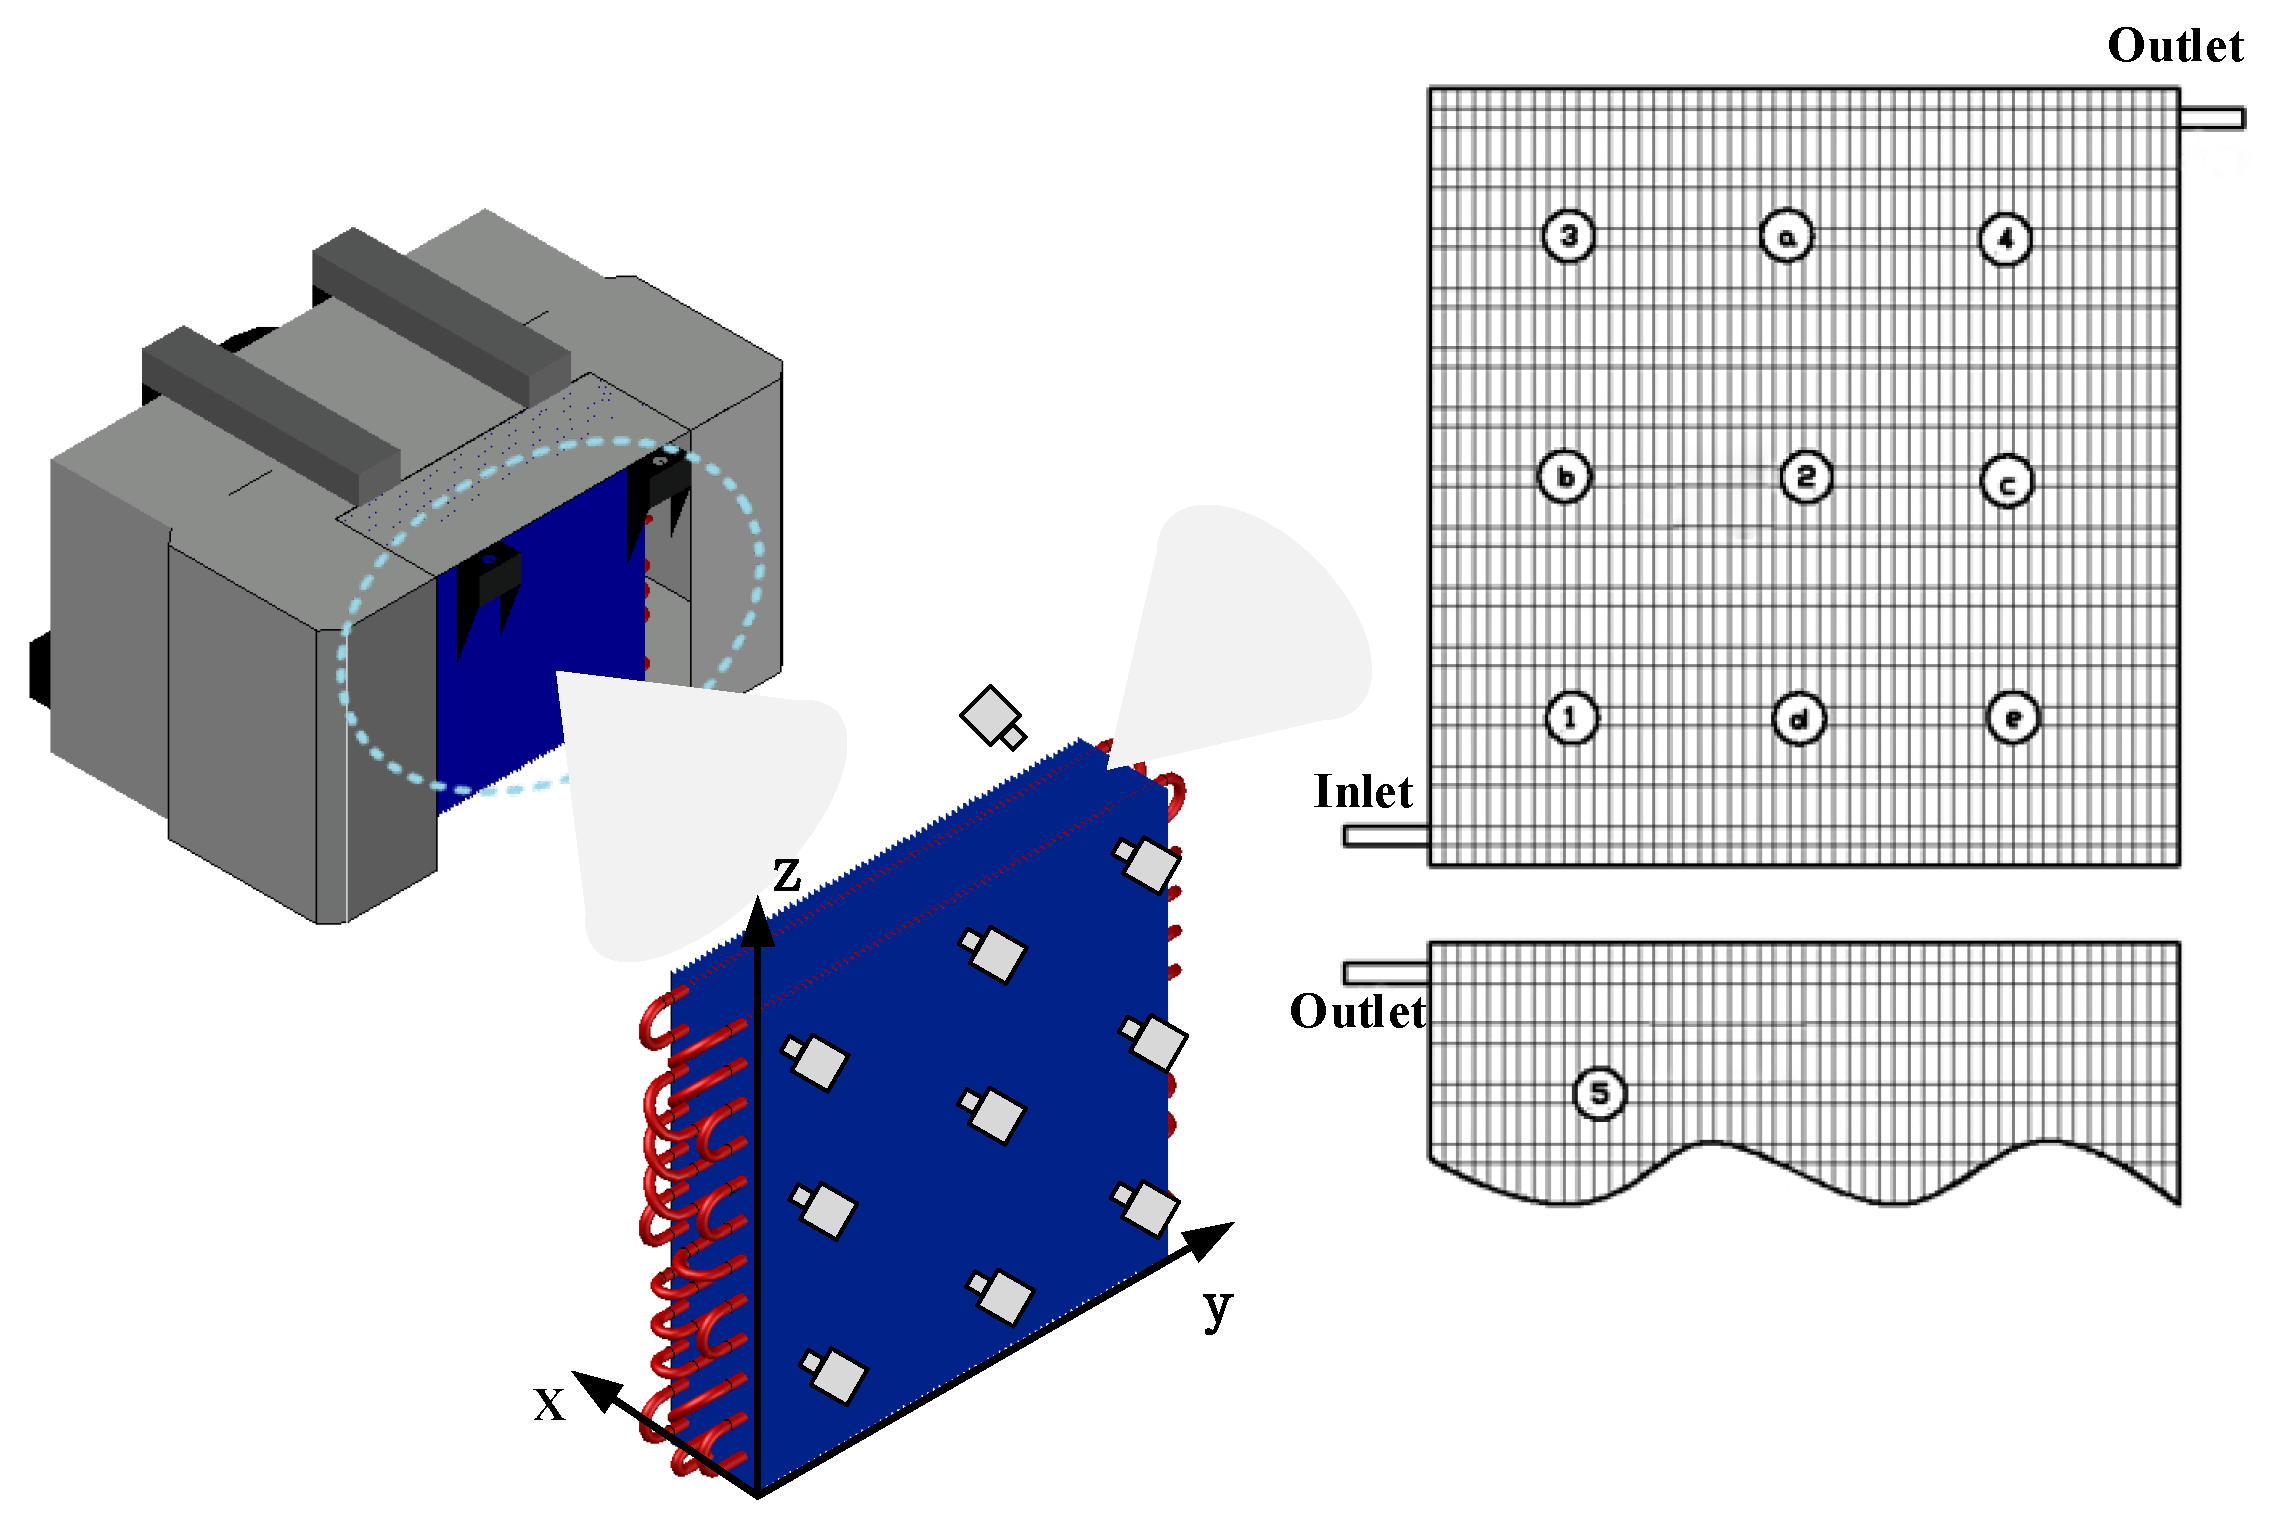
2.1. Experimental Facility
2.2. Experimental Procedures
- (1)
- According to the schematic diagram of the experiment, the compressor, air-cooled condenser, reservoir, drying filter, expansion valve, air-cooler, and other components used in the experiment are connected, and the pressure measuring point is welded at the same time.
- (2)
- The cold section of the system is treated with heat preservation.
- (3)
- A vacuum pump is used to vacuum the suction port of the compressor for 2 h, carry out the pressure holding treatment, observe the pressure change, and correct the indication of the pressure sensor on the computer end.
- (4)
- The measuring points are placed at the targeted temperature and humidity. We connect the data acquisition instrument, adjust the settings to the required mode, and wait for the experiment to evolve.
2.3. The Conditions of Experiment
3. Results
3.1. The Influence of Different Plenum-Chamber Coefficients on Air Flow Rate
3.2. The Influence of Different Plenum-Chamber Coefficients on the System under High Humidity
3.3. The Influence of Different Plenum-Chamber Coefficients on the System under Low Humidity
4. Derivation of Dimensionless Analytic Fitting Curves
4.1. Dimensionless Relation for Frosting on Air-Cooler Fins
4.2. Dimensionless Relation for Frosting on Air-Cooler Tubes
5. Conclusions
- (1)
- The uniformity of the air speed field is enhanced with the increase in the plenum-chamber coefficient, but its average velocity decreases.
- (2)
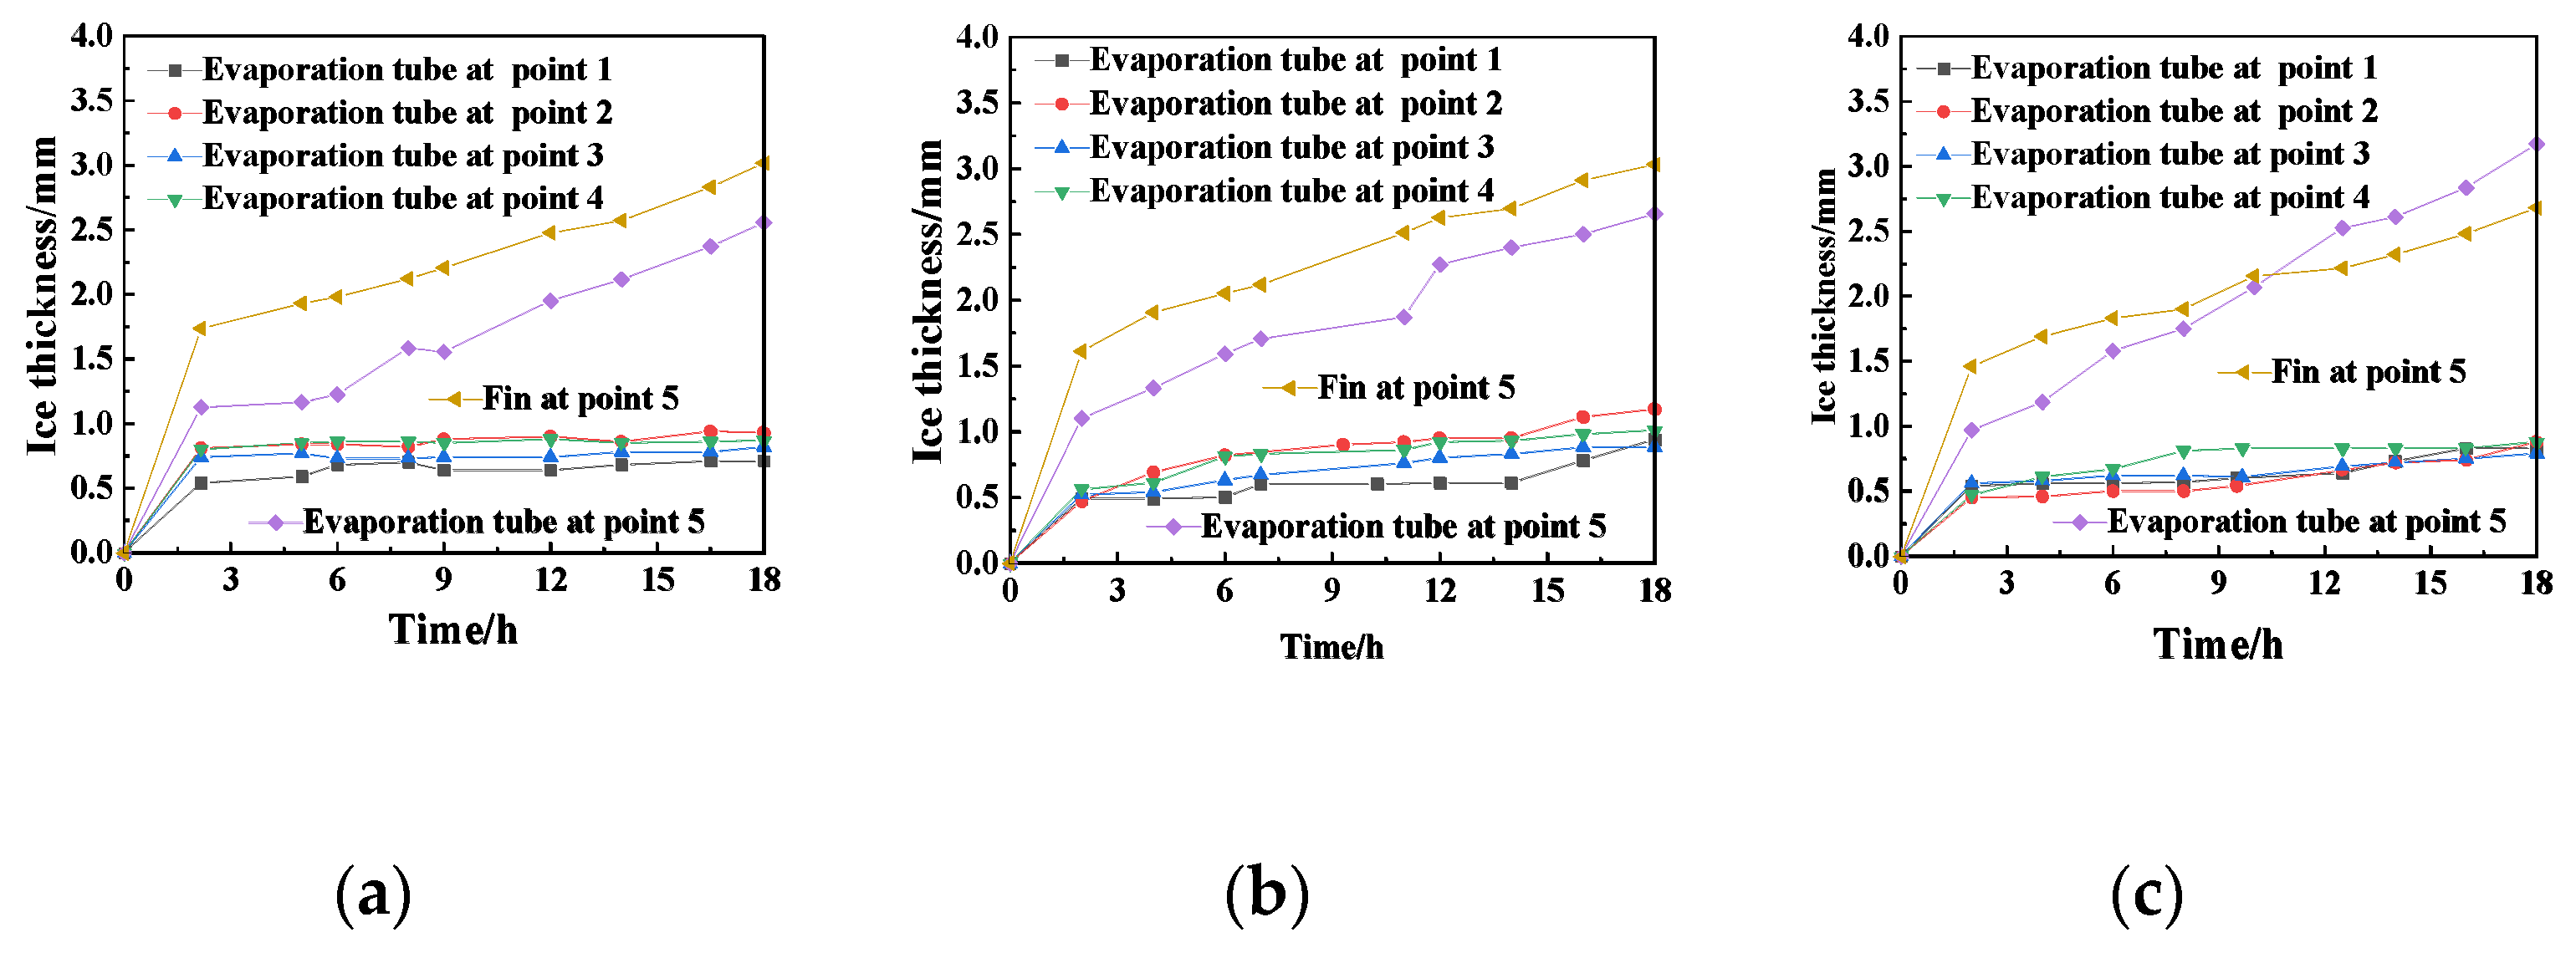
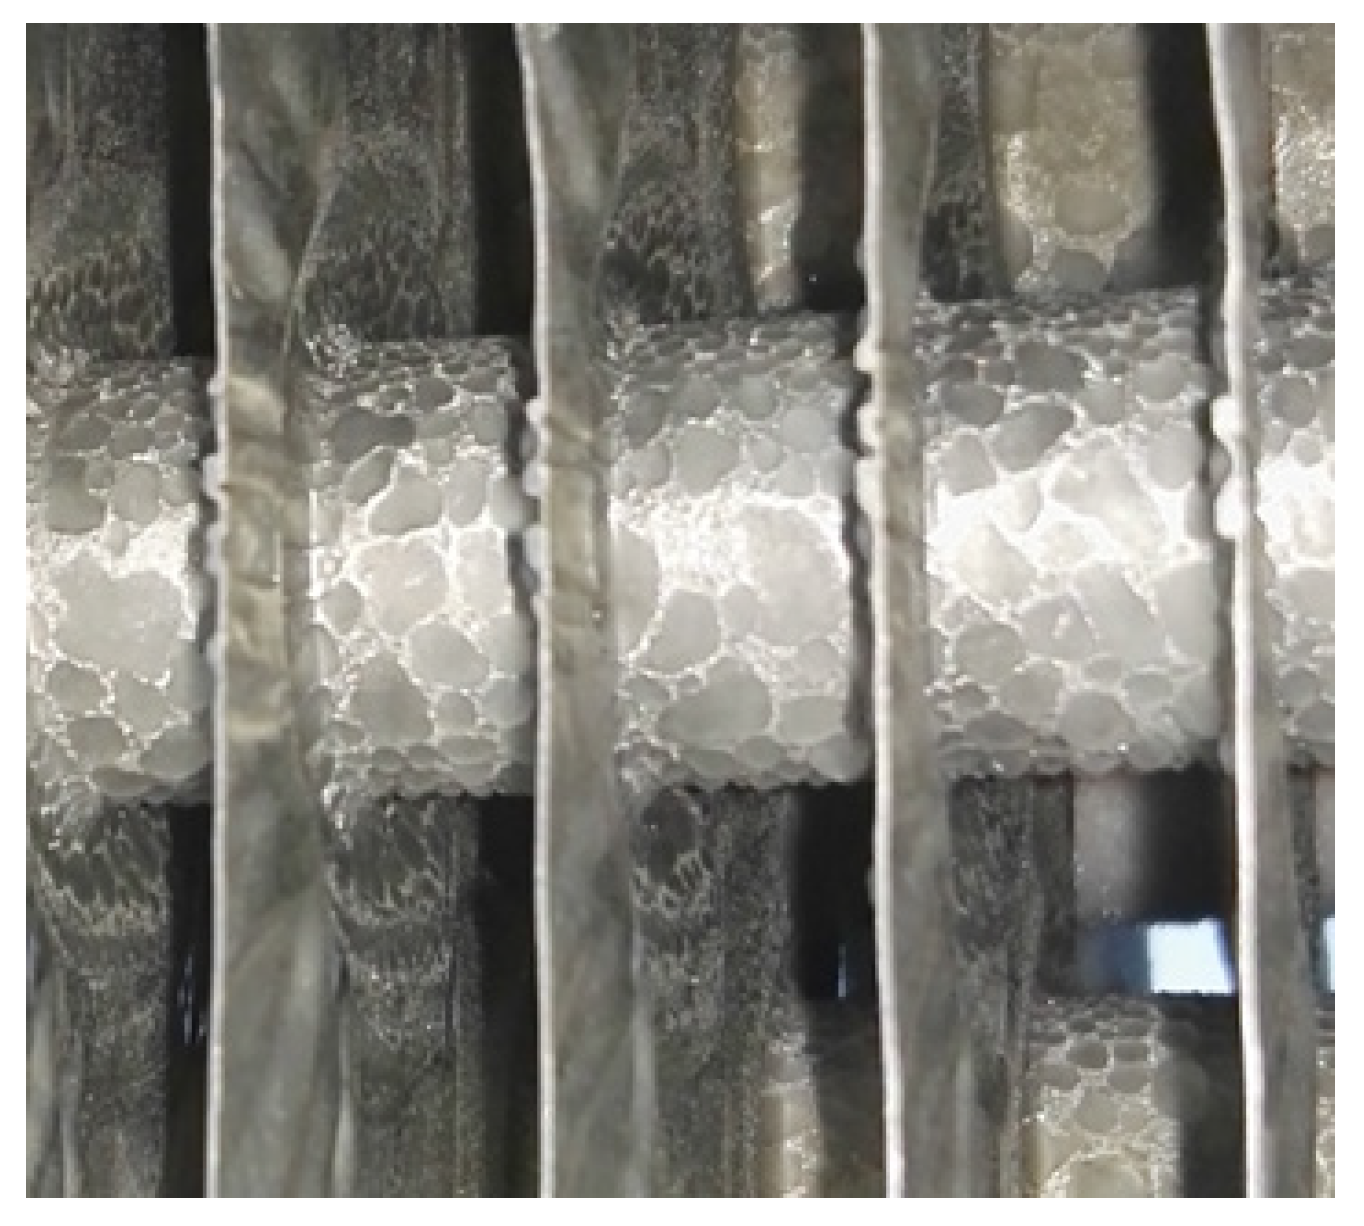
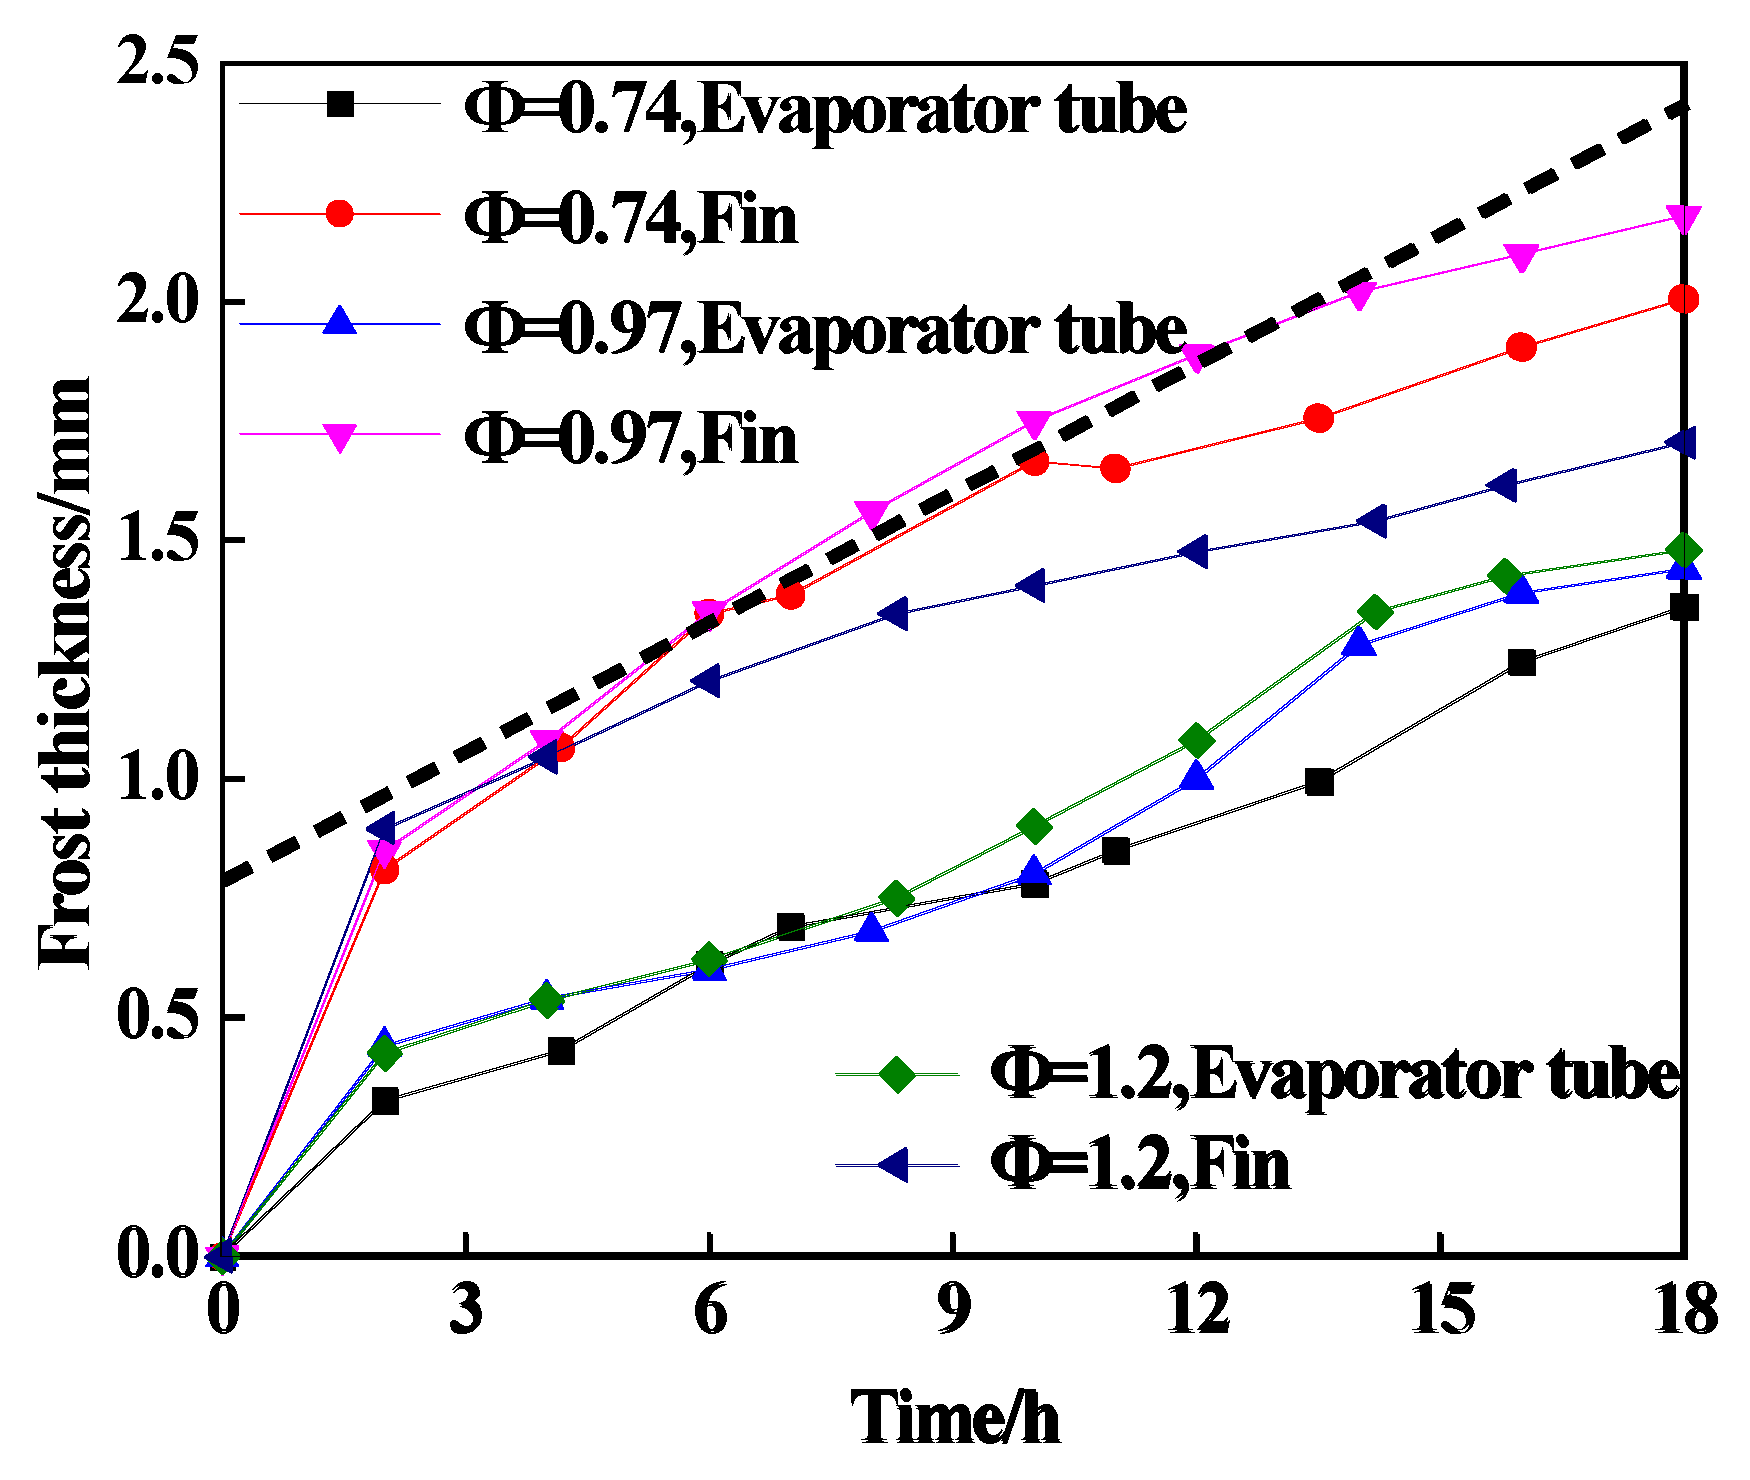
- After 2 h, the frost layer growth of evaporator tubes, and fins at measuring point 5 showed a linear growth.
- (3)
- Under the high humidity condition, the thickness of the frost layer on the evaporator tube increases with the increase in the plenum-chamber coefficients, and the frost layer thickness on the fins first increases and then decreases with the increase in the plenum-chamber coefficients.
- (4)
- Under the low humidity condition (Φ = 0.97), the maximum frosting thickness of the fin at the five measuring points is 2.18 mm, but the frosting thickness is still very different from that of the high humidity condition. This suggests that humidity is an important factor in frost formation
- (5)
- The fitting curves of the fin are, respectively:
- (6)
- The fitting curve of the evaporation tube is:
Author Contributions
Funding
Conflicts of Interest
References
- Deng, D.; Xu, L.; Xu, S. Experimental investigation on the performance of air cooler under frosting conditions. Appl. Therm. Eng. 2003, 23, 905–912. [Google Scholar] [CrossRef]
- Bayrak, E.; Çağlayan, A.; Konukman, A.E.S. Experimental investigation of the effect of air velocity on a unit cooler under frosting condition: A case study. Heat Mass Transf. 2017, 53, 3119–3128. [Google Scholar] [CrossRef] [Green Version]
- Liu, Z.; Wang, H.; Zhang, X.; Meng, S.; Ma, C. An experimental study on minimizing frost deposition on a cold surface under natural convection conditions by use of a novel anti-frosting paint. Part I. Anti-frosting performance and comparison with the uncoated metallic surface. Int. J. Refrig. 2006, 29, 229–236. [Google Scholar] [CrossRef]
- Song, M.; Dang, C. Review on the measurement and calculation of frost characteristics. Int. J. Heat Mass Transf. 2018, 124, 586–614. [Google Scholar] [CrossRef]
- Nasr, M.R.; Fauchoux, M.; Besant, R.W.; Simonson, C.J. A review of frosting in air-to-air energy exchangers. Renew. Sustain. Energy Rev. 2014, 30, 538–554. [Google Scholar] [CrossRef]
- Chu, F.; Wu, X.; Wang, L. Meltwater evolution during defrosting on superhydrophobic surfaces. ACS Appl. Mater. Interfaces 2018, 10, 1415–1421. [Google Scholar] [CrossRef]
- Lee, Y.B.; Ro, S.T. Frost formation on a vertical plate in simultaneously developing flow. Exp. Therm. Fluid Sci. 2002, 26, 939–945. [Google Scholar] [CrossRef]
- Lai, T.; Ding, P.; Dong, X.; Zhang, B.; Chen, X.; Hou, Y. Experimental study on the frosting characteristics of round tube in confined circular flow path at low temperature. Appl. Therm. Eng. 2020, 171, 115075. [Google Scholar] [CrossRef]
- Cheng, C.; Wu, K. Observations of early-stage frost formation on a cold plate in atmospheric air flow. J. Heat Transf. 2003, 125, 95–102. [Google Scholar] [CrossRef]
- Ye, H.-Y.; Park, J.-S.; Lee, K.-S. Frost retardation on fin-tube heat exchangers using mass transfer characteristics with respect to air velocity. Int. J. Heat Mass Transf. 2014, 79, 689–693. [Google Scholar] [CrossRef]
- Yan, W.-M.; Li, H.-Y.; Wu, Y.-J.; Lin, J.-Y.; Chang, W.-R. Performance of finned tube heat exchangers operating under frosting conditions. Int. J. Heat Mass Transf. 2003, 46, 871–877. [Google Scholar] [CrossRef]
- Seker, D.; Karatas, H.; Egrican, N. Frost formation on fin-and-tube heat exchangers. Part II—Experimental investigation of frost formation on fin-and-tube heat exchangers. Int. J. Refrig. 2004, 27, 375–377. [Google Scholar] [CrossRef]
- Liu, Z.; Dong, Y.; Li, Y. An experimental study of frost formation on cryogenic surfaces under natural convection conditions. Int. J. Heat Mass Transf. 2016, 97, 569–577. [Google Scholar] [CrossRef]
- Wu, X.; Chu, F.; Ma, Q.; Zhu, B. Frost formation and frost meltwater drainage characteristics on aluminum surfaces with grooved structures. Appl. Therm. Eng. 2017, 118, 448–454. [Google Scholar] [CrossRef]
- Ren, L.; Jiao, W.; Tian, G.; Tian, X.; Liu, S. Frosting characteristics and prediction of thickness of frost layer on a finned tube in regasification process of cryogenic liquids. Int. J. Refrig. 2021, 129, 52–59. [Google Scholar] [CrossRef]
- Rahman, M.A.; Jacobi, A.M. Condensation, frost formation, and frost melt-water retention characteristics on microgrooved brass surfaces under natural convection. Heat Transf. Eng. 2013, 34, 1147–1155. [Google Scholar] [CrossRef]
- Chen, C.; Shiu, C. Frost formation and frost crystal growth on a cold plate in atmospheric air flow. Int. J. Heat Mass Transf. 2002, 45, 4289–4303. [Google Scholar] [CrossRef]
- Kim, D.; Kim, C.; Lee, K. Frosting model for predicting macroscopic and local frost behaviors on a cold plate. Int. J. Heat Mass Transf. 2015, 82, 135–142. [Google Scholar] [CrossRef]
- Wu, X.; Ma, Q.; Chu, F.; Hu, S. Phase change mass transfer model for frost growth and densification. Int. J. Heat Mass Transf. 2016, 96, 11–19. [Google Scholar] [CrossRef]
- Negrelli, S.; Cardoso, R.P.; Hermes, C.J.L. A finite-volume diffusion-limited aggregation model for predicting the effective thermal conductivity of frost. Int. J. Heat Mass Transf. 2016, 101, 1263–1272. [Google Scholar] [CrossRef]
- Brèque, F.; Nemer, M. Frosting modeling on a cold flat plate: Comparison of the different assumptions and impacts on frost growth predictions. Int. J. Refrig. 2016, 69, 340–360. [Google Scholar] [CrossRef]
- Benítez, T.; Sherif, S.A. Modeling spatial and temporal frost formation with distributed properties on a flat plate using the orthogonal collocation method. Int. J. Refrig. 2017, 76, 193–205. [Google Scholar] [CrossRef]
- Liu, X.; Yu, J.; Yan, G. An experimental study on the air side heat transfer performance of the perforated fin-tube heat exchangers under the frosting conditions. Appl. Therm. Eng. 2020, 166, 114634. [Google Scholar] [CrossRef]
- Ren, L.; Jiao, W.; Tian, X.; Liu, T. Effect of frost layer on heat transfer of cryogenic fluid in a finned tube. Cryogenics 2020, 109, 103115. [Google Scholar] [CrossRef]
- Dietenberger, M.A. Generalized correlation of the water frost thermal conductivity. Int. J. Heat Mass Transf. 1983, 26, 607–619. [Google Scholar] [CrossRef]
- Tao, Y.-X.; Besant, R.W.; Rezkallah, K.S. A mathematical model for predicting the densification and growth of frost on a flat plate. Int. J. Heat Mass Transf. 1993, 36, 353–363. [Google Scholar] [CrossRef]


| Parameter | Devices | Type | Range | Accuracy |
|---|---|---|---|---|
| Ambient/cold storage/Inlet and outlet of the compressor/Air inlet and outlet of the air-cooler temperature | Thermocouple | T-type Thermocouple | 73.15 K to 623.15 K | ±0.75% |
| Compressor inlet and exhaust pipe pressure | Pressure Sensor | EET-100 | 0 MPa to 12 MPa | ±0.5% FS |
| Humidity in cold storage | Humidifier | SJ-01 | 268.15 K to 313.15 K | - |
| Inlet and outlet humidity of the air-cooler | Hygrometer | CF5020Y | 0 RH to 100% RH | ±2% |
| Air speed of air inlet surface of the air-cooler | Anemometer | 6243 Multipoint Anemometer | 0 m/s to 9.9 m/s | ±0.01 m/s |
| Compressor power | Power meter | WT310E power meter | 0 V to 600 V 0 A to 20 A | ±0.5% |
| No. | Plenum-Chamber Coefficient Φ | Initial Temperature of Cold Storage (K) | Relative Humidity (%) | Moisture Content wa (g/kg) |
|---|---|---|---|---|
| 1 | 0.74 | 291.65 | 88 | 11.75 |
| 2 | 0.97 | 292.65 | 89 | 12.58 |
| 3 | 1.2 | 292.15 | 87 | 11.97 |
| 4 | 0.74 | 294.75 | 65 | 10.65 |
| 5 | 0.97 | 295.85 | 65 | 11.25 |
| 6 | 1.2 | 294.95 | 65 | 10.56 |
| Plenum-Chamber Coefficient Φ | Point 3 | Point a | Point 4 | Point b | Point 2 | Point c | Point 1 | Point d | Point e |
|---|---|---|---|---|---|---|---|---|---|
| 0.74 | 3.05 | 2.93 | 3.45 | 2.85 | 2.72 | 3.14 | 3.26 | 2.86 | 3.04 |
| 0.97 | 2.9 | 2.78 | 3.15 | 2.71 | 2.58 | 2.78 | 3.12 | 2.79 | 2.85 |
| 1.2 | 2.86 | 2.56 | 2.69 | 2.72 | 2.35 | 2.56 | 2.67 | 2.75 | 2.77 |
| 6 h | 12 h | 18 h | |||||||
|---|---|---|---|---|---|---|---|---|---|
| Φ = 0.74 | Φ = 0.97 | Φ = 1.2 | Φ = 0.74 | Φ = 0.97 | Φ = 1.2 | Φ = 0.74 | Φ = 0.97 | Φ = 1.2 | |
| 1 |  |  |  | 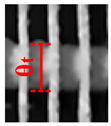 | 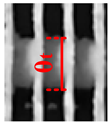 |  | 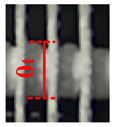 | 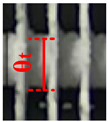 | 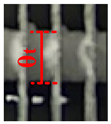 |
| θt = 14.06 | θt = 13.7 | θt = 13.82 | θt = 14 | θt = 13.91 | θt = 13.98 | θt = 14.12 | θt = 14.58 | θt = 14.33 | |
| 2 | 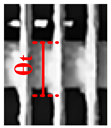 | 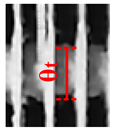 | 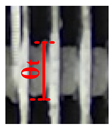 | 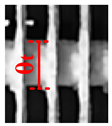 | 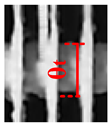 | 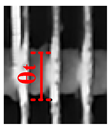 | 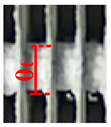 |  | 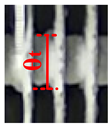 |
| θt = 14.38 | θt = 14.34 | θt = 13.7 | θt = 14.5 | θt = 14.6 | θt = 14.02 | θt = 14.56 | θt = 15.04 | θt = 14.46 | |
| 3 | 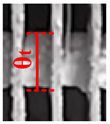 | 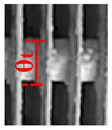 | 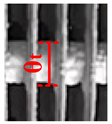 |  |  | 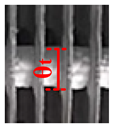 |  | 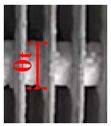 |  |
| θt = 14 | θt = 13.96 | θt = 13.94 | θt = 14.16 | θt = 14.3 | θt = 14.08 | θt = 14.34 | θt = 14.46 | θt = 14.28 | |
| 4 | 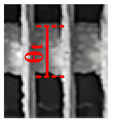 | 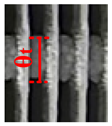 | 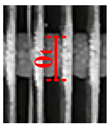 | 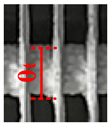 | 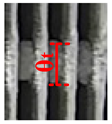 | 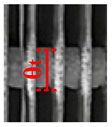 | 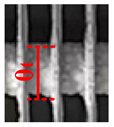 | 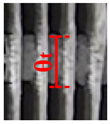 | 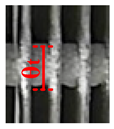 |
| θt = 14.42 | θt = 14.32 | θt = 14.04 | θt = 14.46 | θt = 14.54 | θt = 14.36 | θt = 14.44 | θt = 14.72 | θt = 14.46 | |
| 5 | 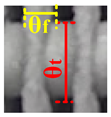 | 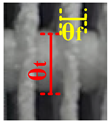 | 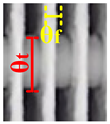 | 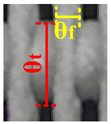 | 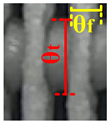 | 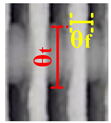 | 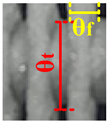 | 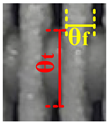 |  |
| θt = 15.15 θf = 4.9 | θt = 15.88 θf = 5.31 | θt = 15.86 θf = 4.9 | θt = 16.6 θf = 5.89 | θt = 17.24 θf = 5.46 | θt = 17.75 θf = 5.67 | θt = 17.81 θf = 6.97 | θt = 18.01 θf = 7.27 | θt = 19.04 θf = 6.6 | |
| Φ = 0.74 | Φ = 0.97 | Φ = 1.2 |
|---|---|---|
 | 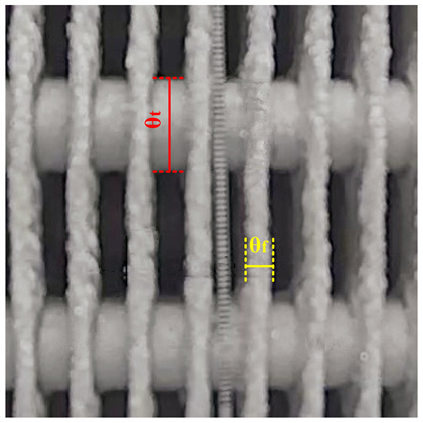 | 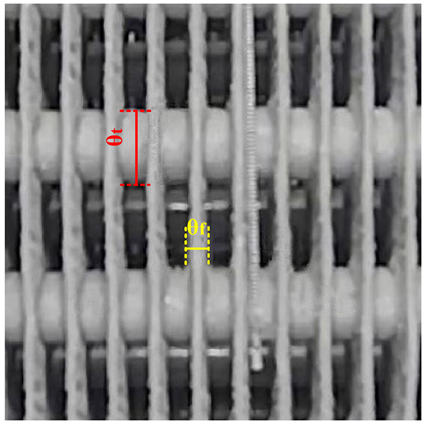 |
| θt = 15.42 θf = 4.97 | θt = 15.58 θf = 5.35 | θt = 15.66 θf = 4.31 |
| No. | Time τ (h) | Inlet Air Speed vin (m/s) | Wet Air Temperature Ta (K) | Relative Humidity (%) | Moisture Content wa (g/kg) | Fin Temperature Tw (K) | Density ρ (kg/m3) | M* |
|---|---|---|---|---|---|---|---|---|
| 1 | 2 | 2.42 | 269.45 | 85 | 2.43 | 265.75 | 200.0 | 0.35 |
| 2 | 11.5 | 1.7 | 265.15 | 80 | 1.66 | 263.35 | 165.6 | 0.50 |
| 3 | 2 | 2.34 | 269.75 | 85 | 2.51 | 265.95 | 207.3 | 0.33 |
| 4 | 2 | 2.14 | 269.15 | 83 | 2.33 | 265.55 | 196.5 | 0.30 |
| 5 | 11.5 | 1.48 | 264.95 | 78 | 1.59 | 262.55 | 161.3 | 0.45 |
| 6 | 2 | 3.25 | 267.05 | 79 | 1.88 | 265.05 | 212.4 | 0.17 |
| 7 | 11.5 | 2.56 | 264.35 | 78 | 1.52 | 262.55 | 189.4 | 0.33 |
| 8 | 2 | 2.43 | 267.15 | 76 | 1.83 | 265.05 | 202.9 | 0.18 |
| 9 | 11.5 | 2.14 | 263.85 | 75 | 1.39 | 262.25 | 176.1 | 0.28 |
| 10 | 10 | 2.2 | 264.55 | 79 | 1.55 | 262.55 | 173.4 | 0.31 |
| No. | FoL | T* | ReL,fin | Moisture Content wa (g/kg) | M* |
|---|---|---|---|---|---|
| 1 | 896 | 1 | 25,282 | 2.43 | 0.35 |
| 2 | 3201 | 4.44 | 17,760 | 1.66 | 0.50 |
| 3 | 1035 | 0.89 | 24,446 | 2.51 | 0.33 |
| 4 | 1260 | 1.11 | 22,357 | 2.33 | 0.30 |
| 5 | 3950 | 3.42 | 15,462 | 1.59 | 0.45 |
| 6 | 4076 | 3.05 | 33,953 | 1.88 | 0.17 |
| 7 | 7266 | 4.89 | 26,744 | 1.52 | 0.33 |
| 8 | 3314 | 2.86 | 25,386 | 1.83 | 0.18 |
| 9 | 9915 | 5.81 | 22,357 | 1.39 | 0.28 |
| 10 | 7252 | 4.10 | 22,983 | 1.55 | 0.31 |
| No. | FoL | T* | ReL,fin | Moisture Content wa (g/kg) | M* |
|---|---|---|---|---|---|
| 1 | 2138 | 0.46 | 2459 | 2.43 | 0.06 |
| 2 | 5349 | 2.35 | 1727 | 1.66 | 0.09 |
| 3 | 2216 | 0.62 | 2377 | 2.51 | 0.06 |
| 4 | 2855 | 0.73 | 2174 | 2.33 | 0.05 |
| 5 | 3451 | 2.16 | 1504 | 1.59 | 0.12 |
| 6 | 26,118 | 1.49 | 3302 | 1.88 | 0.02 |
| 7 | 24,321 | 3.03 | 2601 | 1.52 | 0.04 |
| 8 | 15,218 | 1.67 | 2469 | 1.83 | 0.02 |
| 9 | 18,882 | 3.32 | 2174 | 1.39 | 0.05 |
| 10 | 26,821 | 2.97 | 2235 | 1.55 | 0.04 |
Publisher’s Note: MDPI stays neutral with regard to jurisdictional claims in published maps and institutional affiliations. |
© 2022 by the authors. Licensee MDPI, Basel, Switzerland. This article is an open access article distributed under the terms and conditions of the Creative Commons Attribution (CC BY) license (https://creativecommons.org/licenses/by/4.0/).
Share and Cite
Liu, B.; Shi, S.; Liu, Y.; Bennacer, R.; Chen, A.; Theodorakis, P.E. Effect of Different Plenum-Chamber Coefficients on the Frosting of Air-Cooler. Energies 2022, 15, 422. https://doi.org/10.3390/en15020422
Liu B, Shi S, Liu Y, Bennacer R, Chen A, Theodorakis PE. Effect of Different Plenum-Chamber Coefficients on the Frosting of Air-Cooler. Energies. 2022; 15(2):422. https://doi.org/10.3390/en15020422
Chicago/Turabian StyleLiu, Bin, Shengqiang Shi, Yongshan Liu, Rachid Bennacer, Aiqiang Chen, and Panagiotis E. Theodorakis. 2022. "Effect of Different Plenum-Chamber Coefficients on the Frosting of Air-Cooler" Energies 15, no. 2: 422. https://doi.org/10.3390/en15020422
APA StyleLiu, B., Shi, S., Liu, Y., Bennacer, R., Chen, A., & Theodorakis, P. E. (2022). Effect of Different Plenum-Chamber Coefficients on the Frosting of Air-Cooler. Energies, 15(2), 422. https://doi.org/10.3390/en15020422