Article

Explosive Burning of a Mechanically Activated Al and CuO Thermite Mixture

1
Joint Institute for High Temperatures of the Russian Academy of Sciences, Izhorskaya 13 Bd 2, 125412 Moscow, Russia
2
N. Semenov Federal Research Center for Chemical Physics, Russian Academy of Sciences, Kosygin St. 4, 119991 Moscow, Russia
*
Author to whom correspondence should be addressed.
Energies 2022, 15(2), 489; https://doi.org/10.3390/en15020489
Submission received: 3 December 2021 / Revised: 24 December 2021 / Accepted: 6 January 2022 / Published: 11 January 2022
(This article belongs to the Special Issue Challenges and Research Trends of Combustion Mechanism)

Abstract

:
The results of experiments to determine the role of structural schemes for the ignition of a mechanically activated thermite mixture Al–CuO and the formation of its combustion flame are presented. The reaction initiated in the bulk of the experimental assembly transforms into torch combustion in an open space. The dynamics of the volume of the flame reaction region was determined. The stage of flame formation has a stochastic character, determined by the random distribution of the reaction centres in the initial volume of the components. A high-speed camera, a pyrometer and electro contact sensors were used as diagnostic tools. The ultimate goal of the study was to optimize the conditions for the flame formation of this mixture for its effective use with a single ignition of various gas emissions.

1. Introduction

Thermite mixes of metals with solid oxidants have a long history of research and application. The traditional use of thermite composites is associated with metal welding [1] and means of initiation of solid fuel combustion [2]. Conventional thermite mixtures based on micron-sized components have rather high product temperatures but relatively low burning rates. Significant acceleration of chemical reactions in thermite mixtures can be achieved using nanoscale components. Active research on nanothermites began around the beginning of the 2000s [3]. To date, a large number of publications have appeared devoted to the study of various ways to increase the rate of energy release during termite combustion by increasing the contact surface between the fuel and the oxidizer in nanoscale mixtures. The classification of the various termite compositions and the description of the various manufacturing methods are given in a number of books and review articles [4,5,6,7,8,9,10,11]. There are many advantages to using nano-sized thermite mixtures. By increasing the interfacial contact of fuel and oxidants and decreasing the restrictions on heat and mass diffusion, nanothermites exhibit a lower ignition temperature, higher flame propagation velocity and a shorter ignition delay compared to traditional micron-sized counterparts. These advantages provide a solution to some of the current technological needs, such as the development of new initiators, gas generators, microthrusters, energy additives for explosives and fuels, etc. The thermal nature of the combustion products of thermite mixtures is suitable for solving some environmental problems. In particular, thermite mixtures can be used to ensure the safe operation of a number of industries, when, for example, it becomes necessary to ignite large steam-gas volumes.
Economic activity is characterized by the production of large quantities of pollutants that cause environmental degradation. As a rule, chemically hazardous objects contain hermetically sealed containers with aggressive and toxic media [12]. In case of depressurization of containers, contamination of the atmosphere is possible. Technological control systems at such facilities should provide for measures both to eliminate possible accidents and to reduce their harmfulness [13,14]. In practice, such measures are provided by systems for the emergency release of pressure in technological vessels [15]. Unlike systems for the emergency discharge of liquids, the release of vapours and gases is carried out not into an emergency container, but into the atmosphere. The method of afterburning hydrocarbon components of gases to CO2 and H2O in flare units reduces the harmfulness of accidental emissions [16]. Flares are located on the exhaust pipes of systems for the safe and efficient removal (combustion) of exhaust gases. The flare tube has an ignition device (ignition system). In this case, the reliability of the ignition system is of particular importance, since when it fails, unburned hydrocarbons and toxic gases enter the environment. In a number of industries, stationary gas-electrical systems or mobile ignition units are used to ignite combustible gases [17]. The heat source in these systems is the flame of gas burners initiated by electric spark. The search for new methods of ignition and operation of burners remains relevant [18]. For example, fast thermite reactions in mixtures of nanosized metals and solid oxidizers can be more promising for ignition systems. Nanothermites are distinguished by their high energy content, ease of initiation, and a high rate of development of the reaction. The burning rates of aluminium-based nanothermites reach hundreds of meters per second, and the temperature of the products is about 3000 K [10].
To date, a number of methods for the preparation of nanosized energy composites have been developed [8,9,19]. In this work a method of preliminary mechanochemical activation in a high-energy ball mill was used. This method makes it possible to obtain mixtures with high combustion rates [20,21,22]. A mixture of aluminium with copper oxide was chosen as the main object of research. Previously, nanocomposites based on this mixture have been studied in a number of papers [23,24,25,26]. The results showed the possibility of its use as an energy source in various applications. The calculated heat of reaction is 4.1 kJ/g, and the radiation temperature of products measured in air is about 2900 K [11].
2Al + 3CuO = Al2O3 + 3Cu
Our earlier studies have shown that the burning rate of loose-packed activated mixtures exceeds 20 m/s, and the brightness temperature of the products is more than 3000 K [27,28].
This paper presents the results of experiments on studying the dynamics of the combustion flame of a mechanically activated thermite mixture based on Al and CuO powders, as well as the result of using this mixture to ignite a combustible gas mixture.

2. Experimental

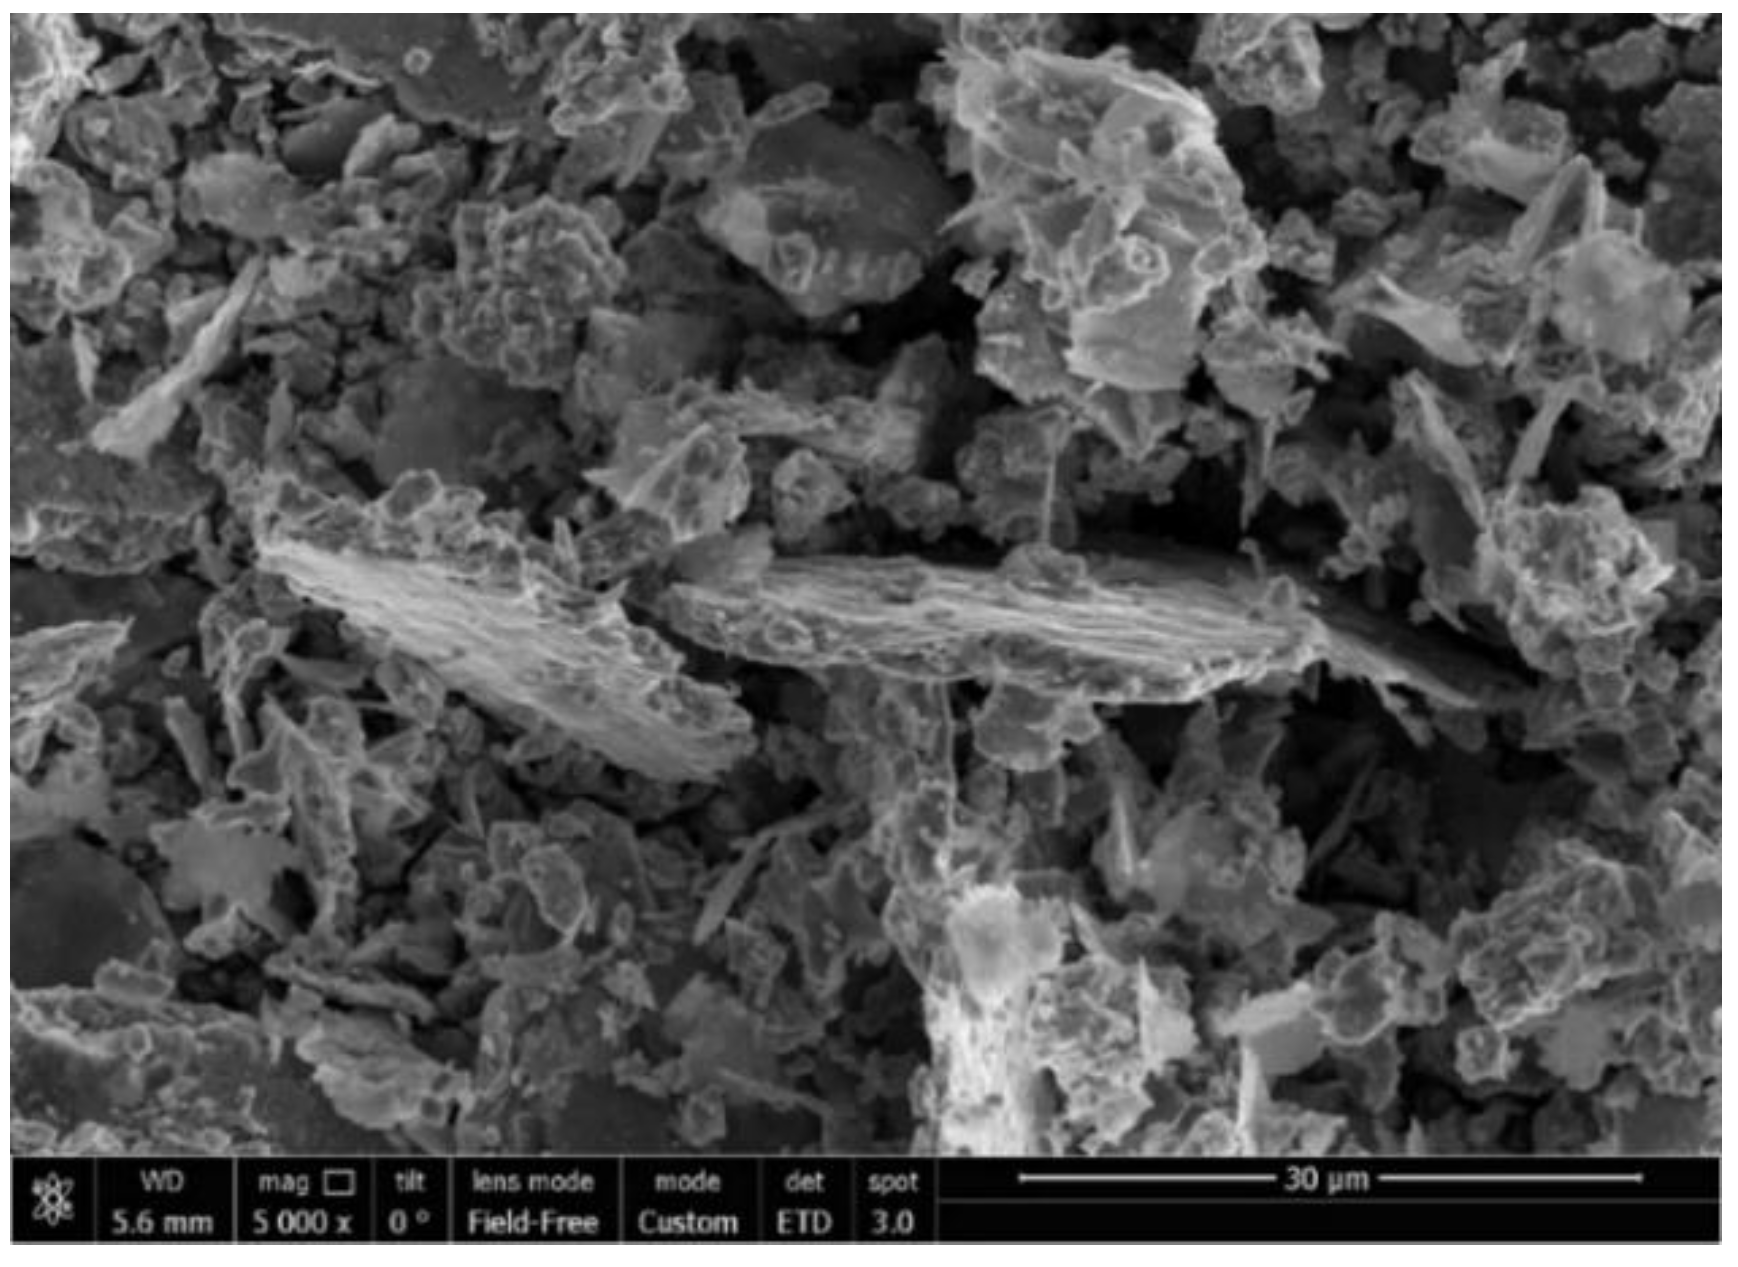
2.1. Materials and Methods

To prepare the thermite mixture, micro- and nanosized powders were used: Al—flat particles (PP-2l) (50–100) × (2–5) μm, CuO—chemically clean, crystalline particles 20–50 μm, nAl (80–100 nm) (FRC CP RAS) and nCuO (50–80 nm) (Advanced Powder Technologies LLC, Tomsk, Russia). A mixture of components in a stoichiometric ratio (19/81 weight) was subjected to mechanical activation in vibration or planetary mills: Aronov mill and Activator-2SL. The activation process and results on the structure and reactivity of activated mixtures are described in detail in [27,28]. The activation process characterized by activation time ta and the activation dose Da, which connects by equation
Da = J × ta,
where J is the power intensity of the activator, for Aronov mill J = 3.7 W/g, and for Activator-2SL J = 9.7 W/g [28]. The activation time varied from 2 to 20 min, which corresponded to the activation dose from 0.4 to 11 kJ/g. Previous studies have shown that the optimal activation dose for micron-sized Al and CuO powder mixtures is about 2 kJ/g, which corresponds ta = 8 min in a vibration mill and about ta = 4 min in a planetary mill. Therefore, most of the experiments were carried out for mixtures activated under optimal conditions. During activation, the micron sized components formed rather large (up to 0.3 mm) agglomerates. Due to different strength characteristics and scatter in the size and shape of the particles, the agglomerates were obtained in the form of disordered structures with numerous points of contact between the components, Figure 1. These points of contact are presumably the primary centres of chemical interaction. Microscopic and EDS analyses were carried out on a scanning electron microscope NOVA NanoSem 650 in reflected electrons using a ring detector, which makes it possible to obtain an effective contrast by the average atomic number of microstructure elements (compositional contrast) for comparison with the elemental composition. The fraction of reflected electrons is determined by the backscattering coefficient, which is a function of the atomic numbers of the elements in the sample. The reflection efficiency of electrons increases with the atomic number, creating a basis for differentiation between phases.
Most of the experiments were carried out with loose-packed samples. The porosity of the samples ε as a percentage was determined by the formula
ε = (1 − ρ00/ρ0) × 100%,
where ρ0 is the theoretical maximum density, ρ00 is the sample density and was determined by weighing a fixed volume of the mixture. With different filling methods, ε was varied from 50 to 60% for micron sized mixtures, and from 80 to 85% for nanosized mixtures. Due to the significant heterogeneity of the initial mixture, the porosity of the samples varied within 2–3% for the same set of experiments.
The chemical interaction of the components was initiated by an electric spark. The spark was ignited in a gap of ≈ 1 mm between the needle electrodes. The energy of a microsecond current pulse was varied in the range from 10 to 100 mJ.
The heat of the chemical reaction (1), due to the exothermicity of the formation of aluminium oxide (Al2O3) molecules, is contained in their internal energy, i.e., is distributed over the excited states of the degrees of freedom of molecules [29]. The relaxation of excited states of molecules is accompanied by excitation and ionization of copper atoms, optical radiation during stepwise transitions, nucleation of reaction products and the formation of condensate clusters. Optical radiation allows the use photographic and pyrometric diagnostics of the combustion process. The formation of free electrons allows additional electrical contact diagnostics of the chemical reaction zone [30]. Needle-shape conductors with a 1 mm gap between them were inserted into the sample. A voltage of 10–30 V was applied to the contacts. The sensors made it possible to register the appearance of electrical conductivity at their location. LeCroy WP 7200A (2 GHz, 4 channels digital oscilloscope) was used to record electric signals. The time from the moment of initiation to the appearance of signals from electrical sensors made it possible to construct an X-t-diagram of the movement of the ionization front. It turned out that the appearance of electrical signals and the appearance of a glow at the location of the sensors occurred almost simultaneously. The data obtained from electrical measurements of the appearance of conductivity and from optical measurements of the appearance of luminescence have a maximum time spread of ±20 μs.
The process of a torch combustion of the mixture was recorded by rapid photographic recording. A high-speed intensified multi-channel CCD camera Cordin 222-4G was used for this. The camera has 8 sensors, high resolution CCD, 2K × 2K pixels, 14-bit dynamic range and allows to take 16 consecutive frames with arbitrary interframe intervals. The sensitivity of each camera sensor was levelled before recording the process. The exposure of the frames was 0.2 μs. The size of the glowing area in each frame was determined using the Microsoft Visio package. The image processing software allows to increase in the intensity of individual frames. However, the maximum intensity mode distorts the visual representation of the process when comparing several images. Therefore, to unify the image of the frames, the mode of auto-balancing of characteristics was used. In addition, this regime allows to neutralize the manifestations of the spatial inhomogeneity of radiation. After these manipulations, the coordinates of the boundaries of the glow region were determined. The values of the vertical coordinates (perpendicular to the surface) at different moments of photographing made it possible to construct an X–t diagram of the expansion of the glow region. Based on these measurements, data on the front velocity U of the product luminescence region were obtained. The image processing data were used for subsequent calculations of the volume V and the expansion rate V/t of the luminescence region. Based on these measurements, within the framework of linear regression, data on the front velocity of the glowing region of combustion products were obtained. These data were duplicated by analysing the oscillograms of signals of electric sensors. The experimental data of both methods showed almost the same results.

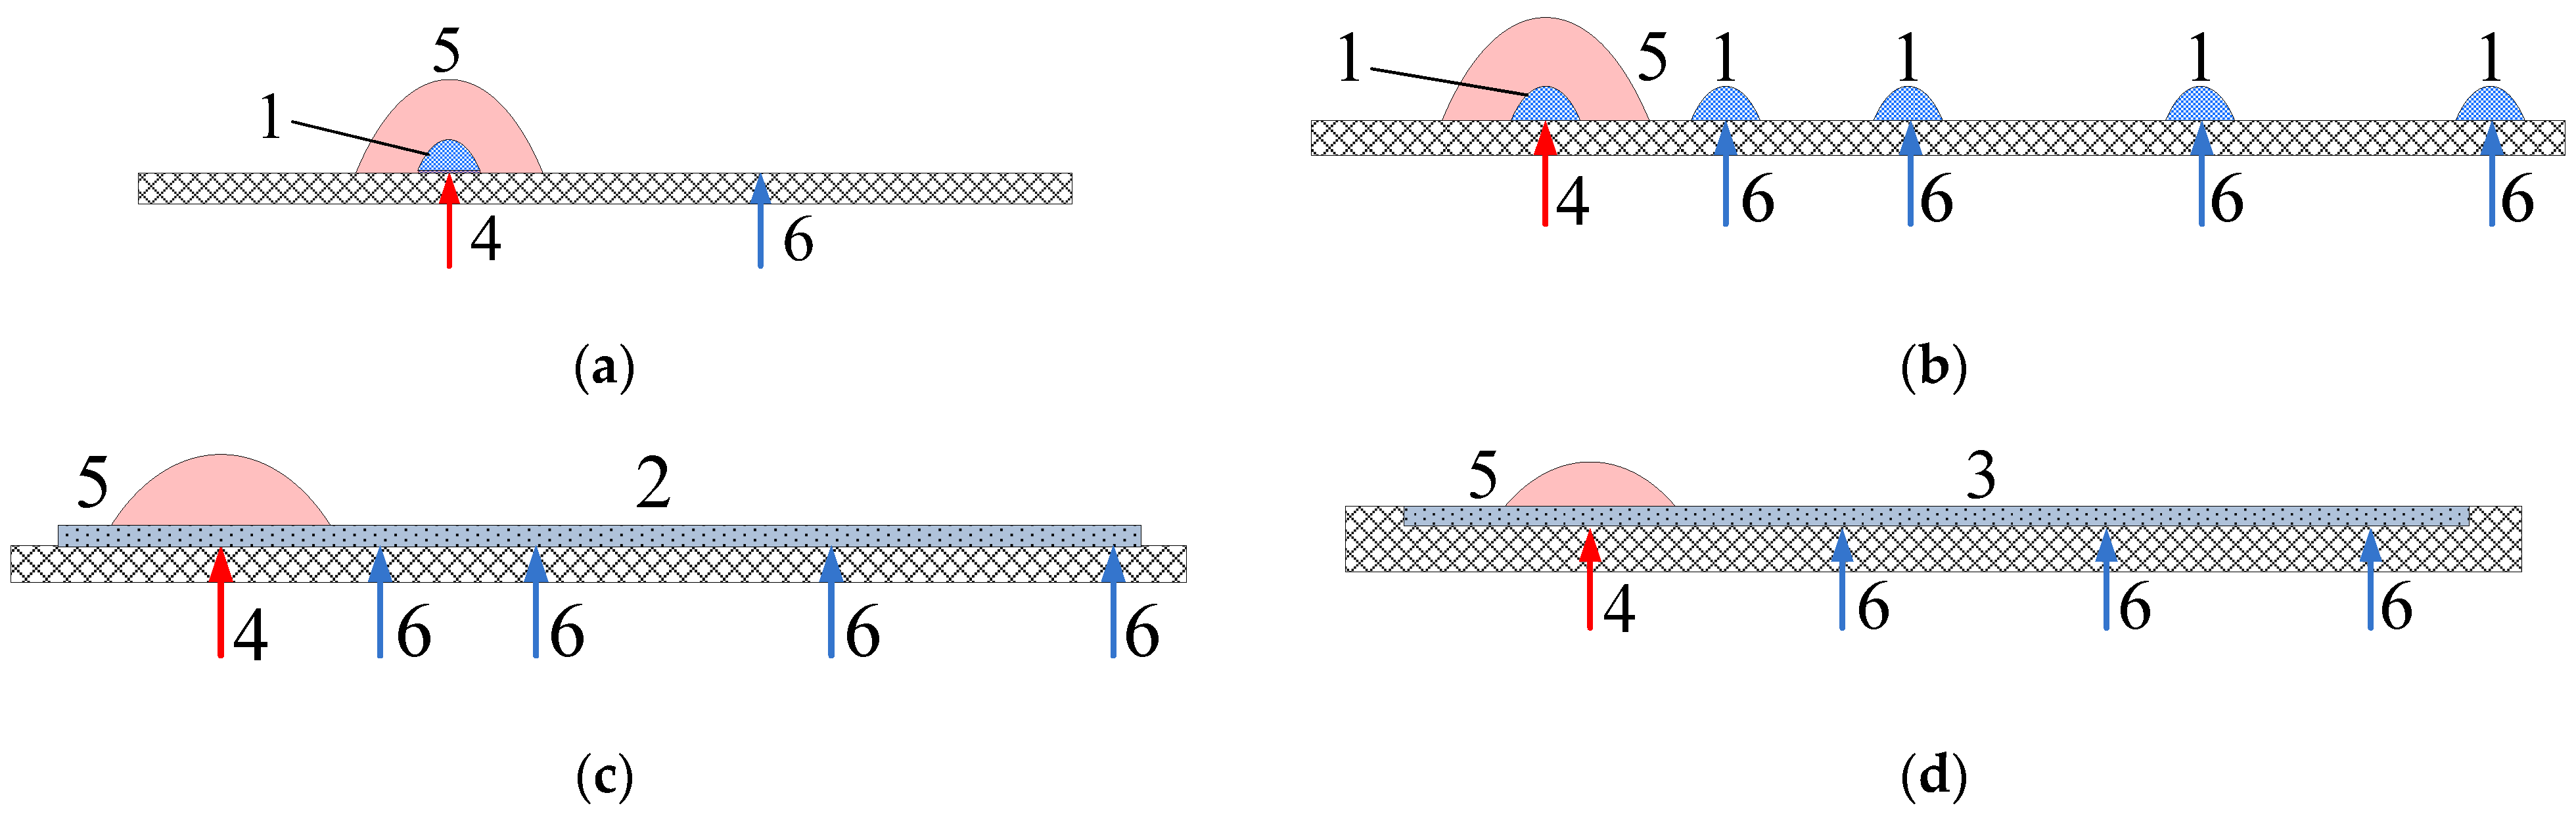
2.2. Experimental Schemes

The experimental schemes for studying the combustion characteristics are based on the desire to realize the maximum rate of formation and the largest volume of hot reaction products at the minimum consumption of the thermite mixture. The experimental set-ups used in this work are shown in Figure 2.
  • Initiation of a concentrated (ldh, length, width, height) sample of a thermite mixture of bulk density on a plane, Figure 2a. The geometry of the sample was a conventional hemisphere with radius ≈ 3.5 mm;
  • Ignition of five weighed portions (ldh) of thermite mixture, distributed on a plane along one line through air gaps, Figure 2b. The interval for placing samples was 23–25–50–53 mm. Ignition occurred at one end of the line of samples. Electrical contact sensors are placed under the mixture samples.
  • Ignition of a linear sample (ldh) of a thermite mixture of bulk density on a plane, Figure 2c. With a sample length of 200 mm, initiation was carried out at its beginning. With a sample length of 400 mm, initiation was carried out in its middle. Electrical sensors were installed along the length of linear samples with an interval of 25–25–50–50 mm to one side from the point of initiation.
  • Ignition of a linear sample (ldh) of a thermite mixture of bulk density in a shallow (d = h) groove, Figure 2d. The groove section was 3 × 3 mm. The ignition was carried out at the end of the groove.
  • Ignition of a bulk density thermite mixture localized in a shallow cell (d = h), Figure 2e. Shallow cell diameter 4 mm, depth 2 mm. The mixture was ignited on a free surface at spark energies of 10 ± 1, 25 ± 2 and 100 ± 6 mJ.
  • Ignition of a bulk density thermite mixture in a short channel (l = 2.5 d), Figure 2f. Channel length 10 mm, diameter 4 mm. The ignition was carried out at the bottom of the groove. Thin flat targets were placed opposite the channel at a distance of 30–200 mm. The targets retained traces of the transverse structure of the combustion product flow. Either 0.15 mm thick aluminium foils or 0.3 mm thick transparent polycarbonate films were used as targets. A thin layer of thermite mixture was applied to the reverse side of the polycarbonate targets. The same polycarbonate targets were installed to the side of the trajectory of the flow of combustion products.
  • Ignition of a bulk density thermite mixture in a long channel (l ≈ 18 d), Figure 2g. Channel diameter was 4.5 mm. The total length of the channel was 160 mm, the length of the channel filled with the mixture was 80 mm. The ignition was carried out at the bottom of the groove.
The verification of the use of the thermite mixture for the ignition of the gas mixture was carried out at the second stage. A thin-walled rubber shell was filled with a propane-butane mixture (propane—20%, butane—55%, isobutane—25%) to a volume of ≈ 6000 cm3, see Figure 3a. The tube with the thermite mixture was positioned under the rubber shell at a distance of 20 mm. The length of the tube was 11 mm, the inner diameter was 4.5 mm, and the mass of the mixture was 0.3 g. To initiate the reaction, two needles connected to a pulsed source were fixed at the open end of the tube. The gap between the needles was 1 mm. The experiment was carried out inside a cylindrical explosion chamber with an internal volume of ≈ 0.5 m3. The ends of the chamber were closed with massive covers, one of which had an axial window for photographing the process, Figure 3b. Complete burnout lasted for a few seconds.

3. Results

For igniting of loose-packed samples (≤1 g) of a mechanically activated mixture at the open surface, the chemical interaction of the components occurred in the form of torch combustion with a significant scatter of reaction products, Figure 4. The area of scatter of products (glowing area) has a geometry close to a hemisphere. The characteristic expansion rate of the glowing area was 100 ± 20 m/s. The scatter of the measured values of the velocity is caused both by the natural distribution of clusters in terms of mass and velocity, and by some arbitrariness in the form during laying bulk weights of the mixture.
Similar torch combustion was observed during the initiation and combustion of the thermite mixture placed in a shell with a single free surface, Figure 2e. A distinctive feature of this scheme is a transfer of a point of initiation to the boundary of the mixture with air. In this case, multidirectional propagation of the reaction and combustion products was realized. This fact contributed to the formation of a plume in the form of a jet. The presence of side walls reinforced this trend. A decrease in the current in the initiating spark led to longer delays in the torch formation.
Due to the local increase in pressure during the spark initiation of chemical transformation, a scatter of the reacting fragments of the mixture occurred. The stream of fragments penetrated the aluminium foil at distances up to 52 mm, see Figure 5a and experimental set-up in Figure 2f. In addition, fragments of the mixture burned through the polycarbonate film and initiated a combustion of the mixture behind the film, Figure 5b. However, this did not happen when such a film was placed at a distance of 50 mm to the side of the fragments path.
In the case of using thick (4 mm) transparent barriers, the initiation of samples on their back side did not occur. That is, radiation did not produce an initiating effect in a cold mixture. These facts indicate the leading role of burning macro particles of a mixture in energy transfer relative to the role of combustion products radiation.
The propagation of the initiating factor through the air gaps of 25–50 mm between the weighed portions of the 0.06 g mixture located on the horizontal surface occurred with velocities in the range of 26–48 m/s (according to the data of the electric sensors, set-up Figure 2b). That is, the expansion of the luminescence region was supported by scattering clusters of products and the continuation of the release of chemical energy throughout the entire volume. An increase in the mass of local samples in the horizontal plane to 0.3 g led to an increase in the rate of expansion of the area of chemical energy release along the surface from 50 to 75 m/s and perpendicular to the surface from 55 to 77 m/s.
In flying fragments, the interaction of the contacting components continued with the formation of excited reaction products. The relaxation of product excitations was accompanied by optical radiation [31]. The formation of free electrons ensured the conductivity of the flare area and the actuation of electrical contact sensors. These phenomena occur almost simultaneously.
The brightness temperature of the reaction products was measured at four wavelengths of 500, 600, 700 and 800 nm [27,28]. According to pyrometric measurements, the brightness temperature of the reaction products increased from 2400 K to 3400 K with increasing in activation time in a mill from 2 to 8 min (vibration mill). For activation dose Da > 2 kJ/g the brightness temperature decreased [28].
Most of the experiments were carried out with the mixture Al/CuO (19/81 weight) based on initial micron powders, activated in a vibration mill for 8 min (Da = 2 kJ/g). The largest volume of luminous products was obtained for this mixture. Mixtures based on nanosized components burn faster, but, apparently, due to the higher content of oxide in nanosized Al particles; the size of the glowing cloud is noticeably smaller.
As a result of the combustion of the mixture and cooling of the reaction products, spherical micro particles (5–30 µm) of Al2O3 were formed, covered with Cu condensate and separate Cu nanoparticles, Figure 6. The compositions of the particles were identified with the help EDSX-ray microanalysis. The results of the elemental analysis of the products in the form of EDAX spectra are given in the Supplementary Materials. Alumina particles in SEM images are dark, while copper particles are light.
Table 1 shows the conditions and some experimental results. The following notation is used in the table: M is mass of the sample, U0 is initial (maximum) velocity of glowing front in the vertical direction, V is luminescence volume, tph is the moment of shooting after ignition, tm is time of maximum on X–t diagram. The V value for experimental set-up Figure 2b is shown for the first 0.06 g portion.
The data show that the instantaneous rate of formation of the volume of luminous products varied with time. This follows from the X–t diagrams of the glowing front, for example, see Figure 4b. The experimental points were approximated by a polynomial function. The slope of the derivative of the approximation function at the point X = 0 determines the value of the maximum velocity U0 of the expansion front of the product cloud. The data in column 5 of Table 1 were obtained from photographs of the glowing region, and the data in column 6 were obtained from X–t plots. The data for both columns are roughly consistent with each other.
According to the summary of data of high-speed photography, signals of triggering electrical contact sensors, and track marks on thin targets, the glowing region (torch) should be characterized as an expanding flow of reacting clusters and cold components of the mixture in a cloud of emitted plasma of combustion products. The presence of air gaps when laying the mixture according to the scheme in Figure 2b did not prevent the spread of combustion. The particles of the flow have kinetic and thermal energy and therefore are capable of producing both breakdown and burning effects.
To test the incendiary ability of mechanically activated compositions, experiments were carried out on the ignition of a model gas mixture. Figure 3 shows some photographs of the initiation and combustion process inside and outside the explosion chamber, indicating the time of the frame from the start of the spark source (0 μs).
This experiment demonstrated the possibility of using a sufficiently small amount of Al–CuO thermal mixture to quickly ignite gas emissions. Further research may be aimed at establishing optimal conditions for the use of mechano-activated thermite mixtures to ignite real gas emissions.

4. Discussion

At this stage of the study, as a criterion for the efficiency of using the thermite mixture, it is proposed to choose the volume of the emitted reaction products. The main parameters that make it possible to estimate this volume by the glow of the hot reaction products are presented in Table 1. These parameters include the initial (maximum) linear expansion rate U0, the maximum volume of the glowing area V and the average rate of its formation V/tm. To determine these parameters, photographs of the glow at various points in time and X–t diagrams based on them were used.
The illumination of the photos was non-uniform due to different stages of the process at different points of the optical image. This made it difficult to visually determine the exact coordinates of the boundary of the glowing area. To overcome this difficulty, the method of tracking a point with the same pixel intensity on the image was used [32]. Tracking the change in the coordinate of such a pixel in a series of consecutive photos allowed to determine the expansion of the glowing area along the selected direction.
Figure 4b shows an example of the dependencies of the expansion (X–t diagrams) of the glowing area along and across the reference plane for a scheme with a single sample of the mixture, Figure 2a. These dependencies allowed to determine the expansion rate at any given time. It can be seen that the expansion rate decreases from the maximum value of U0 at the initial moment of time to the complete cessation of expansion at the moment tm. The maximum volume V can be maintained for a long time due to the combustion of large agglomerates of the mixture. Therefore, the binding of time tm to the value of the maximum volume V is conditional. This circumstance leads to a certain discrepancy between the data in columns 5 and 6 of Table 1. The data of column 5 for the volume value V were determined directly from the photos of the glowing area, tied to a fixed time tph. The data of column 6 for the average rate of volume formation V/tm were obtained from X–t diagrams of continuous expansion of the glowing area by the time tm. The data of both columns roughly correspond to each other.
The process of expanding the glowing area was repeated during the combustion of the mixture in all schemes in Figure 2, with some differences in expansion parameters (see Table 1). It can be assumed that different values of the expansion parameters are associated with a different scheme of laying the mixture and its quantity. As a basic scheme, consider the scheme of Figure 2a for analysis. All four experiments according to this scheme differ only in mass M.
According to Table 1 for the scheme in Figure 2a it is possible to construct a dependence of the maximum volume V on the mass of the mixture M. This dependence has the form
V = A × Mk,
where A = 996 cm3/gk, k = 0.67. The value of the determination coefficient R2 = 0.99 confirms a good approximation of the experimental data by such a function. The value of the exponent k < 1 means incomplete participation of the mass of the mixture in the formation of the glow region of the reaction products. Incompleteness of combustion was caused by slowing down the reaction due to the formation of products (aluminium oxide and Cu) between the particles of the initial components. Therefore, increasing the volume of the product cloud by only increasing the mass of one sample may not be an effective solution. If the sample has the shape of a hemisphere with a radius R, then the mass M of the sample is M = ρsVs ~ R3s and vs. are the density and the volume of the sample) and the surface S of the sample is S ~ R2. From (4) it follows that the volume of the cloud is proportional to the square of the radius of the sample:
V ~ R2 ~ S.
From dependences (4) and (5) it follows that for a more efficient increase in the volume of the cloud, it is necessary to increase the surface area of the charge. In this way, the possibility of increasing the volume of hot products is associated with the method of forming a sample of the mixture. The formation of a linear sample of the mixture with a relatively large open surface area given this result, Figure 2c,d. However, a significant increase in the area of the sample requires an increase in the number of points of initiation. The change in the geometry of the stacking and the mass of the mixture is manifested both in the volume and in the form of the luminous area. So, instead of a hemispherical shape for localized samples of the mixture, the scheme of Figure 2a, the glow takes the form of a horizontal half-cylinder for elongated samples, see schemes in Figure 2b–d. These schemes can be characterized by the values of the surface density of the mixture stacking 0.2, 0.05–0.1 and 0.67 g/cm2, respectively.
If the localized sample of the mixture is limited by the side walls, the glow takes the form of a vertical cylinder, see schemes in Figure 2e–g. The side walls limit the lateral expansion of combustion products, which leads to the rapid formation of a jet plume. These schemes can be characterized by the values of the surface density of laying the mixture of 0.48, 1.5–2.4 and 20.7 g/cm2, respectively. In the case of a cylindrical channel with long walls, Figure 2g, a jet of combustion products is formed. In this case, the linear velocity of the front of the cloud takes the greatest value, see Table 1. However, this does not lead to an increase in the volume of the glow cloud. These facts mean that the glow of the cloud and the formation of its volume are carried out, to a greater extent, not due to the expansion of the final reaction products. Apparently, it is the combustion of cluster formations of the mixture flying in open space that underlies the formation of the glow cloud. In the case of a long channel, Figure 2g, a significant part of the mixture burns out before leaving it in the open space, which provides a large value of the linear velocity. Such an idea of the development of a glow cloud raises the question of the conditions for the acceleration of cluster formations from the volume of the initial mixture.
The values of the parameters in the lines of position 5 of Table 1 for the scheme in Figure 2e correspond to different initiation energies. This energy corresponds to 10, 25 and 100 mJ for lines from top to bottom, respectively. A higher linear velocity of the glow front corresponds to a higher initiation energy. Such a correspondence is obviously associated with the value of the developed pressure when initiating a reaction in a porous thermite mixture. However, the values of the volume of the luminescence region in experiments according to this scheme are inversely related to the linear velocity. This means that the luminescence volume increases to a greater extent due to lateral expansion than due to the initial longitudinal movement. It was previously noted that the presence of side walls contributes to the formation of a cylindrical shape of the cloud, in which the transverse increase in volume is proportional to the square power of the transverse size.
Thus, the formation of a glow cloud is associated both with the initial parameters of the thermite mixture, the initiation energy, the conditions for the placement of the mixture, and the ratio of the degree of combustion in the primary volume of the mixture and in the open space. Such a multiparameter dependence of the glow cloud volume greatly complicates the optimization of the circuit for a specific application.
Nevertheless, a choice was made of a flare formation scheme for the experimental modelling of the ignition of a gas mixture, based on the results obtained. The scheme in Figure 2f with the rapid formation of a jet plume, but with the location of the initiation point at the boundary of the mixture with air, is the basis for a real device. The scheme is characterized by multidirectional propagation of reaction and combustion products, high rates of linear and volumetric formation of a jet plume. The results of applying the selected scheme for ignition of combustible gas are presented earlier in Figure 3. The successful result of the initiation of combustible gas using the scheme Figure 2f gives reason to use the value of the ratio M/S equals 1–2 g/cm2 as a reasonable criterion for choosing the design of the incendiary device.
In subsequent studies of direct initiation of steam-gas emission by a flare of hot products of thermite mixture, other efficiency criteria may appear.

5. Conclusions

The analysis of the measurement data allowed to reveal in more detail the combustion process sequence in the time following the reaction initiation:
  • Evidence was obtained for the heterogeneity of the flow of the reacting components of the mixture surrounded by a cloud of emitted plasma of the reaction products;
  • The dominant role of scattering clusters carrying the centres of a chemical reaction in the initiation of a cold mixture through an air gap of up to 150 mm had been established;
  • A quantitative characteristic of the combustion dynamics of the studied mixtures of aluminium with copper oxide was obtained;
  • An increase in the mass of local samples led to an increase in the expansion rate of the chemical energy release area. The limitation of the expansion of combustion products by the side walls within the height of the mixture track also led to an increase in the combustion rate;
  • The combustion of a thermite mixture of Al and CuO is promising for use in single-shot systems for gas mixtures ignition.
The data obtained do not allow one to determine the details of the course of the process in the reacting flow of expanding hot clusters of products of explosive burning of Al/CuO mixture. There are traces of burning of hot particles through thin barriers located at different distances. The dimensions of these tracks range from a few micrometres to fractions of a millimetre. The optical registration of dimensions is difficult due to the powerful luminescence of the products. Only traces of large particles are visible. The size of the final products on the surface of obstacles also varies widely. If the bulk of the particles of aluminium oxide has a size of several microns, then copper particles are formed both in the form of large solidified droplets and in the form of nanoscale dust. To clarify the detailed picture of the process, additional research is needed. However, this does not prevent one from drawing a conclusion about the applicability of this composition for the ignition of combustible gas mixtures.

Supplementary Materials

The following supporting information can be downloaded at: https://www.mdpi.com/article/10.3390/en15020489/s1, Figure S1: Products of burning 20Al + 80CuO and EDAX spectra for zones 1−6, Figure S2: Zone 1, Figure S3: Zone 2, Figure S4: Zone 3, Figure S5: Zone 4, Figure S6: Zone 5, Figure S7: Zone 6.

Author Contributions

Conceptualization, A.D. and B.Y.; methodology, B.Y.; investigation, B.Y., G.V. (George Valyano) and S.A.; writing—original draft preparation, G.V. (Galina Vakorina); writing—review and editing, A.D. and B.Y.; visualization, S.A.; supervision, A.D.; project administration, A.D.; funding acquisition, G.V. (Galina Vakorina) All authors have read and agreed to the published version of the manuscript.

Funding

This research was supported by The Ministry of Science and Higher Education of the Russian Federation (Agreement with Joint Institute for High Temperatures RAS No. 075-15-2020-785 dated 23 September 2020).

Institutional Review Board Statement

Not applicable.

Informed Consent Statement

Not applicable.

Data Availability Statement

The data that support the findings of this study are available from the corresponding author upon reasonable request.

Acknowledgments

The work was carried out using the equipment of the USF “Sphere” of the Moscow Regional Explosive Center of JIHT RAS. The work on preparation of mechanically activated thermites was carried out at FRC CP RAS and financially supported by subsidies for the implementation of the state assignment on the topic No. 0082-2019-0016.

Conflicts of Interest

The authors declare no conflict of interest.

References

  1. Goldschmidt, H.; Vautin, C. Aluminium as a Heating and Reducing Agent. J. Soc. Chem. Ind. 1898, 6, 543–545. [Google Scholar]
  2. Shidlovskiy, A.A. Principles of Pyrotechnics; American Fireworks News: Dingmans Ferry, PA, USA, 1997; 270p. [Google Scholar]
  3. Son, S.F.; Busse, J.R.; Asay, B.W.; Peterson, P.D.; Mang, J.T.; Bockmon, B.; Pantoya, M.L. Propagation Studies of Metastable Intermolecular Composites (MIC). In Proceedings of the Twenty-Ninth International Pyrotechnics Seminar, Westminster, CO, USA, 14–19 July 2002; Schelling, F.J., Ed.; Los Alamos National Laboratory: Westminster, CO, USA, 2002; pp. 203–212. [Google Scholar]
  4. Zarko, V.E.; Gromov, A. (Eds.) Energetic Nanomaterials. Synthesis, Characterization, and Application; Elsevier: Amsterdam, The Netherlands, 2016; 392p. [Google Scholar]
  5. Bhattacharya, S.; Agarwal, A.K.; Rajagopalan, T.; Patel, V.K. (Eds.) Nano-Energetic Materials, Energy, Environment and Sustainability; Springer: Singapore, 2019; 290p. [Google Scholar]
  6. Yan, Q.-L.; He, G.-Q.; Liu, P.-J.; Gozin, M. (Eds.) Nanomaterials in Rocket Propulsion Systems; Elsevier: Amsterdam, The Netherlands, 2019; 592p. [Google Scholar]
  7. Sundaram, D.; Yang, V.; Yetter, R. Metal-Based Nanoenergetic Materials: Synthesis, Properties, and Applications. Prog. Energy Combust. Sci. 2017, 61, 293–365. [Google Scholar] [CrossRef]
  8. Kabra, S.; Gharde, S.; Gore, P.; Jain, S.; Khire, V.H.; Kandasubramanian, B. Recent Trends in Nanothermites: Fabrication, Characteristics and Applications. Nano Express 2020, 1, 032001. [Google Scholar] [CrossRef]
  9. Trache, D.; DeLuca, L.T. Nanoenergetic Materials: Preparation, Properties, and Applications. Nanomaterials 2020, 10, 2347. [Google Scholar] [CrossRef] [PubMed]
  10. Yetter, R.A. Progress towards Nanoengineered Energetic Materials. Proc. Comb. Inst. 2021, 38, 57–81. [Google Scholar] [CrossRef]
  11. Weiser, V.; Roth, E.; Kelzenberg, S.; Becker, W.; Sachsenheimer, K. Experimental and Theoretical Comparison of a Systematic Variety of Thermite Compositions. In Proceedings of the 46th International Annual Conference of the Fraunhofer ICT: Energetic Materials. Performance, Safety and System Applications, Karlsruhe, Germany, 23–26 June 2015; Fraunhofer Institute fur Chemische Technologie: Pfinztal, Germany, 2015; p. 24. [Google Scholar]
  12. Marshall, V.C. Major Chemical Hazards; Ellis Horwood Limited: Chichester, UK; Halsted Press: New York, NY, USA, 1987; 587p. [Google Scholar]
  13. Greenberg, H.R.; Cramer, J.J. (Eds.) Risk Assessment and Risk Management for the Chemical Process Industry; Van Nostrand Reinhold Company: New York, NY, USA, 1991; 315p. [Google Scholar]
  14. Penenko, V.V.; Aloyan, A.E. Models and Methods for Environmental Protection Problems; Nauka: Novosibirsk, Russia, 1985; 254p. [Google Scholar]
  15. Korf, E.I.; Katz, M.I. Safety and Fire Protection Technology in the Chemical Industry; Higher school: Moscow, Russia, 1961; p. 94. [Google Scholar]
  16. Lyapkov, A.A.; Ionova, U.I. Environmental Engineering, 2nd ed.; Publishing House of the Tomsk Polytechnic University: Tomsk, Russia, 2008; 317p. [Google Scholar]
  17. Banerjee, K.; Cheremisinoff, N.P.; Cheremisinoff, P.N. Flare Gas Systems Pocket Handbook; Gulf Publishing Company: Houston, TX, USA, 1985. [Google Scholar]
  18. Smith, J.D.; Al-Hameedi, H.A.; Jackson, R.; Suo-Antilla, A. Testing and Prediction of Flare Emissions Created during Transient Flare Ignition. Int. J. Petrochem. Res. 2018, 2, 175–181. [Google Scholar] [CrossRef]
  19. Pang, W.; Fan, X.; Wang, K.; Chao, Y.; Xu, H.; Qin, Z.; Zhao, F. Al-Based Nano-Sized Composite Energetic Materials (Nano-CEMs): Preparation, Characterization, and Performance. Nanomaterials 2020, 10, 1039. [Google Scholar] [CrossRef] [PubMed]
  20. Dreizin, E.L.; Schoenitz, M. Mechanochemically Prepared Reactive and Energetic Materials: A Review. J. Mater. Sci. 2017, 52, 11789–11809. [Google Scholar] [CrossRef]
  21. Woodruff, C.; Wainwright, E.R.; Bhattacharia, S.; Lakshman, S.V.; Weihs, T.P.; Pantoya, M.L. Thermite Reactivity with Ball Milled Aluminum-Zirconium Fuel Particles. Combust. Flame 2020, 211, 195–201. [Google Scholar] [CrossRef]
  22. Chen, J.; Guo, T.; Ding, W.; Song, J.; Yao, M.; Bei, F.; Li, S. Effect of CuO on the Thermal Kinetics and Combustion Properties of Al/MoO3 Thermite Prepared by Ball Milling. Ceram. Int. 2021, 47, 16500–16510. [Google Scholar] [CrossRef]
  23. Monk, I.; Schoenitz, M.; Jacob, R.J.; Dreizin, E.L.; Zachariah, M.R. Combustion Characteristics of Stoichiometric Al-CuO Nanocomposite Thermites Prepared by Different Methods. Combust. Sci. Technol. 2017, 189, 555–574. [Google Scholar] [CrossRef]
  24. Tichtchenko, E.; Estève, A.; Rossi, C. Modeling the Self-Propagation Reaction in Heterogeneous and Dense Media: Application to Al/CuO Thermite. Combust. Flame 2021, 228, 173–183. [Google Scholar] [CrossRef]
  25. Shi, K.; Guo, X.; Chen, L.; Huang, S.; Zhao, L.; Ji, J.; Zhou, X. Alcohol-Thermal Synthesis of Approximately Core-shell Structured Al@CuO Nanothermite with Improved Heat-Release and Combustion Characteristics. Combust. Flame 2021, 228, 331–339. [Google Scholar] [CrossRef]
  26. Mursalat, M.; Schoenitz, M.; Dreizin, E.L. Effect of Premilling Al and CuO in Acetonitrile on Properties of Al·CuO Thermites Prepared by Arrested Reactive Milling. Combust. Flame 2020, 214, 57–64. [Google Scholar] [CrossRef]
  27. Ananev, S.Y.; Grishin, L.I.; Yankovsky, B.D.; Kirilenko, V.G.; Dolgoborodov, A.Y. Effect of Mechanical Activation on Combustion Characteristics of Al–CuO Powder Mixture. J. Phys. Conf. Ser. 2021, 1787, 012016. [Google Scholar] [CrossRef]
  28. Streletskii, A.N.; Kolbanev, I.V.; Vorobieva, G.A.; Dolgoborodov, A.Y.; Kirilenko, V.G.; Yankovskii, B.D. Kinetics of Mechanical Activation of Al/CuO Thermite. J. Mater. Sci. 2018, 19, 13550–13559. [Google Scholar] [CrossRef]
  29. Zel′dovich, Y.B.; Raiser, Y.P. Physics of Shock Waves and High-Temperature Hydrodynamic Phenomena; Nauka-Fizmatlit: Moscow, Russia, 1966; p. 686. [Google Scholar]
  30. Lawton, J.; Weinberg, F.J. Electrical Aspects of Combustion; Clarendon Press: Oxford, UK, 1969; p. 419. [Google Scholar]
  31. Kondratyev, V.N.; Nikitin, E.E. Chemical Processes in Gases; Nauka: Moscow, Russia, 1981; p. 264. [Google Scholar]
  32. Bratton, K.R.; Woodruffa, C.; Campbell, L.L.; Heaps, R.J.; Pantoya, M.L. A Closer Look at Determining Burning Rates with Imaging Diagnostics. Opt. Lasers Eng. 2020, 124, 105841. [Google Scholar] [CrossRef]
Figure 1. The SEM-photo of the Al–CuO mixture after mechanical activation.
Energies 15 00489 g001
Figure 2. (ag) Various schemes of experimental assemblies for the formation of a flame of a thermite mixture. 1—the sample, 2—linear sample of thermite mixture, 3—the thermite mixture in the groove, 4—spark, 5—the flame, 6—electrical sensors, 7—the shell, 8—the target.
Energies 15 00489 g002aEnergies 15 00489 g002b
Figure 3. Photographs of a propane-butane gas mixture ignition process. (a) Inside the chamber: 150 μs—jet flame of thermite mixture combustion products; 1100 μs—coverage of the rubber shell by the combustion products of the thermite mixture; 4600 μs—destruction of the rubber shell and beginning of the outflow of the propane-butane gas mixture into the air volume of the chamber. (b) Outside the chamber: 2 ms—radiation from the flame of the thermal mixture combustion products; 230 ms—radiation of the incipient ignition of the propane-butane-air mixture inside the chamber; 560 ms—emission and combustion of a propane-butane-air mixture outside the chamber.
Energies 15 00489 g003
Figure 4. Combustion of Al–CuO mixture on a surface. (a) Typical photographs, 300 μs and 900 µs after ignition. (b) Expansion dynamics of glowing area.
Energies 15 00489 g004
Figure 5. The photographic evidence of an impact of the frontal flow of combustion products. (a) The impact of mixture weighing 0.3 g on a 0.15 mm thick aluminium foil for distances of 120, 90, 60, 52, 45 and 30 mm (from left to right and from top to bottom), respectively. (b) Spots of interaction of the flow of reacting particles on a 0.3 mm thick polycarbonate target film. Photographic recording was not carried out in these experiments.
Energies 15 00489 g005
Figure 6. Spherical Al2O3 particles covered with Cu condensate (a), 10 µm scale, and Cu nanoparticles (b), 400 nm scale.
Energies 15 00489 g006
Table 1. Some results on the dynamics of the flame region of Al/CuO 19/81 mixture for various experimental schemes.
No.Experimental Set-up
No. (Figure 2)
M (g)U0 (m/s)Luminescence Volume V
at Time tph after
Ignition [cm3 (ms)]
Rate of the Glowing
Volume Formation
V/tm (cm3/μs)
12a0.06118134 (2.2)0.05
0.25101450 (1.5)0.3
0.75109780 (1.5)0.52
1.51291280 (1.2)0.89
22b0.06 × 5 55107 (2.1)0.34
32c8 (0.4 g/cm)657226 (2.4)3
8.5 (0.21 g/cm)762009 (2.5)0.8
42d3 (0.2 g/cm)52785 (2.5)0.39
52e0.0655136 (2.5)0.054
78107 (2.5)0.043
12089 (2.5)0.036
62f0.3Photographic recording of the process was not made
0.2575–95300 (2.5)0.12
0.284226 (2.5)0.09
72g3.3192360 (3)0.12
Publisher’s Note: MDPI stays neutral with regard to jurisdictional claims in published maps and institutional affiliations.

