Article

Sensitivity of Piezoresistive Pressure Sensors to Acceleration

Faculty of Mechanical Engineering and Aeronautics, Rzeszow University of Technology, al.Powstańców Warszawy 12, 35-959 Rzeszów, Poland
*
Author to whom correspondence should be addressed.
Energies 2022, 15(2), 493; https://doi.org/10.3390/en15020493
Submission received: 25 November 2021 / Revised: 29 December 2021 / Accepted: 6 January 2022 / Published: 11 January 2022

Abstract

:
The article presents the negative aspects of the influence of static and dynamic acceleration on the accuracy of pressure measurement for a selected type of transmitter. The influence of static accelerations from catalog notes was shown and compared with the tests results for a few selected sensors. The results of research on the influence of dynamic acceleration for various types of its variability for selected converters are presented. Moreover, a method of measurement patented by the authors that uses a complex transducer is shown. The method allows for more accurate measurements on moving objects. The tests were performed based on the proposed method. The obtained results of the influence of acceleration on the classical sensor as well as the construction using the proposed method are shown. The paper presents approximate pressure measurement errors resulting from the influence of acceleration. For example, errors in measuring the speed of an airplane may occur without the proposed method. The last part of the article presents a unique design dedicated to a multi-point pressure measurement system, which uses the presented method of eliminating the influence of accelerations on the pressure measurement.

1. Introduction

This article concerns the negative aspects of measurements with the use of MEMS piezoresistive pressure sensors, e.g., with a diaphragm. Sensors of this type have a significant position in measurements, mainly due to the number of areas of their application. The trend of development and areas of application has also forced a significant evolution of pressure sensors. For example, popular piezoelectric sensors have found applications other than MEMS from the point of view of construction and physics of operation. Another popular type is transducers, which due to their filigree nature, allow for installation in difficult inaccessible places on the measured object. Examining the literature, one can find transducer structures in construction. For example, the authors of [1] proposed a solution for a cheap pressure sensor, the design of which uses a strain gauge bridge system. Article [2] proposed a sensor solution based on a heterojunction SI/ZnO diode. According to the authors, the dominant structures in the consumer electronics market are based on GaN/AlGaN, Au/ZnO, and NiO/ZnO. The authors showed a structure based on a diode, which can be used as a pressure sensor. Testing and analysis of the proposed structure were performed by the authors using the TCAD-ATLAS software. The performed tests show characteristics obtained for a pressure range from 0 to 300 Pa. The authors suggest using the sensor in devices with touch sensors. From the point of view of microstructure development, a very interesting solution is shown in article [3]. The article presents a new solution for the structure of the MEMS piezoresistive sensor. An innovative approach to the design of membrane in this type of sensor was proposed. A patterned structure was proposed by the authors, instead of the classic perforated structure found in most commercial solutions. According to the article, the solution reduced the thickness of the membrane in some areas. That increased the sensitivity and the measurement result, assuming the slimming of the diaphragm may affect its mass and thus the influence of acceleration on the measurement result. Probably this may reduce the influence of acceleration on the measurement result. It is worth noticing that more and more sophisticated materials are used in the production process of pressure transducers. In [4], the authors presented results of the research on piezoresistive graphene sensors with a special zigzag structure. In the article, the mentioned structure was tested on a square membrane using the finite element method with the help of the COMSOL Multiphysics tool (COMSOL, Inc., 100 District Avenue Burlington, MA 01803, USA). The authors confirmed the high sensitivity of the proposed solution in the effective measuring range of 0–100 psi. Currently, there are many applications of pressure sensors on the market in consumer and medical measurements. Sensors of this type are often based on simple solutions that allow them to be mounted in consumer devices such as smartphones to monitor the selected life functions of people. However, in medical areas, some sophisticated and interesting pressure transducer applications can be found. In article [5], the authors discussed the issues related to the use of pressure sensors as electronic bioresorbable implants. It is a new trend of electronics in medicine and invasive surgery. One of the examples is in [4], where the authors presented some results of the research on piezoresistive graphene sensors with a special zigzag structure. The authors emphasized the possibility of using this type of structure, e.g., in veterinary medicine to detect blood vessel obstruction in selected animal species and in postoperative measurements to monitor the patient’s condition. The advantage of the sensor is its life, the parameters related to sensitivity, linearity of the output signal characteristic to pressure changes, and its durability. From the sensorial point of view, medical applications are also very similar to those in soft or flexible robotics. This type of approach to transducers has been described in [6], which presents a sensor for monitoring biomedical activities or one that can be used in robotic applications. The study presents the structure of the TIPS sensor with a sensitivity in the range of Smin > 200 kPa−1, Smax > 45,000 kPa−1, and a wide range of pressure change detection in the range of 20 Pa up to 1.4 MPa. The presented work proves the possibility of using sensors made of pseudo-capacitive materials for flexible robotics applications. In the case of applications related to mechanical engineering, it is more common to use ready-made commercial sensors that are not necessarily a proprietary solution. In the article [7], the authors mention the wide application and importance of modern strain gauges in measuring the monitoring of air loads on structures. Unfortunately, measurements of this type are very invasive and require an extensive wiring system. While the conditions of this type are easy to ensure in the laboratory, they can be very difficult to implement in the case of dynamic measurements. The authors proposed an alternative approach using MEMS strain gauges. They are used to measure the aerodynamic pressure distribution around the tested structural element of the aircraft and thus the dynamic aerodynamic loads on the wing. A measurement unit with 64 sensors wing “glove” for measuring the pressure distribution in selected parts of the structure was used for the measurements. The solution was built using the existing pressure sensors. The authors showed the possibility of using pressure sensors to obtain the characteristics of aerodynamic changes in a characteristic flight state, and thus to detect, e.g., a stall state of the aircraft. The authors tested the proposed solution for pull-up and push-over maneuvers, parabolic flight, and stall. For a stall, it was possible to detect a flow separation point. The authors note that the extrapolated results result from some simplifications resulting from the prototype nature of the system and the fact that the pressure distribution was measured only on a single wing section. Another interesting solution is in the article [8]. It presents an innovative approach to the use of a pressure sensor to calibrate a photogrammetric system designed for optical measurements in the underwater environment. The methodology presented by the authors is based on a cheap device that uses depth readings based on changes in the pressure of the water environment. The pressure sensor has been properly synchronized with the digital camera and closed in a special pressure cover. Unfortunately, the authors of the idea do not mention exactly what type of pressure sensor was used. It can be assumed they used an embedded module with a built-in miniature MEMS sensor. Our presented article refers to a significant problem related to measurements of pressures on moving objects. For example, vehicles that are in typical operation such as aircraft. The difficulty of performing pressure measurements in such objects is related to unquestionable problematic features of popular pressure sensors. Unfortunately, in addition to responding to the pressure parameter, most pressure MEMS transducers with membranes are sensitive to accelerations. It should be noticed that there is less reliable information about the possibility of eliminating this problem in measurements apart from a few publications. The authors of publication [9] noticed the influence of acceleration on the pressure measurement, however, for piezoelectric sensors. The problem concerns the instantaneous impact (instantaneous) acceleration. After analyzing the principle and theoretical foundations of the selected effect caused by acceleration, the authors analyzed the static and dynamic effects of the impacts on the crystal structure in the piezoelectric sensor. By combining empirical systems decomposition (EMD) with the system identification theory (SIT), the authors proposed a digital filter whose task is to compensate for acceleration from shocks. The authors claim that the filter obtained measurement results 11% lower than without the use of the filter. The situation will be slightly different in the case of using MEMS sensors on dynamic objects. There may be acceleration not of expiring character, but, e.g., constantly or dynamically changing in a long period. For this reason, pressure measurements performed in various phases of flight, for example, during spin [10] with classical methods may be disturbed with additional uncertainty. Pressure measurements are significant in the operational issues of many mechanical devices, as they often constitute a source of indirect information about the condition of an object. Depending on the object, the pressure and other physical quantities are indirectly measured: fluid flow velocity, volume flow or mass, distribution of mechanical loads, i.e., forces of the pressure of the incoming fluid on a specific body, climb speed, flight speed, flight altitude, etc. The problem of disturbance of the pressure measurement results due to acceleration in the variable orientation conditions of the transducer, pressure gauge relative to the vertical on a moving object such as a car or an aircraft, concerns all groups of pressure transducers. Today, several types of pressure transducers are used. They are inductive, capacitive, strain gauge, and the latest generation of the MEMS family; for example, microscale transducers made with a silicon structure. This group uses piezoresistive or capacitive transducers [11,12,13,14,15,16,17]. In almost all transducer groups, the pressure measurement consists of determining the degree of deformation of the elastic element. It is affected by the forces resulting from the pressure difference between these spaces separated by the elastic element, element b in Figure 1.

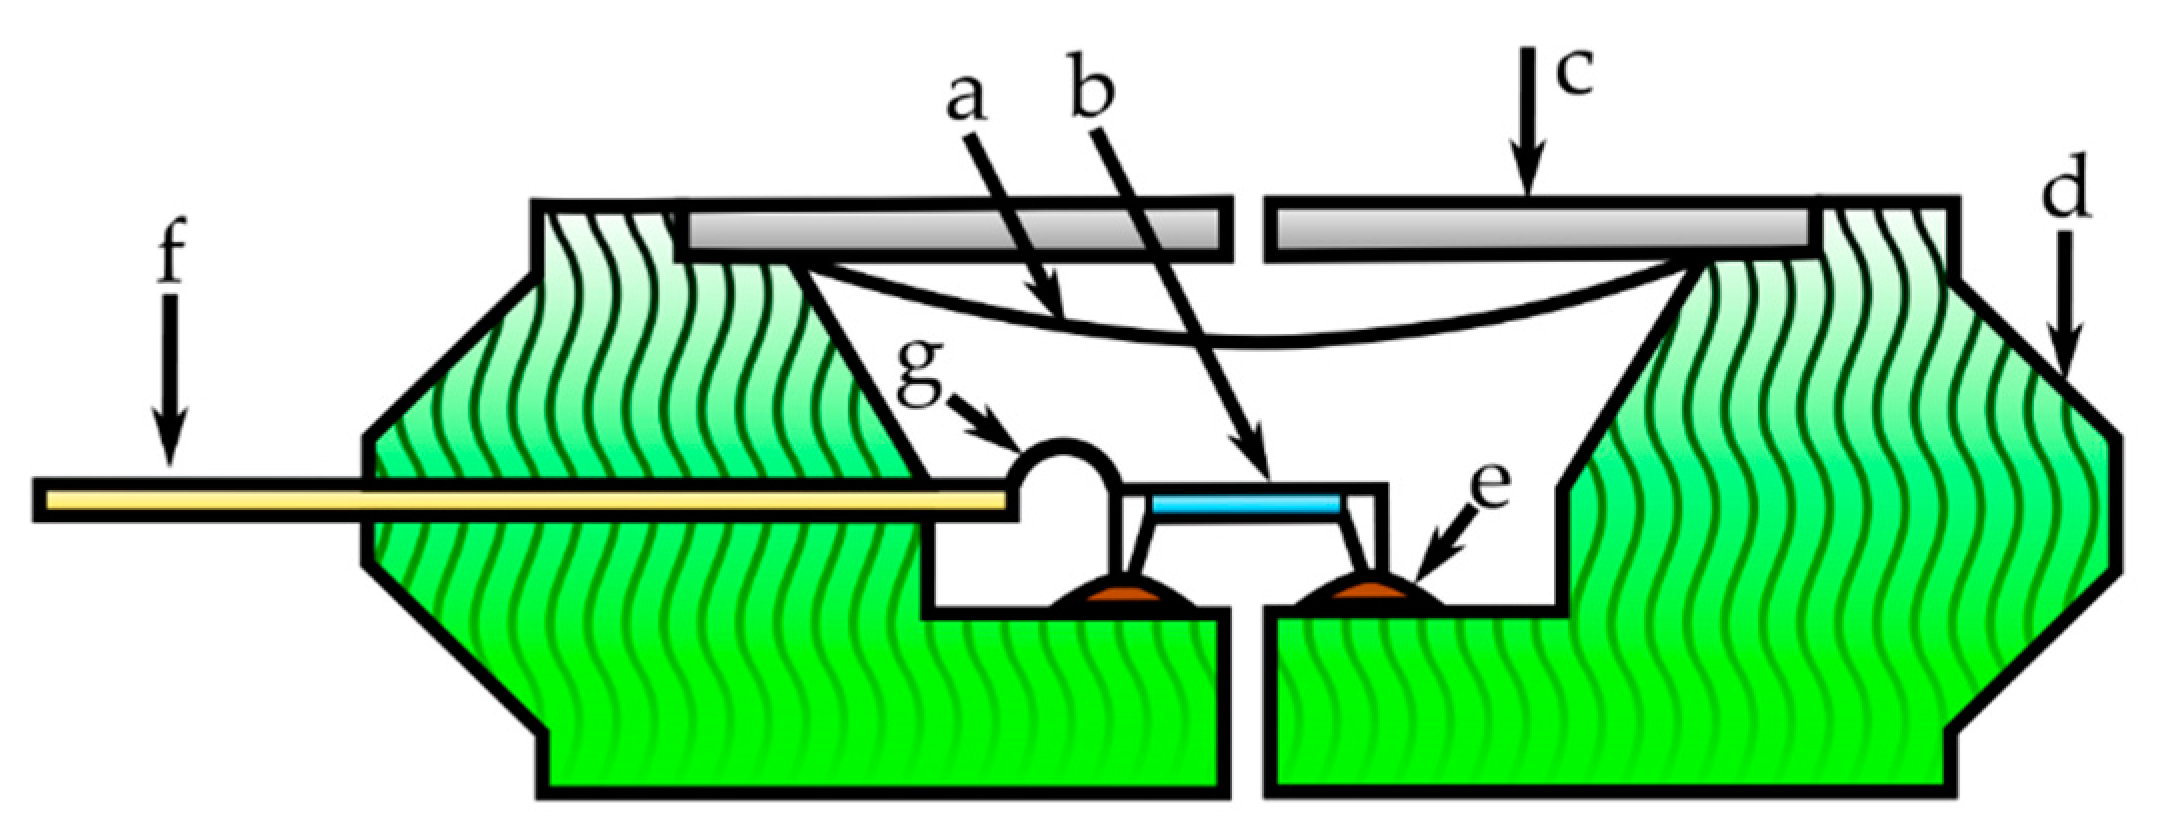
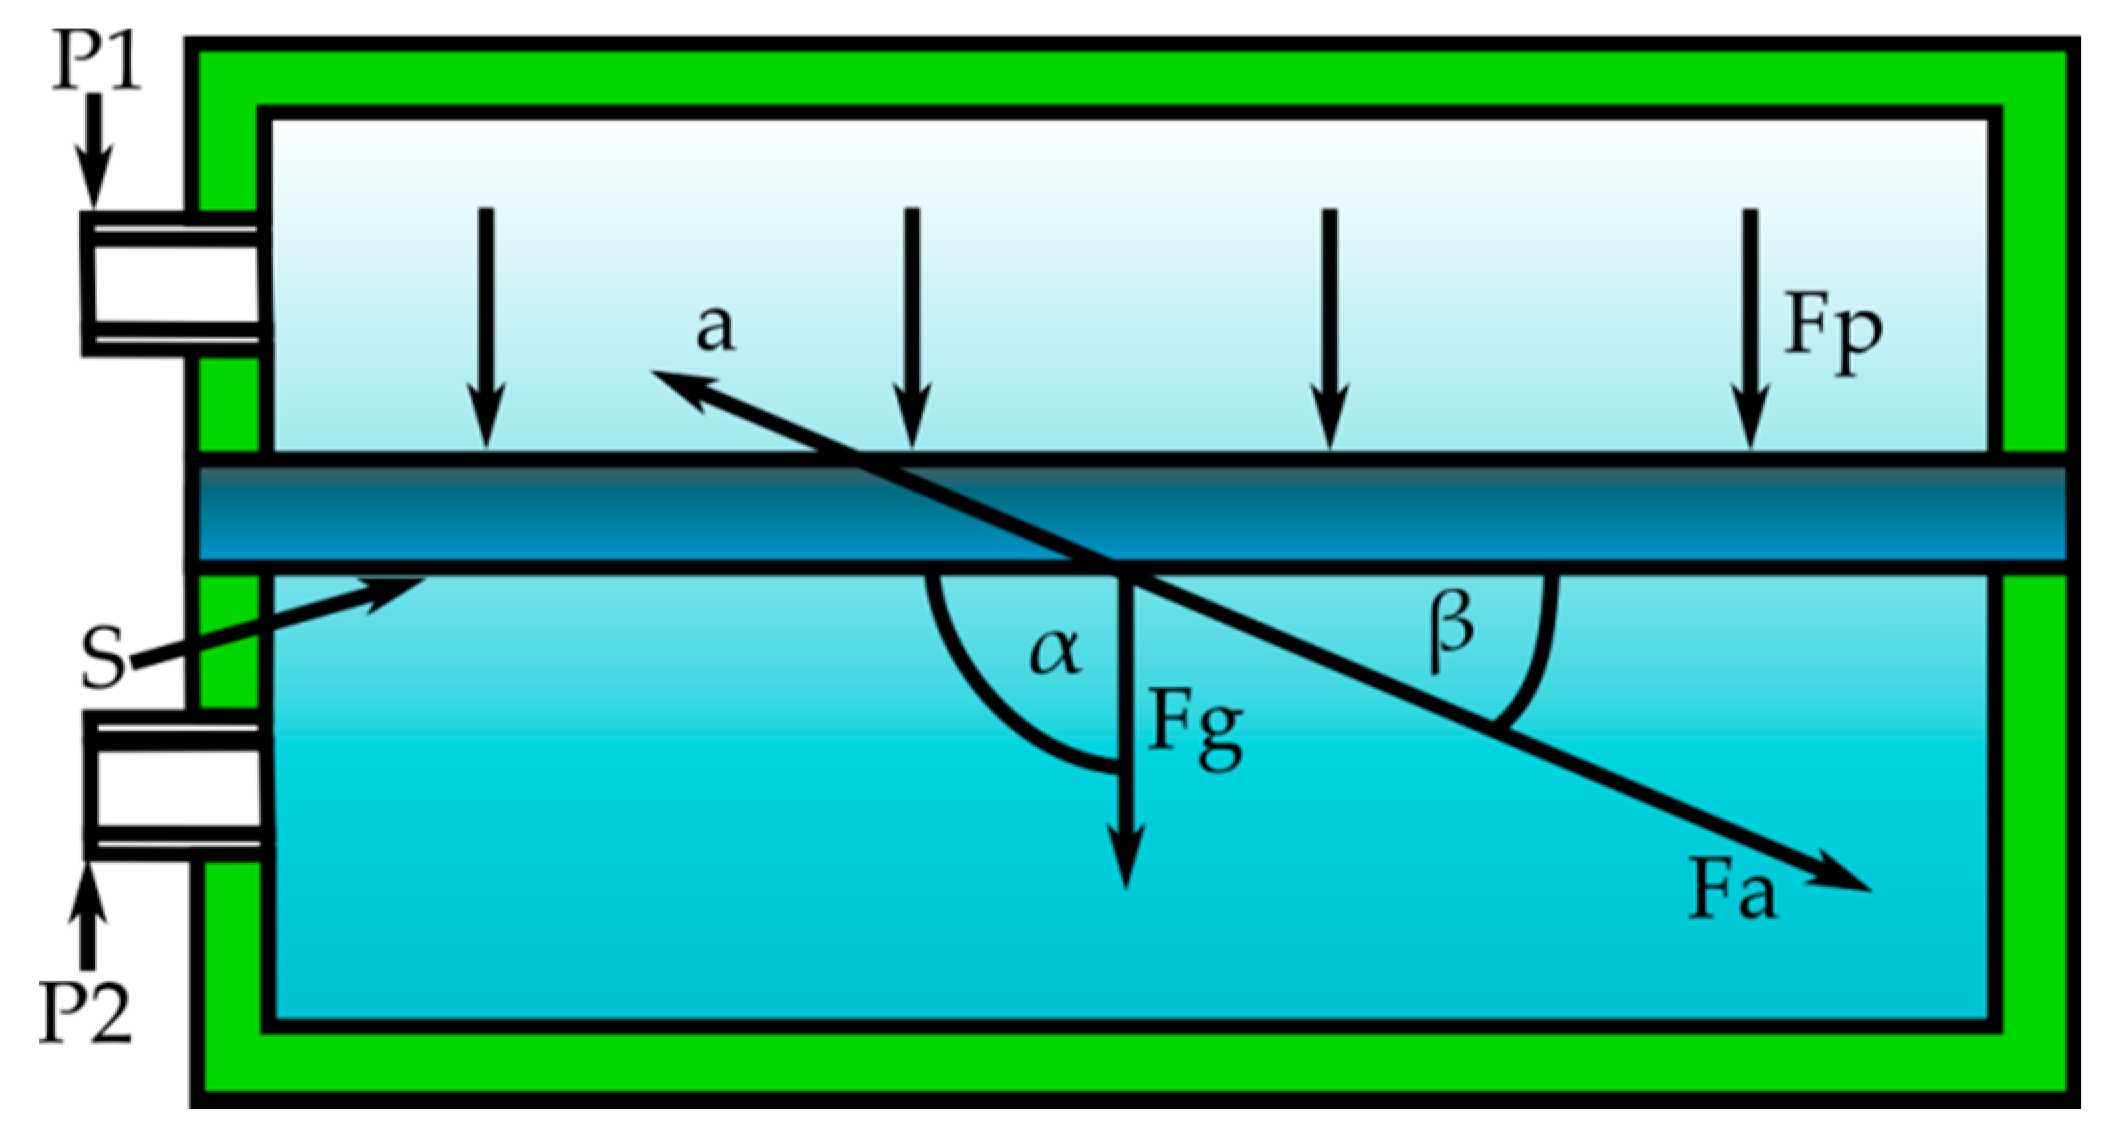
2. Influence of Acceleration on the Measuring Structure of Pressure Transducers

As mentioned in the first section, the essential element of the pressure transducer is the partition between the chambers, i.e., the elastic structure-b Figure 1. On the other hand, in Figure 2, the designation “s” was marked.
Regardless of the processing method or technology of manufacturing the transducer, the way of its operation remains similar. The pressure difference of p1 and p2 results, the difference of the pressure forces Fp on the elastic element causes its deformation. Therefore, it is enough to measure it using one of the methods and represent it as pressure.
F p = S Δ p
Unfortunately, this is not the only force acting on a membrane made of a material of a certain mass, thus subject to the laws of Newton’s physics.
F g = mgsin α
Fg is the weight force that depends on the angle of the transducer plane to the vertical direction and size of the mass of the membrane with the separating gel, as shown in Figure 2. The transducer shown in Figure 1 reacts to the acceleration of a static nature.
F a = m dv dt sin β
If it responds to static acceleration, it must also respond to dynamic acceleration related to the movement of the sensor relative to the ground, and it is, as described in Equation (3). Therefore, in addition to the force that is responsible for the pressure, the measuring structure is also influenced by the force associated with accelerations. It is expressed in the following expression:
F = S Δ p + mgsin α + m dv dt sin β

3. Research Results of the Influence of Acceleration on the Measuring Accuracy of Pressure Transducers

In all types of pressure transducers, the measurement is obtained by measuring the deformation of the elastic element. The previous considerations showed that one of the parameters causing deformation of the measuring diaphragm was its weight in reaction to the angle of orientation to the vertical direction. If the position of the pressure gauge or sensor is changed during pressure measurement, the indication may change significantly therefore. Based on the research carried out for selected latest generation piezoresistive sensors, considerable variability of the influence of acceleration on the measurement between the tested transducers can be noticed. However, it is positive that there is high repeatability of this phenomenon in specific groups of sensors.
Table 1 presents the comparison of the catalog data with the dependence of the acceleration effect obtained in the research. Unfortunately, most transducer manufacturers do not provide these data. The most noticeable influence of this phenomenon is in the inductive transducers. In the group of the latest technology, for example, piezoresistive transducers, this problem also occurs and is quite differential. That means, during the measurement with a modern MEMS transducer, pressure at the level of several Pascals, a change in the position or angular orientation of the transducer may result in a measurement error of 100%. The influence of acceleration concerns mainly low values of the measured pressure. Unfortunately, many manufacturers do not mention this impact in their catalog notes.

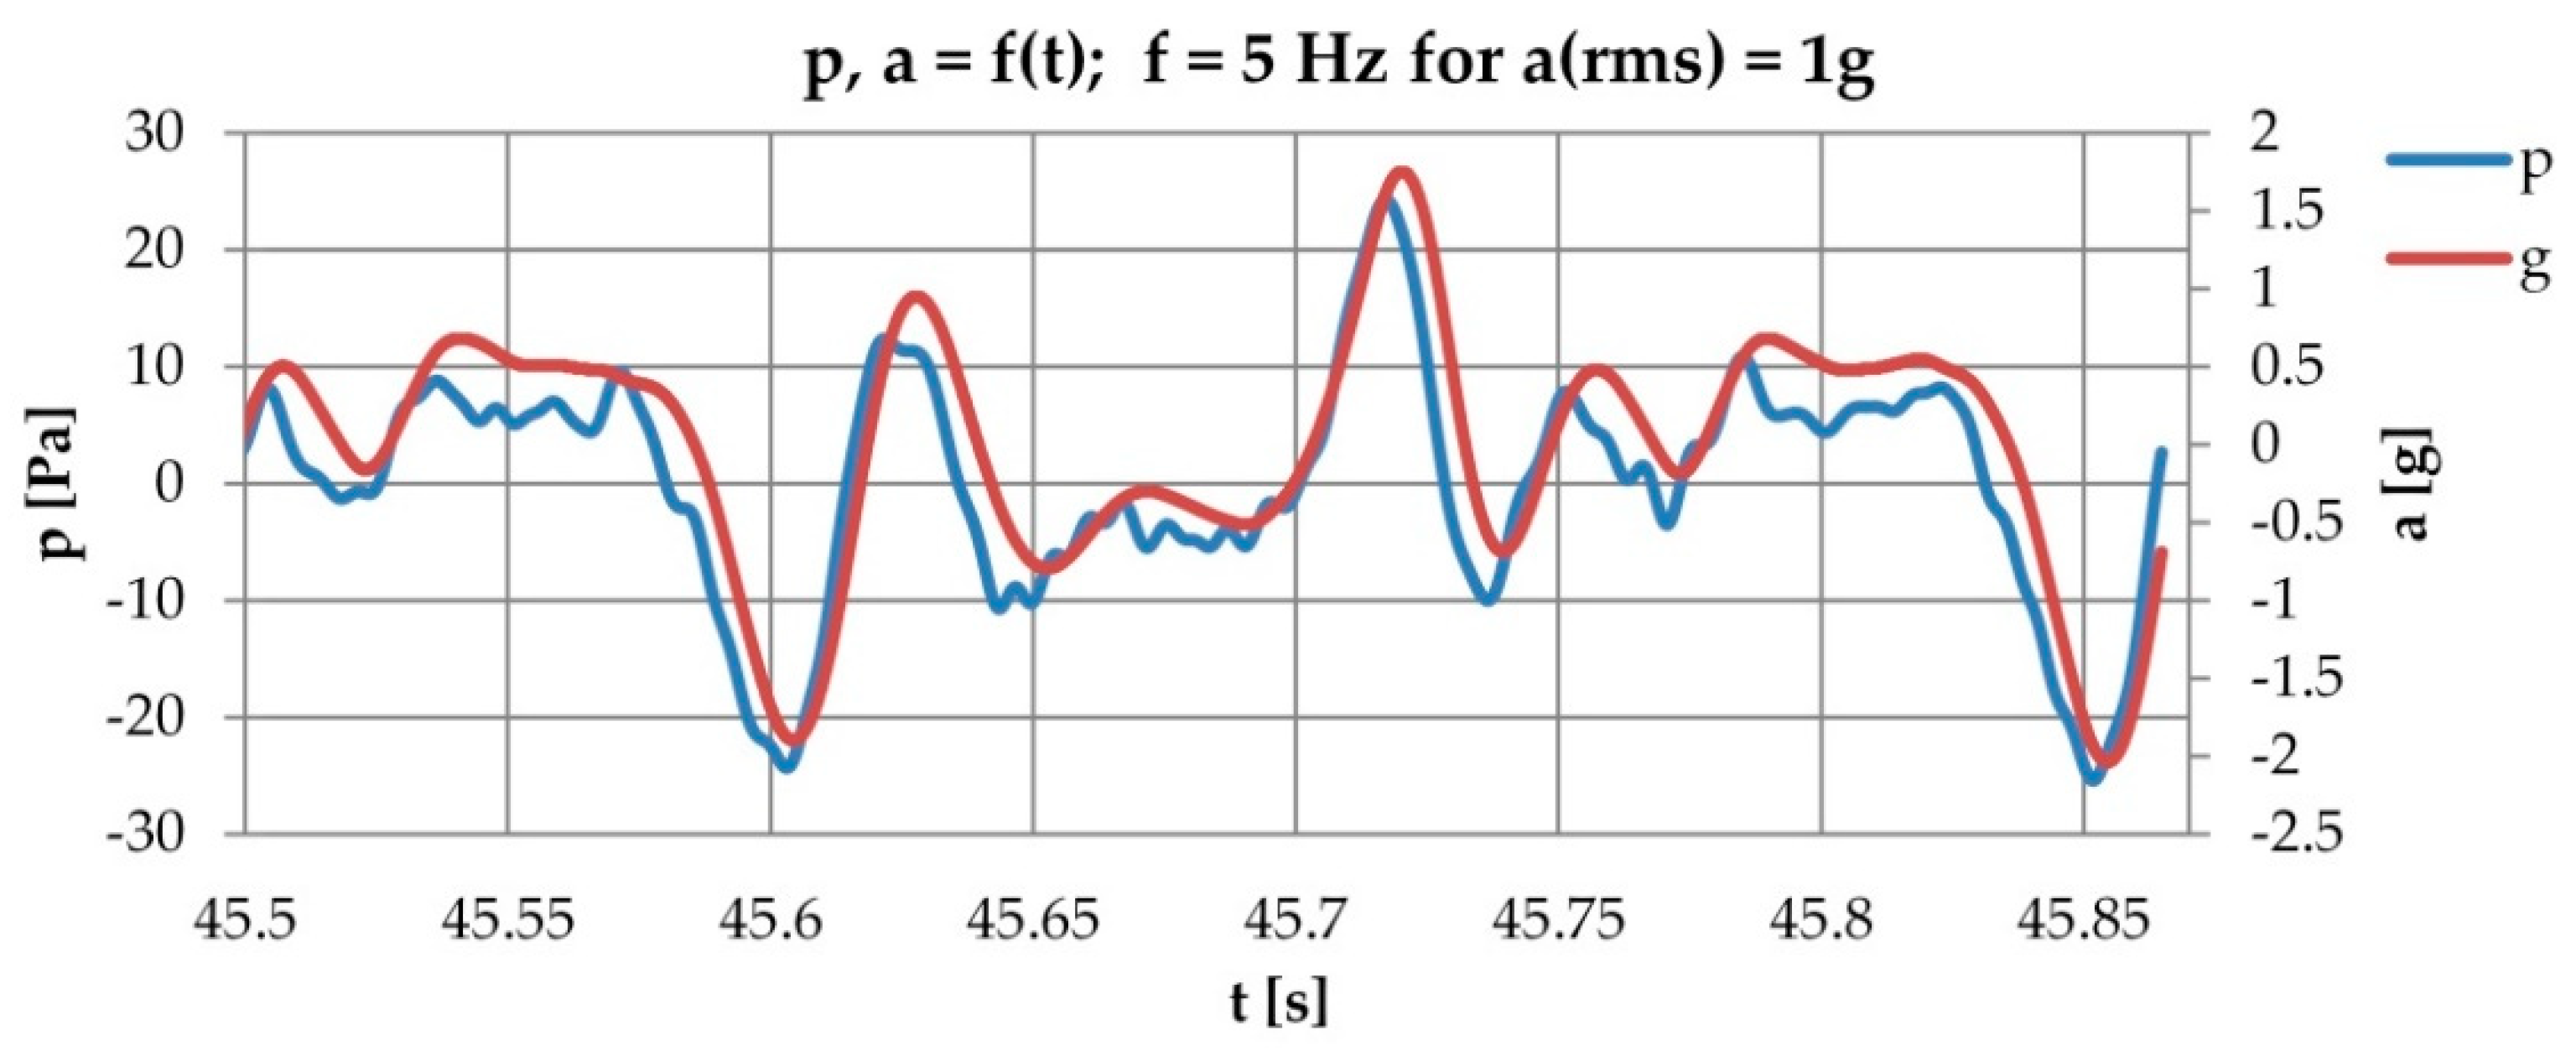
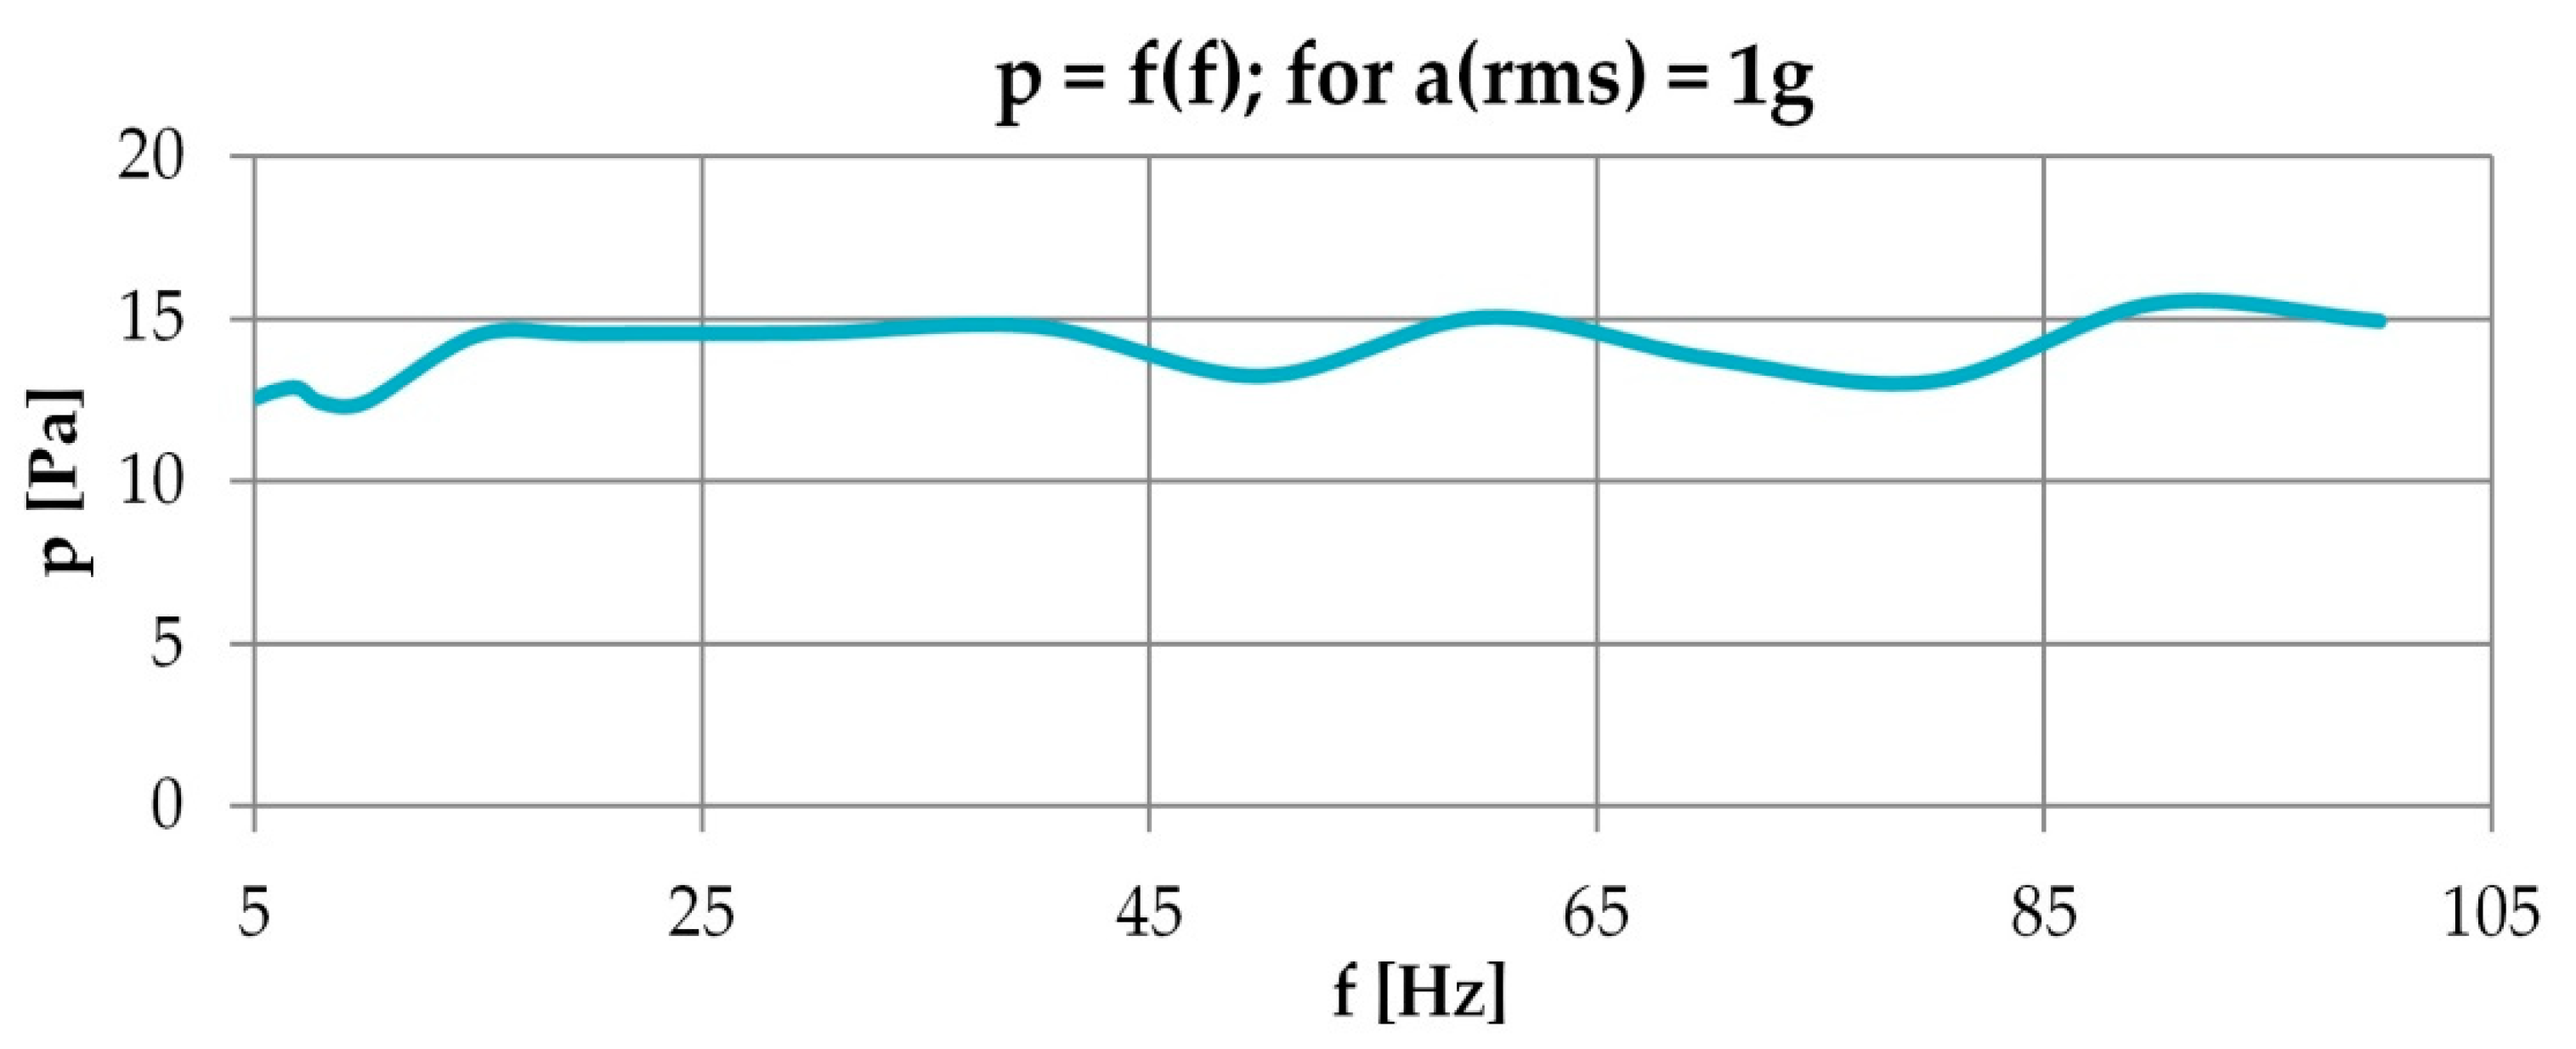
3.1. Influence of the Dynamic Component of Acceleration on the Pressure Measurement

The measurement of dynamic accelerations concerns measurements on moving objects, mechanisms, and elements of moving machines, e.g., on aircraft, where pressure is often measured. The parameters of the movement of such an object are measured indirectly by measuring the pressure with damming methods, e.g., with the directional Prandtl or Pitot tube with the participation of a selected transducer. In this way, the flight speed is measured, or the change in the speed of the flight altitude [12]. Aircraft descent or climbing parameters are also determined using pressure. In such situations, measurement errors from the converter caused by the dynamic acceleration may be very important.
Figure 3 shows the dependence of the output signal from the converter subjected to increasing acceleration, with the pressure signal equal to zero. The chart in 3., scaled to pressure units, shows the transmitter indications caused only by changes in acceleration, at a given set pressure at a constant unchanged level.
Theoretically, a pressure sensor working as a pressure transmitter should only respond to a change in inlet pressure. In real conditions, it turns out that this is not the case. Since the input pressure difference is zero, the output should also be zero. However, it increases proportionally to the amplitude of acceleration to which it has been influenced. Figure 4 shows the research results on the influence of harmonic force signal (vibration), where the sensor was mounted on a vibrating table with controlled vibration parameters. No pressure to the sensor was applied. Both chambers were pressure equalized. Therefore, the pressure output from the transducer should be zero. Unfortunately, Figure 4 shows otherwise. Moreover, the visible signal of the transmitter’s response scaled to the amount of pressure in Pa units, maps the form of the forcing input signal, the acceleration a(t). The shape of the p(t) response chart illustratively corresponds to the nature of mechanical vibrations resulting only from the given acceleration. On the other hand, Figure 5 shows the results of an experiment considering the polyharmony type of input forcing signal. After analyzing the p(t) response from Figure 5, similar conclusions can be taken out as in the case of the harmonic input forcing signal from Figure 4.
Figure 6 shows the dependence of the output signal as effectiveness values depending on the frequency of the set vibrations. The example tests were carried out by changing the frequency of the forcing signal in the range from zero to 2000 Hz.

3.2. Examples of Incorrect Use of Chosen Pressure Sensors

In many situations, while performing pressure measurements on mechanical objects, the acceleration influence problem can be very significant. Two examples of cases are shown below. The first concerns aviation issues, and the second one shows measurements on stationary machines with rotating elements. In aviation, the typically measured flight parameters related to the translational movement of the aircraft are the flight speed of the object, speed of climb or descent, and flight altitude. Measurements of these quantities are made based on pressure processing, i.e., with the use of pressure sensors. In stationary ground-based devices, by considering that the magnitude of the influence depends on the angle of the sensor plane to the acceleration vector, so the impact of acceleration can be neutralized for selected conditions by proper sensors installation. Unfortunately, for objects that move in all directions, especially aircraft or submarines, this is a more complex action and sometimes physically impossible to perform.

Speed Measurement of Flying Objects

The measurement of the speed of flying objects is carried out indirectly by measuring the dynamic pressure, for example, supplied from a Prandtl tube installed in the fuselage can be expressed in the form of a general Equation:
w = 2 P d ρ
where: w-airplane flight speed; Pd-dynamic pressure from the Prandtl damming probe; ρ-air density.
As can be seen from dependence Equation 5, the estimation of the velocity is performed by the pressure signal from the pressure transducer supplied from the Prandtl probe. Therefore, the problem of sensitivity to the variability of the acceleration of the object is important.
Table 2 shows several results of the dependence of the error signal on the acceleration converted into flight speed in the case of speed measurement. One can see how huge errors in measuring basic flight parameters can be.
Changing the trajectory during the flight with an acceleration of, e.g., 5 g, results in a speed measurement error of about 36 km. The positive or negative value depends on the direction of this change. The indications of such a measurement will be overestimated or understated. Ignoring this influence may have dangerous consequences, especially in this type of application. Obtaining changes in acceleration at the level shown is nothing special, as in military aircrafts these are significantly higher values. Similarly, in light unmanned airplanes, due to the significant relation of low inertia, because of the object mass in relation to speed rate of velocity parameters. It should be noticed that in most cases, flying objects use electronic autopilots. The measured signal from the pressure instruments read by such a system is the input to generate the proper input signal to controls the electronic propulsion and avionics systems.
An example is measuring pressure variability on a wind turbine profile.
In research, especially modeling, to measure the forces and dynamics of pressure on the surface of a wind turbine profile, the sensor is located closest to the pressure source, i.e., inside the profile [27]. In this case, the sensor is subjected to a variable centripetal acceleration.
Example data:
  • Type of wind turbine: vertical type;
  • Rotational speed: 300 [rpm];
  • Staggering radius: 1.2 [m];
Estimation of loads acting on the sensor:
  • N = 300 [rpm] = 5 [Hz] so: ω =31.4159265   [ rad s ]   31 [ rad s ]
  • Centripetal acceleration:
    a = ω 2     R = 1180 [ m s 2 ] = 120 [ g ]
  • So, the maximum output from acceleration for the sensor shown:
    u = 108 13 = 1400   [ Pa   ]
On the other hand, the range of pressure variability, which is within the scope of tests on the profile surfaces, is the range of the order <0; 6000> Pa.
The conclusion is that the signal derived from the acceleration is within the expected value of the pressure variation. This is a situation where the measured quantity will be measured with a huge error. The example is for a very small model. In the case of large ones where the spinning diameter may be in the order of 150 m, the situation may be more significant.

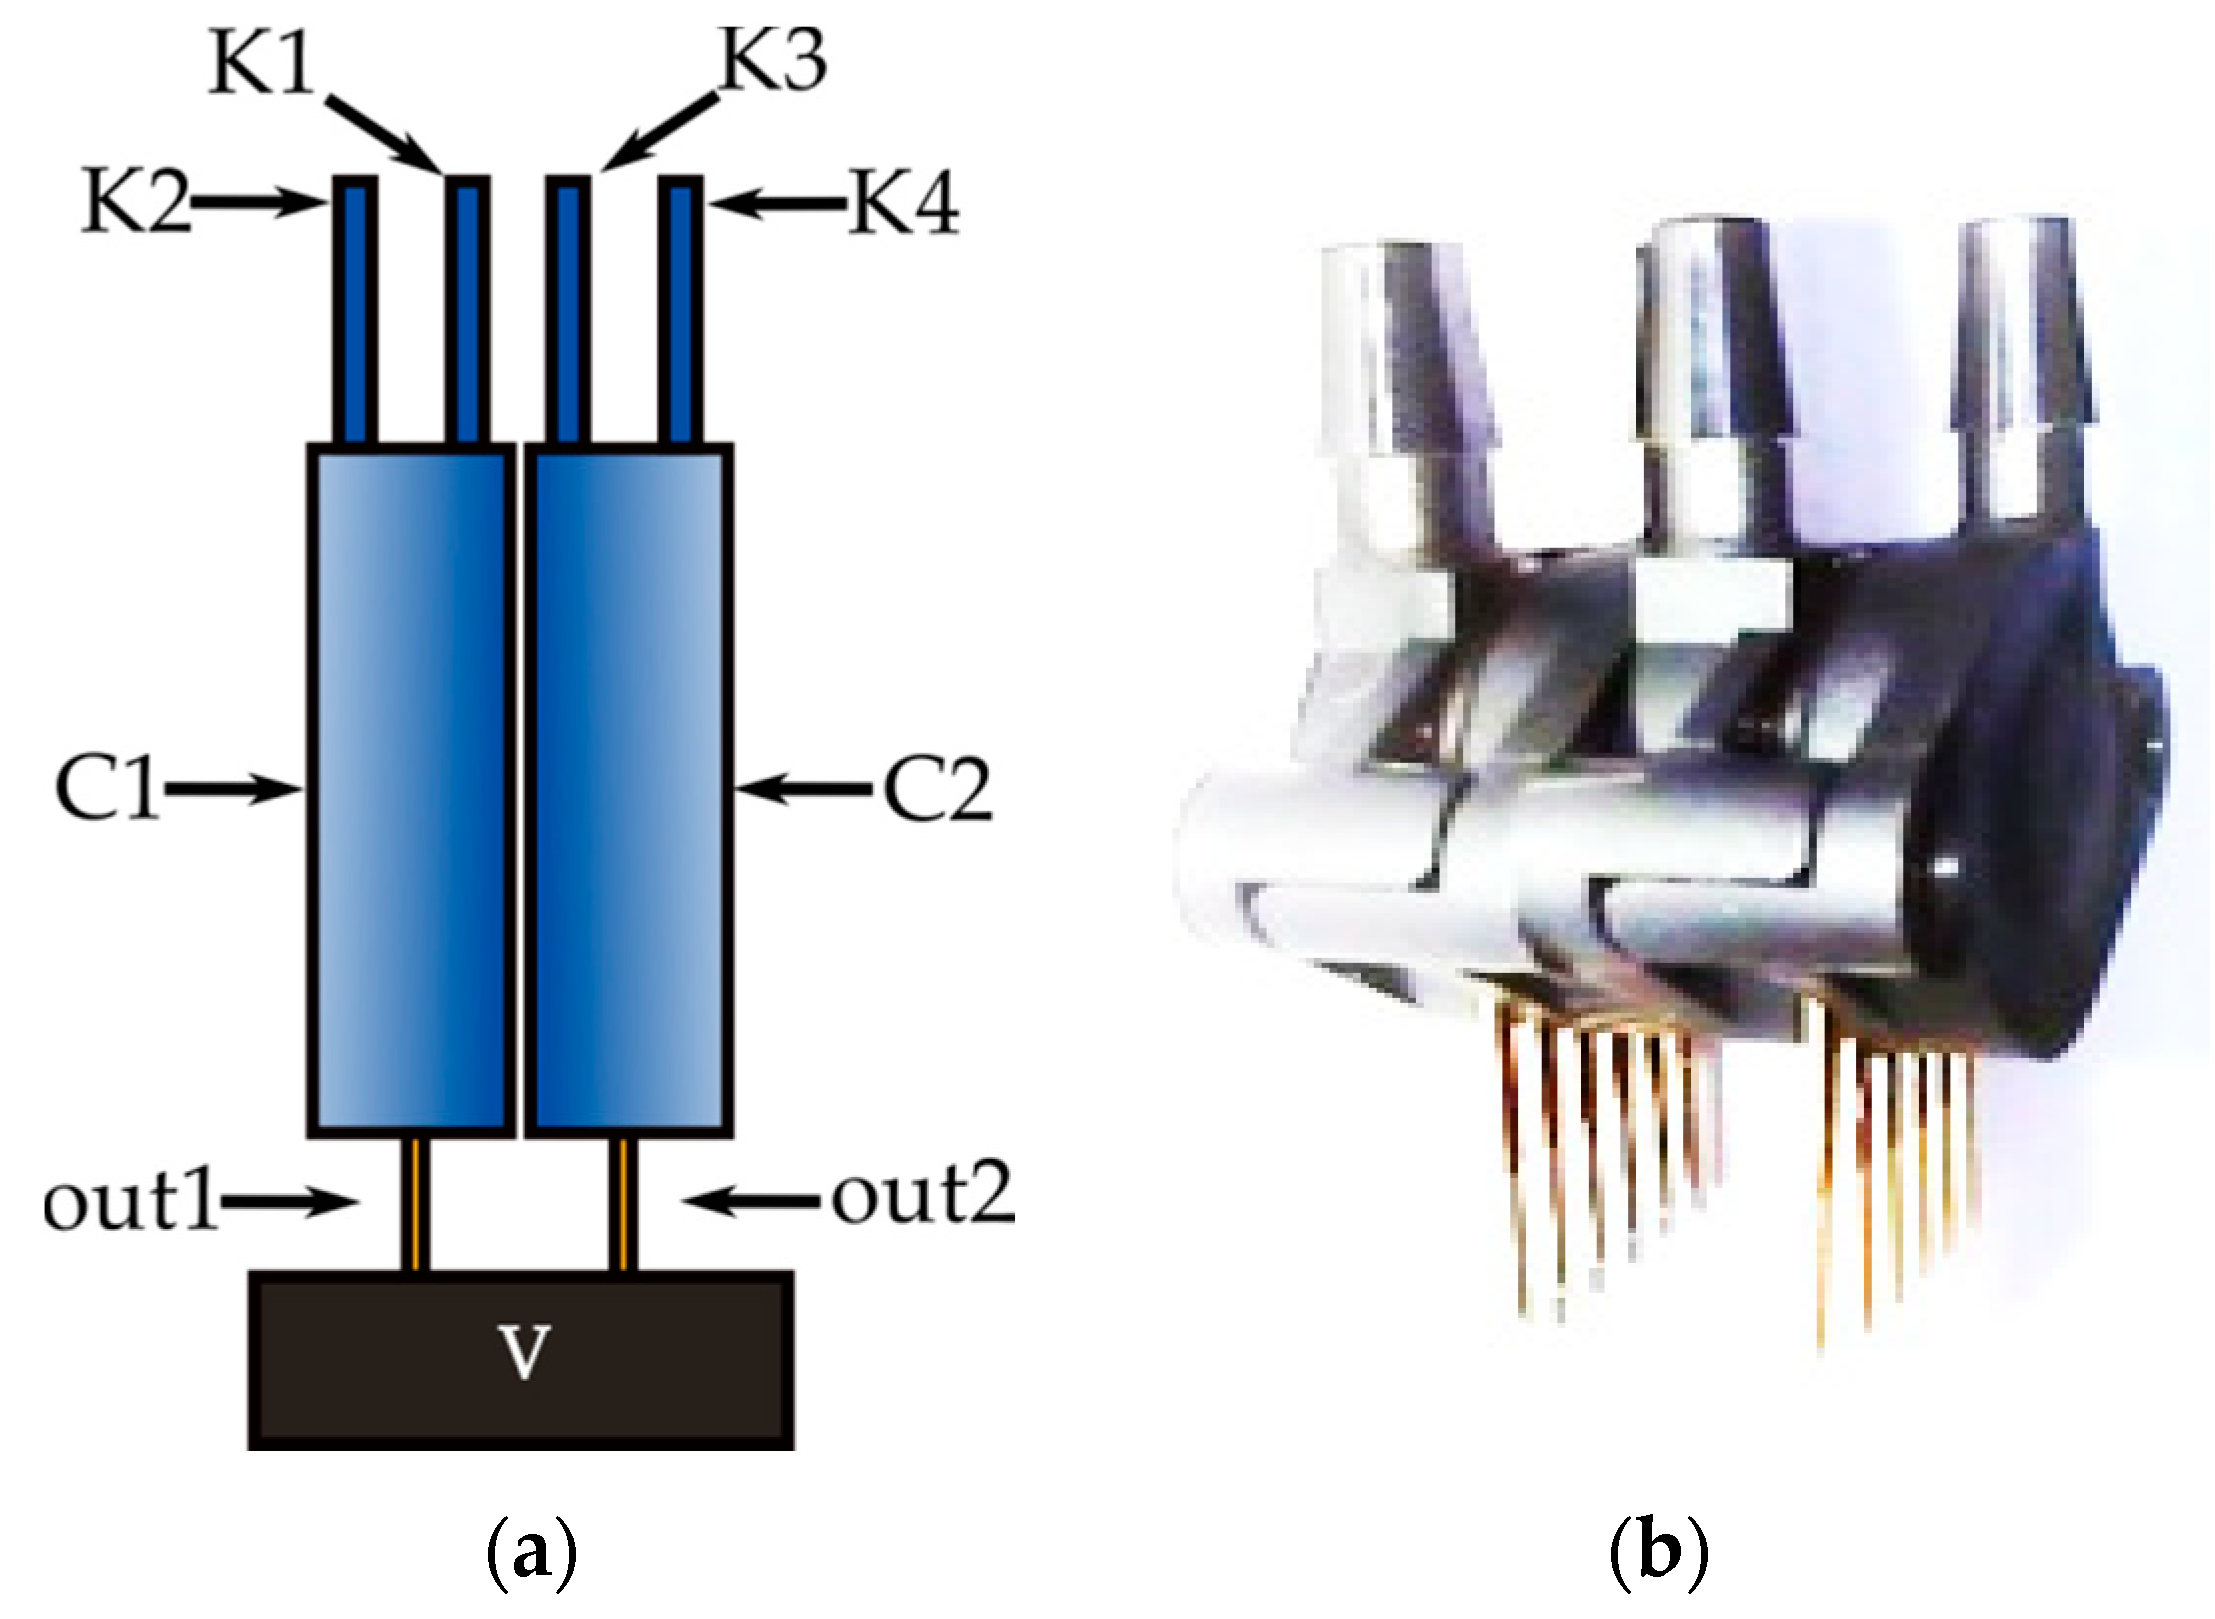
4. The Research Methodology and Proposed Solution

The measurement system was USB1608FS 16 bit and the measurement software DASYLAB. An exemplary structural software is shown in Figure 7.
The tested pressure transducers had analog outputs and standard ADXL family accelerometer measured as reference transducer static and dynamic accelerations. The influence of static acceleration was tested by changing the orientation of the transducer to the gravity vector ± 90 degrees. Thus, a variability of 2 g was obtained. For higher values, sensors were installed on the centrifuge during testing of V-type wind turbines in a wind tunnel. Under such conditions, constant accelerations for ω = const were obtained. The experimental stand shows Figure 8.
On the other hand, the influence of dynamic acceleration was realized by installing the transducer tested on the electrodynamic vibrating table with a known adjustable value of acceleration and vibration frequency Figure 9. In Figure 7 the “a” icon is the USB1608FS measuring system, while the others are libraries of the program that performs measurement, processing, “c” virtual tools, and “f” recording of instantaneous values and “g” of averaged values.

4.1. The Proposed Method for Eliminating the Influence of Acceleration on the Measurement and Error of the Pressure Sensor

To perform correct measurements in the abovementioned situations, the simplest solution would be to prepare a hybrid sensor structure made of two identical transducers. It can be obtained from merging them in the same spatial orientation with mechanical merging, e.g., gluing.
The measurement method with such a sensor would also be a compensation method [28]. In such a configuration shown in Figure 10, the transducer C1 is a measuring transducer to which the measured pressure is applied. The measured signal is the sum of the real signals, i.e., the pressure origin and the acceleration signals. The C2 transducer works as an acceleration measuring device, the K3 and K4 ports are not connected. The difference between the two output signals is a signal only from the measured pressure according to the dependence (6).
U = U 1 U 2 = f [ k ( Δ p ; g ; a ) k ( g ; a ) ] = k Δ p
where U—output signal from the complex transducer; U1—the output signal from the measuring transducer; U2—the output signal from the compensation transducer; ∆p—measured differential pressure; K—constant of the transducers; g—Earth acceleration of a static nature; and a—dynamic acceleration.

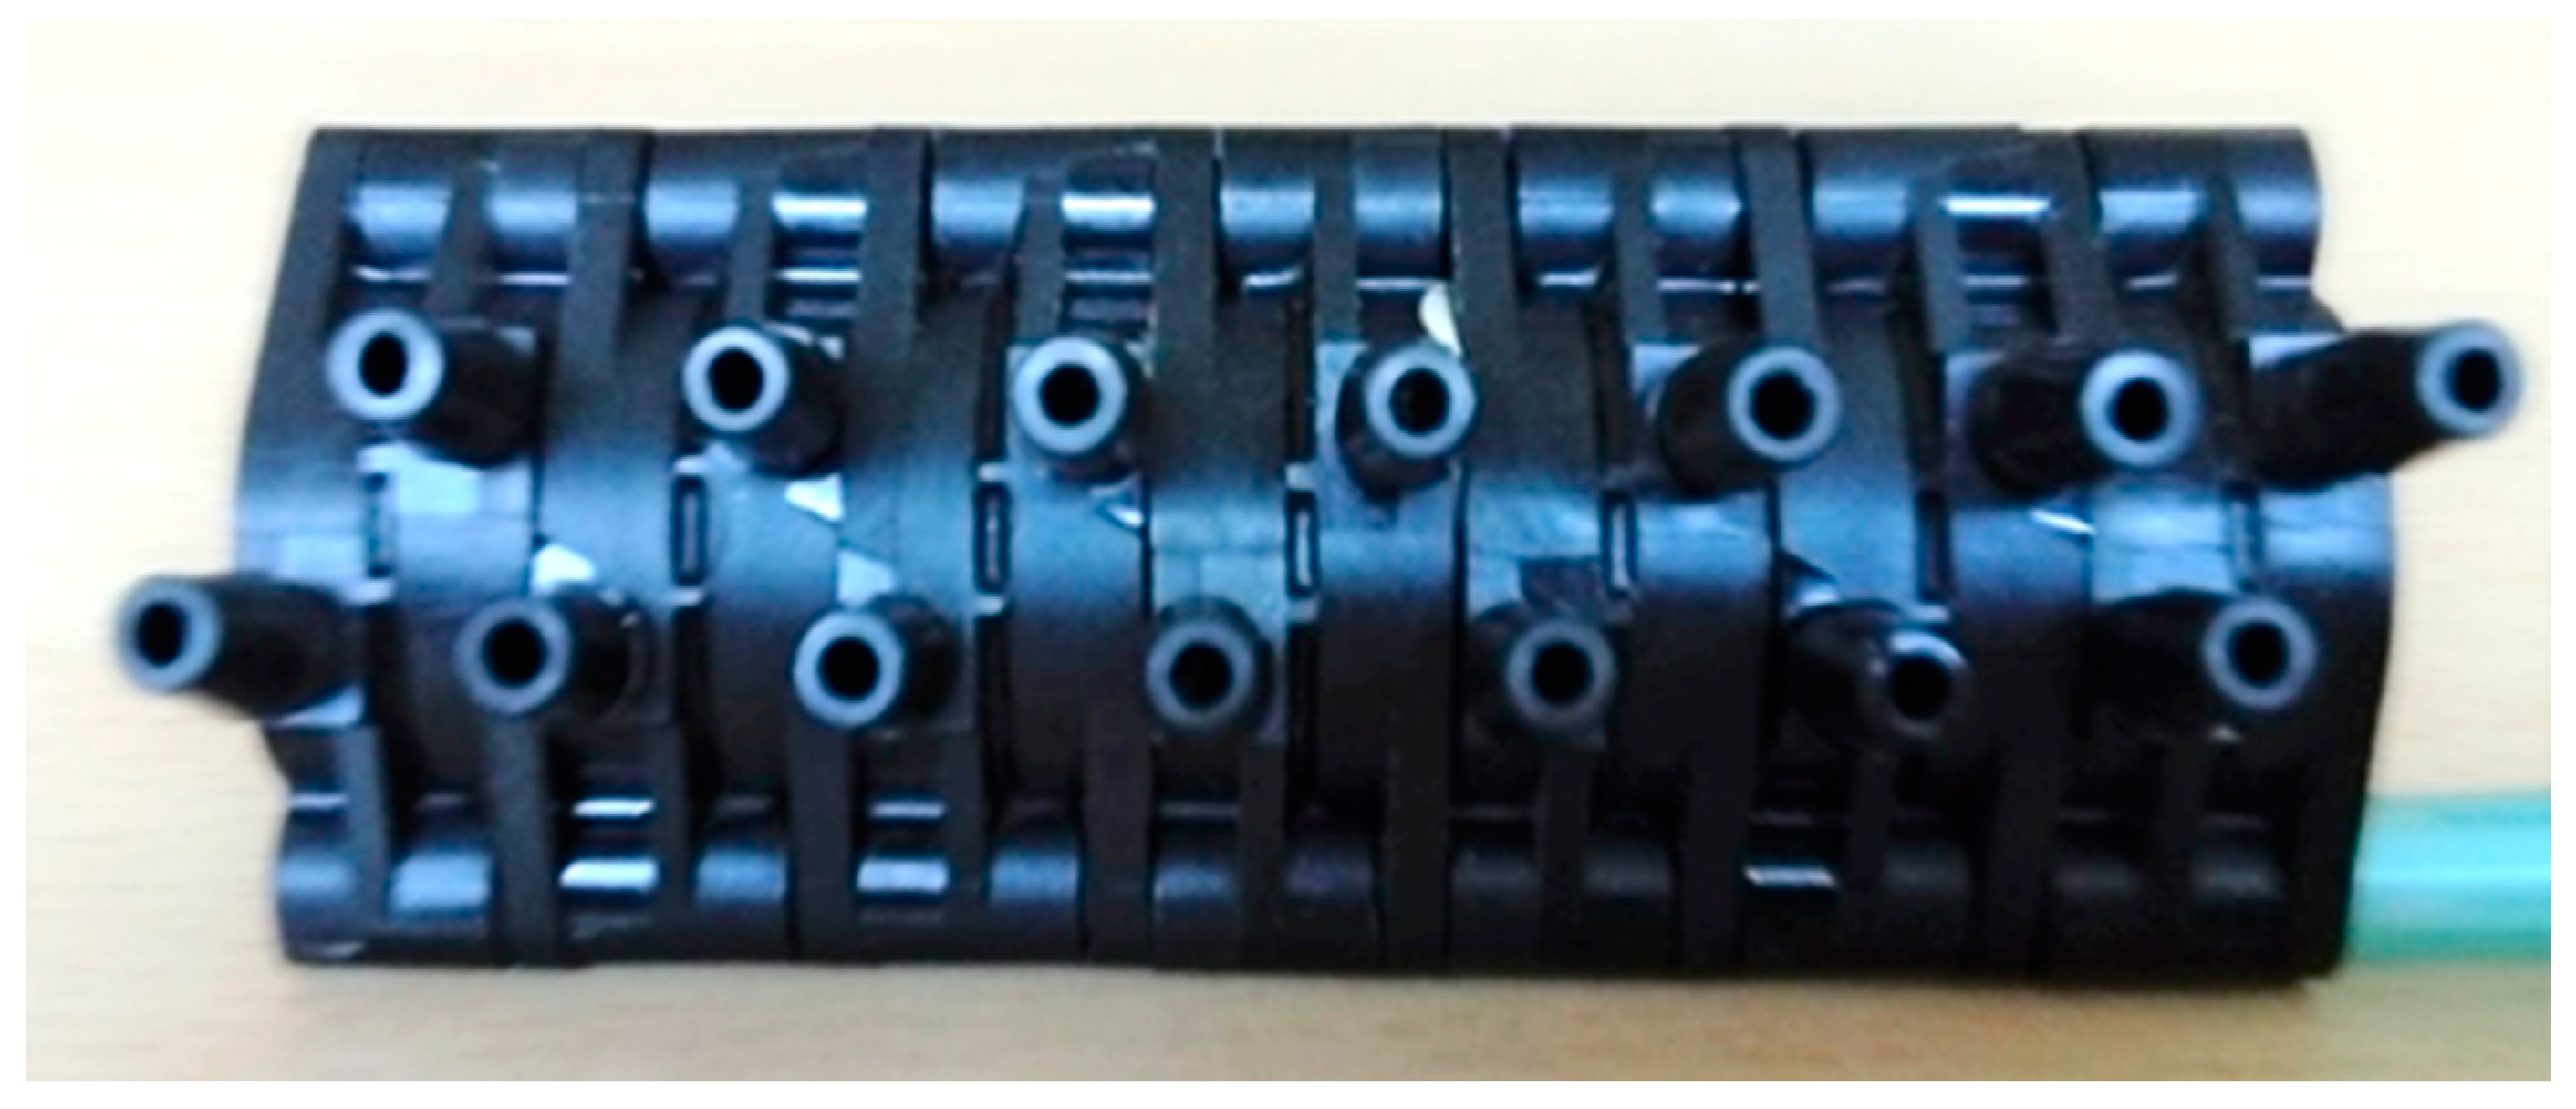
4.2. Proposed Multi-Point Pressure Measurement System

Proposed multi-point differential pressure measurement on a moving object can be performed using the described compensation method of the influence of acceleration on the pressure measurement. Presentation of the prepared system in the form of individual sensors units in one single package, where the sensor is used for compensation is shown in Figure 11 In such an arrangement, the package is adapted to measure six pressures. The seventh-external sensor is a reference for the others, and it works as an accelerometer. The condition is that all sensors must be from the same group of measurement ranges.

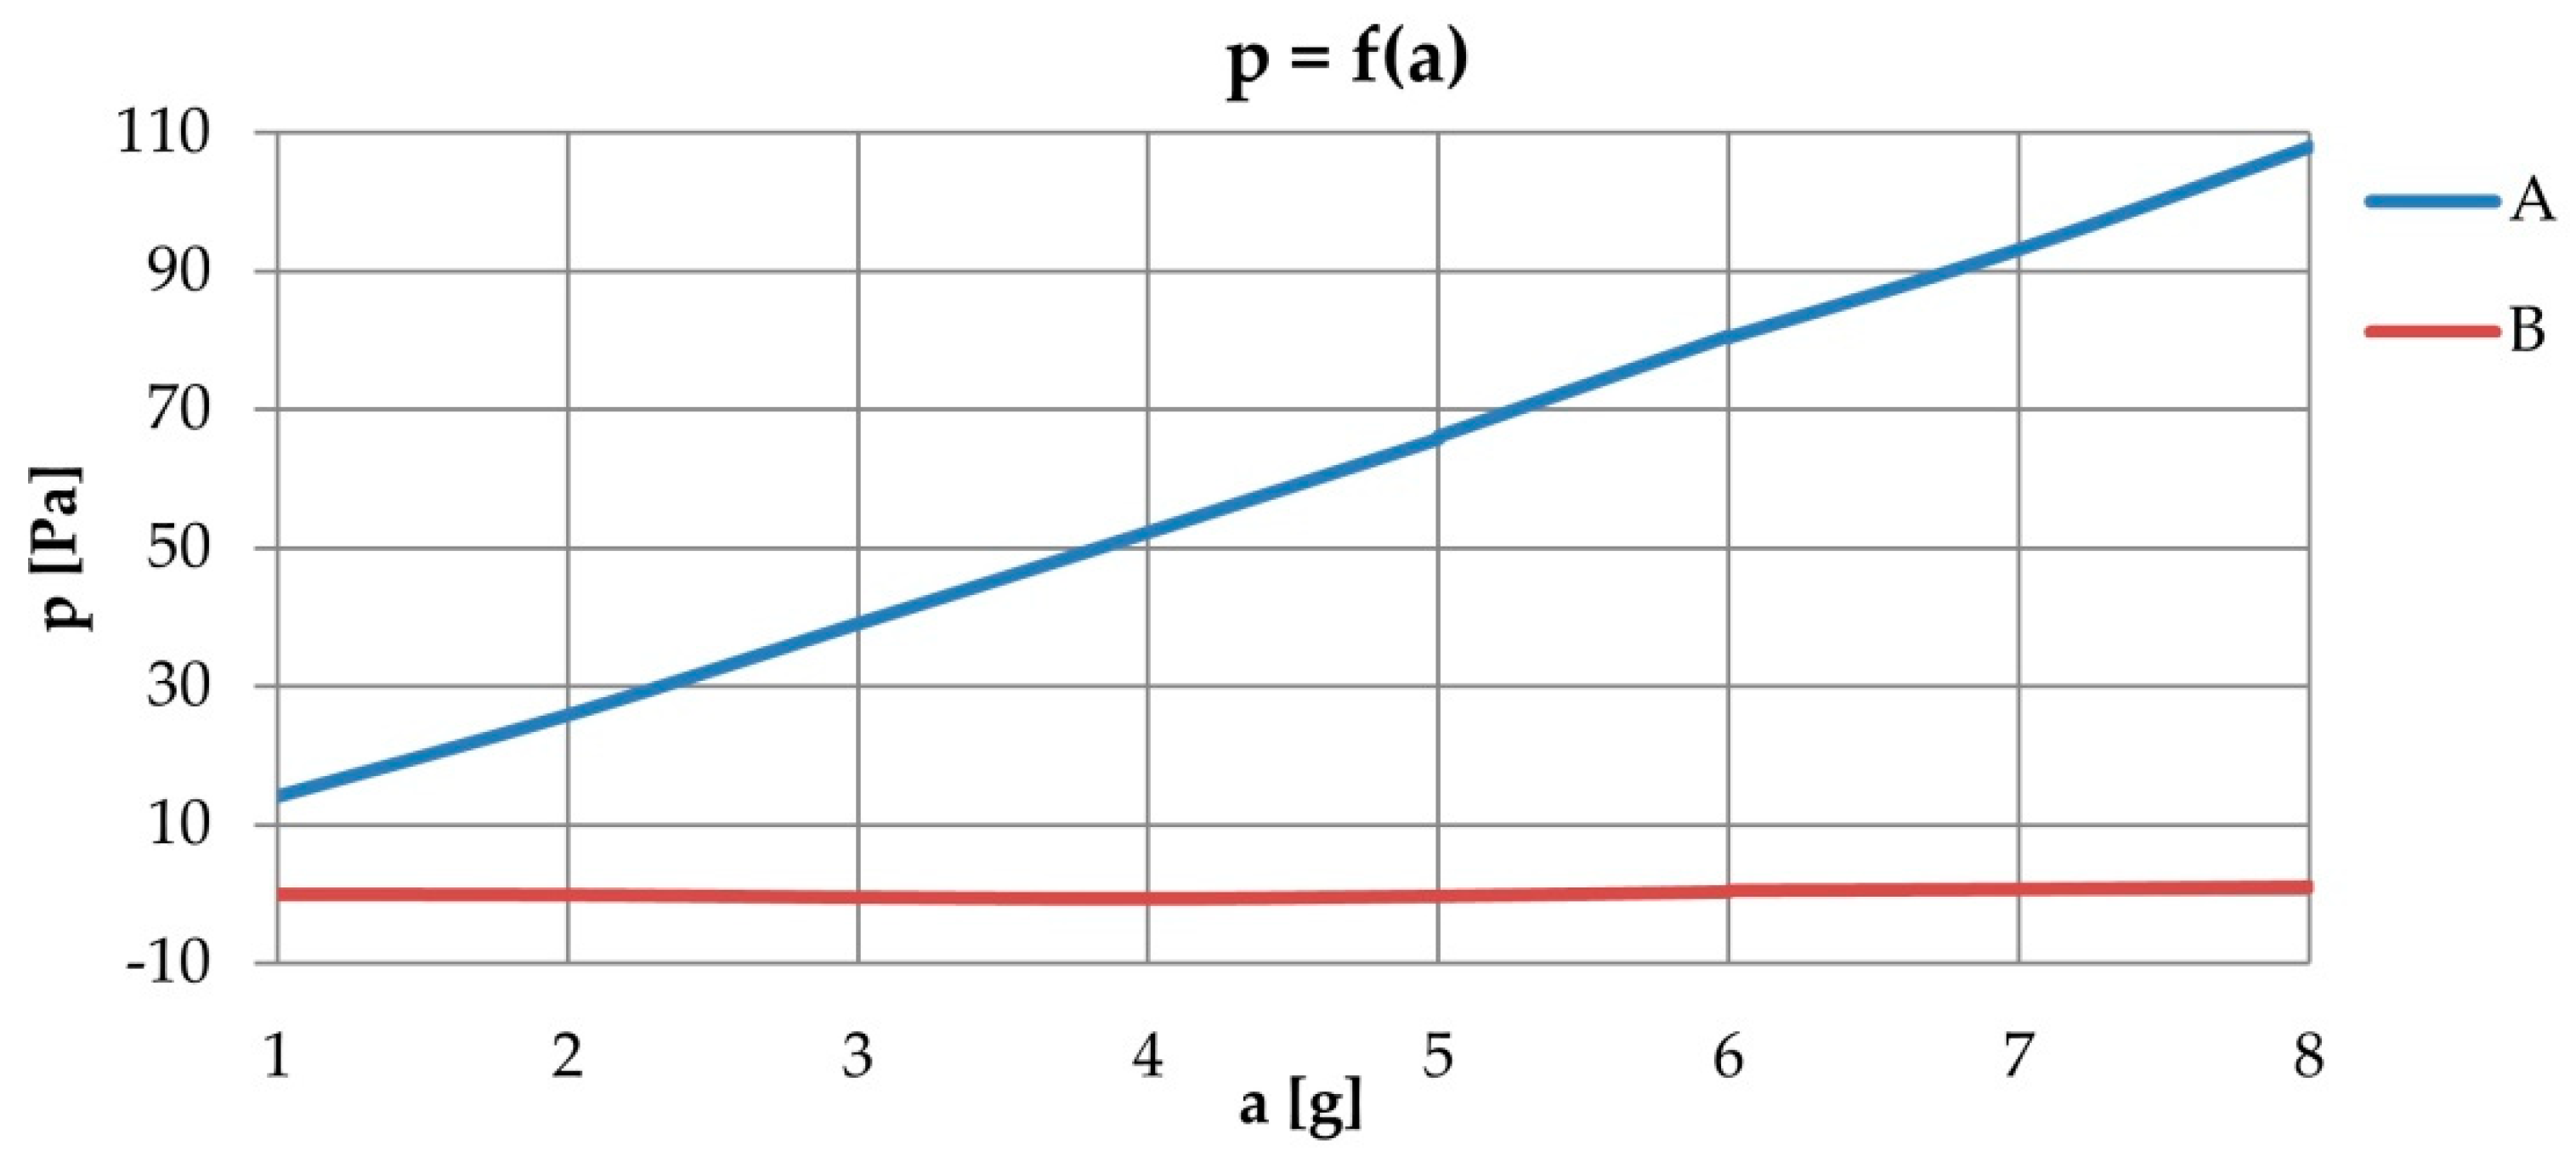
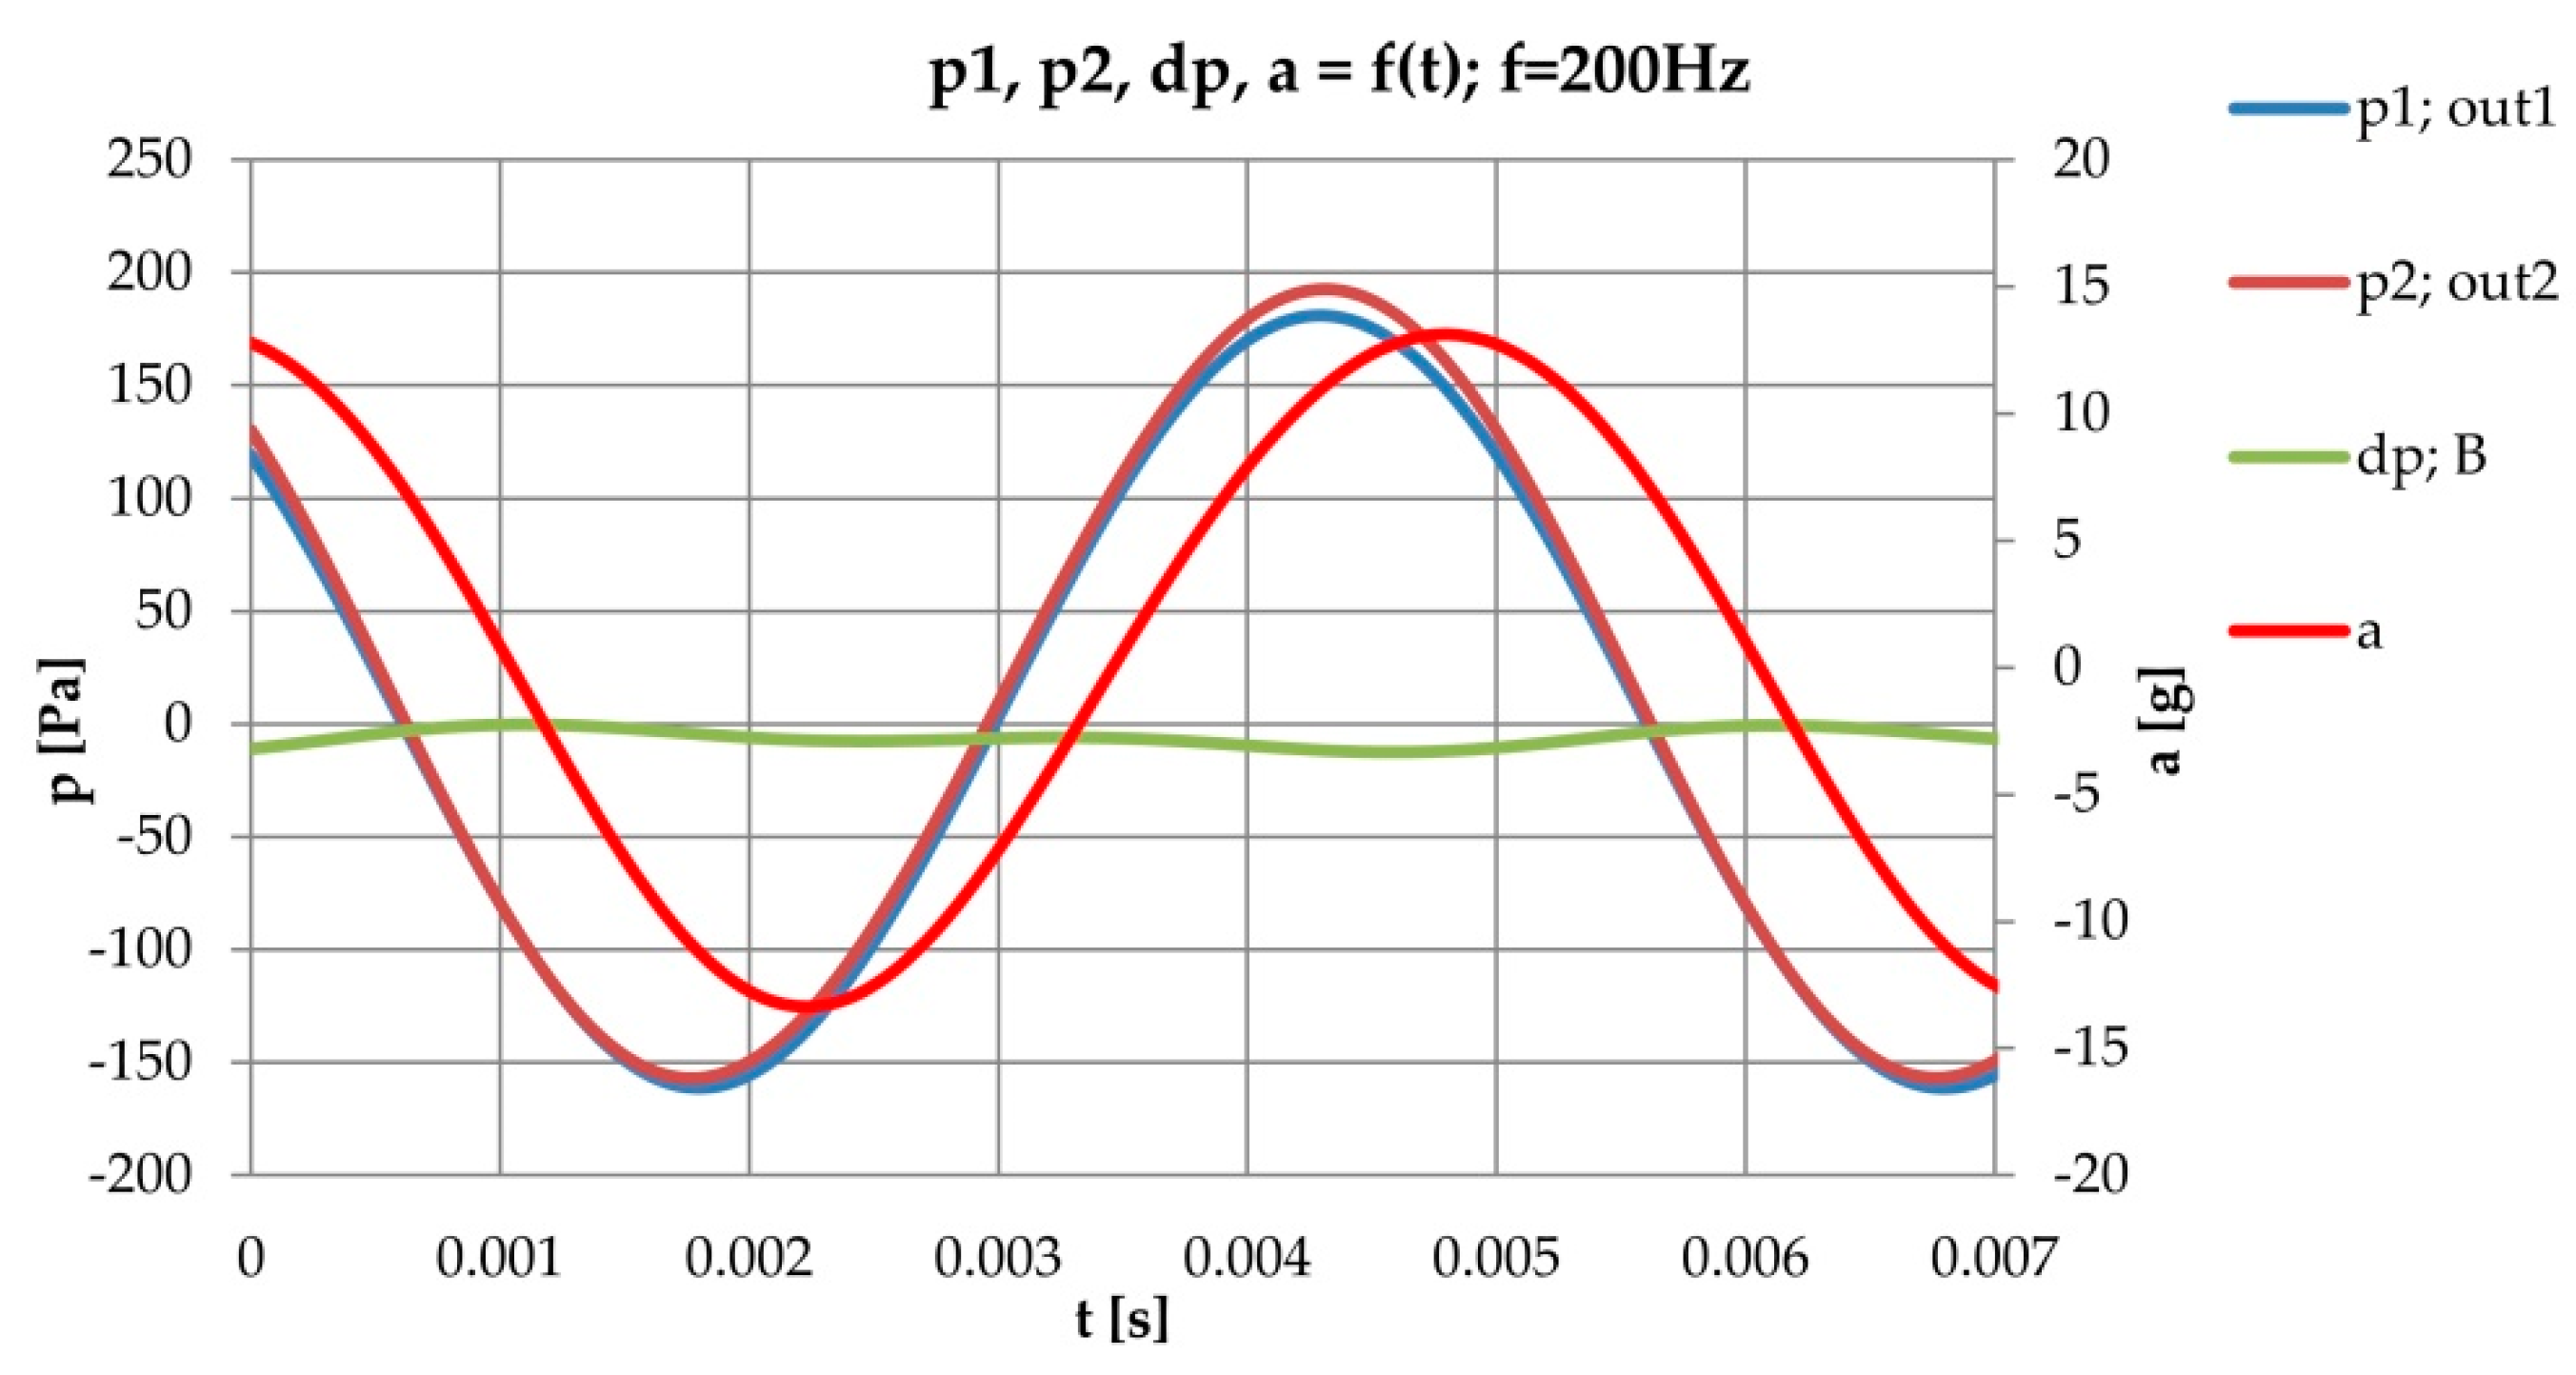
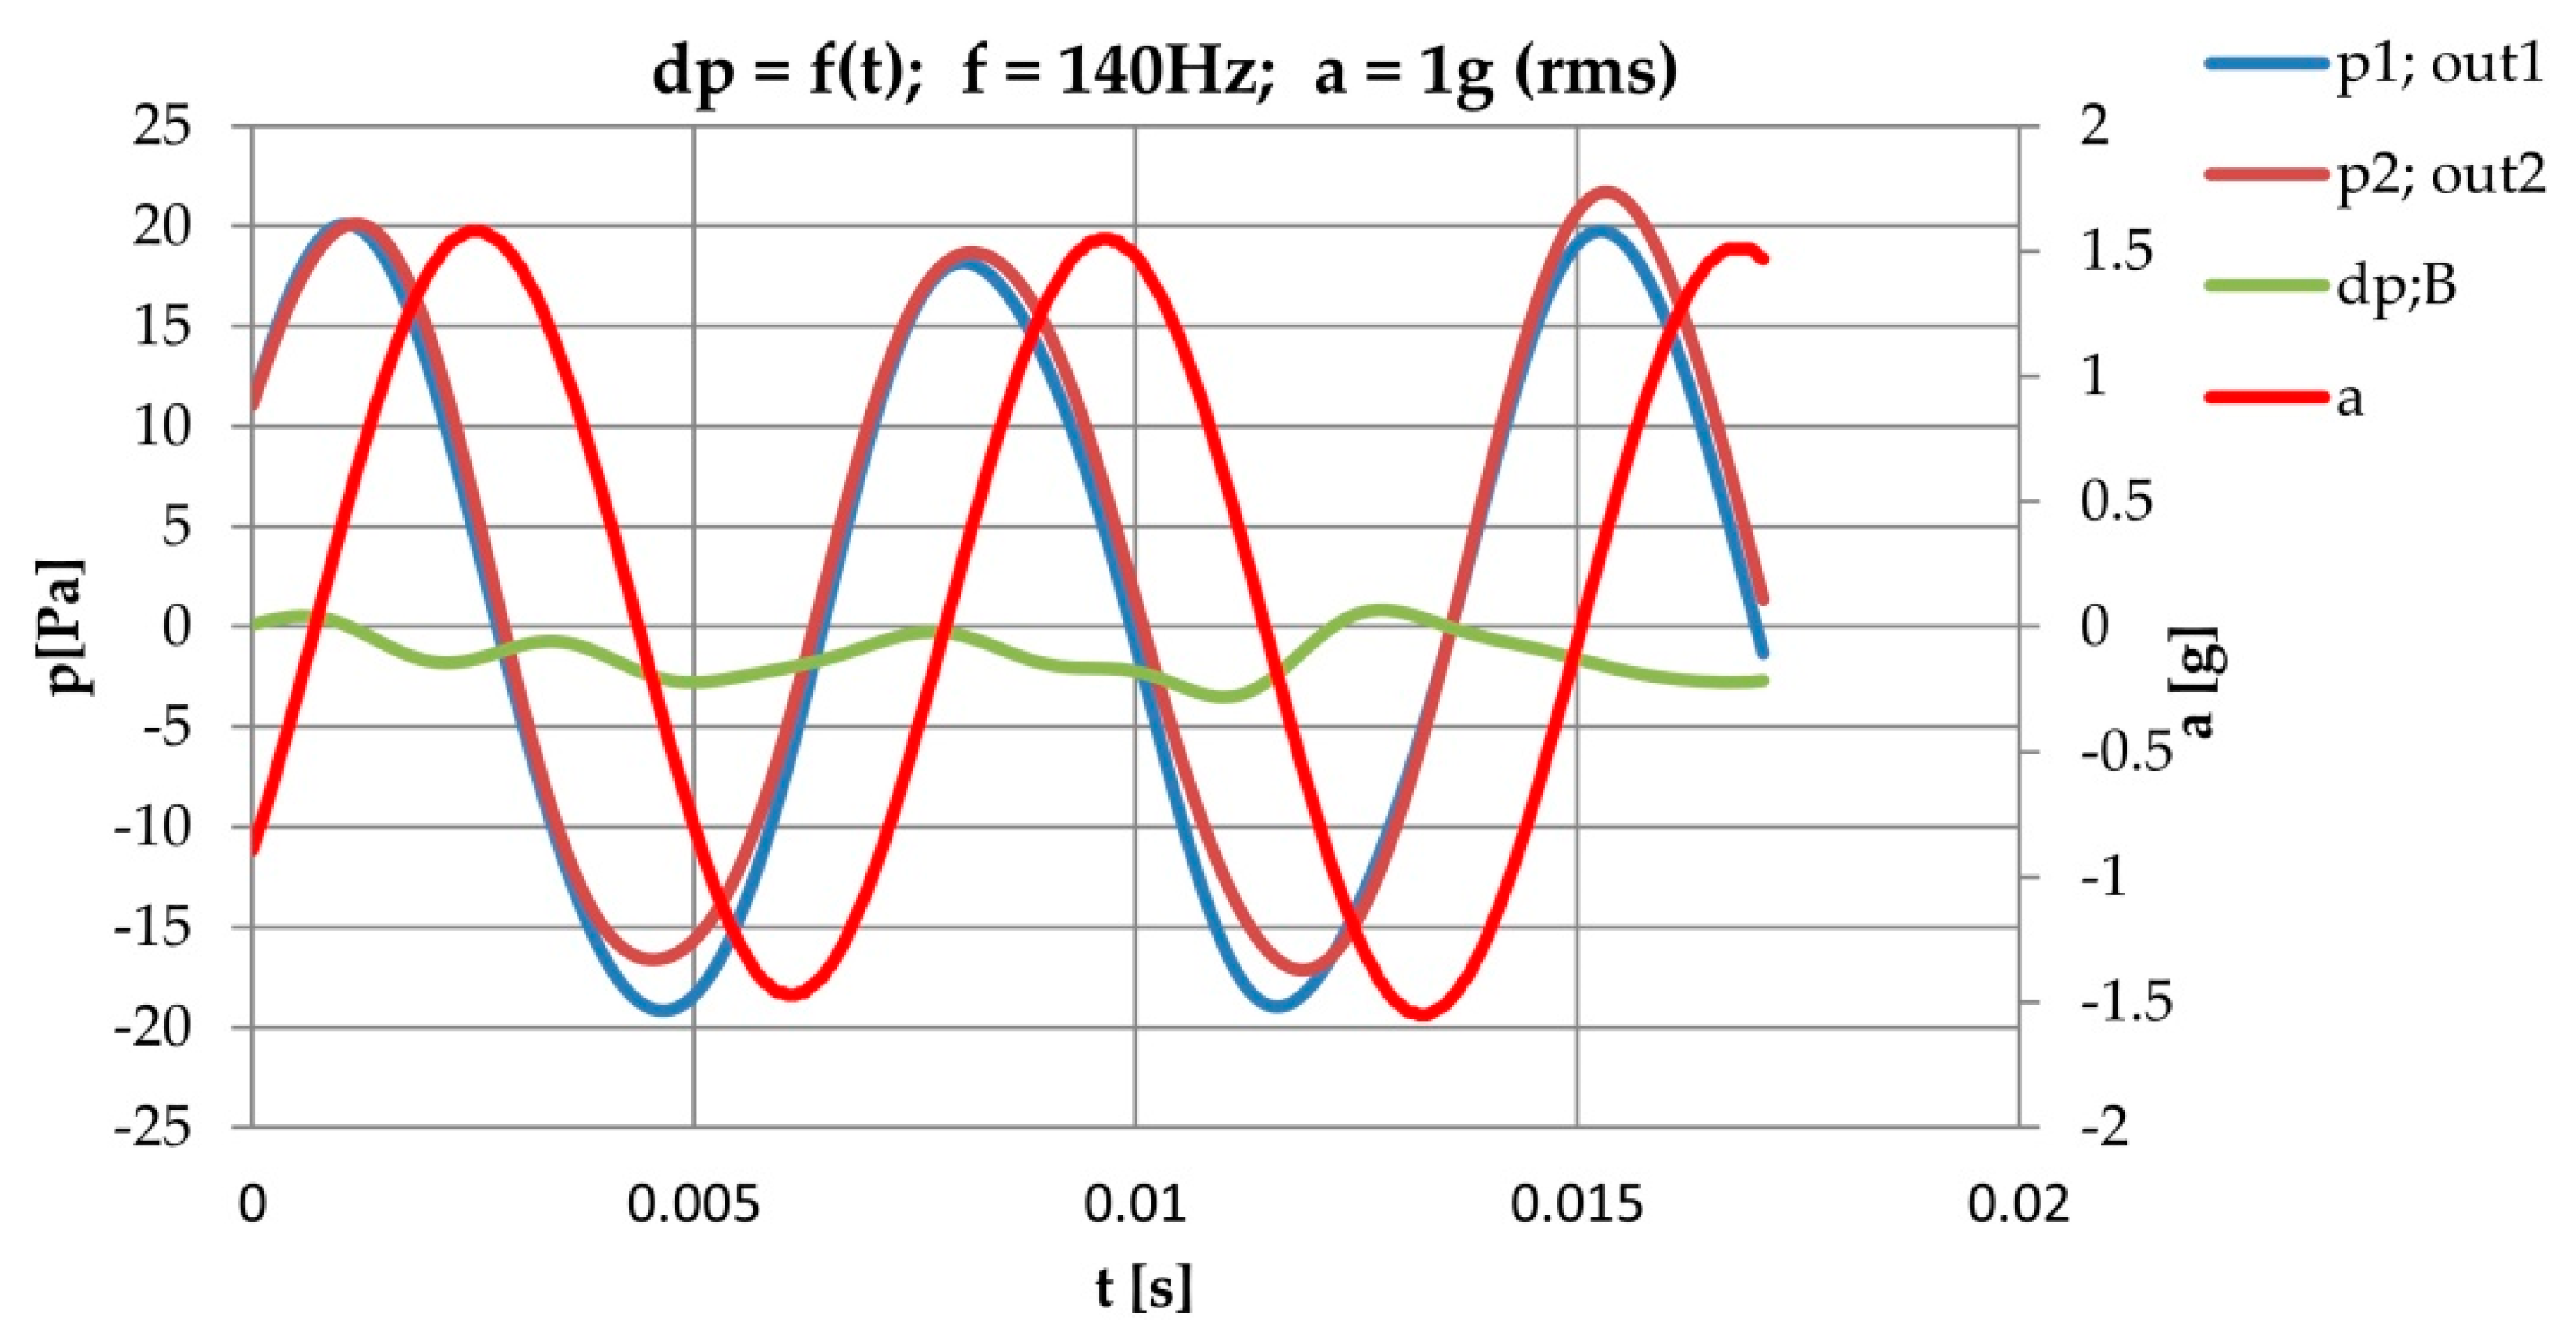
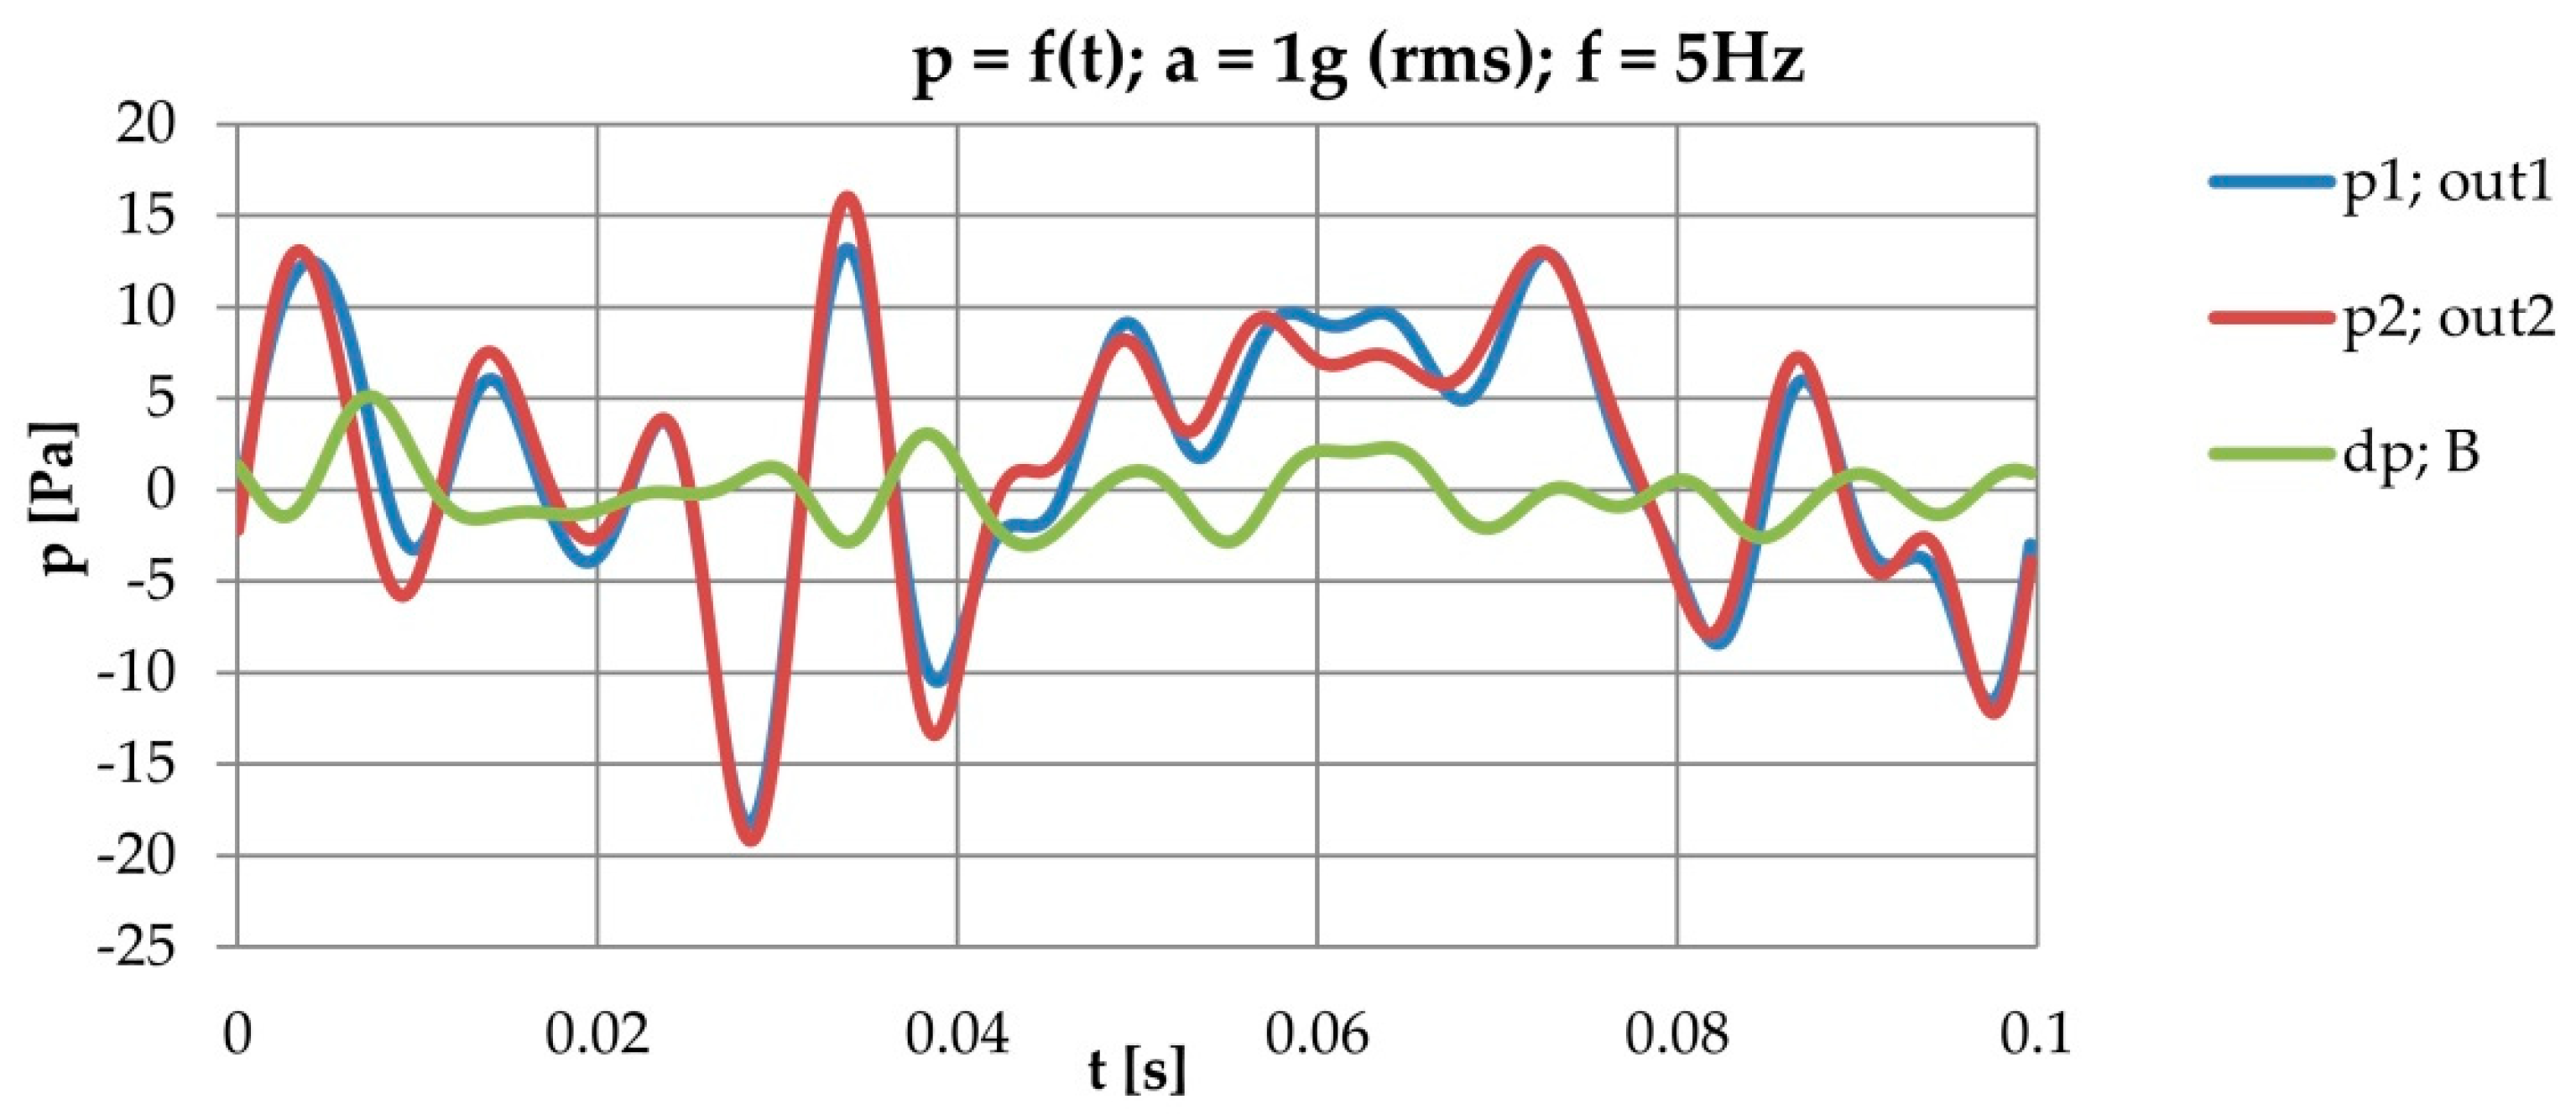
5. Research Results of the Proposed Hybrid Compensated Transducer

Figure 12 shows the course of the output signal from the transducer as a function of acceleration, chart “A”, “without correction” for the measured pressure equal to zero.
On the other hand, chart “B” is a measurement using the method proposed by the authors. It is visible that in the case of a classic measurement at the sensor output with pressure parameters equal to zero, a signal is generated proportional to the acceleration value when the expected value should be equal to zero. Such a signal added to the value of the variable component of the measured pressure constitutes a fundamental error resulting directly from an incorrect measurement method. That is important because, in the case of measuring low pressures, that influence may be much higher even than the currently measured pressure value. For example, when measuring 10 Pa under the conditions of variation of acceleration at the level of 10 g, the indication will be 140 Pa, which means that the relative measurement error is 1300%. The value of such a measurement is questionable. Using the method proposed by the authors, it can be noticed from the waveform “B” that the output signal does not depend on the acceleration value to which the sensor is subjected and is close to 0.
Figure 13 shows the example sensor’s response to variable loads, i.e., harmonic vibrations, curve A for the classic method and curve B-for the proposed method using the proposed hybrid transducer. The amplitude of the signal variation for the casual solution reaches 20 units, while the proposed one only reaches a few units. This difference shows a qualitative improvement in the obtained measurement result.
Figure 14 shows the response-output signals and the forcing of the combined transducer from Figure 10. In this case, the forcing signal “a” had a harmonic character with the frequency f = 200 Hz and the acceleration variability up to 16 g. The p1 and p2 signals converted to pressure parameters are similar. Some discrepancies result from the non-identical parameters of individual converters. In real conditions, it can be corrected by changing the track amplification. The signal dp is a differential signal whose value is around zero because the transducer at the pressure inputs had a value of zero. On the other hand, Figure 15 shows the response of the complex transducer similar to Figure 10 only for the forcing conditions f = 200 Hz and a = 3 g. The Figure 16 shows the response of the complex sensor to the dynamic harmonic signal with the parameters f = 140 Hz, and amplitude a = 1.42 g, red, the parameter measured with the ADXL accelerometer. The p1 and p2 curves are the output signals from two transducers, while the dn is a differential signal because of the proposed method. Figure 17 shows the waveforms obtained from both sensors p1, p2, and the differential dp as the output for low frequency polyharmonic forcing signal and acceleration a = 1 g (Rms). As in previous tests, the output signal contains minimal amplitude fluctuations at the level of 2 Pa due to the heterogeneous structure of the separating gel. Concerning the range of the tested sensor of 10,000 Pa, 2 Pa is the noise area and is negligibly small. For all tested cases, the input pressure signal was equal to zero, so the dp curve should have a value of zero. However, there were some fluctuations in the 2 Pa region, probably due to the inhomogeneous structure of the separating gel. The influence of variable acceleration at the transducer’s outputs in the form of p1 and p2 signals has been compensated. That proves the correct operation of the proposed method. The obtained results are generally 10 times smaller than without this method. Minor fluctuations can also be caused by system noise and the sensors themselves; 1 Pa is a very small amount. The proposed solution undoubtedly requires further detailed research, but the overall proposed method gives promising results.

6. Conclusions

The tests carried out on selected transducers confirmed the thesis concerning the influence of acceleration on the pressure measurement result. The elastic element as the main part of the pressure transducer has a specific mass with additional gel mass separating. According to Newton’s dynamics rules, it must react to acceleration, including gravity. The deformation of an elastic element is a result of the thrust force from the measured pressure difference and the force resulting from acceleration. Research showed that this phenomenon is even more complex when pressure is measured on moving objects. Problematic cases are measurements on aircraft, submarines, or cars, where the variability of the acceleration acting on the sensor is the sum of the terrestrial and dynamic related to the movement of a given object. The effect of this phenomenon is a constant value due to the invariability of the mass of the sensor’s measuring elements. Its changes, however, are proportional to the amount of acceleration. Such a measured signal distortion concerns mainly the group of low-pressure sensors of the order of several to tens of thousands of Pa. This fact results in the inability to use some sensors in moving objects, especially in the case of low-pressure measurements. In such cases, the authors proposed using a specially developed sensor structure based on a previously patented measurement method. The method of assembling two of the same sensors. One acts as pressure measurement, and the other, without pressure connections, act as a compensating acceleration effect. The differential signal “dp” (B) will in fact only be proportional to the pressure value. It should be emphasized here that in the case of measuring multiple pressures on an object, one sensor will play the role of compensation. As a result of the research carried out on the proposed structure, there are some minor fluctuations ‘‘dp’’ of the output signal, which increase with the acceleration amplitude. It probably comes from the separating mass-gel, which is a heterogeneous structure. The authors used this method in other research works in the study of flow phenomena in the wind tunnel, e.g., in the study of wind turbines of pressure distribution on a rotating profile.

Author Contributions

Conceptualization Z.S.; methodology Z.S.; P.S., K.S., software P.S., Z.S.; validation K.S.; P.S., Z.S., formal analysis Z.S., P.S., K.S.; resources Z.S., P.S. and K.S.; data curation Z.S., P.S.; writing Z.S., P.S., K.S. All authors have read and agreed to the published version of the manuscript.

Funding

This research is financed in part by the statutory funds (UPB) Faculty of Mechanical Engineering and Aeronautics, Rzeszow University of Technology. The article was presented during 16th International Conference Selected Issues of Electrical Engineering and Electronics WZEE 2021 (Rzeszow September 2021).

Institutional Review Board Statement

Not applicable.

Informed Consent Statement

Not applicable.

Data Availability Statement

The data available on request from the authors.

Conflicts of Interest

The authors declare no conflict of interest.

References

  1. Rónai, L.; Lénárt, J.; Szabó, T. Development of a Low-cost Pressure Sensor. Int. J. Eng. Manag. Sci. 2020, 5, 33–38. [Google Scholar] [CrossRef]
  2. Dhanaselvam, P.S.; Kumar, D.S.; Ramakrishnan, V.N. Pressure Sensors Using Si/ZnO Heterojunction Diode. Silicon 2021, 1–7. [Google Scholar] [CrossRef]
  3. Kordrostami, Z.; Hassanli, K.; Akbarian, A. MEMS piezoresistive pressure sensor with patterned thinning of diaphragm. Microelectron. Int. 2020, 37, 147–153. [Google Scholar] [CrossRef]
  4. Nag, M.; Kumar, A.; Pratap, B. A novel graphene pressure sensor with zig–zag shaped piezoresistors for maximum strain coverage for enhancing the sensitivity of the pressure sensor. Int. J. Simul. Multidiscip. Des. Optim. 2021, 12. [Google Scholar] [CrossRef]
  5. Ouyang, H.; Li, Z.; Gu, M.; Hu, Y.; Xu, L.; Jiang, D.; Cheng, S.; Zou, Y.; Deng, Y.; Shi, B.; et al. A Bioresorbable Dynamic Pressure Sensor for Cardiovascular Postoperative Care. Adv. Mater. 2021, 33, 2102302. [Google Scholar] [CrossRef] [PubMed]
  6. Gao, L.; Wang, M.; Wang, W. Highly Sensitive Pseudocapacitive Iontronic Pressure Sensor with Broad Sensing Range. Nano-Micro Lett. 2021, 13, 140. [Google Scholar] [CrossRef] [PubMed]
  7. Raab, C.; Rohde-Brandenburger, K. Dynamic flight load measurements with MEMS pressure sensors. CEAS Aeronaut. J. 2021, 12, 737–753. [Google Scholar] [CrossRef]
  8. Menna, F.; Nocerino, E.; Chemisky, B.; Remondino, F.; Drap, P. Accurate scaling and leveling in underwater photogrammetry with a pressure sensor. Int. Arch. Photogramm. Remote Sens. Spatial Inf. Sci. 2021, XLIII-B2-2021, 667–672. [Google Scholar] [CrossRef]
  9. Xu, F.; Ma, T. Modeling and Studying Acceleration-Induced Effects of Piezoelectric Pressure Sensors Using System Identification Theory. Sensors 2019, 19, 1052. [Google Scholar] [CrossRef] [PubMed] [Green Version]
  10. Kapuscinski, T.; Szczerba, P.; Rogalski, T.; Rzucidlo, P.; Szczerba, Z. A Vision-Based Method for Determining Aircraft State during Spin Recovery. Sensors 2020, 20, 2401. [Google Scholar] [CrossRef] [PubMed]
  11. August, R.; Maudie, T.; Miller, T.; Thomson, E. Acceleration sensitivity of microachined pressure sensors. In Micromachined Devices Components, Proceedings of the Symposium on Micromachining and Microfabrication, Santa Clara, CA, USA, 20 September 1999; French, P.J., Peeters, E., Eds.; SPIE Press: Bellingham, WA, USA, 1999. [Google Scholar] [CrossRef]
  12. Bao, M.H. Micro Mechanical Transducers. Handbook of Sensors and Actuators; Elsevier: Amsterdam, The Netherlands, 2000; ISBN1 eBook 9780080524030. ISBN2 9780444505583. [Google Scholar]
  13. Changzheng, W.; Wei, Z.; Quan, W.; Xiaoyuan, X.; Xinxin, L. TPMS (tire-pressure monitoring system) sensors: Monolithic integration of surface-micromachined piezoresistive pressure sensor and self-testable accelerometer. Microelectron. Eng. 2012, 91, 167–173. [Google Scholar] [CrossRef]
  14. Jiang, B.; Xing-lin, Q.; Jiakai, L.; Bo, J. Design of Piezoresistive MEMS Pressure Sensor Chip for Special Environments. Sens. Transducers IFSA 2014, 174, 1–7. [Google Scholar]
  15. Mayer, D.; Palczynska, A.; Gromala, P.J.; Han, B.; Melz, T. In-situ investigation of EMC relaxation behavior using piezoresistive stress sensor. Microelectron. Reliab. Elsevier 2016, 62, 58–62. [Google Scholar] [CrossRef]
  16. Ni, Z.; Yang, C.; Xu, D.; Zhou, H.; Zhou, W.; Li, T.; Xiong, B.; Li, X. Monolithic Composite “Pressure + Acceleration + Temperature + Infrared” Sensor Using a Versatile Single-Sided “SiN/Poly-Si/Al” Process-Module. Sensors 2013, 13, 1085–1101. [Google Scholar] [CrossRef] [PubMed] [Green Version]
  17. Xu, J.; Zhao, Y.; Jiang, Z.; Sun, J. A monolithic silicon multi-sensor for measuring three-axis acceleration, pressure and temperature. J. Mech. Sci. Technol. 2008, 22, 731–739. [Google Scholar] [CrossRef]
  18. Directory Notes. Aplisens; 2010. Available online: https://aplisens.pl/pdf/produkty/PR-50G.pdf (accessed on 24 November 2021).
  19. Directory Notes. Freescale; 2008; Rev 13, 10/2008. Available online: http://www.farnell.com/datasheets/75009.pdf (accessed on 24 November 2021).
  20. Wang, J.; Xia, X.; Li, X. Monolithic integration of pressure plus acceleration composite TMPS sensor with a single-sided micromachining technology. J. Microelectromechanical Syst. 2012, 21, 284–293. [Google Scholar] [CrossRef]
  21. Wilson, J.S. Sensor Technology Handbook; Elsevier: Amsterdam, The Netherlands, 2005; ISBN 0-7506-7729-5. [Google Scholar]
  22. Bishop, R.H. The Mechatronics Handbook; The University of Texas at Austin: Austin, TX, USA, 2002; ISBN 0-8493-0066-5. [Google Scholar]
  23. Büttgenbach, S.; Constantinou, I.; Dietzel, A.; Leester-Schädel, M. Case Studies in Micromechatronics; Springer: Cham, Switzerland, 2020; ISBN1 978-3-662-61319-1. ISBN2 978-3-662-61320-7. [Google Scholar] [CrossRef]
  24. Directory Notes. Sensortechnics; 2011; e/11628 2011. Available online: https://dtsheet.com/doc/705314/sensortechnics-hcla0075du (accessed on 24 November 2021).
  25. Szczerba, Z.; Szczerba, P. Unpublished Materials of the Own Study of Pressure Sensors. 2014–2021. [Google Scholar]
  26. Szczerba, Z.; Szczerba, P. Selected properties of modern pressure transducers. Electrotech Rev. 2016, 1, 192–195. [Google Scholar] [CrossRef]
  27. Mazur, D.; Szczerba, Z.; Gołębiowski, L.; Smoleń, A.; Gołębiowski, M. Modeling and Analysis of the AFPM Generator in a Small Wind Farm System. In Methods and Techniques of Signal Processing in Physical Measurements; Hanus, R., Mazur, D., Kreischer, C., Eds.; Springer: Cham, Switzerland, 2019; ISBN/ISSN: 978-3-030-11186-1. [Google Scholar] [CrossRef]
  28. Szczerba, Z. Pressure Sensor and Pressure Measuring Method. Patent P-225030 28.02.2017. Available online: https://ewyszukiwarka.pue.uprp.gov.pl/search/pwp-details/P.406992 (accessed on 24 November 2021).
Figure 1. MEMS technology pressure transducer cross-section, a—protective gel cover, b—measuring structure (silicon membrane), c—metal part of the cover, d—main cover, e—measuring structure place of attachment, f—signal output, and g—pins (Image drawn based on the literature informations [18,19,20,21,22,23]).
Energies 15 00493 g001
Figure 2. Model of a pressure transducer with an indication of the elastic diaphragm and force components where: Fp—pressure force; Fg—gravitational force; α—angle between the plane of the diaphragm and the vertical direction; Fa—force due to dynamic acceleration; and β—angle between the plane of the diaphragm and the direction of the transducer movement, a—acceleration of a moving sensor installed on a moving object, S—membrane surface, g—gravitational acceleration, and m-mass of the membrane and the separator.
Energies 15 00493 g002
Figure 3. Dependency chart of the output signal from the sensor (RMS) depending on the acceleration, for a pressure difference equal to zero [25,26].
Energies 15 00493 g003
Figure 4. Dependency chart of p = f (t), forcing signal “a” on the frequency of 40 Hz and acceleration 1 g, and the response of the sensor, curve “p” [25,26].
Energies 15 00493 g004
Figure 5. Dependency chart of p = f (t), dependence of instantaneous values for low frequency polyharmonic signal and acceleration a = 1g [25,26].
Energies 15 00493 g005
Figure 6. Dependency chart of the output signal (RMS) in Pascals for harmonic signal up to 100 Hz, for the MPX2010D sensor [25,26].
Energies 15 00493 g006
Figure 7. Measurement scheme used in the DASYLAB software.
Energies 15 00493 g007
Figure 8. Photos of the study of the impact of acceleration on a V-type wind turbine, (a) view of the entire turbine experimental stand, and (b) magnified view on the sensor installed on the turbine wing.
Energies 15 00493 g008
Figure 9. Photo of the installed hybrid sensor on the dynamic electrodynamic emitter.
Energies 15 00493 g009
Figure 10. Scheme of installing and connecting the measuring and compensation sensors (b), C1—measuring sensor, C2—compensation sensor, K1 and K2—pressure input to the measuring sensor, K3, and K4—measuring inputs of the compensation sensor, out1—measuring sensor output, out2—compensation sensor output, (b) practical realization of scheme (a).
Energies 15 00493 g010
Figure 11. The picture presents the author’s practical realization of the invention of a package for multi—point pressure measurement with compensation of acceleration.
Energies 15 00493 g011
Figure 12. Dependency chart of the acceleration effect on the output signal from the converter; A—without correction classic measurement and B—with a proposed correction transducer [25,26].
Energies 15 00493 g012
Figure 13. Dependency chart of the influence of dynamic acceleration on the output signal from the converter in the form of instantaneous values for a = 1g and f = 30 Hz, A—without correction, and B—with proposed correction.
Energies 15 00493 g013
Figure 14. Response of the complex sensor to a harmonic signal with f = 200 Hz, p1—signal from the measuring sensor, p2—signal from the compensation sensor, dp—difference between p1-p2, and a—the input.
Energies 15 00493 g014
Figure 15. Response of the complex sensor to a harmonic signal with f = 200 Hz and a = 3g (Rms), p1—signal from the measuring sensor, p2—signal from the compensation sensor, dp—difference between p1-p2, and a—the input.
Energies 15 00493 g015
Figure 16. Response of the complex sensor to a harmonic signal with f = 140 Hz and a = 1g (Rms), p1—signal from the measuring sensor, p2—signal from the compensation sensor, and dp—difference between p1-p2, a—the input.
Energies 15 00493 g016
Figure 17. Response of the complex sensor to a polyharmonic signal low-frequency f = 5 Hz, a = 1g (Rms), p1—signal from the measuring sensor, p2—signal from the compensation sensor, and dp—difference between p1-p2.
Energies 15 00493 g017
Table 1. Summary for several types of transducers and the influence of catalog and tested static acceleration [18,19,24].
Type of TransducerCatalog Data
[Pa/1g]
Research Data
[Pa/1g]
Aplisens PR50 (1kPa)No data8
Aplisens PR50 (10 kPa)No data12
Freescale MPX 2010 (10 kPa)No data13
PAN PRC10 (1kPa)No data40
Table 2. Examples parameters of the influence of acceleration on the measurement of airplane speed.
GAcceleration Influence [Pa]w (Aircraft Speed) [m/s]w (Aircraft Speed) [km/h]
113518
5651036
101301554
Publisher’s Note: MDPI stays neutral with regard to jurisdictional claims in published maps and institutional affiliations.

