1. Introduction
“Carbon neutrality” has become a core goal in the world’s active and aggressive response to climate change. The recognition and implementation of this concept in more than 130 countries, including China, means that carbon neutrality will influence and dominate the energy transformation strategies of most countries moving forward. Coal is a primary source of energy, accounting for 40% [
1] of global carbon dioxide emissions. In this context, there is the international consensus that coal needs to be phased out until its use can be completely stopped. In fact, there has already been a strong and far-reaching trend toward a “coal phase-out”. China, the United States, and Russia are major coal consumers, and while they have not made a clear statement, it appears that a “coal phase-out” is becoming an inevitable choice as part of a global response to climate change.
Coal is the dominant and largest single energy source for generating power, accounting for more than 36% of global electricity generation in 2019 [
2]. A “coal phase-out” has evolved from being a complex concept into being a specialized term in the energy field. The international community now refers to the complete phase-out of coal power generation, rather than referring to a broader phase-out from all sectors. In addition, a “coal phase-out” proposal does not mean quitting immediately, but rather, quitting within a time-bound planning schedule. This is also known as declaring a “coal phase-out”, which is the basic frame of analysis and starting point for this paper.
Statistics indicate that among OECD (Organisation for Economic Co-operation and Development) and EU (European Union) member states, nearly 24 countries completed their “coal phase-out” by 2020 [
3]. As early as at the 2017 Global Climate Conference (COP25), France, the Netherlands, Finland, Italy, and 25 other countries joined the “The Powering Past Coal Alliance”, jointly organized by the UK and Canada [
4]. The goal was to completely eliminate coal power generation by 2030, and to stop investing in coal power at home and abroad. One country not joining this alliance was Germany, which accounts for 20.8% of the total coal consumption in the European Union, and accounts for nearly a third of the domestic coal power generation. The German federal government officially announced a “coal phase-out” timetable in January 2019, which plans to shut down all 84 coal-fired power plants in Germany by 2038 [
5].
China is the world’s largest producer and consumer of coal, and coal plays an important role in the overall energy mix. In 2020, China’s coal output accounted for 51.7% of the world’s total output; coal consumption accounted for 57.7% of the total energy mix; and the share of coal-based power generation was 69.57% [
6]. China faces the same challenge as Germany before its proposed “phase-out”. Given the wave of energy transformation sweeping the world, can China also reduce its share of coal-generated power or eventually phase out coal? In September 2020, China officially announced it would achieve its emission peak by 2030 and carbon neutrality by 2060. At this point, China needs to consider whether it can break its traditional fossil energy consumption patterns, including the use of coal, and seize the initiative to gain a competitive advantage in the global low-carbon, green, and clean energy transition.
By 2020, coal-based power made up nearly 70% of China’s total power generation. Pursuing the minimization of this share of coal in the energy mix has created significant conflict that may impact whether China can declare a “coal phase-out”. This conflict, which is hard to change in a short period of time, has led to few academic analyses of the “coal phase-out” in this super energy producing and consuming country. More research is needed to optimize a balance between coal power generation in China with other energy types [
7,
8,
9].
To fill this gap in the research, this paper considers the temporal and spatial gaps between whether China can propose a “coal phase-out” declaration and the actual “coal phase-out” action. It also explores whether China could make a “coal phase-out” declaration as Germany has done. We also consider the possibility that China can make a “coal phase-out” declaration focusing on power generation, rather than requiring immediate implementation. In particular, the study focuses on the influence of local governments, coal-related enterprises, and the public on the declaration of a “coal phase-out” based on their own interests.
In this paper, local governments, coal-related enterprises, and the public serve as the game objects to influence decision-making [
10], because China has a long history of using coal and has experienced an uneven distribution of coal resources. Decisions at the national level are implemented by local governments with rich coal resources. Similar to Germany before its decision of “coal phase-out”, independent of economic factors, the attitude of coal-related enterprises and the public towards “coal phase-out” directly affect the decisions of government policy makers.
There are two primary sources of innovation for this paper. First, from a research perspective, it is not optional for China to eventually declare a “coal phase-out”; rather, reducing and phasing-out coal power generation is only a matter of time. China faces many pressures: internally optimizing the energy structure, reducing its external dependence on overseas oil and gas resources, and competing with respect to international discourse. In the context of the goals of reaching an emissions peak and achieving carbon neutral status, placing “coal phase-out” on the agenda has high international political significance and strategic value, rather than being a pure economic calculation. Second, from the perspective of research content and methodology, the Chinese government has repeatedly emphasized that it is inevitable to reduce coal production, consumption, and the proportion of coal in electricity generation, but the actual pace of implementation is not consistent. This paper proposes three factors that directly affect the “coal phase-out” decision: local governments that rely on coal to drive regional economy; coal-related enterprises that affect their own benefits and expenditures; and the public. The latter two are not directly related to each other, but they are closely related to the first. Therefore, by establishing an evolutionary game model comparing the interests of local government and coal-related enterprises, and local government and the public, the paper analyzes the circumstances under which China could confidently propose a “coal phase-out”, and the circumstances under which it would be impossible to achieve. The study evaluates how the game of interests specifically affects the policy.
The rest of the paper is organized as follows. The
Section 2 is the literature review. The
Section 3 and
Section 4 present the design of the game scenario involving the local government, coal-related enterprises, and the public. The
Section 5 presents the analysis of results and the discussion. The
Section 6 draws on relevant index data classified as “coal phase-out” factors in China and Germany from 2013 to 2019 and calculates the comprehensive development evaluation value of relevant indicators for a “coal phase-out” in China and Germany. This section also presents the analysis of the realistic gap that currently presents China from declaring a “coal phase-out” at this time. The
Section 7 is the conclusion.
2. Literature Review
To achieve the climate goal set by the Paris Agreement, the phasing out of coal, formally called a “coal phase-out”, has become an important way for signatory countries to effectively reduce carbon dioxide emissions. Germany and the UK are traditional industrial developed countries in the West at the forefront of “coal phase-out” and have extensively studied the issue of “coal phase-out” and whether it can be successfully completed. This research forms a reference for studying “coal phase-out” in China.
First, the academic community has explored the “coal phase-out” in Germany, with some scholars emphasizing methods for conducting the phase-out scientifically and effectively. For example, Osorio et al. [
11] posited that reducing the share of coal power generation is an important way for Germany to achieve its climate goals, and that the carbon price floor can eliminate the risks caused by the “coal phase-out” policy. Metzger et al. [
12] concluded that Germany’s goal of carbon neutrality must be achieved by phasing out coal power generation, in addition to the shutdown of nuclear plants and the rapid ramp-up of photovoltaics and wind. Pourmoosavi and Amraee [
13] used a multi-cycle low-carbon power generation expansion planning model to determine that the “coal phase-out” policy should be combined with renewable energy and carbon capture, utilization, and storage technology. Klöckner and Letmathe [
14] found there is a synergistic effect between the hydrogen production technology of electrolyzer and Germany’s “coal phase-out” policy; the diffusion of low carbon technology can effectively promote the realization of the decarbonization goal of Germany. Gillich et al. [
15] found that for an old lignite plant, a “coal phase-out” push in a moderate political environment could result in a 47% loss in profit, while a radical “coal phase-out” policy would only result in a 16% loss in profit. In addition, Vögele et al. [
16] concluded that phasing out coal-fired power plants is a key strategy for transitioning to a sustainable society, and Kost et al. [
17] concluded three factors are key to ensuring the energy transition in Germany: a “coal phase-out”, improved energy efficiency, and electricity imports.
Another set of scholars have studied Germany’s “coal phase-out” from a scientific perspective. For example, Oei et al. [
18,
19], Kelesa and Yilmaz [
20] concluded that “coal phase-out” in Germany would only slightly impact the price of electricity and significantly reduce carbon emissions. In this scenario, lignite production areas in Germany would experience losses in terms of output, income, and population; however, a more rapid coal phase-out would promote a faster recovery, and the transition would be less expensive. Heinrichs et al. [
21,
22] applied input-output and energy system models to comprehensively evaluate the “coal phase-out” in Germany. The results project that “coal phase-out” has little impact on the economy; however, the German public’s acceptance of coal-fired power generation is low and continues to decline. The study emphasized that Germany should achieve emission reduction targets without eliminating coal, and the cost of transformation could be more evenly distributed across sectors.
Similar to Germany, research on the “coal phase-out” in the UK has generally concluded that the benefits of such a phase-out outweigh the disadvantages and is a clear choice in the long run. Researchers argue that meeting climate targets is a challenge for countries with a long history of mining coal, and that the UK’s free-market economy achieved the “coal phase-out” target faster than Germany, Spain, and Poland [
23]. In short, comparing the “coal phase-out” paths of Germany and Britain revealed differences in implementation; however, studies have concluded that all paths led to the same result [
24]. The constant emphasis on the necessity of “coal phase-out” for energy transformation should not negatively impact the economy and accelerating the speed of “coal phase-out” supports reductions in losses [
25]. However, these studies have not considered that the impediments to the “coal phase-out” declaration have different effects in different countries. The determination of the government, pressure from related enterprises, and public support prompted the German government to decide to complete the “coal phase-out”; however, this specific analysis has not been conducted in China.
Therefore, turning the focus to China, scholars have also conducted many in-depth studies about the development trends associated with coal, and have studied structural adjustments during China’s energy transition process. However, most studies have focused on the specific adjustments of the coal industry at a micro level, and the alternative relationship between other energy types. Wang et al. [
7] studied China’s coal consumption structure by using an input-output analysis and structural decomposition analysis. That study found that domestic demand is the main contributor to China’s coal consumption and production. Yang et al. [
8] analyzed the path of China’s coal consumption structure, noting that “power, natural gas and water supply” are the key pathways for coal consumption. The study concluded that coal production reduction and substitution should be used to control coal consumption in key industries and channels and optimize the intermediate input and energy utilization structure. Guo et al. [
9] and Zhu et al. [
26] predicted China’s coal price using an impulse response function. The results showed that economic growth was the main factor influencing the coal price, and the total industrial output value and downstream industries had been encouraging the growth of coal consumption in the past 30 years.
Some scholars [
27] have concluded that the driving factors behind China’s coal demand are mainly domestic demand and foreign trade, emphasizing that industrial upgrading can effectively restrain coal demand growth. Li et al. [
28] noted that in the context of overcapacity and severe haze, a market supply and demand mechanism is needed to force China’s coal industry to reduce its capacity; however, the study did not address the circumstances under which coal usage can be adjusted to achieve a structural exit.
Finally, although the evolutionary game research method has been widely applied in the energy field [
29], few scholars have applied it to coal-related enterprises. Wang et al. [
30] constructed a three-party evolutionary game model involving the central government, local government, and coal enterprises to study the problem of coal overcapacity and alternative policies and promote the effective management of this overcapacity. Zhao and Liu [
31] studied the conflict of interest between the Chinese government and coal-fired power plants with respect to adopting CCS (Carbon Capture and Storage) technology. Their study concluded that it is important for the government to reduce regulatory costs and increase policy support for the adoption of CCS technology in coal-fired power plants. Huang et al. [
32] constructed an evolutionary game model between the government and coal-fired power plants to address the diffusion problem of “near zero emission” technology and proposed that government regulation is the key for coal-fired power plants to adopt such technology. Larger government subsidies are associated with a greater willingness by coal-fired power plants to adopt “near zero emission” technology.
More evolutionary game studies, however, focus on green certificates or renewable energy subsidy mechanisms. Chen and Hu [
33] studied the behavioral strategies of the government and manufacturers under different carbon tax and subsidy schemes, finding that the static carbon tax and subsidy mechanisms implemented by the government do not positively impact the decision-making of manufacturers. Fang et al. [
34] established an evolutionary game model for renewable energy generation and transmission, emphasizing the need and effectiveness of government regulation.
In addition, empirical studies have applied the entropy value method to evaluate the development level of the same research object in different regions; this study applies this research logic. For example, Zhao et al. [
35] comprehensively evaluated the electric power development of 11 countries, developing targeted policy recommendations with respect to China’s electric power development. Fedajev et al. [
36] used this method to assess the progress of EU countries in achieving the Goals of the “Europe 2020” strategy. That study found that Sweden, Denmark, and Austria were the best performers in implementing the strategy, while other countries, such as the Netherlands, ranked lower. Liu et al. [
37] evaluated the development level of seven pilot carbon markets in China, finding that the overall development level of China’s carbon market pilot is relatively low, with a small market scale, low market efficiency, low market activity, and high price volatility.
In summary, existing evolutionary game studies have not involved a policy analysis from the perspective of coal reduction or “coal phase-out”. Therefore, this article extends previous research to apply the evolutionary game method within the context of a global “coal phase-out”. It establishes the three major factors influencing “coal phase-out” into the model; analyzes and judges the existing maturity and barriers with respect to China’s “coal phase-out”, exploring the current situation and dilemma of China’s energy transition; and provides new research perspectives and values to smoothly achieve target emission peaks and carbon neutrality.
3. Model Construction and Scenario Analysis: Local Government and Coal-Related Enterprises
Given the complexity of the specific governance mechanisms of the Chinese government, local governments are often aligned with the central government with respect to the direction of macro-control. However, actual actions often occur at a different pace. This paper assumes that, although the Chinese government has not explicitly proposed “coal phase-out”, given the pressure of achieving an “emission peak” in 2030 and “carbon neutrality” in 2060, the central government explicitly promotes the reduction of coal production capacity and consumption, and reduces the proportion of coal in electricity generation. Furthermore, the actual implementation requires the work of local governments, which further rely on specific coal-related enterprises (including coal-fired power plants and coal mining enterprises). In other words, the game results between the local governments’ oversight of coal-related enterprises and the profits of coal-related enterprises directly affect whether the country can move toward “coal phase-out”.
3.1. Model Assumptions
Evolutionary game theory posits that local governments and coal-related enterprises are participants in the evolutionary game; the rationality of both sides is limited; and the information obtained is also limited [
38]. The local government can decide to engage in supervision or non-supervision. The probability of the government to adopt supervision is
α(0 ≤
α ≤ 1); the probability of the government to not adopt supervision is 1 −
α [
39]. Coal-related enterprises can decide to reduce coal usage or not reduce such usage. The probability of coal-related enterprises to adopt a reduction strategy is
β(0 ≤
β ≤ 1); the probability of adopting a no reduction strategy is 1 −
β.
The two sides adopt different strategies to generate four game combinations, as shown below:
- (1)
When the government chooses to regulate and the enterprise chooses to reduce coal use, the government pays regulatory costs Cn1. When the enterprise reduces coal use, the government generates environmental benefits Mn and receives a total revenue of Mn − Cn1. When the enterprise reduces coal use, the profit gained by the production per unit time is Ms1, and the production cost per unit time after the coal use is reduced is Cs1. Companies are rewarded Rs by the government for reducing coal use. Therefore, the total revenue obtained by the enterprise is Ms1 + Rs − Cs1.
- (2)
When the government chooses to regulate and the enterprise chooses not to reduce coal use, the government pays the regulatory cost Cn1. If the enterprise is found to not reduce coal use (the probability that the government finds that enterprises do not reduce coal use is q), the government imposes a fine Pn on the enterprise. Because enterprises do not reduce coal use, the government bears the management cost Cn2 of the associated environmental damage. Therefore, the total revenue obtained by the government is −Cn1 + qPn − Cn2. For the enterprise, if the enterprise does not reduce coal use, the profit obtained per unit time is Ms2, and the production cost per unit time is Cs2. If the government finds that the enterprise does not reduce coal use (probability of discovery is q), the enterprise pays a fine Pn. If the government does not identify that the enterprise does not reduce the coal use (probability of not being found is 1 − q), the enterprise has cheated the government’s reward Rs. Therefore, the total revenue obtained by the enterprise is −qPn + (1 − q)Rs + Ms2 − Cs2.
- (3)
When the government chooses not to regulate and the enterprise chooses to reduce coal use, the government receives environmental benefits Mn at no cost; the total revenue obtained by the enterprise is Ms1 minus the production cost Cs1 per unit time after reducing coal use.
- (4)
When the government chooses not to regulate, and the enterprise chooses not to reduce, the government bears the cost Cn2 of governance caused by environmental damage. If the enterprise maintains the original production status, the total revenue obtained is the revenue Ms2 obtained in production per unit time, minus the production cost Cs2 per unit time when coal use is not reduced.
These scenarios lead to the payment matrix associated with the game between local government and coal-related enterprises, shown in
Table 1.
3.2. The Establishment of the Payoff Model
The payment matrix indicates that when the government chooses regulation, its expected revenue is:
When the government chooses not to regulate, its expected revenue is:
Therefore, the average expected revenue of the government is:
Similarly, the expected revenue of enterprises with reduction choices is:
When the enterprise chooses not to reduce coal use, the expected revenue is:
The average expected revenue of the enterprise is:
Thus, the dynamic replication equation of the government is:
Similarly, the replication dynamic equation of the enterprise is:
Let F(α) = 0, F(β) = 0 to solve the five local equilibrium points of the system: A(0, 0), B(0, 1), C(1, 0), D(1, 1), E(α*, β*). The variables are defined as: , .
The Jacobi matrix of the game between the local government and coal-related enterprises is:
The variables are defined as follows:
For a given point, if
and
, then the point satisfies the evolutional stability strategy (ESS) condition and is asymptotically stable [
40]. If
and
, the point is unstable. If
and
, then the point is neutral [
41]. If
, it indicates the saddle point.
This further yields the Jacobi matrix analysis of the local government and coal-related enterprises, shown in
Table 2:
3.3. Model Assumptions
Based on the relationship between the costs and benefits of local governments and coal-related enterprises, the game has four possible scenarios.
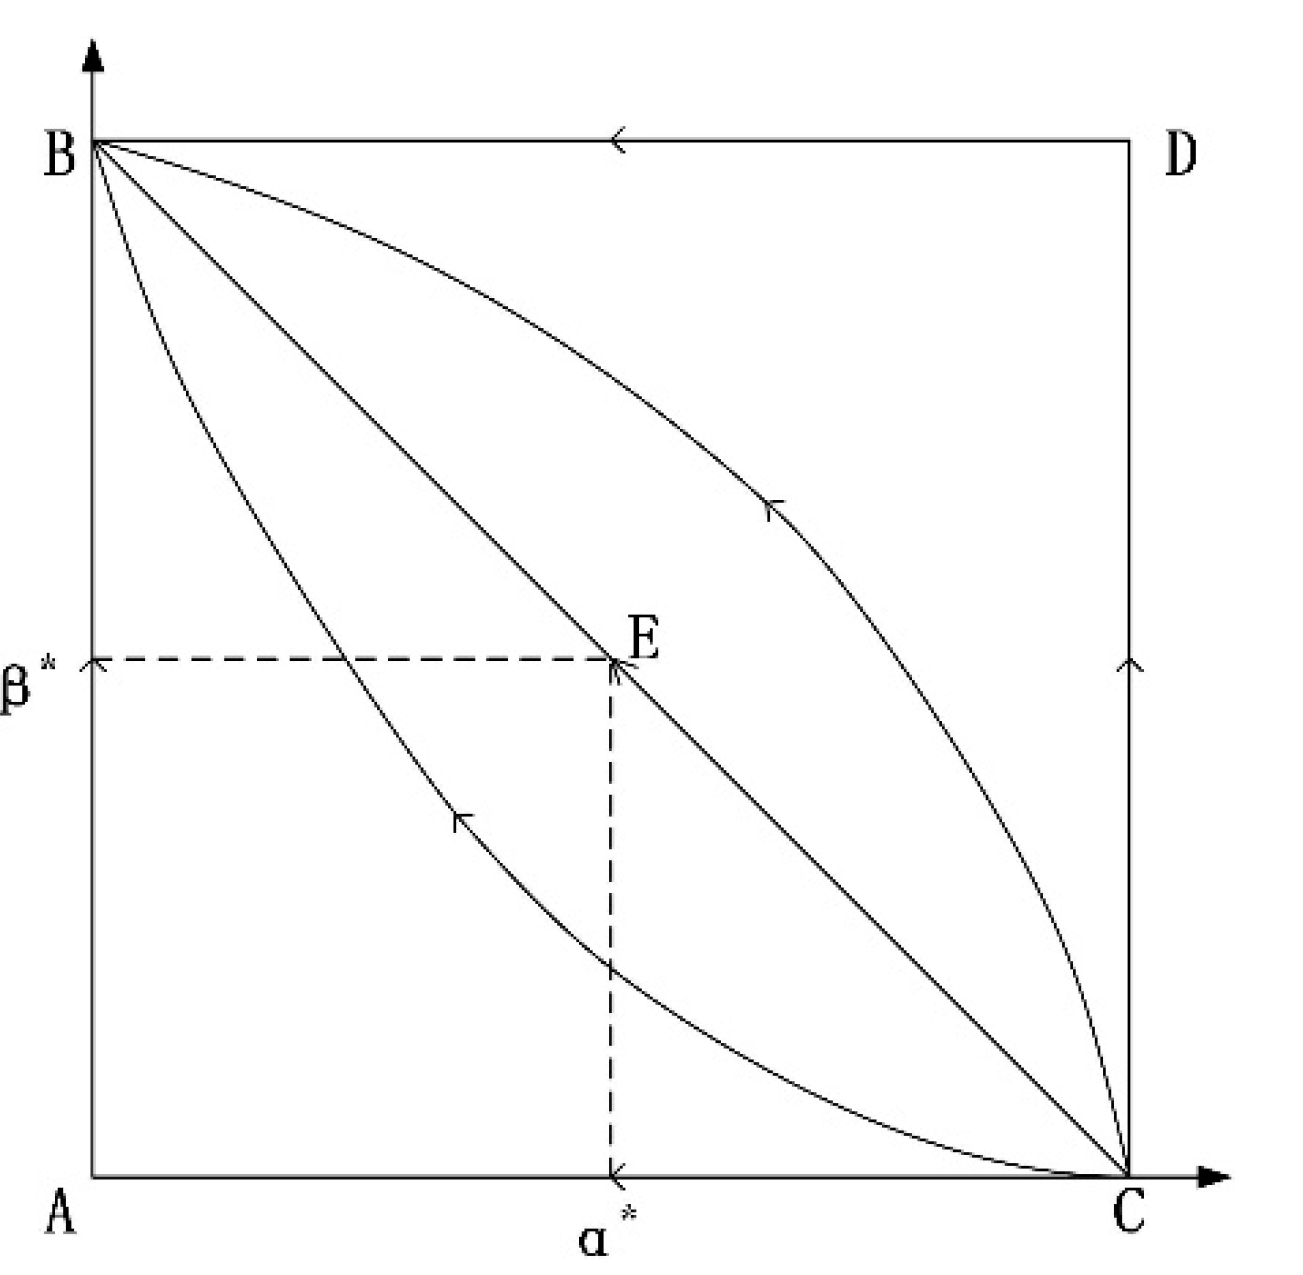
3.3.1. Scenario 1
When
qPn >
Cn1 and (
Ms1 −
Cs1) > (
Ms2 −
Cs2),
Table 3 shows the results of the stability analysis with respect to the equilibrium points:
In this game scenario, if the government finds that an enterprise does not reduce its coal use when under oversight, the profit gained from the penalty exceeds the oversight cost paid by the local government. For enterprises, the total revenue of production per unit time after reducing coal use exceeds the total revenue of production per unit time without reducing coal use. In this game scenario, enterprises choose the strategy of reducing coal use, because the benefits received by reducing coal use exceed those created by not reducing coal use. Therefore, after the government learns that the enterprise chooses to reduce the use of coal, it chooses the strategy of no regulation. This allows the government to gain the environmental benefits created by the reduction of coal use, without the regulatory costs.
Figure 1 shows the evolution paths of A–E.
3.3.2. Scenario 2
When
qPn >
Cn1 and (
Ms1 −
Cs1) < (
Ms2 −
Cs2),
Table 4 shows the results of the stability analysis with respect to the equilibrium points.
In this game scenario, there is no strategy that yields evolutionary stability. When the government finds that the enterprise does not reduce the coal use in the process of regulation, the government receives a profit that exceeds its cost of regulation. For the enterprise, the total profit of production per unit time without reducing coal use exceeds the total profit of production per unit time without reducing coal use.
Figure 2 shows the evolution paths of A–E.
3.3.3. Scenario 3
When
qPn <
Cn1 and (
Ms1 −
Cs1) > (
Ms2 −
Cs2),
Table 5 shows the results of the stability analysis with respect to the equilibrium points:
In this game scenario, when the government determines that the enterprise does not reduce coal use in the process of regulation, the profit made from the penalty is less than the cost of government oversight, so the government may choose not to regulate the enterprise. For the enterprise, the total revenue of production per unit time after reducing coal use exceeds the revenue received without reducing coal use. Therefore, the enterprise is more willing to choose the strategy of reducing coal use.
Figure 3 shows the evolution paths of A–E.
3.3.4. Scenario 4
When
qPn <
Cn1 and (
Ms1 −
Cs1) < (
Ms2 −
Cs2),
Table 6 shows the results of the stability analysis with respect to the equilibrium points:
In this game scenario, if the government finds that the enterprise does not reduce coal use in the process of regulation, the profit gained from the penalty is less than the regulatory cost to the government. Therefore, the government has little incentive to adopt regulatory strategies. For the enterprise, the total revenue of production per unit time received after reducing coal use is less than the revenue received without reducing coal use. Therefore, the enterprise chooses the strategy of not reducing coal use.
Figure 4 shows the evolution paths of A–E.
3.4. Numerical Simulation of the Evolutionary Game
The software program MATLAB is used for the numerical simulation of the evolutionary game described above; and its built-in function ode45 is used to solve the replicated dynamic differential equation. In this study, the start time of the evolution is set to 0, and the end time is set to 20. The remaining parameters are assigned based on the four game scenarios, to analyze the correctness of the stable strategy of game evolution. See
Table 7 for the specific values.
The MATLAB simulation results for scenarios 1 to 4 are consistent with the results of the evolutionary game analysis, as shown in
Figure 5.
4. Game Model Construction and Scenario Analysis: Local Government and the Public
The public’s awareness of environmental protection has become a global trend, particularly with respect to support for green, low-carbon, and clean energy transformation. The differences in public perception lie in the degree of public support for energy transitions in different countries; this support is directly proportional to the country’s development. In other words, a more developed economy is associated with higher incomes and a higher determination to reduce fossil energy production and consumption, increase the proportion of renewable energy, and phase-out coal power generation. Whether the people support the “coal phase-out” and the strength of that support directly affects the implementation and determination of the local government. The key factor determining whether the public supports the “coal phase-out” policy is the cost of energy use after the phase-out is proposed. In other words, the key factor is whether people can afford or are willing to pay for the energy costs in their actual lives, such as for electricity and heating. For example, the stability and expense of renewable energy will impact the public’s acceptance.
4.1. Model Assumptions
The local government and the public are participants in the evolutionary game; the government’s decision is driven by incentives and non-incentives. For example, the local government can provide energy subsidies to the public (i.e., incentives), or not. The probability of the government adopting incentives is α(0 ≤ α ≤ 1), and the probability of the government adopting non-incentives is 1 − α. The public also has a decision: supporting the “coal phase-out” or not supporting the “coal phase-out”. The probability of the public supporting the “coal phase-out” strategy is β(0 ≤ β ≤ 1), and the probability of the public not supporting the “coal phase-out” is 1 − β.
The two sides adopt different strategies, leading to four game combinations, as follows:
- (1)
When the government chooses incentives and the public chooses to support “coal phase-out”, the government receives environmental policy benefits Bg1 and pays the subsidy cost Sp. Therefore, the total benefits obtained by the government are Bg1 − Sp. For the public, implementing the “coal phase-out” policy leads to an increase in energy use costs. As such, people pay a higher energy use price Cp1, but simultaneously obtain government subsidies Sp. However, the “coal phase-out” improves the environment, so people receive benefits for Mp1, such as better air quality, a better living environment, and more tourism economic benefits. As a result, people’s total income is Mp1 − Cp1 + Sp.
- (2)
When the government chooses incentives and the public chooses not to support the “coal phase-out”, the government still gains environmental benefits Bg2 based on existing environmental policies. A large amount of coal use causes environmental pollution, with the government and the public sharing the cost E of governance. The proportional coefficient of the public’s share of the cost of governance is η; the proportional coefficient of the government’s share of the cost of governance is 1 − η. The total benefit of the public is Bg2 − E(1 − η). For the public, in the absence of a “coal phase-out” policy, the public receives environmental benefit Mp2 based on existing environmental policies, pays the corresponding energy use price Cp2, and shares the cost E of environmental governance with the local government. As such, the total benefit to the public is Mp2 − Cp2 − ηE.
- (3)
When the government chooses no incentives and the public chooses to support the “coal phase-out”, the government gains environmental policy benefits Bg1 without paying a cost. The public also gains the environmental benefit Mp1 from implementing the “coal phase-out”, but simultaneously bearing the higher energy use price Cp1. As such, the total benefit obtained by the public is Mp1 − Cp1.
- (4)
When the government chooses no incentive and the public chooses not to support the “coal phase-out”, the government still obtains environmental benefits Bg2 based on existing environmental policies and bears the cost E of environmental governance alone. Therefore, the government’s total revenue is Bg2 − E. The public still enjoys the environmental benefit Mp2 created by existing environmental policies and pays the corresponding energy use price Cp2. As such, the total benefit received by the public is Mp2 − Cp2.
Table 8 shows the payment matrix for the game between the local government and the public.
4.2. The Establishment of Payoff Model
The payment matrix shows when the government chooses the incentive, its expected income is:
When the government chooses no incentive, its expected income is:
Therefore, the average expected revenue of the government is:
Similarly, when the public chooses to support “coal phase-out”, its expected income is:
When the public chooses not to support “coal phase-out”, its expected income is:
The average expected income for the public is:
Thus, the dynamic replication equation for the government is:
Similarly, the replication dynamic equation for the public is:
Let F(α) = 0, F(β) = 0 to solve the five local equilibrium points of the system: A(0, 0), B(0, 1), C(1, 0), D(1, 1), E(α*, β*). The variables are defined as: , .
The Jacobi matrix of the game between the local government and the public is:
The variables are expressed as follows:
This further yields the Jacobi matrix analysis of local government and the public, shown in
Table 9:
4.3. Model Analysis
Based on the relationship between the costs and benefits to local government and the public, there are two game scenarios with stable strategies.
4.3.1. Scenario 1
When (
Mp2 −
Cp2) > (
Mp1 −
Cp1) and
Sp + (
Mp1 −
Cp1) < (
Mp2 −
Cp2) −
ηE,
Table 10 shows the results of the equilibrium point stability analysis:
In this game scenario, the total benefits to the public are higher when the public does not support the “coal phase-out” policy than when it does. In the case of government subsidies, the benefits obtained by public are also higher when the public does not support the “coal phase-out” than when it does. Environmental management costs are included in strategies that do not support “coal phase-out”; however, despite this, the public still chooses to not support “coal phase-out” strategy in this scenario.
Figure 6 shows the evolution paths of A–E.
4.3.2. Scenario 2
When (
Mp2 −
Cp2) < (
Mp1 −
Cp1),
Table 11 shows the results of the stability analysis of the equilibrium point:
In this game scenario, the total revenue generated by not supporting “coal phase-out” is less than the revenue generated by supporting the “coal phase-out”. As such, the public will choose to support the phase-out strategy. However, when the government knows that the public chooses to support “coal phase-out”, the government will choose the no incentive policy, so that the government can obtain the maximum benefit without paying the incentive cost.
Figure 7 shows the evolution paths of A–E.
4.4. Numerical Simulation of the Evolutionary Game
As with the game between the local government and coal-related enterprises, MATLAB is used to simulate the game between the local government and the public. The start time of the evolution is set to 0; the end time is set to 50. The remaining parameters are assigned based on the two game scenarios described above, supporting an analysis of the correctness of the game evolution stable strategy.
Table 12 shows the specific values:
The simulation results of MATLAB are consistent with the results of evolutionary game analysis.
Figure 8 presents the simulation results from MATLAB:
5. Results and Analysis of the Model
The results of the game between local governments and coal-related enterprises in China indicate that total revenue is the key factor driving whether enterprises reduce coal use. After reducing coal use, the benefit gained per unit of production time plays a decisive role in the total revenue of coal-related enterprises. This highlights the importance of improving the efficiency of coal substitutes per unit of time. The specific results of the analysis are as follows:
- (1)
When the benefit of coal remains high, or the cost of coal substitutes is too high with insufficient benefits, coal-related enterprises will maintain a high level of coal production and consumption in the long term. This may hinder the government’s ability to establish and propose a “coal phase-out” policy, as it must instead maintain economic stability, avoid social unrest, and reduce unemployment. This situation is more likely to occur in regions that depend heavily on coal and may impact the optimization of the energy structure at a national level.
- (2)
When there is insufficient profit from coal, or the production efficiency of coal substitutes is higher, coal-related enterprises will transform their production mode to obtain higher profits. In this case, companies would support a shift in policy, and governments would reap environmental benefits without additional regulatory costs. Therefore, the government should consider expanding the commercialization and actual application rate of clean energy through preferential policies and other approaches, to successfully achieve emission reduction targets.
The game results between local governments and the public in China indicate that the key factor determining whether the public supports the “coal phase-out” policy is the cost of energy use after the phase-out is proposed. In other words, the key factor is whether people can afford or are willing to pay for the energy costs in their actual lives. Therefore, it is important to reduce the cost and price of alternative energy sources and maintain stable operations under large-scale application.
- (3)
When energy alternatives are expensive and daily energy system operations are not stable enough, the public will not actively support the government’s “coal phase-out” action. This is because, realistically, China remains a developing country, ranking only 71st in the world with respect to per capita income in 2019 [
42]. In contrast, Germany and the UK are in the top 30 countries [
43]. This makes it difficult for the Chinese public to actively support the government in reducing coal production and consumption when the price of renewable energy is both high and unstable.
- (4)
When coal alternatives are less expensive and the energy system is stable, the public will support “coal phase-out” policies. In this scenario, the Chinese public will welcome and encourage the government, if it can meet the public’s daily energy consumption needs while continuously improving low-carbon energy sources. Therefore, to choose a “coal phase-out”, the Chinese government needs to consider domestic energy subsidies, incentive mechanisms, and other factors. However, the most critical required factor is the technological breakthrough of coal alternatives, which would substantially reduce the usage cost of coal, and achieve the sustainable stability of scale through energy storage technology.
In summary, this analysis confirms that it remains difficult for China to propose a “coal phase-out” schedule as Germany has done. An analysis of the game evolution model of local governments, coal-related enterprises, and the public reveals that the government can propose a “coal phase-out” when both enterprises and the public can benefit from a reduction in coal production and consumption; when these benefits can ensure stable economic and social development; and when daily life will not be affected. Until it achieves its carbon peak target by 2030, China is likely to continue to advocate a “moderate” reduction in coal production, consumption, and the share of coal in power generation at the macro level and on the current basis, instead of making a definitive declaration of “coal phase-out”.
6. Empirical Analysis
Countries around the world hope to achieve energy conservation and emission reduction targets by reducing the use of coal in their energy structures. China is the world’s largest producer and consumer of coal, and Germany is the largest coal consumer in the EU. The two countries are highly dependent on coal, but Germany announced its timetable for a “coal phase-out” in 2019. Meanwhile, we emphasize that the EU has 28 member states and it is difficult to analyze them with uniform criteria, However, this study’s evolutionary game and simulation concludes that China is not ready to declare a “coal phase-out” given the lack of support from local governments, coal-related enterprises, and the public. To scientifically verify this basic conclusion, this part of the study applies the entropy method to classify the three factors affecting the declaration of “coal phase-out”. It also summarizes specific data about China and Germany to develop a list of relevant indicators to facilitate a systematic evaluation [
44].
6.1. Selection of Relevant Indicators of “Coal Phase-Out” in China and Germany
The same indicators for China and Germany are selected to comprehensively compare the development status of relevant “coal phase-out” indicators, as shown in
Table 13.
The positive numbers
X1,
X2, …,
X7 represent the relevant indicators of factors affecting China’s “coal phase-out”. The positive numbers
Y1,
Y2, …,
Y7 refer to the relevant indicators affecting the “coal phase-out” factors in Germany. Assuming that there are
m indexes and
n years, forming an original data matrix
X = (
xij)
mn. First, the original data are standardized. Then, the entropy method is used to calculate the weight of each index [
45]. Finally, the time series for relevant indexes with respect to “coal phase-outs” in China and Germany are calculated, leading to a comprehensive development evaluation.
6.2. Standardization of Indicators
The relevant indicators of the “coal phase-out” factors between China and Germany differ in dimensions and orders of magnitude. The different units and properties of different indicators, and the data of the development evaluation index system are standardized to make the positive and negative indicators consistent and the evaluation indicators comparable [
46,
47]. Equation (27) is used to standardize the positive indicators, and Equation (28) is used to standardize the negative indicators.
In Equations (27) and (28), represents the value of Chinese data after normalized processing; represents the original data of the index system; and are the maximum and minimum values of this indicator during 2013–2019, respectively. Similarly, the value is generated for the Germany data after standardized processing.
6.3. Comprehensive Development Evaluation Value
The main principle of the entropy value method is that the greater the differences between the index values
are, the greater the role of the index in the comprehensive evaluation [
48]. If the index values
are all equal, the index has no role in the comprehensive rating.
The next step is to identify the contribution
of the matrix
X in the
j years of the
i index [
49].
The variable
is the total contribution to indicator
for all years:
In Formula (30), the constant ensures that , i.e., is no more than 1.
The weight
of each indicator is as follows [
50]:
The value of the weighted vector
W = (
)
T constructed by
is the weight coefficient
of the related indexes of the factors affecting the “coal phase-out” in China.
The standardized value of each indicator is multiplied by the weight coefficient , of the corresponding indicator. They are then added, as shown in Equations (32) and (33), to calculate the comprehensive development evaluation values F(x) and G(y) of the relevant indicators of “coal phase-out” in China and Germany, respectively.
6.4. Empirical Research
This study analyzes data for China and Germany’s “coal phase-out” related indicators from 2013 to 2019, calculating the comprehensive development evaluation value of these indicators. The data are from China Energy Statistical Yearbook, The Statistical Bulletin of The People’s Republic of China on National Economic and Social Development 2019, BP, IEA, and The World Bank.
6.4.1. Calculating the Index Weight Coefficient
Using the principle and method associated with the entropy value, the normalized data are substituted into Formulas (31)–(33) to obtain the weight coefficient of each index, shown in
Table 14.
6.4.2. Calculate the Evaluation Value of China-Germany Comprehensive Development
The standardized values and the weight coefficient of indicators
,
were substituted into Formulas (6) and (7) to calculate the comprehensive development evaluation values
F(
x) and
G(
y) of the relevant indexes of the “coal phase-out” in China and Germany, respectively, as shown in
Figure 9.
The figure shows that the comprehensive development evaluation values associated with the “coal phase-out” in both countries are consistent with the above analysis. Beginning with China, the relevant indicators affecting its ability to implement a “coal phase-out” are steadily rising. The period from 2013 to 2018 was a period of rapid development in China, due to the accelerated energy transformation following the 18th National Congress of the Communist Party, with local governments investing heavily in coal alternatives. The amount of electricity generated from clean energy increased from 183.8 Twh in 2013 to 732.3 Twh in 2019, ranking first in the world. At the same time, China was also affected by the large volume and share of the coal industry. The country entered a flat coal development stage from 2018. Based on the data, China is expected to stay in this stage for a long time, directly delaying its ability to declare a “coal phase-out”.
In contrast, indicators affecting the “coal phase-out” factor in Germany developed rapidly, reaching 0.9195 in 2019. This is due to the German government’s long-term efforts to achieve a green, clean, and low-carbon energy transition. Germany’s carbon dioxide emissions peaked in 1973 (1116.4 million tonnes) and decreased to 683.8 million tonnes in 2019. The national strategy of “Energiewende” was introduced in 2010, and as a result, Germany has made significant breakthroughs in renewable energy policy, technological innovation, and investment. Given the development of relevant indicators, in 2019, Germany proposed completing its concrete plan for a “coal phase-out” by 2038.
6.4.3. Discussion
Local governments, coal-related enterprises, and the public serve as the game objects to influence decision-making, because China has a long history of using coal and has experienced an uneven distribution of coal resources. Decisions at a national level are implemented by local governments with rich coal resources. Similar to Germany before its decision of “coal phase-out”, independent of economic factors, the attitude of coal-related enterprises and the public towards “coal phase-out” directly affects the decisions of government policy makers.
According to the empirical results, it is realized that the current process of “coal phase-out” in China is still in the exploratory stage. The policy of “coal phase-out” in Germany depends on the long-term efforts of the government. Under the incentives of the government and policies, coal-related enterprises are constantly reducing the proportion of coal in the energy system. Local governments and the federal government have the same goals, and the public’s income level can afford the price changes in the process of “coal phase-out”. Therefore, concrete implementation of changes in coal use still depends on the actions of local governments. China does not have the similar corporate pressure or public atmosphere as Germany. Until it achieves its carbon peak target by 2030, China is likely to continue to advocate a “moderate” reduction in coal production, consumption, and the share of coal in power generation at a macro level and on the current basis, instead of making a definitive declaration of “coal phase-out”.
7. Conclusions and Policy Implications
The results of the evolutionary game model involving local governments, coal-related enterprises, and the public; and the empirical analysis of the relative indexes of China and Germany, lead to the following conclusions.
First, China remains unable to clearly declare a “coal phase-out”, as coal is likely to occupy an important position in China’s energy system in the short term. Facing this reality, China should increase investment in scientific and technological innovation to achieve further breakthroughs in the clean and efficient use of coal technology. It should also advance its energy transformation as it works to achieve its “double carbon” related goals. A high proportion of coal use continues to affect the ability to reach carbon dioxide emissions reduction targets, especially in Shanxi, Inner Mongolia and other coal-rich regions. China needs to focus on the process of coal use, and improve the efficiency of coal utilization, mandatory carbon capture, and storage devices. This would promote the use of technology for coal cleaning, to achieve the target “net zero discharge” standard and maximize reductions in the share of carbon emissions caused by coal use.
Second, if China wants to achieve its “emission peak” goal in the medium term and “carbon neutrality” in the long term, it will need to significantly reduce coal production and consumption until it is completely phased out. However, this does not mean that China should be overly influenced by the global trends towards “coal phase-outs”; in other words, it should maintain its independent judgment. China is still a developing country with uneven internal development. In terms of its size, economic scale, industrial structure, population, and other variables, China cannot compare with Germany, Britain, and other industrially developed countries that have explicitly proposed or succeeded in declaring a “coal phase-out”. The security of the energy supply is consistently a top priority in China’s energy transition. The best option is to propose a smooth and mature transition plan, without affecting energy supply and economic and social stability. This means fully considering the many difficulties and challenges faced by a “coal phase-out”. It appears more realistic to choose the right time point in the pursuit of carbon neutrality by 2060, after China is well on its way to achieving its emission peak in 2030.
Third, vigorously developing renewable energy and reducing the proportion of coal in the energy system should become “top-down” policies in China, as well as becoming “bottom-up” practices. The cost of wind and solar power generation is expected to continue to fall, and further developing energy storage technology could help improve the stability of wind and photovoltaic power generation. Ultimately, the goal is for the on-grid prices for wind and photovoltaic power to achieve parity with other types of power as soon as possible. The cost of solar photovoltaic power generation has decreased by 73% since 2010, and the cost of photovoltaic system components decreased by 90% between 2007 and 2018. In 2019, the average cost of photovoltaic power in China reached 0.44 yuan/Kwh, which is only 0.08 yuan higher than the FGD (Flue Gas Desulfurization) coal-fired power price of 0.36 yuan/kWh [
51]. The 25% decrease in the cost of onshore wind power over 10 years means that the on-grid price of this form of power should lead to an era of parity by the end of 2021.
Fourth, China’s declaration of a “coal phase-out” is not a short-term immediate move, but it is not unattainable. It should be planned according to the actual situation, to achieve the following conditions while maintaining stable GDP growth. First, through its large volume of energy use, China can realize the economies of scale with respect to clean energy, so the cost of domestic renewable energy might approach or reach the cost of coal. The government can balance the traditional income of coal-related enterprises and the cost of public expenditures through subsidies and incentives, and gradually gain the support of both. This aligns with what the federal government did in Germany before proposing the “coal phase-out” and was shown to be effective. Second, the fundamental understanding of “coal phase-out” is a long transition process, and even if a timetable is proposed, China needs to fully prepare a set of practical implementation plans to address any regional economic recessions, unemployment, or social unrest in the coal industry. The goal would be to ensure a smooth policy implementation transition, through multi-centered cooperation among the central government, local governments, enterprises, and social institutions. In particular, the contradictory relationship between the central and local governments should be considered, to effectively resolve the pressure from local governments and ensure the implementation of “coal phase-out”, while proposing policies at the national level. If successful, China could become the country with the largest reforms, the highest levels of moral evaluation, and the most to gain from a future energy transition.
Finally, in order to improve the content of this study and form a more complete research system, future research can be carried out from the following aspects to address the shortcomings of this study: (1) Select more relevant impact indicators to enhance the comprehensiveness of the study. In addition to economic, industrial, social, and other influences, China needs to consider more highly sensitive political factors, such as the interests and preferences of domestic environmental organizations; (2) Combine theoretical analysis with empirical analysis to improve the objectivity and scientific merit of the research. The next research should focus on China’s coal structural adjustment and its economic effects, the specific adjustments of the coal industry at a micro level, and the alternative relationship between other energy types; (3) With global energy supply shortages in 2021, leading to a continued increase in coal demand. We should conduct a detailed study on each influence index of coal phase-out to further explore how this index promotes the process of “coal phase-out”, and especially continue to track the real coal phase-out effects in other countries.


