Abstract
In this study, the authors present a techno-economic assessment of on-site hydrogen refuelling stations (450 kg/day of H2) based on different hydrogen sources and production technologies. Green ammonia, biogas, and water have been considered as hydrogen sources while cracking, autothermal reforming, and electrolysis have been selected as the hydrogen production technologies. The electric energy requirements of the hydrogen refuelling stations (HRSs) are internally satisfied using the fuel cell technology as power units for ammonia and biogas-based configurations and the PV grid-connected power plant for the water-based one. The hydrogen purification, where necessary, is performed by means of a Palladium-based membrane unit. Finally, the same hydrogen compression, storage, and distribution section are considered for all configurations. The sizing and the energy analysis of the proposed configurations have been carried out by simulation models adequately developed. Moreover, the economic feasibility has been performed by applying the life cycle cost analysis. The ammonia-based configurations are the best solutions in terms of hydrogen production energy efficiency (>71%, LHV) as well as from the economic point of view, showing a levelized cost of hydrogen (LCOH) in the range of 6.28 EUR/kg to 6.89 EUR/kg, a profitability index greater than 3.5, and a Discounted Pay Back Time less than five years.
1. Introduction
The increase of global transport emissions was 0.5% in 2019 in comparison with 1.9% annually since 2000. This reduction is due to specific actions involving biofuels utilization, improvements in energy conversion, and electrification. Nevertheless, the transportation sector is still responsible for 24% of CO2 emissions. Road vehicles account for nearly 75% of transport CO2 emissions [1]. Electric mobility, based on battery electric vehicles (BEVs) and on fuel cell electric vehicles (FCEVs) fed by green hydrogen (produced by renewable energy sources, RESs), is expected to play a key role in the decarbonization of the transportation sector [2]. With their differences in driving range, energy density, and recharging/refuelling, BEVs and FCEVs technologies can replace fossil fuel-based vehicles [3]. In fact, BEVs are more suitable for light-duty vehicles and short-range use, while FCEVs can be used when longer ranges are required (i.e., trucks, long-distance buses) [4] or when electrification is critical (i.e., power trains, ferries). According to the IEA forecasting, the fuel cell electric vehicle market is beginning to flourish, catalyzed by developments in Asia (i.e., China, Japan, and Korea), where major countries have established aggressive penetration targets for hydrogen-driven FCEVs (1,000,000 vehicles are expected to be on the road by 2030 in China) [5,6]. One of the constraints on the market penetration of FCEVs is the hydrogen refuelling infrastructure [7]. Currently, there are about 200 hydrogen refuelling stations in the world (mostly in Japan, Germany, and California), and 5300 new stations are planned by 2030 [8].
In large-scale off-site stations, hydrogen is produced elsewhere and delivered to the station by pipelines, trucks, or tube trailers. In on-site small and medium-scale stations, hydrogen is generated and stored on the site using different sources and delivered to vehicles. In the initial phase of low market penetration of FCEVs, it can be more feasible to distribute on-site small-scale hydrogen refuelling stations (HRSs). Moreover, in order to avoid CO2 emissions, the use of renewable electricity [9] and zero-carbon sources (ammonia [10], biogas [11], microalgae [12]) can be the best solutions for assuring the “green hydrogen” production [13].
Since the main critical issue of these on-site renewable-energy powered HRSs is the hydrogen cost, depending on both the plant size (hydrogen production capacity) and the hydrogen source, in recent scientific literature, several studies have been focused on techno-economic analysis, aiming to evaluate the levelized cost of hydrogen (LCOH).
Literature Overview on On-Site Hydrogen Refuelling Stations Costs
The hydrogen retail price strictly depends on the hydrogen production, compression, storage, and distribution costs. Therefore, several studies are devoted to analyze technologies and components to reduce these costs.
Gökçek and Kale in [14] proposed a techno-economic analysis for a hydrogen refuelling station powered by two types of hybrid renewable power generation systems (wind-photovoltaic (PV)-battery and wind-battery). The analysis was performed using the HOMER packaging software. The refuelling station was sized for servicing 25 vehicles per day, each having a 5 kg tank. Results concluded that the cost of hydrogen production was 8.92 USD/kg (7.92 EUR/kg) for the hybrid wind-photovoltaic-battery system and 11.08 USD/kg (9.86 EUR/kg) for the hybrid wind-battery system.
Zhao and Brouwer [15] studied hydrogen refuelling stations consisting of an electrolyzer supplied by renewable power plants (wind and PV) from an economic point of view by calculating the LCOHs. They estimated that, by assuming an average levelized energy cost of 0.103 USD/kWh for the solar PV system, the LCOH was 9.14 USD/kg (8.13 EUR/kg), while for the wind-based system, the cost dropped to 6.71 USD/kg (5.97 EUR/kg).
Barhoumi et al. [16] discussed a detailed economic assessment and evaluation of a hydrogen refuelling station based on PV technology coupled with an electrolyzer. With a hydrogen capacity of 150 kg/day, the LCOH for only hydrogen production was equal to 3.32 EUR/kg since the compression, storage, and dispensing unit costs were not included.
Ayodele et al. [17] performed a techno-economic study for a wind-powered hydrogen refuelling station in seven cities of South Africa. The hydrogen capacity was 125 kg/day (25 hydrogen vehicles). Results highlighted that, by using wind as an energy source, the cost of hydrogen production ranged from 6.34 USD/kg (5.64 EUR/kg) to 8.97 USD/kg (7.98 EUR/kg).
Ulleberg and Hancke [18] proposed a hydroelectric powered hydrogen refuelling station in Norway. The authors estimated a hydrogen production cost ranging from 9.2 EUR/kg with 50% of public support on the investment costs to 15.7 EUR/kg without public support.
In [19], the authors presented an economic analysis concerning the hydrogen COx-free production, based on the ammonia decomposition, for a small-scale (70 kg/day) on-site HRS in Korea. The hydrogen cost, considering both the production and dispensing, was 9.06 USD/kg (8.06 EUR/kg).
Marcoberardino et al. [20] carried out a techno-economic analysis for a hydrogen production unit based on a biogas reforming system (steam or autothermal) coupled with a pressure swing adsorption unit for green hydrogen production (100 kg/day). The calculated LCOHs (the hydrogen is compressed at 700 bar and the dispensing unit is not included) values range from 5 EUR/kg to 7.2 EUR/kg.
Thus, by analyzing the available scientific literature, it can be noticed that the majority are based on renewable electrolytic hydrogen production (wind or solar PV), while a very small number considers ammonia or biomass as hydrogen sources. Moreover, the compression, storage, and dispensing unit costs are often not included in the LCOH evaluation.
In this paper, the authors present a broad and comprehensive analysis of on-site small hydrogen refuelling stations (450 kg/day of H2), based on different hydrogen sources and production technologies, by comparing their operation, performance and cost. Therefore, the strength of this study is to provide an extensive analysis of different on-site HRS configurations by identifying several technical and economic issues crucial to the decision-making processes concerning the design and installation of on-site hydrogen refuelling stations.
In the proposed on-site hydrogen refuelling stations, green ammonia (hydrogen and nitrogen needed for ammonia synthesis are generated using renewable electricity), biogas and water have been considered as the hydrogen sources, while autothermal reforming, cracking, and electrolysis have been selected as the hydrogen production technologies. In order to evaluate the economic feasibility of the proposed HRSs plants, the life cycle cost (LCC) analysis has been applied, and several economic indicators such as LCOH, discount payback time (DPBT), profitability index (PI), net present value (NPV), and internal return rate (IRR) have been calculated.
The proposed configurations were presented by the authors in previous papers [10,21,22,23], in which the HRSs were sized for smaller hydrogen capacities (100 and 200 kg/day). In [10,21] in particular, ammonia-based HRSs with hydrogen capacities of 100 kg/day and 200 kg/day were proposed, respectively. In [10], the selected power production section was a SOFC unit, and in [21], a PEMFC system was implemented for satisfying the electricity requirements. A biogas-based HRS, characterized by an autothermal reforming (ATR) unit, as the hydrogen production system, and sized for a capacity of 100 kg/day, was studied in [22]. Furthermore, a grid-connected PV plant integrated with an electrolysis unit was examined in [23], where different plant configurations of hydrogen production capacity and electricity were analyzed.
Starting with the results from previous studies, in this work, the techno-economic analysis has been augmented by considering a higher hydrogen capacity (450 kg/day) and updating the costs of components and materials to reach better results in terms of LCOH and sustain the economic feasibility of these plants.
2. Methodological Approaches to Analysis
2.1. Hydrogen Refuelling Stations: Design and Modeling
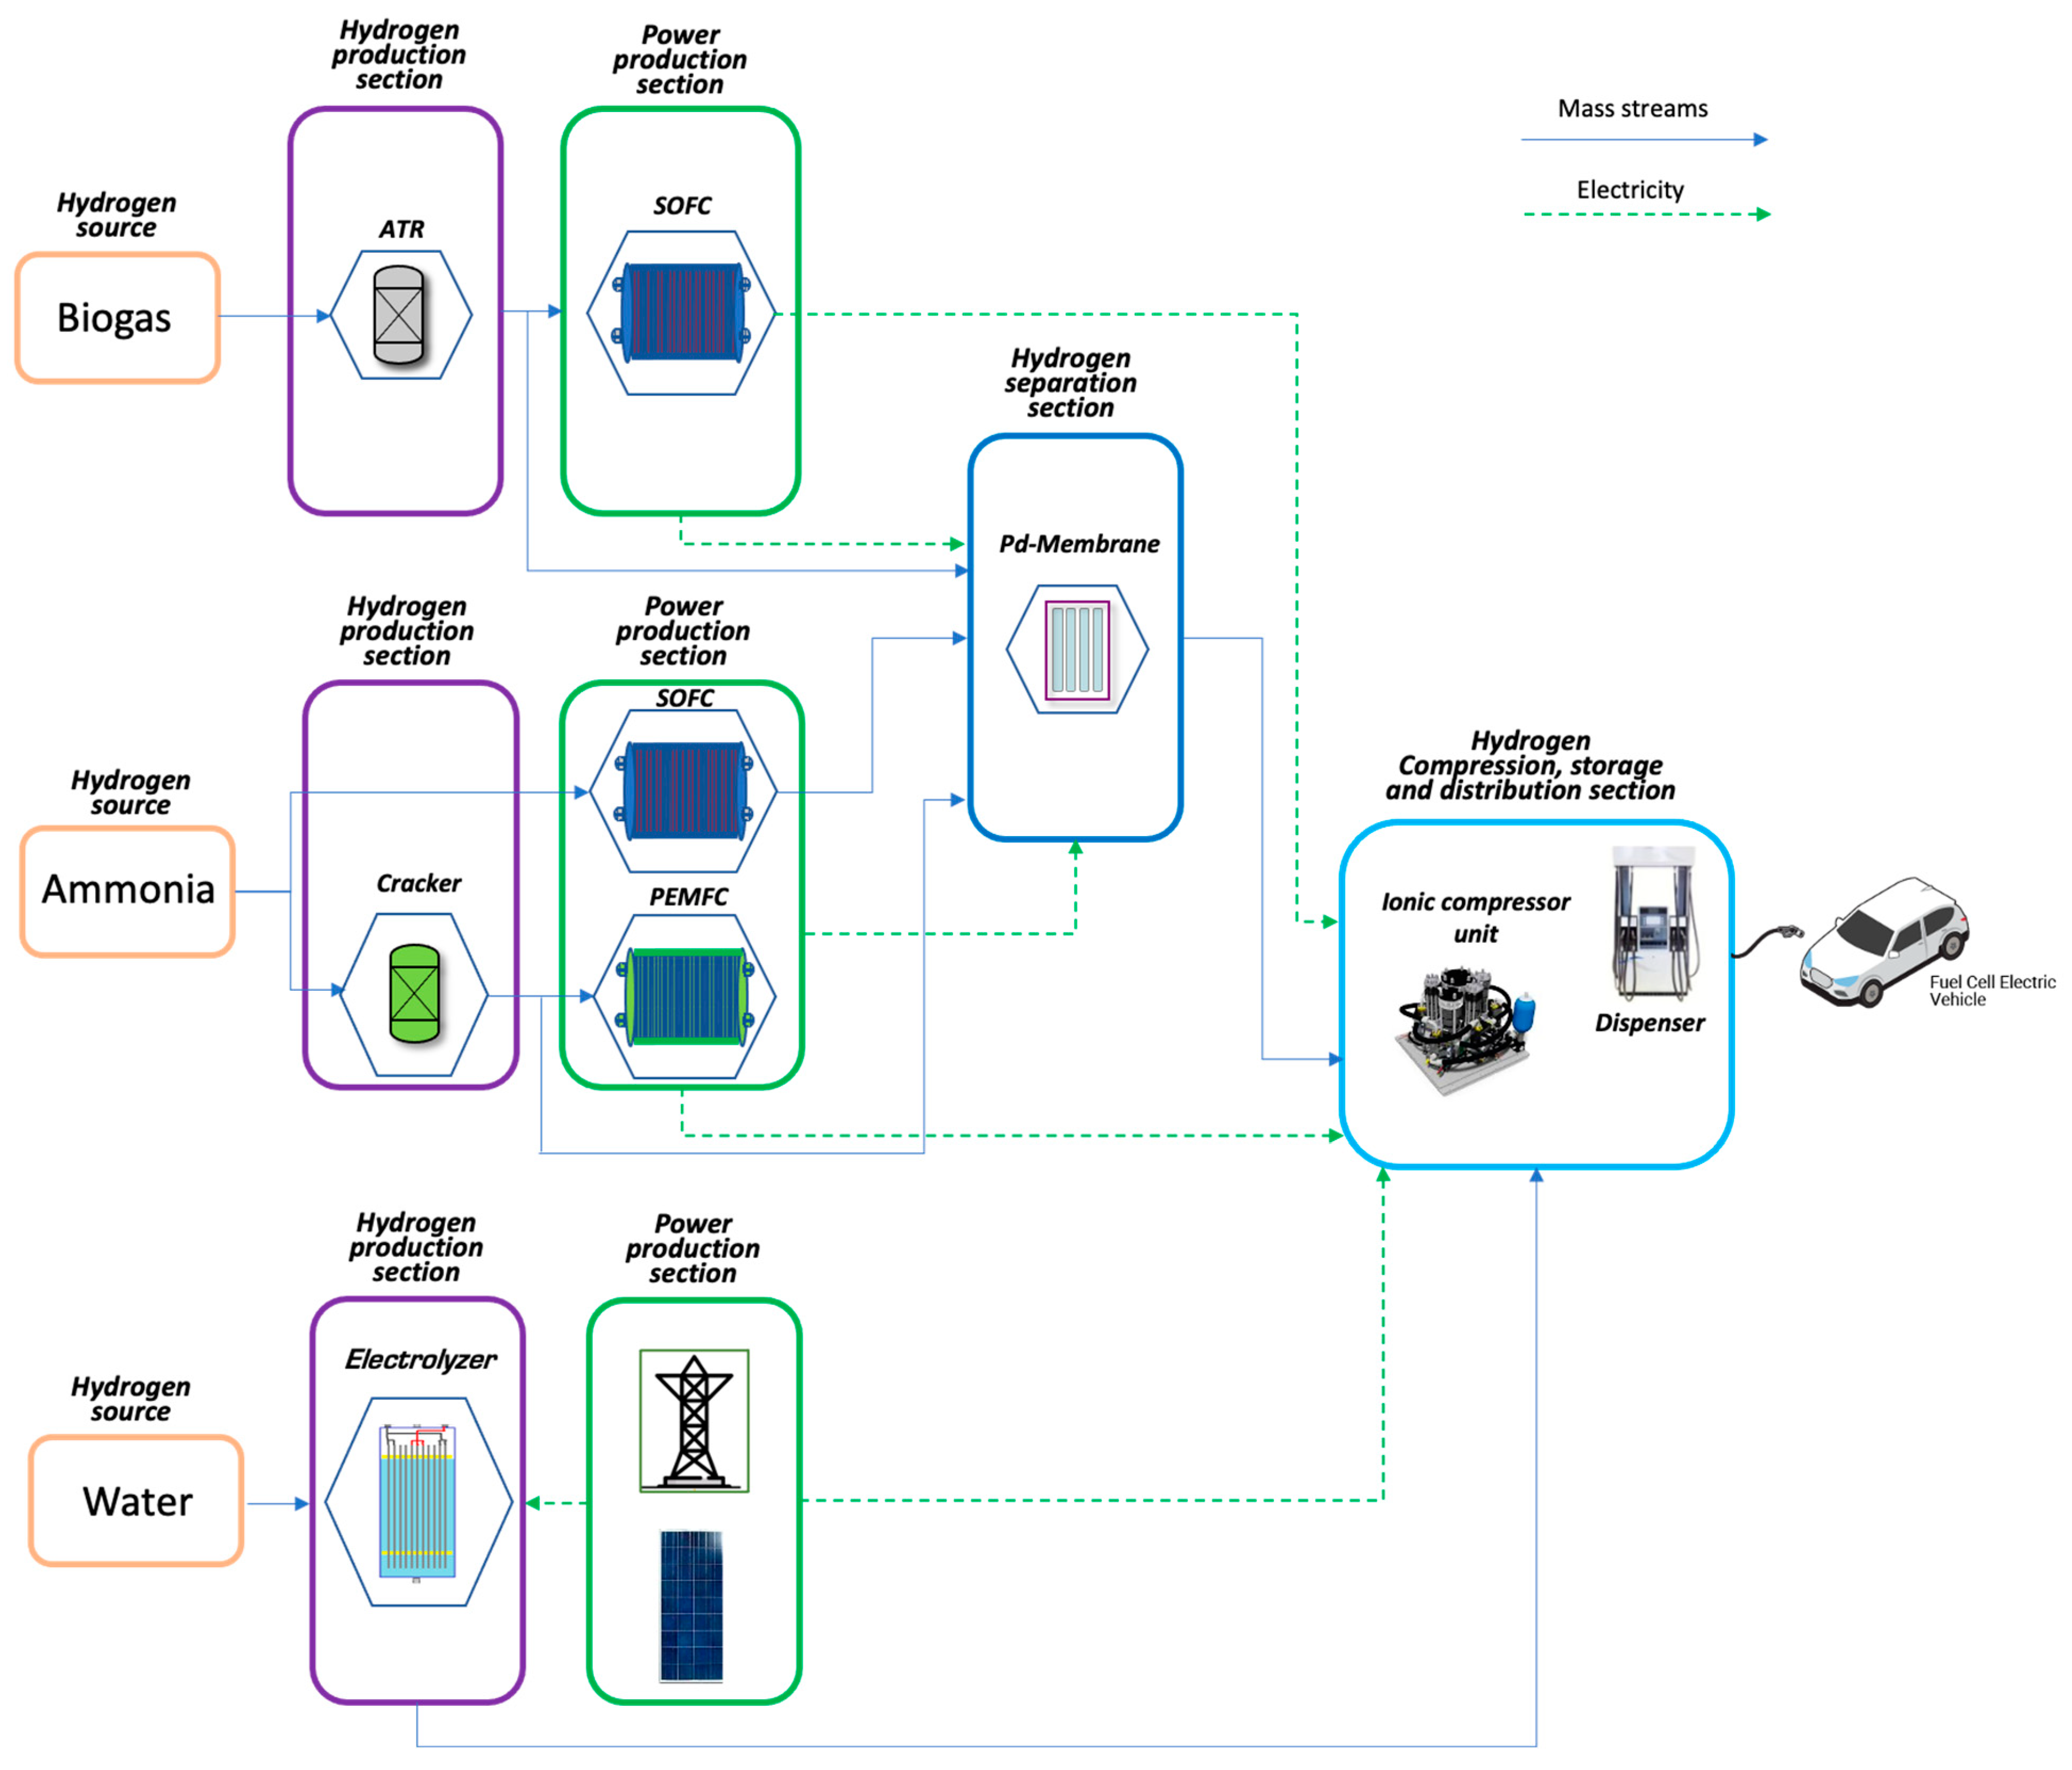
The proposed on-site hydrogen refuelling stations, depicted in Figure 1, are based on different hydrogen sources (ammonia, biogas, and water) and power production technologies (cracking, autothermal reforming, and electrolysis). The electric energy demands of the HRSs are satisfied using the fuel cell technology—proton exchange membrane fuel cell (PEMFC) and solid oxide fuel cell (SOFC)—for the biogas and ammonia-based configurations and the PV grid-connected power plant for the water-based one. The hydrogen purification, where necessary, is performed by a Pd-based membrane unit. Finally, the same hydrogen compression, storage, and distribution sections are considered for all configurations.
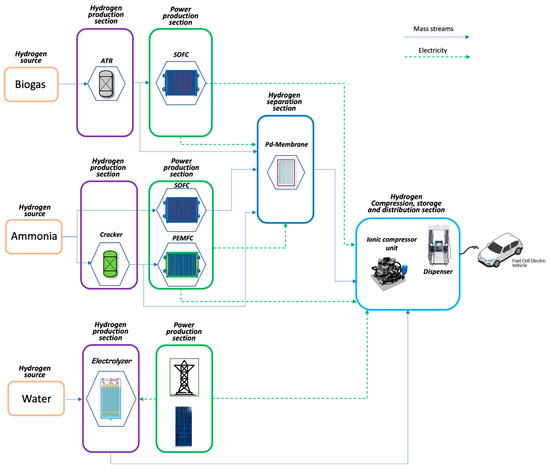
Figure 1.
On-site Hydrogen Refuelling Stations concepts.
The studied configurations are:
- Ammonia-based SOFC (NH3_SOFC)
- Ammonia-based PEMFC (NH3_PEMFC)
- Biogas-based SOFC (B2H_SOFC)
- Water electrolysis-based PV (H2O_PV)
Refuelling stations have been sized considering a hydrogen production capacity equal to 450 kg/day and sizing the power production section for satisfying the electricity demand of the station.
In order to assess the energy and mass balances of the plants, numerical models have been developed in the Aspen PlusTM environment. Each plant model has been built using existing operation blocks available in the software library (i.e., compressor, heat exchanger, separator, and chemical reactor). Specific components not available, such as the SOFC power module, the PEMFC power module, the electrolysis module, the Pd-Membrane unit, and the ionic compressor unit, have been modelled using Hierarchy blocks (or user-defined blocks) and by implementing a specific Fortran block calculator. Details on the operation blocks are presented in Appendix A.
The Peng–Robinson cubic equation of state (EOS) has been used to calculate the thermodynamic properties of liquid and gaseous streams.
The plants’ performances have been estimated by introducing an index that compares the chemical energy of the output hydrogen to the input energy (chemical or electric) used to produce it and, at the same time, to satisfy the HRS electric requirements. This index is the hydrogen production energy factor (HPEF) calculated in Equation (1):
2.1.1. NH3_SOFC Plant Design
Among hydrogen carriers, ammonia can be considered a promising fuel that can be easily stored as a liquid at 8.7 bar and 20 °C (the energy density of liquid ammonia is 13.77 MJ/L). Green ammonia (CO2 free hydrogen carrier) is obtained by synthesizing hydrogen and nitrogen generated using electricity from renewable power plants. Moreover, ammonia can directly feed SOFCs without using an external cracking reactor because the high operating temperature and the typical nickel-based anodic electrode allow the internal ammonia decomposition [24,25]. Thanks to these characteristics and advantages, ammonia is a suitable fuel candidate as a hydrogen source in novel on-site HRSs.
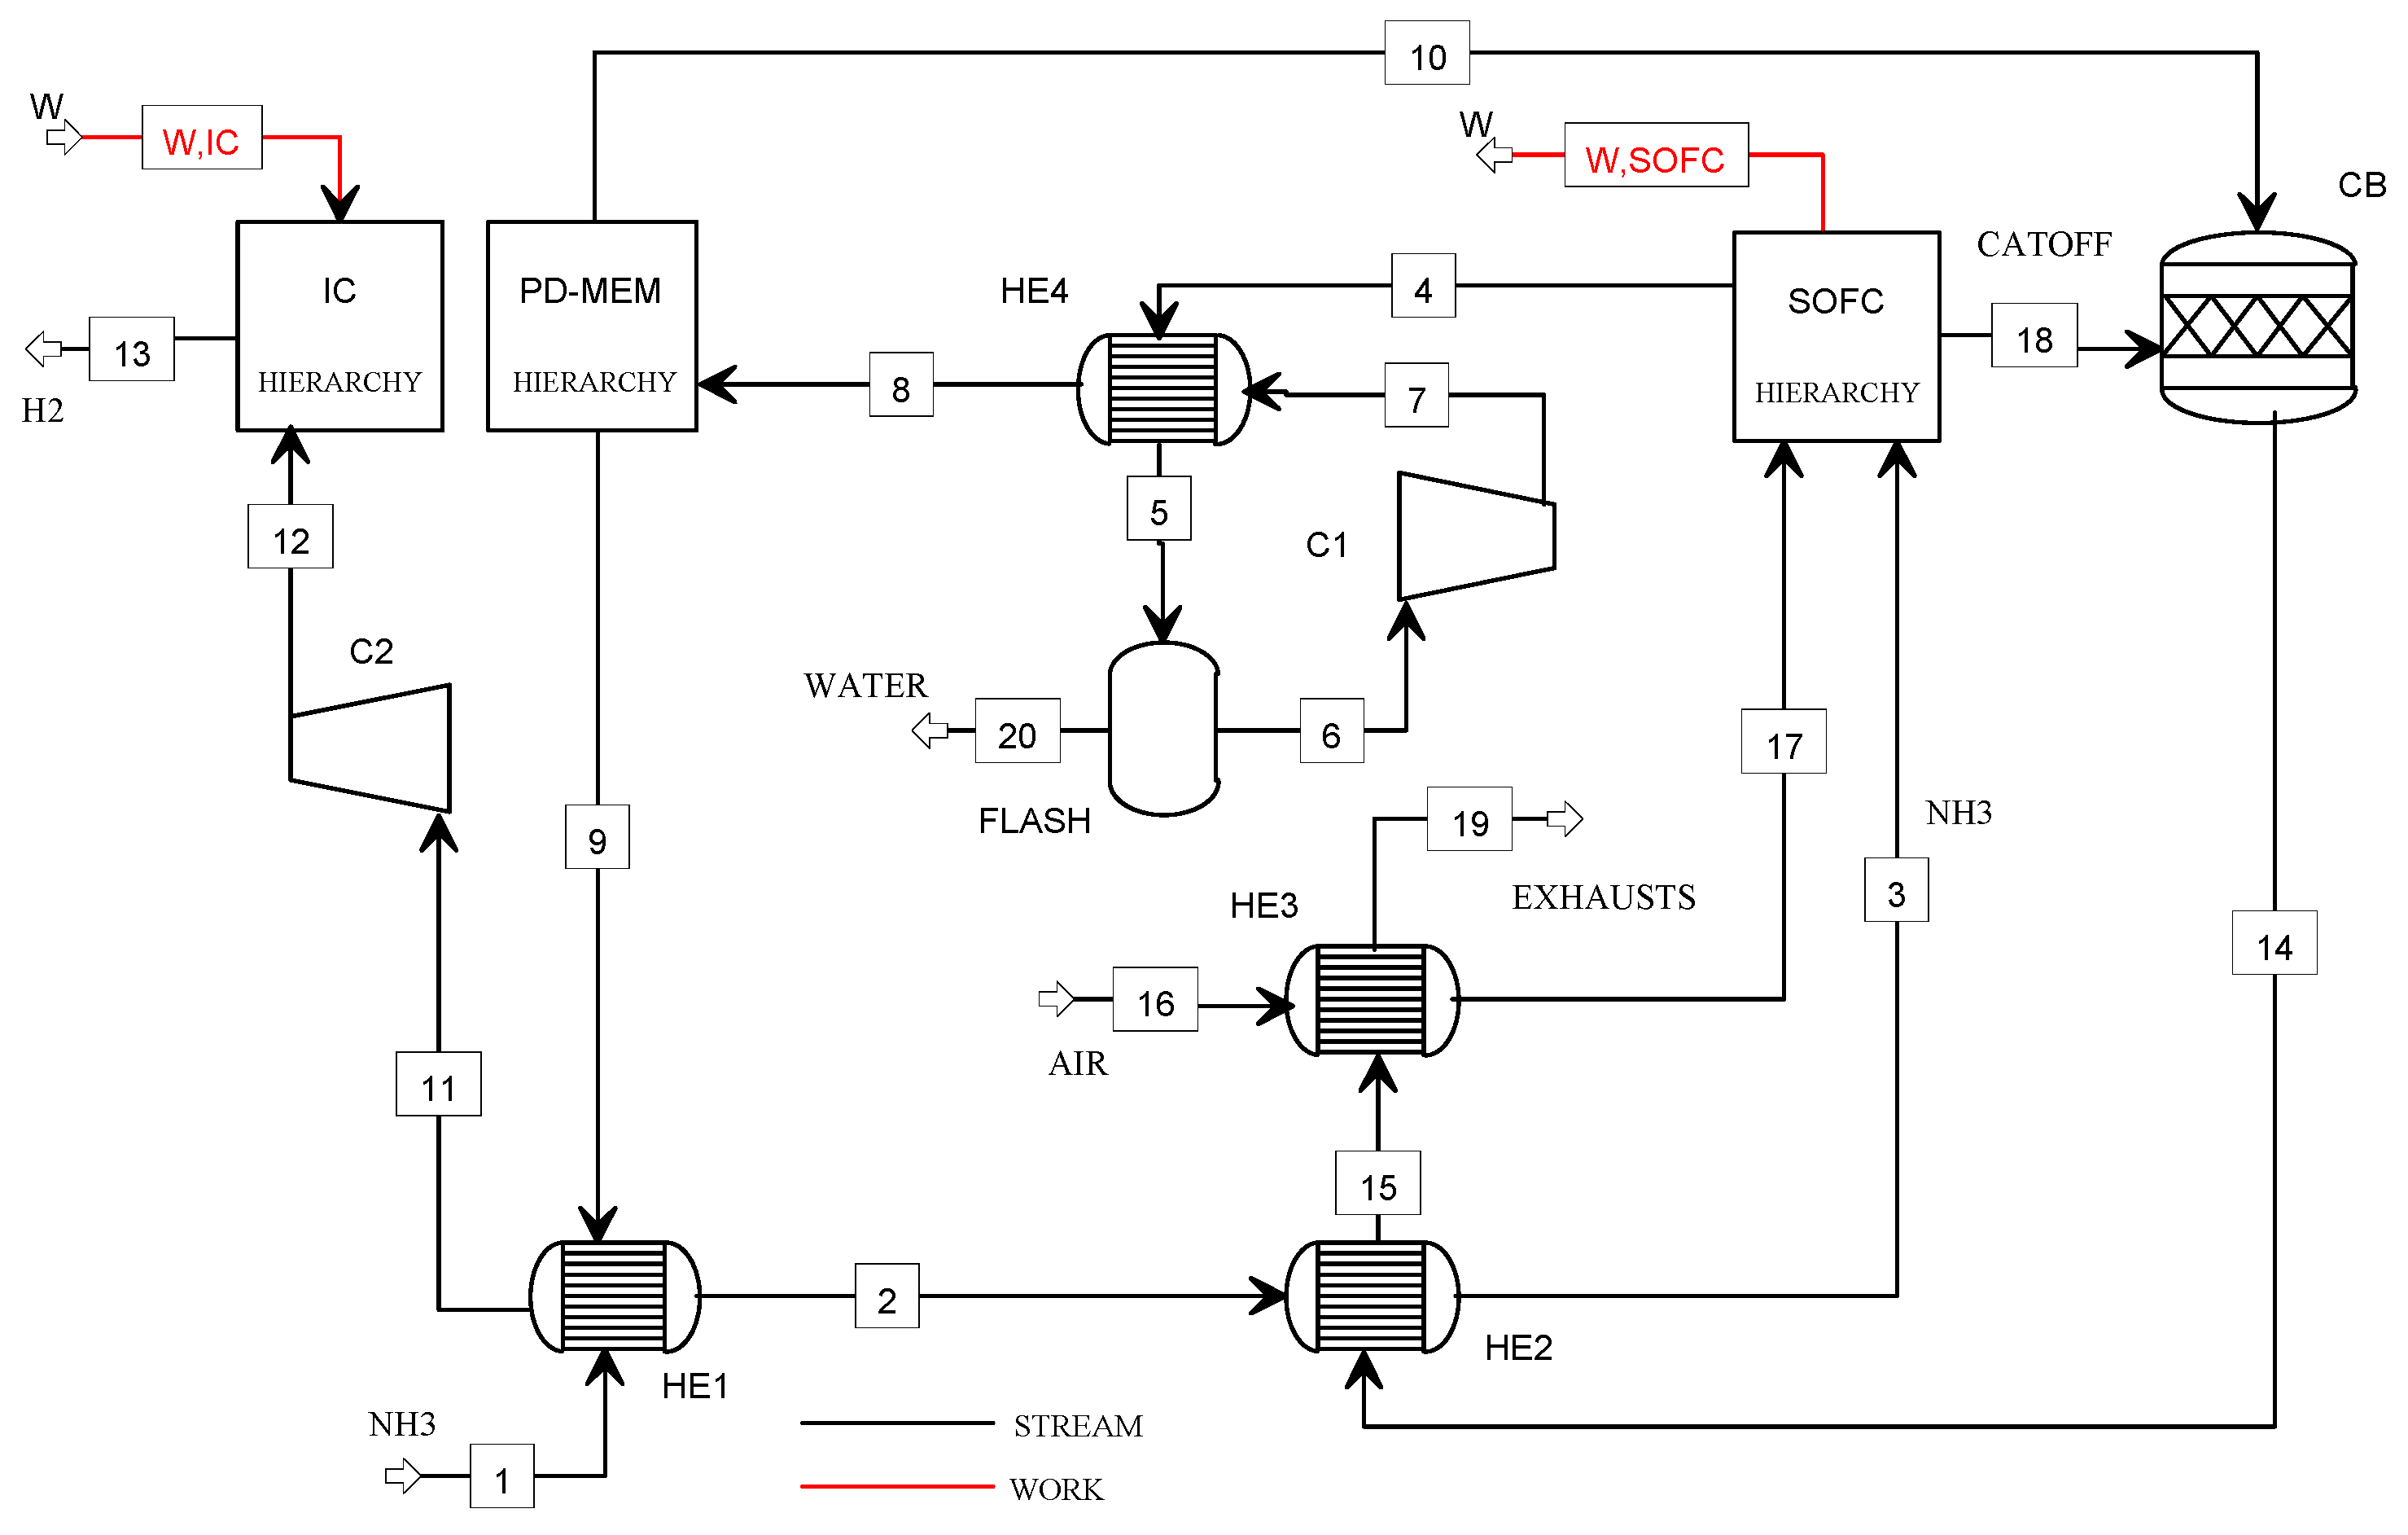
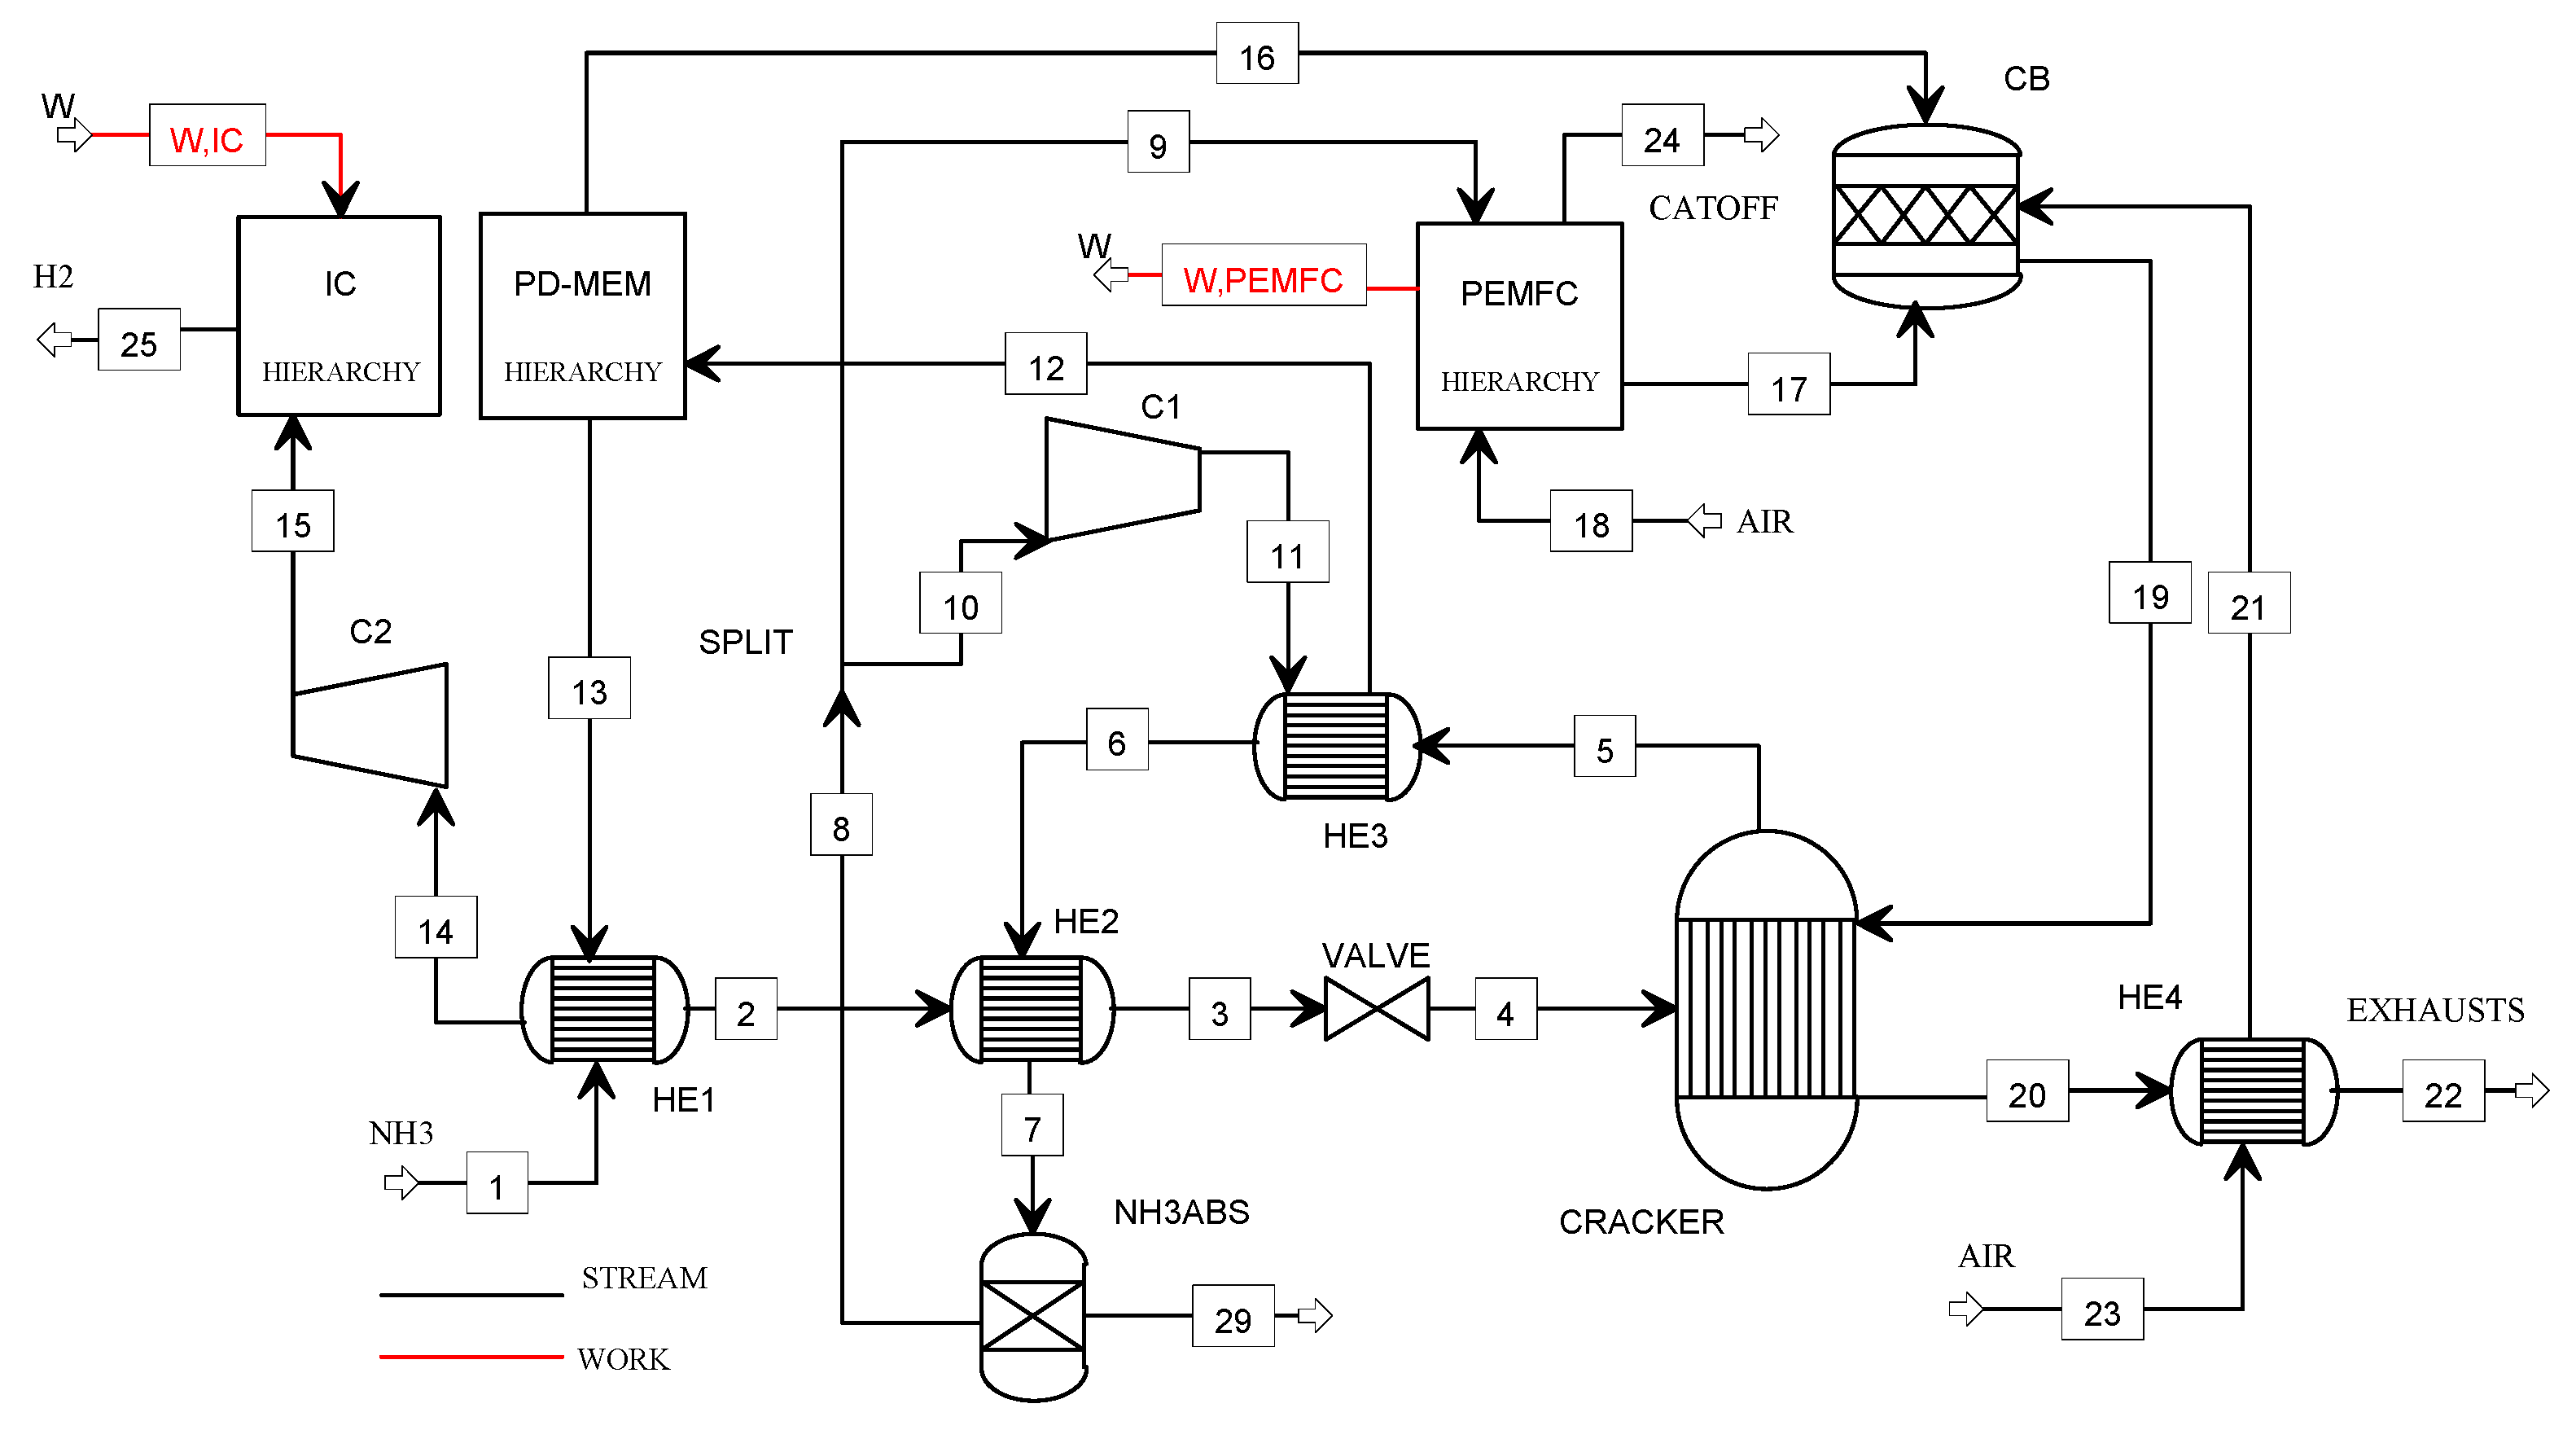
Figure 2 shows the flowsheet of the NH3_SOFC plant.
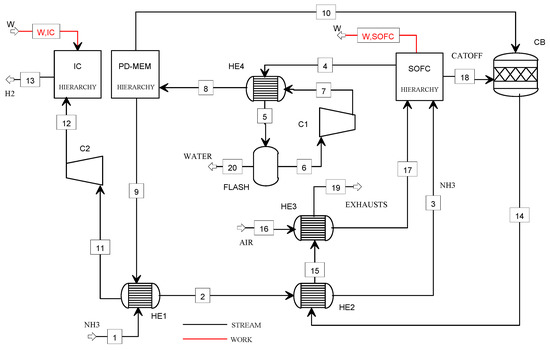
Figure 2.
Flowsheet of the NH3_SOFC plant model.
The ammonia (1) is preheated (HE1), vaporized (HE2), and sent to the SOFC power unit, where its decomposition occurs. The electrical power is produced at low fuel utilization factors so that the hydrogen content in the anode off-gas is high, and it can be used for the operation of the refuelling station. Thus, the anode off-gas (4) is fed to the Pd-membrane unit (PD-MEM) at its operating conditions in terms of pressure (4.2 bar) and temperature (400 °C). The purge gas (10) is mixed with the cathode off-gas (18) in the catalytic burner (CB), and the pure hydrogen (9) is delivered to the compression section. The hydrogen (11) is precompressed at 5 bar (C2) and, finally, stored at 900 bar using the ionic compression unit. The exhausts from the CB are used to heat the ammonia (2) and the cathodic air (16) (heat exchangers HE2 and HE3) before being vented (19).
2.1.2. NH3_PEMFC Plant Design
In the NH3_PEMFC plant, the ammonia decomposition is performed in a specific catalytic reactor at a temperature of 550 °C (at temperatures higher than 425 °C, the ammonia conversion is 98–99%).
The cracking reaction is:
2NH3→3H2+N2
The electricity requirements for the plant operation are satisfied by a PEM fuel cell unit fed by a part of the produced hydrogen.
Figure 3 shows the flowsheet of the plant model.
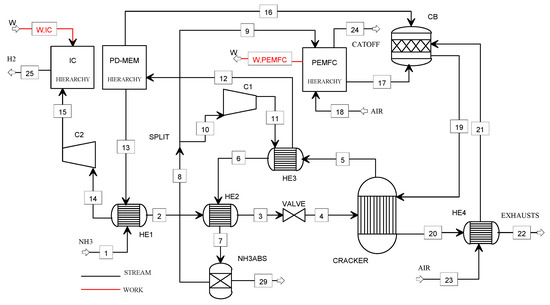
Figure 3.
Flowsheet of the NH3_PEMFC model.
The liquid ammonia (1) at 8.7 bar is vaporized (57 °C) and superheated (279 °C) in the heat exchangers HE1 and HE2, respectively. After expanding through the valve (at ambient pressure), the ammonia (4) is sent to the cracking reactor. The cooling of the stream (5) is performed in the heat exchangers HE3 (457 °C) and HE2 (67 °C) before entering the NH3 absorber. The hydrogen–nitrogen mixture is split in the stream (10) compressed in C1 and the stream (9) for the PEMFC feeding. The exhausts (19) coming from the catalytic burner (CB) are used for supplying heat to the cracking reactor. The PEMFC off-gases (17), the purge gas (16), and the preheated combustion air (21) are the CB feeding gases. The stream (11) at 3.7 bar is heated at 400 °C in HE3 before entering the Pd-membrane. The hydrogen (14) is precompressed at 5 bar (C2) and, finally, stored at 900 bar using the ionic compression unit.
2.1.3. B2H_SOFC Plant Design
In the B2H_SOFC plant, the biogas composition equals 60% CH4 and 40% CO2 (the lower heating value is 17.7 MJ/kg) produced by the BEKON dry fermentation technology, which is one of the best available technologies for the anaerobic digestion process [26].
The autothermal reforming (ATR) process has been selected for the hydrogen production section. In this process, the steam reforming and the partial oxidation processes are combined so that the thermal energy necessary for the steam reforming reaction is internally provided by the exothermic partial oxidation reaction. The steam to biogas ratio (S/B, mol/mol) and the oxygen to biogas ratio (O/B, mol/mol) are the parameters that define the thermal balance of all reforming reactions [27].
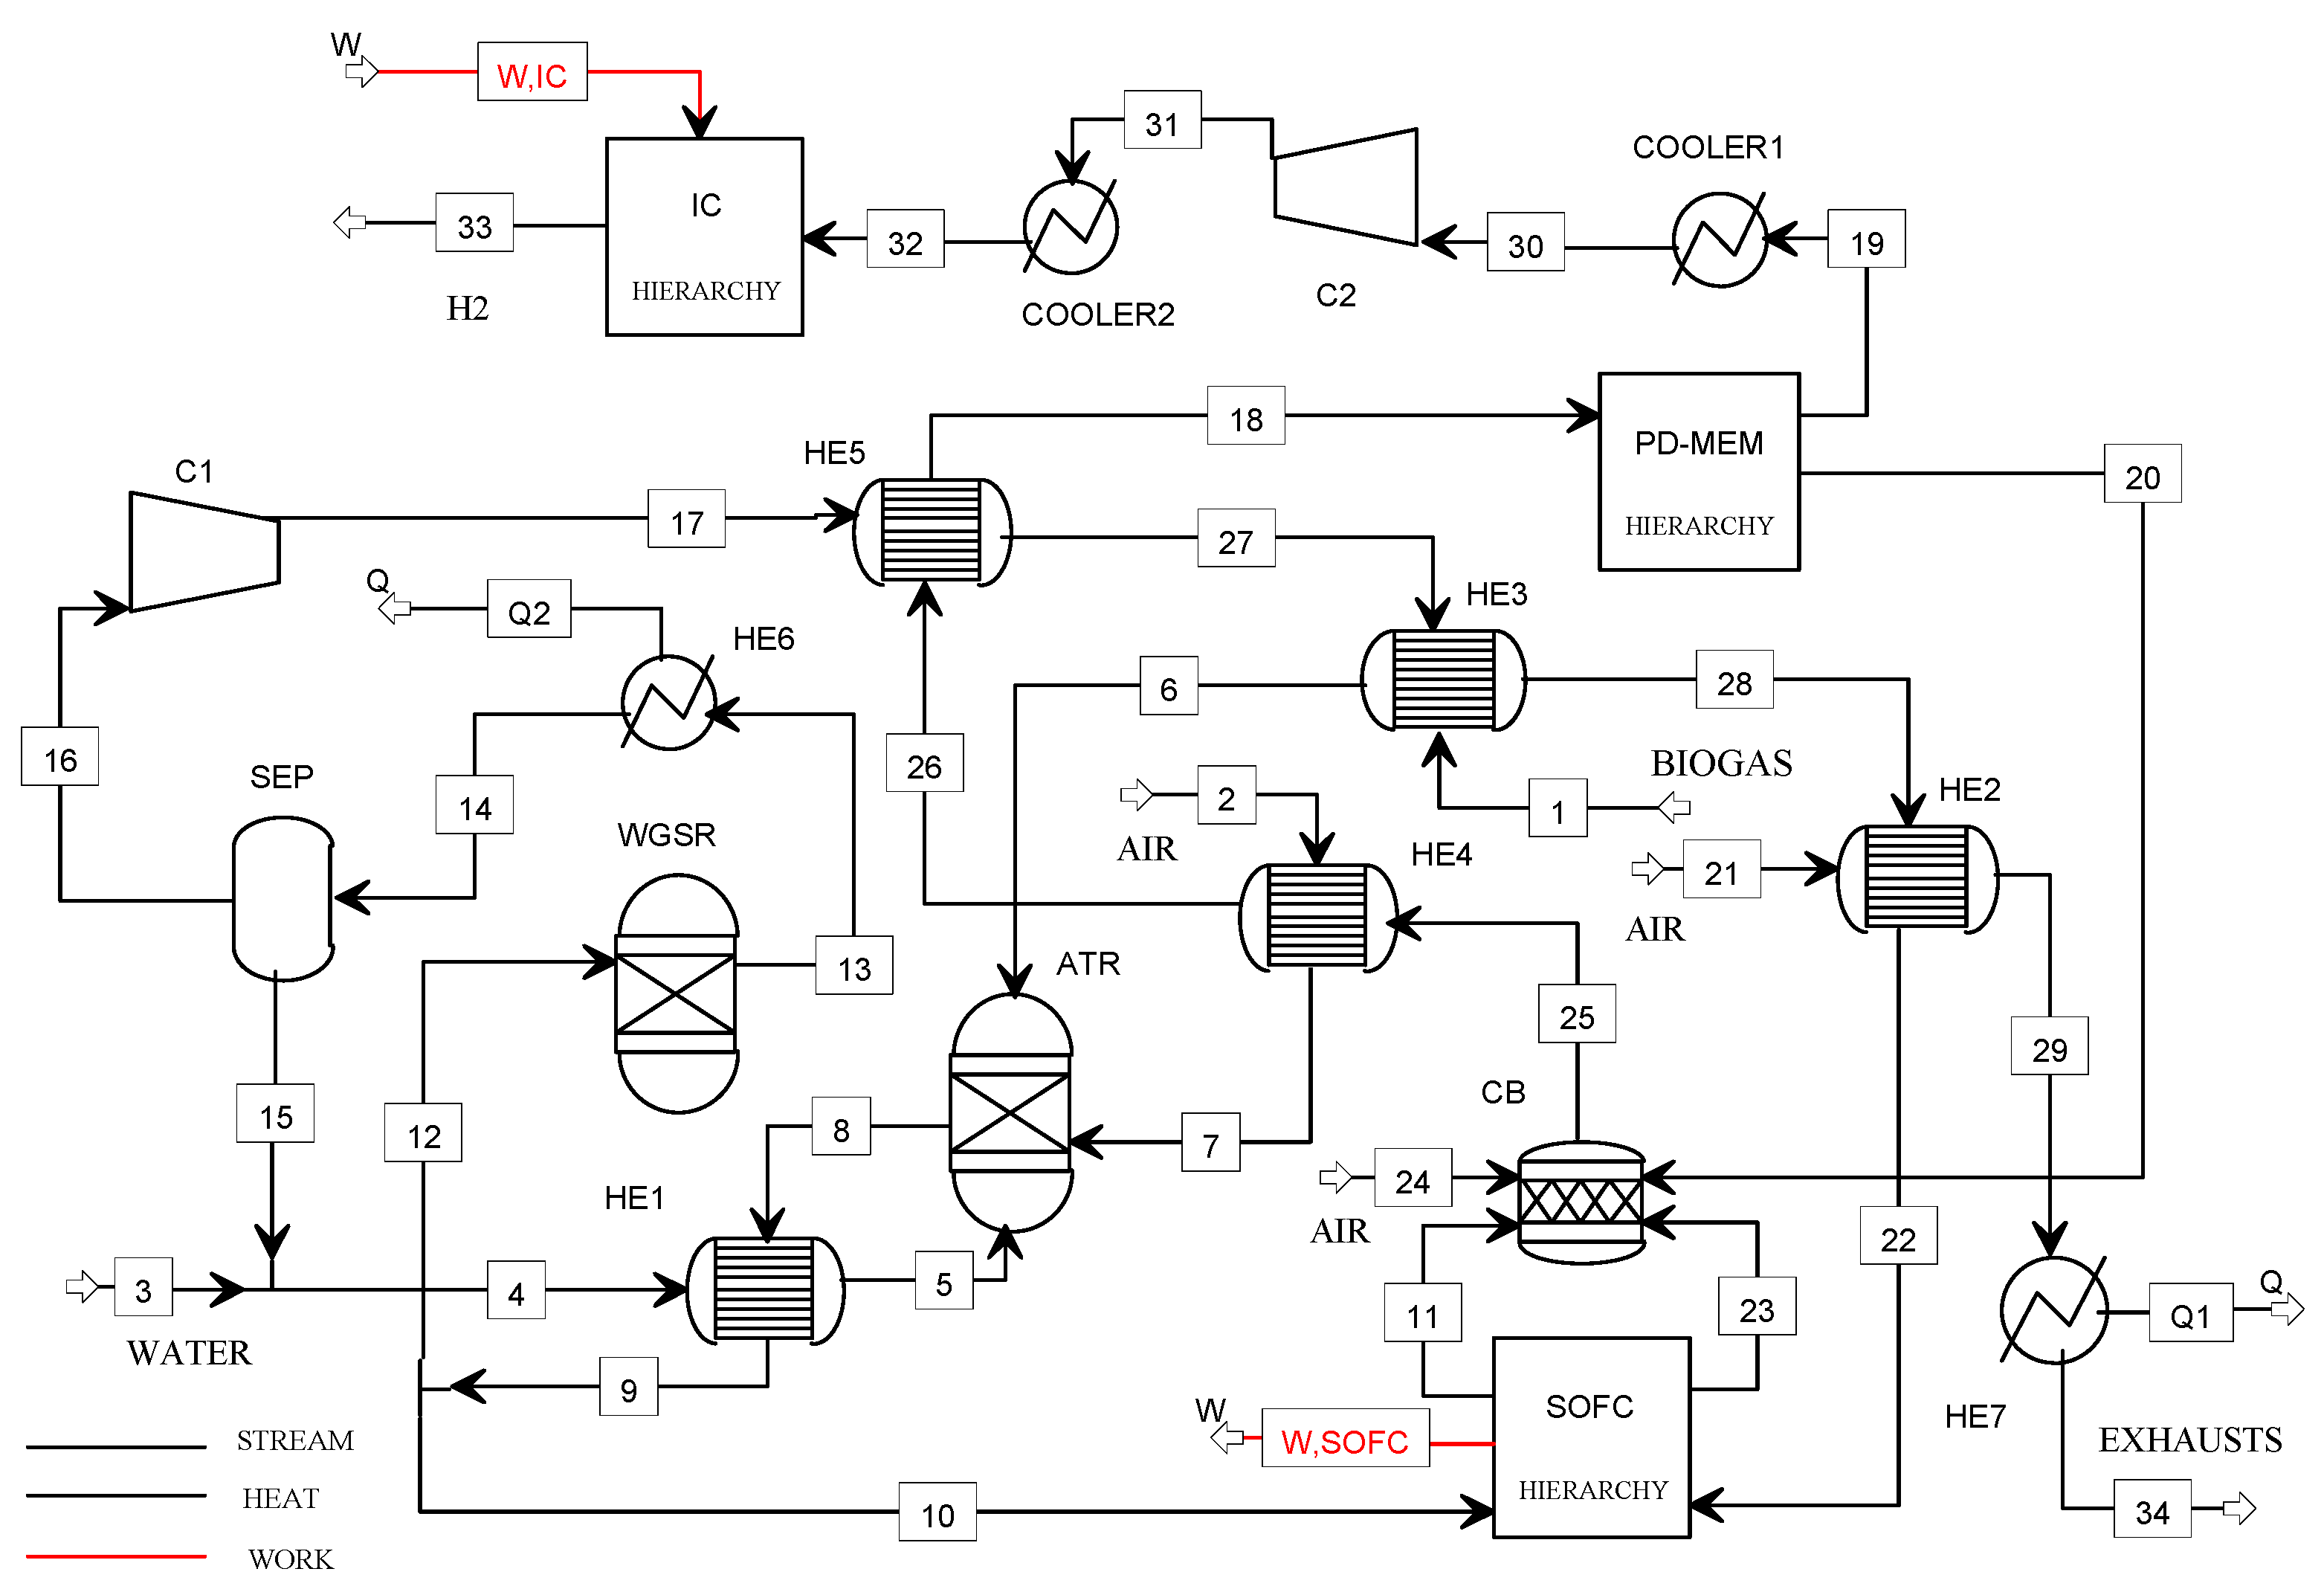
The flowsheet of the B2H_SOFC plant model is illustrated in Figure 4.
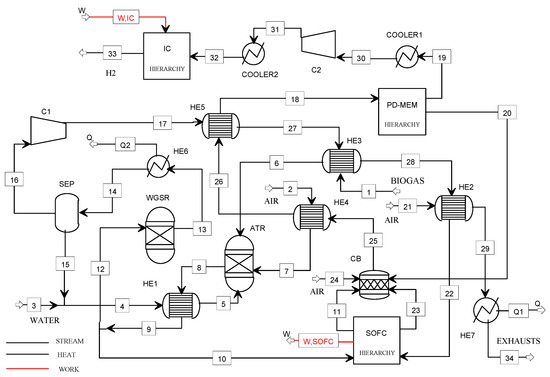
Figure 4.
Flowsheet of the B2H_SOFC plant model.
Biogas, air, and water enter the ATR reactor after heating in the heat exchangers HE2, HE3, and HE1, respectively. For assuring a high hydrocarbon conversion (99%), the reforming temperature has been selected in the range 700–800 °C. Furthermore, considering the literature suggestions for the biogas reforming, the S/B ratio has been chosen equal to 1.2, and the O/B ratio has been calculated for assuring the adiabatic conditions of the reactor following the selected operating temperature [27].
The syngas (8) containing H2, CO, CO2, H2O, and N2, is cooled in the heat exchanger HE1 and then split into two streams: stream (12) is fed to the WGSR (water gas shift reactor) while stream (10) to the SOFC power unit. The air (21), feeding the cathodic compartment of the SOFC, is preheated in the HE2.
The hydrogen-rich gas (13) is cooled in the HE6, dried in the separator (SEP), and compressed in C1 at 8 bar before feeding the membrane separation unit (Pd-M).
The purge gas (20) and the cathodic off-gases (23) are mixed and sent to the CB, while the pure hydrogen (19) is delivered to the compression section. The exhausts from the CB are used to heat several streams in the plant (heat exchangers HE2, HE3, HE4, HE5, HE7) before being vented (34). The pressure of the stream (30) is increased up to 5 bar using the compressor C2 and then stored at 900 bar using the ionic compression unit. The heat streams Q1 and Q2 could be available for cogeneration purposes (in this study, these streams were not exploited).
2.1.4. H2O_PV Plant Design
The H2O_PV plant has been designed by integrating an alkaline electrolysis unit with a grid-connected PV plant. The grid connection allows to yearly balance the PV electricity deficit and excess.
The PV plant has been sized considering two constraints:
- (a)
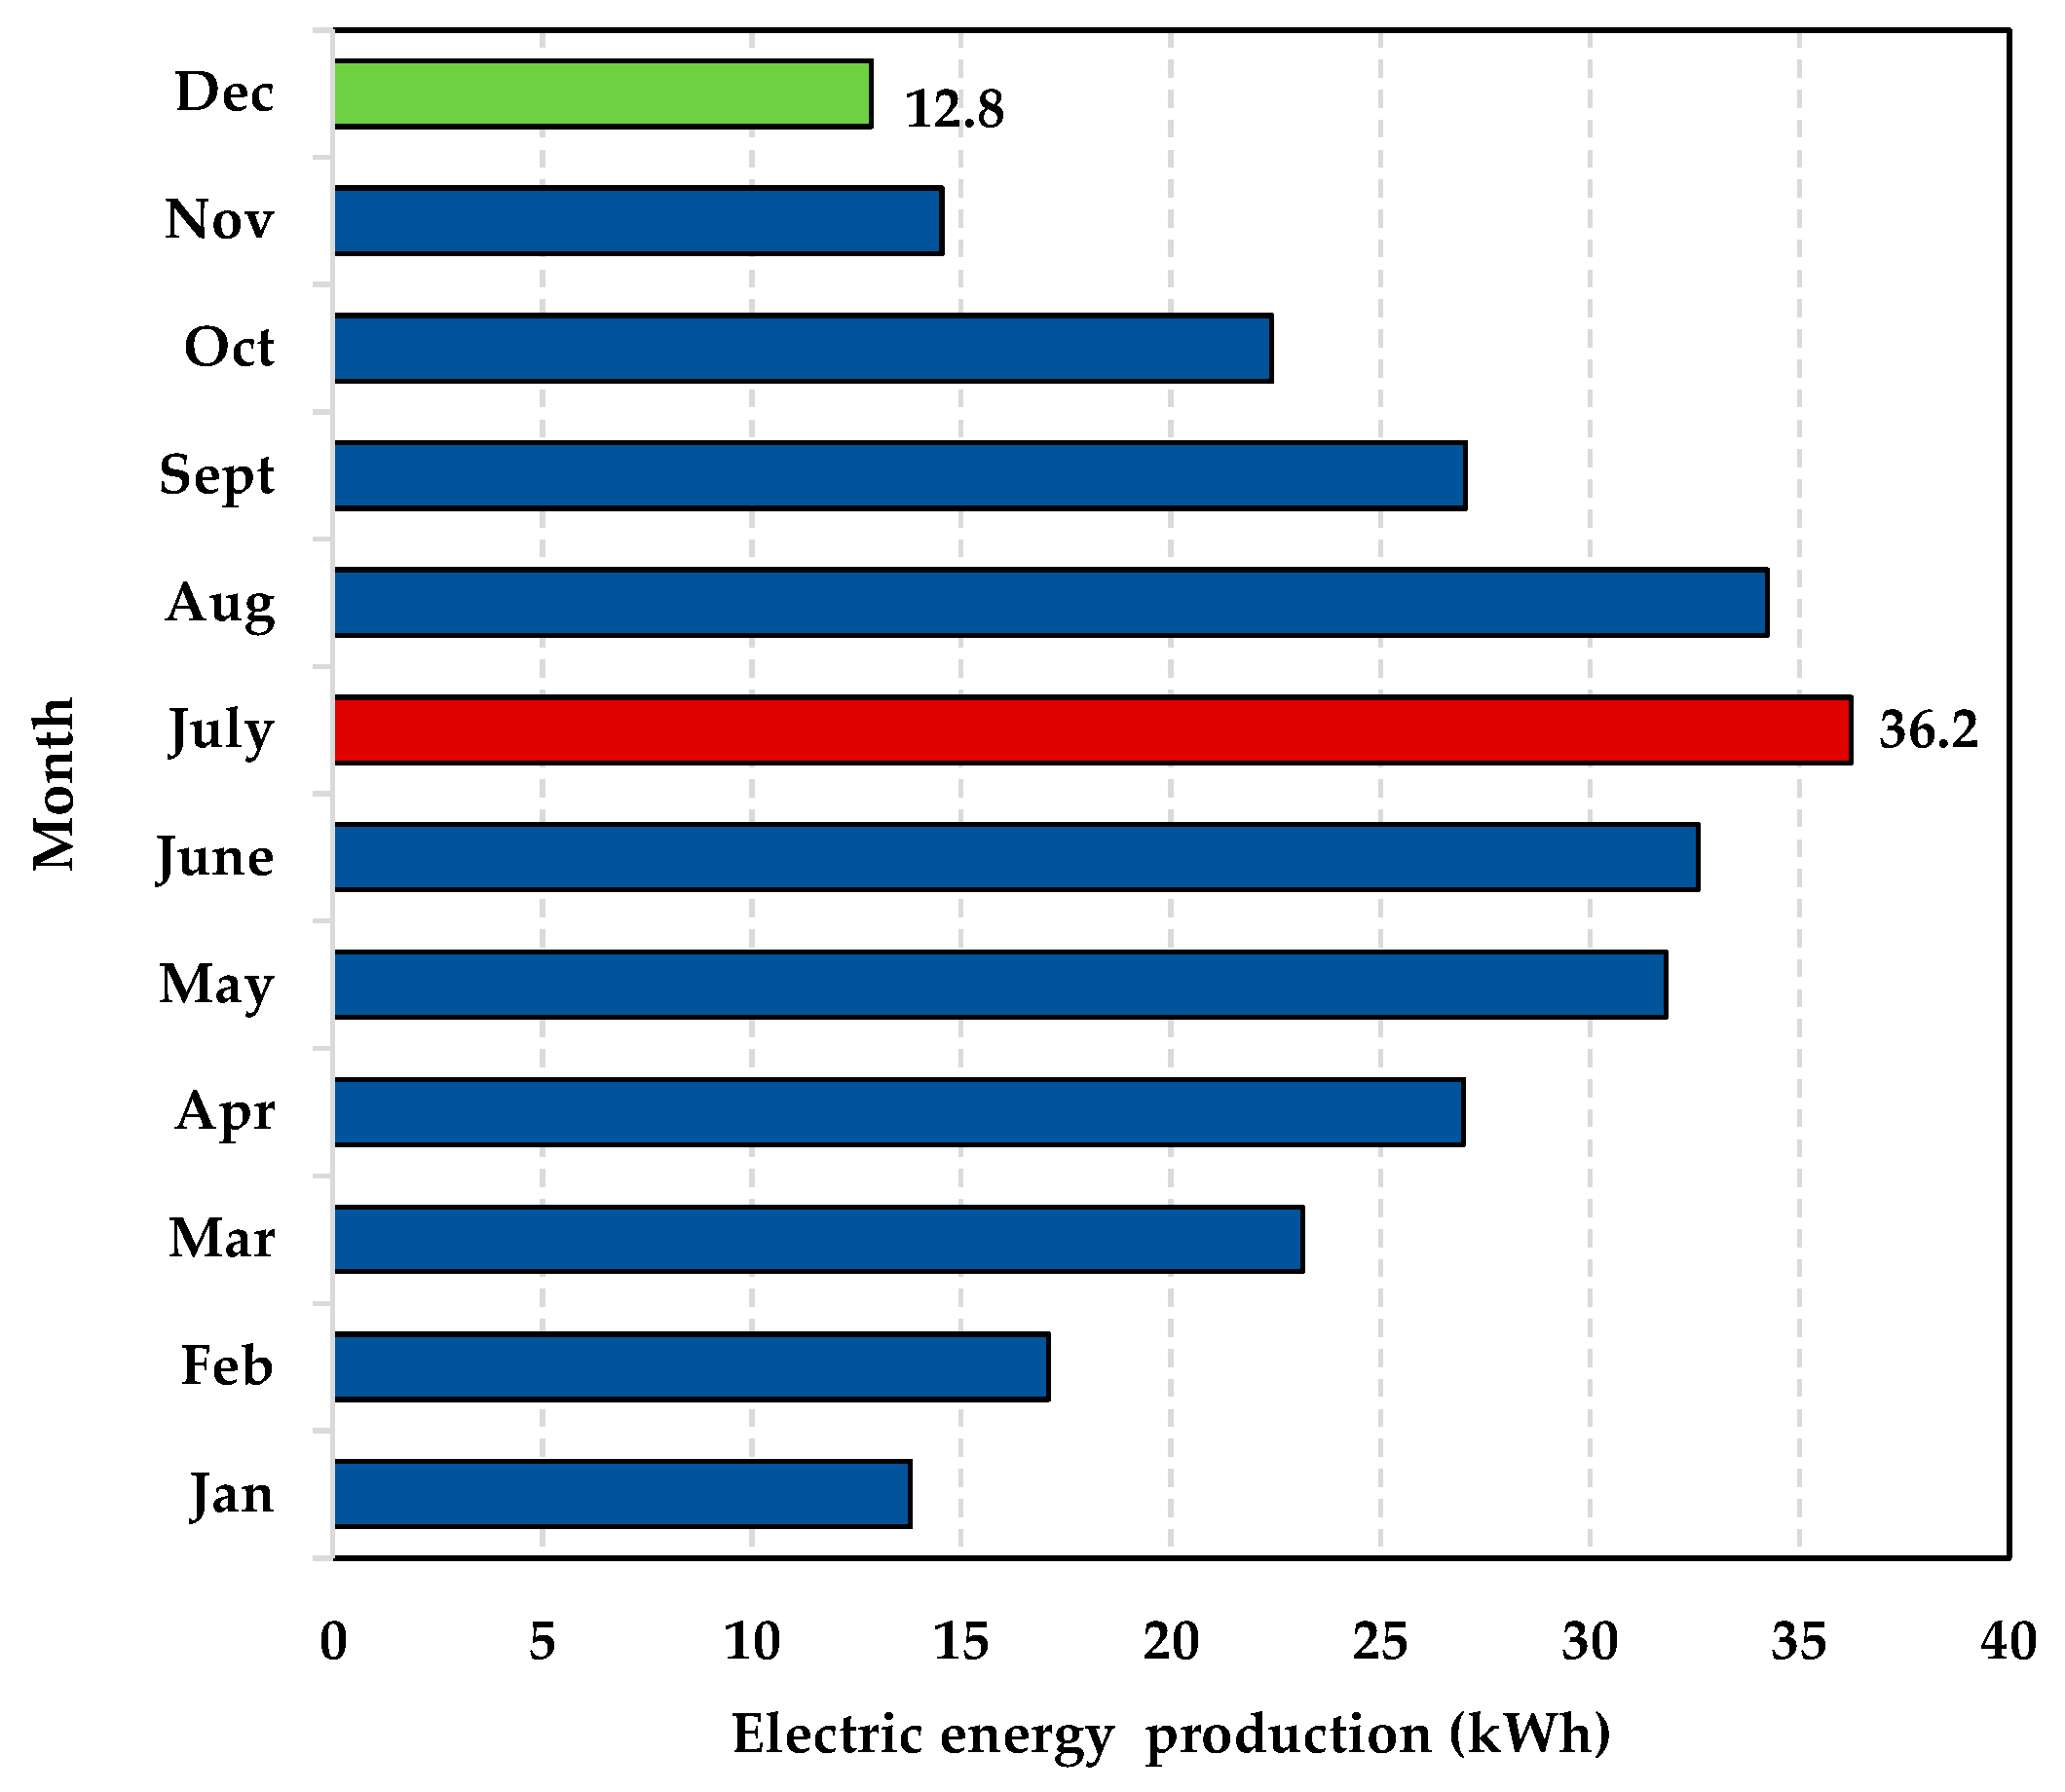
- The installation site: the plant is located in the South of Italy (latitude, longitude, and altitude are 40°51′46″ N, 14°16′36″ E, respectively). At this site, the maximum and minimum monthly irradiation on the horizontal plane are 7770 Wh/m2/day and 1890 Wh/m2/day, respectively; the annual electric energy production of a single PV module (Model 1Soltech 1STH-240-WH, anodized aluminium alloy, 250 kWp), calculated by applying the system advisor model (SAM), is 318 kWh. In Figure 5, the monthly energy production is depicted. The maximum energy production is achieved in July (36.2 kWh), whereas the minimum one in December (12.8 kWh).
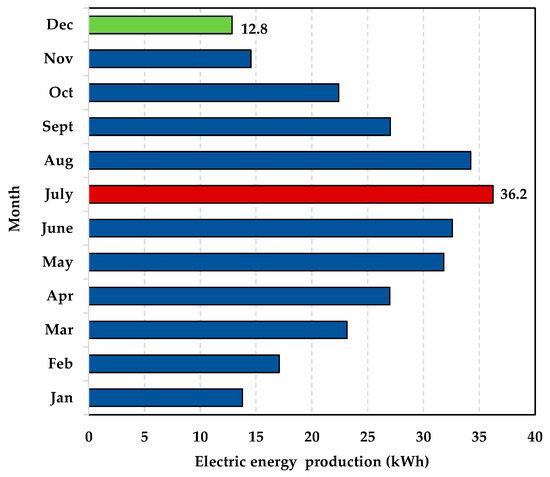 Figure 5. The annual energy production of the single PV module.
 - (b)
- The electricity mix: the annual sharing of electricity supply by the grid has been assumed equal to 50%; this means that the PV plant provides 50% of the annual electricity demand needed for producing 450 kg/day of hydrogen.
The flowsheet of the plant model is illustrated in Figure 6, where two Hierarchy blocks are used to model the electrolysis unit and the ionic compression unit. The electrolysis unit has a modular architecture consisting of 9 modules (the size of each module is 118 kW) and produces 450 kg/day (207 Nm3/h) at the operating pressure of 10 bar by converting 5040 L/day of water in hydrogen and oxygen with an AC power consumption of 5.1 kWh/Nm3. The compressed hydrogen is directly sent to the ionic compression unit, where it is stored at 900 bar.
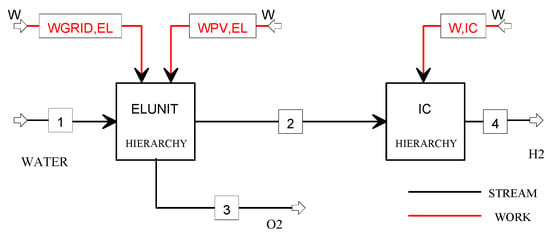
Figure 6.
Flowsheet of the H2O_PV plant model.
2.2. Hydrogen Refuelling Stations: Economic Assessment
To evaluate the competitiveness and profitability of the proposed on-site HRSs, an economic assessment based on the levelized cost of hydrogen (LCOH) and the life cycle cost (LCC) analysis has been carried out.
2.2.1. Levelized Cost of Hydrogen
The LCOH is a valuable economic index that allows defining the final cost at which the hydrogen is produced, compressed, and stored according to the capacity (kg/day) of the HRS. It is calculated as in Equation (2):
The total costs (Equation (3)) include the annualized investment costs (), the annualized replacement costs () and yearly operating costs (:
(Equation (4)) is estimated by evaluating the capital investment cost (), the plant lifetime (n), and the nominal interest rate (i):
(Equation (5)) is the annual cost rate for the replacement of the components needed during the plant lifetime. This term results equal to [28]:
where and t represent the replacement cost and the related year, respectively.
(Equation (3)) includes the annual cost of the hydrogen sources (NH3, biogas, and water) and the costs of purchased electricity (if needed).
Finally, (Equation (2)) is a term that is considered only in the H2O_PV plant where the “electricity excess” from the PV plant is sold.
2.2.2. Life Cycle Cost Analysis
The LCC method is a widely used approach for evaluating and comparing different investment options. In particular, the LCC analysis allows assessing the profitability of the plant over its lifetime [28].
In this analysis, the main economic indicators, such as the net present value (NPV), the internal rate of return (IRR), the profitability index (PI), and the discounted payback time (DPBT), have been calculated.
The net present value (NPV) is calculated in Equation (6) by considering the total value of future cash flow (TVFC) for each year (t) of the plant lifetime and the investment costs:
The TVFC is calculated as in Equation (7):
where (Equation (8)) represents the annual revenues from the sold hydrogen and electricity (in the case of the H2O_PV plant):
In the above Equation (EUR/kg) and (EUR/kWh) are the specific prices of sold hydrogen and electricity, respectively. The and are the annual amounts of the produced hydrogen (kg) and electricity (electricity excess from the H2O_PV plant).
The internal rate of return (IRR), the profitability index (PI), and the discounted payback time (DPBT) are calculated by applying the following Equations (9)–(11):
3. Results and Discussion
This study concerns the techno-economic assessment of on-site HRSs with a hydrogen capacity of 450 kg/day and sized for self-sustaining the thermal and electric energy requirements.
The proposed HRS configurations are based on different hydrogen sources and production technologies. Green ammonia, biogas, and water have been considered as the hydrogen sources, while cracking, autothermal reforming, and alkaline-based electrolysis have been selected as the hydrogen production technologies.
The sizing and the energy analysis of the proposed configurations have been carried out using simulation models. Moreover, the economic feasibility calculation has been performed by applying the life cycle cost (LCC) analysis.
3.1. Hydrogen Refuelling Stations Plants: Energy Results
The developed simulation models, based on thermochemical and electrochemical equations (see Appendix A), have allowed performing mass and energy balances of the proposed HRS configurations.
In Table 1, the sizes and the operational data of each plant section and component used in the proposed four HRS configurations are listed. It can be noticed that the B2H_SOFC plant has the highest electric power consumption and, therefore, the power unit has the largest size (151.6 kW). As a matter of fact, in this case, because the hydrogen content in the syngas is low (39.6 vol%), the operating pressure of the membrane must be higher than in the ones assumed in the ammonia-based configurations (8.0 bar vs. 4.2 and 3.7 bar for NH3_SOFC and NH3_PEMFC, respectively); thus, the size of the compressor C1 is the largest (73 kW vs. 27 kW and 23 kW for the NH3_SOFC and NH3_PEMFC, respectively). The configurations based on the ammonia that use different fuel cell technologies are quite similar in terms of electric power consumption.

Table 1.
Characteristics of the main components for each plant section.
In the H2O_PV configuration, the size of the PV plant is calculated by considering the single module electric energy production (see Figure 5) and by evaluating the annual electric energy required according to the assigned electricity mix and the electrolysis unit electricity consumption. Thus, the PV plant requires several installed kilowatts of panels (16,704) with a peak power of 4.18 MW.
Finally, the hydrogen compression, storage, and distribution section are the same for all the HRS configurations. The size of the ionic compressor is equal to 52.1 kW. In the fuel-based configurations, an additional compression stage (19.1 kW) is required before the ionic compression unit (the hydrogen must be compressed to 5 bar that is the minimum feeding pressure).
In Table 2, the annual overall performances of the proposed HRS configurations are summarized. The operation time is assumed to equal 8000 h, corresponding to plant availability of 91%. For the H2O_PV plant, the annual sharing of electricity supply by the grid is 50% (4463.5 MWh/year). The grid-connected operation compensates for the PV electricity deficit and delivers the PV electricity excess to the grid. Moreover, as previously mentioned, the PV electricity excess is yearly balanced by the PV electricity deficit.
Table 2.
Annual performances of the proposed HRS plants with a hydrogen capacity of 150 t/year.
The two ammonia-based configurations show similar performances in terms of hydrogen production energy efficiency (greater than 71%), whereas the worst value regards the B2H_SOFC configuration (43.8%). This result is due to the high amount of thermal energy (Q1 and Q2 in Figure 4) available from the plant, amounting to 474 kW, exploited neither from an energy point of view nor from an economic point of view.
3.2. Hydrogen Refuelling Stations Plants: Economic Results
The economic feasibility analysis has been performed by estimating the levelized cost of hydrogen (Equations (2)–(5)) and evaluating the main indexes of the LCC analysis (Equations (6)–(11)). The following assumptions have been assumed:
- (i)
- plant lifetime equal to 20 years;
- (ii)
- green ammonia price and biogas price equal to 450 EUR/ton [29] and 0.249 EUR/Nm3 this value is derived from [30] by using a conversion factor USD to EUR of 0.89, respectively;
- (iii)
- water price due to a fixed annual fee equal to 18.12 EUR/year and the variable share equal to 1.006 EUR/m3 [31];
- (iv)
- hydrogen selling price equal to the current value of 10.66 EUR/kg [32];
- (v)
- average purchasing and remuneration electricity prices equal to 119 EUR/MWh and 50 EUR/MWh, respectively [33,34].
Figure 7 shows the annualized investment costs (), the annualized replacement costs (), the yearly operating costs ( and the LCOHs.
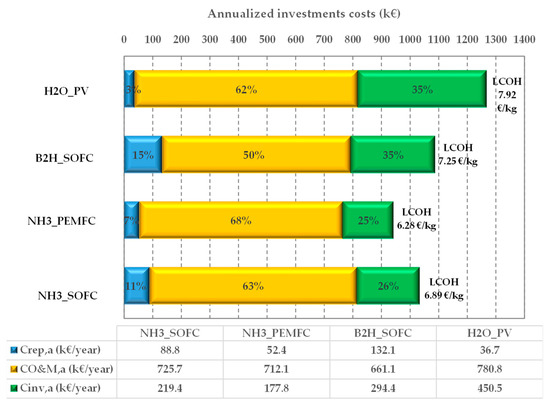
Figure 7.
LCOH and annualized costs incidence for the proposed on-site HRS plants.
It is worth noticing that the LCOH ranges from 6.28 EUR/kg to 7.92 EUR/kg, and the configurations showing the lowest LCOHs are those based on ammonia. In particular, the smaller value (6.28 EUR/kg) is obtained for the NH3_PEMFC configuration (6.89 EUR/kg is the calculated value for the NH3_SOFC plant) because the fuel cell technologies, PEMFC and SOFC, are quite different in terms of investment and replacement costs. The calculated and the are higher for the NH3_SOFC configuration than the NH3_PEMFC configuration (219.4 kEUR/year and 88.8 kEUR/year vs. 177.8 kEUR/year and 52.4 kEUR/year). On the other hand, the values are close together (725.7 kEUR/year vs. 712.1 kEUR/year, for the NH3_SOFC configuration and NH3_PEMFC configuration, respectively).
The B2H_SOFC configuration shows an LCOH (7.29 EUR/kg) close to that of NH3_SOFC, even if the cost distribution is quite different (in this case, the replacement cost is higher (132.1 kEUR/year).
As expected, the H2O_PV configuration is characterized by the highest LCOH (7.92 EUR/kg). This is due to the investment cost (the incidence is 62%) and the operational and maintenance cost (35%) that have the highest values (450.5 kEUR/year and 776.9 kEUR/year). Contrary, this configuration shows the lowest value for the replacement cost (36.7 kEUR/year) because, during the plant lifetime, no replacement of the PV panels is needed.
To understand the influence of each cost item on the CAPEX and OPEX, the percentage distributions for all configurations are reported in Figure 8 and Figure 9, respectively.
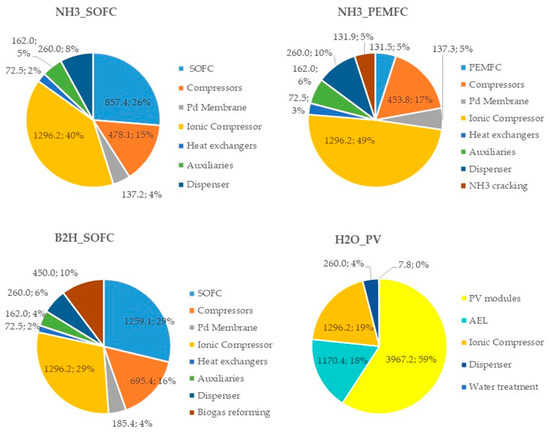
Figure 8.
Costs (kEUR) and incidence (%) of each plant component in the CAPEX for the proposed HRS configurations.

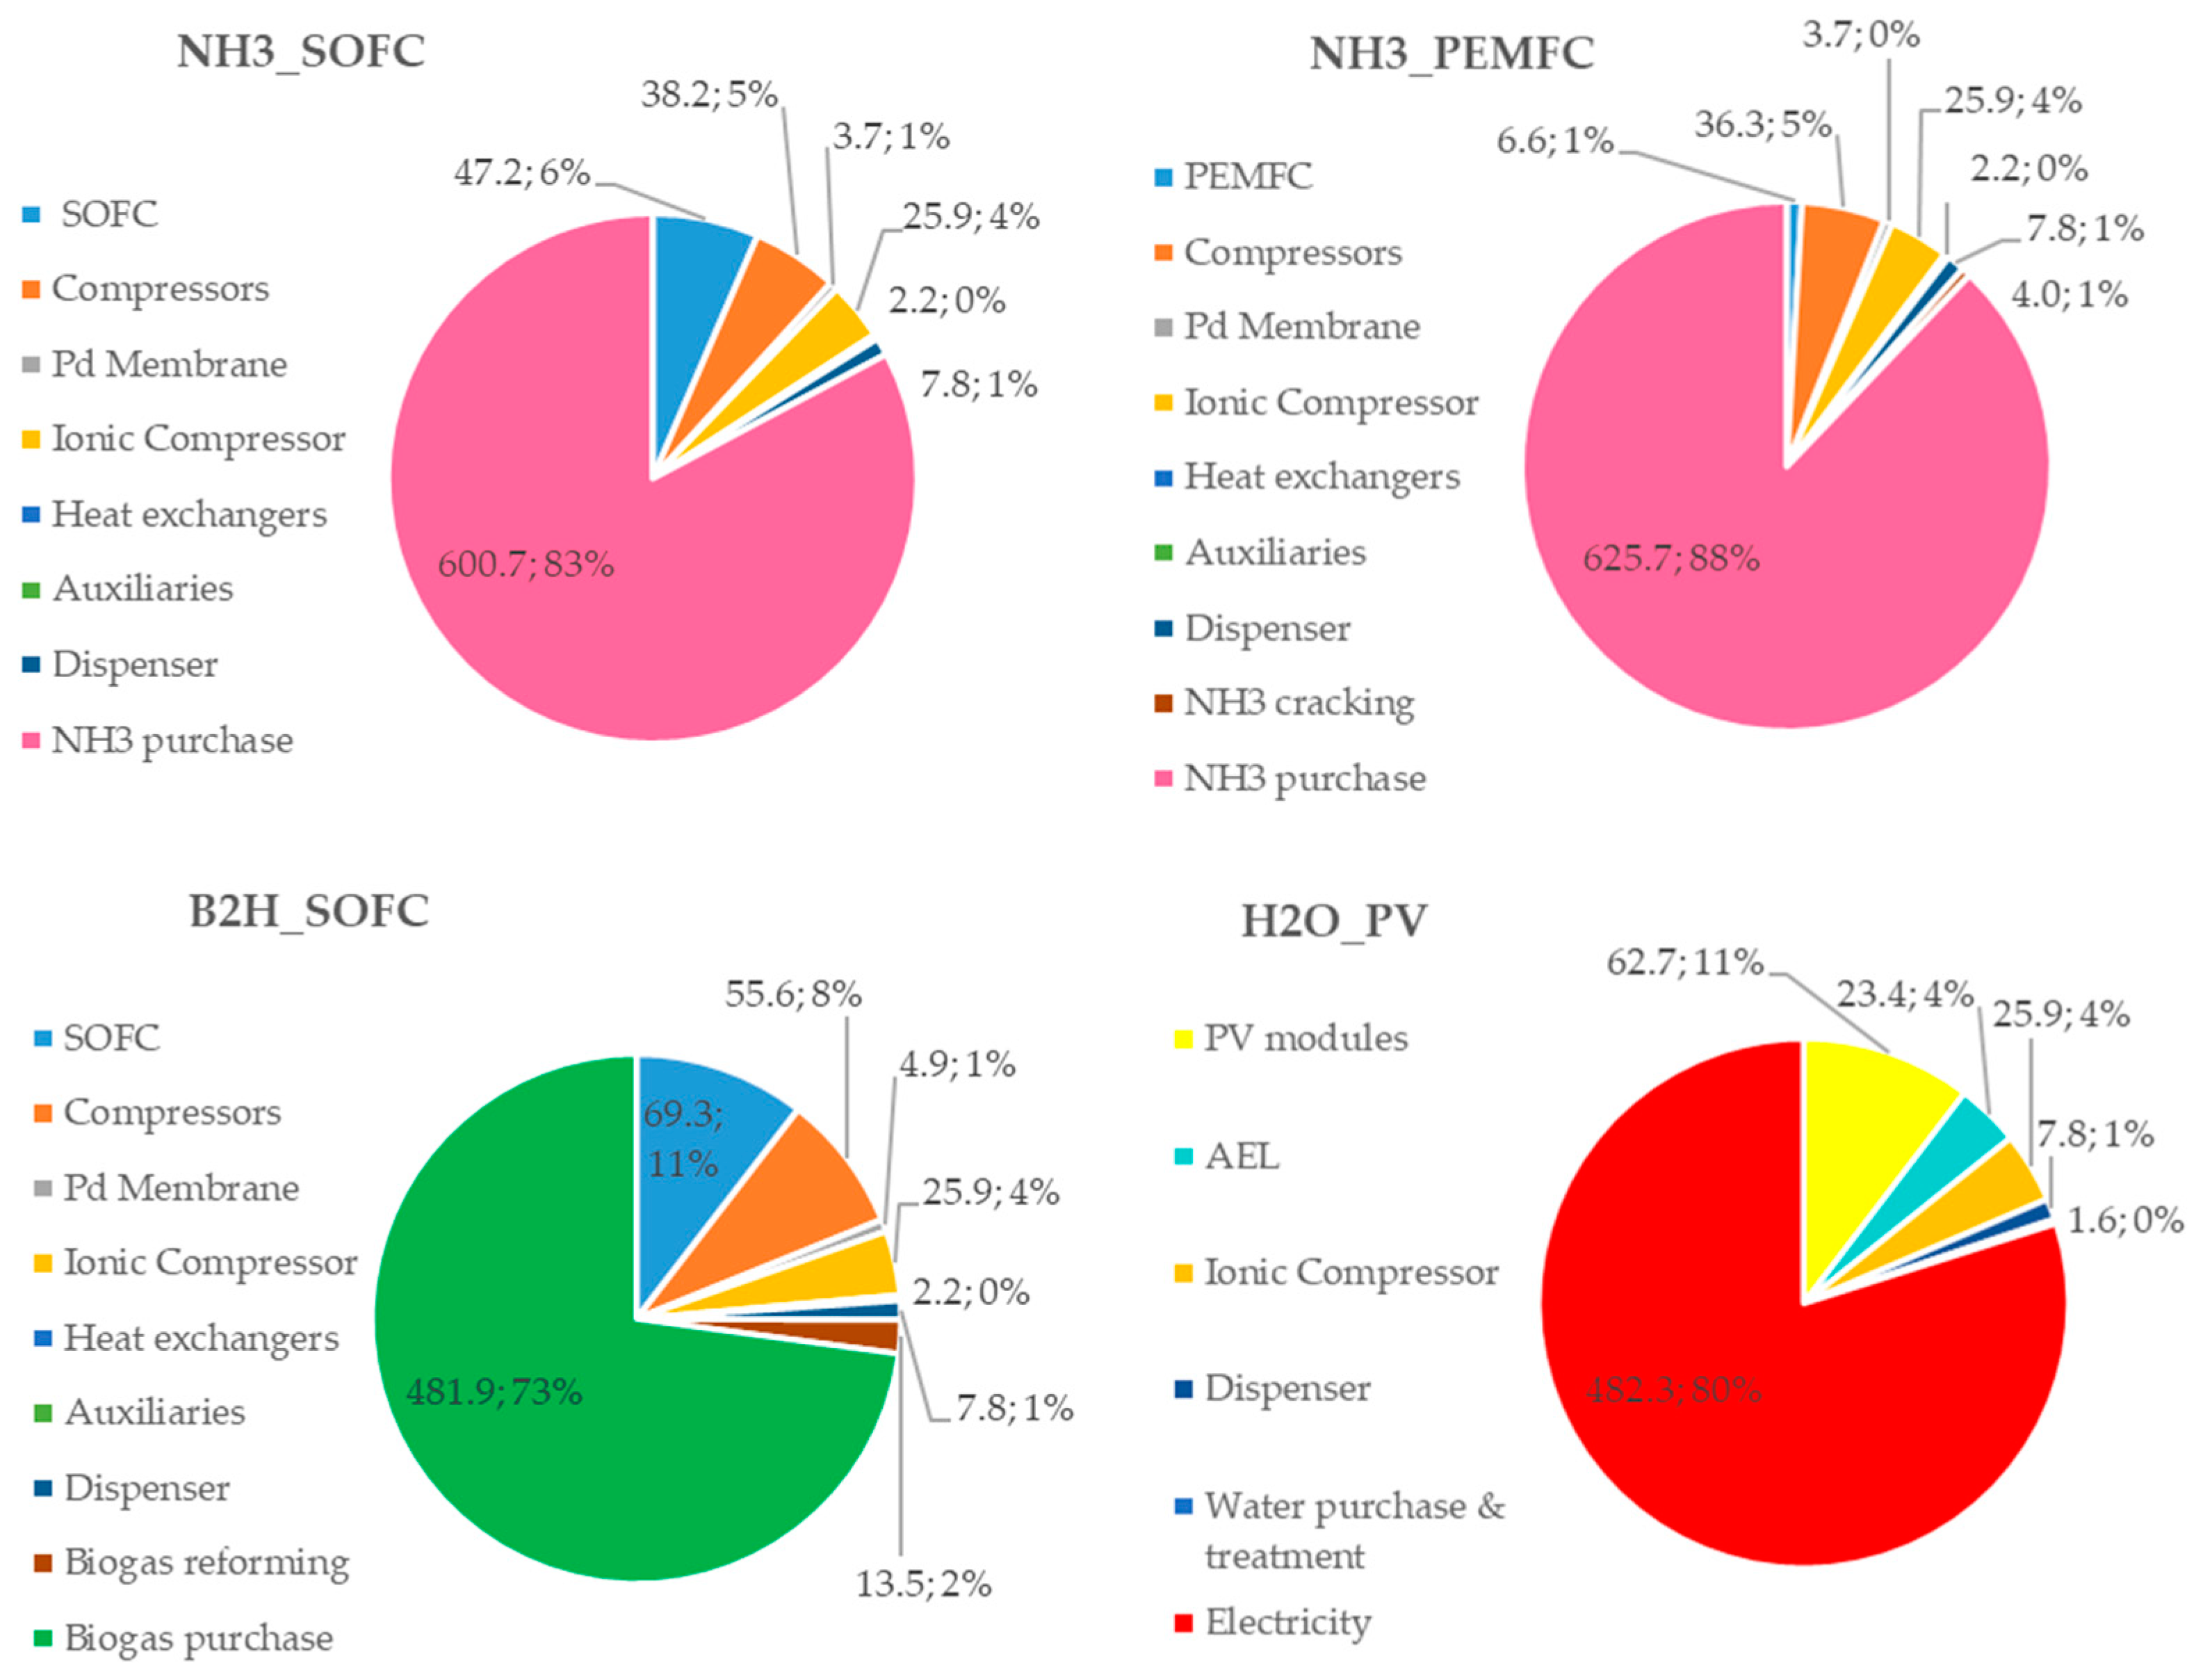
Figure 9.
Costs (kEUR) and incidence (%) of each plant component in the OPEX for the proposed HRS configurations.
Analyzing Figure 8, it can be noticed that the most expensive component in the fuel-based (ammonia and biogas) configurations is the ionic compressor (its cost ranges from 29% to 49% of the total CAPEX), while in the H2O_PV plant, the highest incidence cost is due to the PV modules (59%). With referring to the fuel cell power unit, the capital cost of the SOFC units has a significant impact (26% and 29% in the NH3_SOFC and B2H_SOFC configurations, respectively), whereas, in the NH3_PEMFC configuration, the incidence of the PEMFC unit capital cost is very low (5%).
Referring to Figure 9, the main contribution on the OPEX is due to the hydrogen sources (ammonia and biogas) in the fuel-based configurations (83%, 88% and 73% for NH3_SOFC, NH3_PEMFC and B2H_SOFC, respectively), whereas, in the H2O_PV plant configuration, the cost of the purchased electricity (the PV is sized to supply the 50% of the electric energy needed for the HRS operations) has the largest weight (80%).
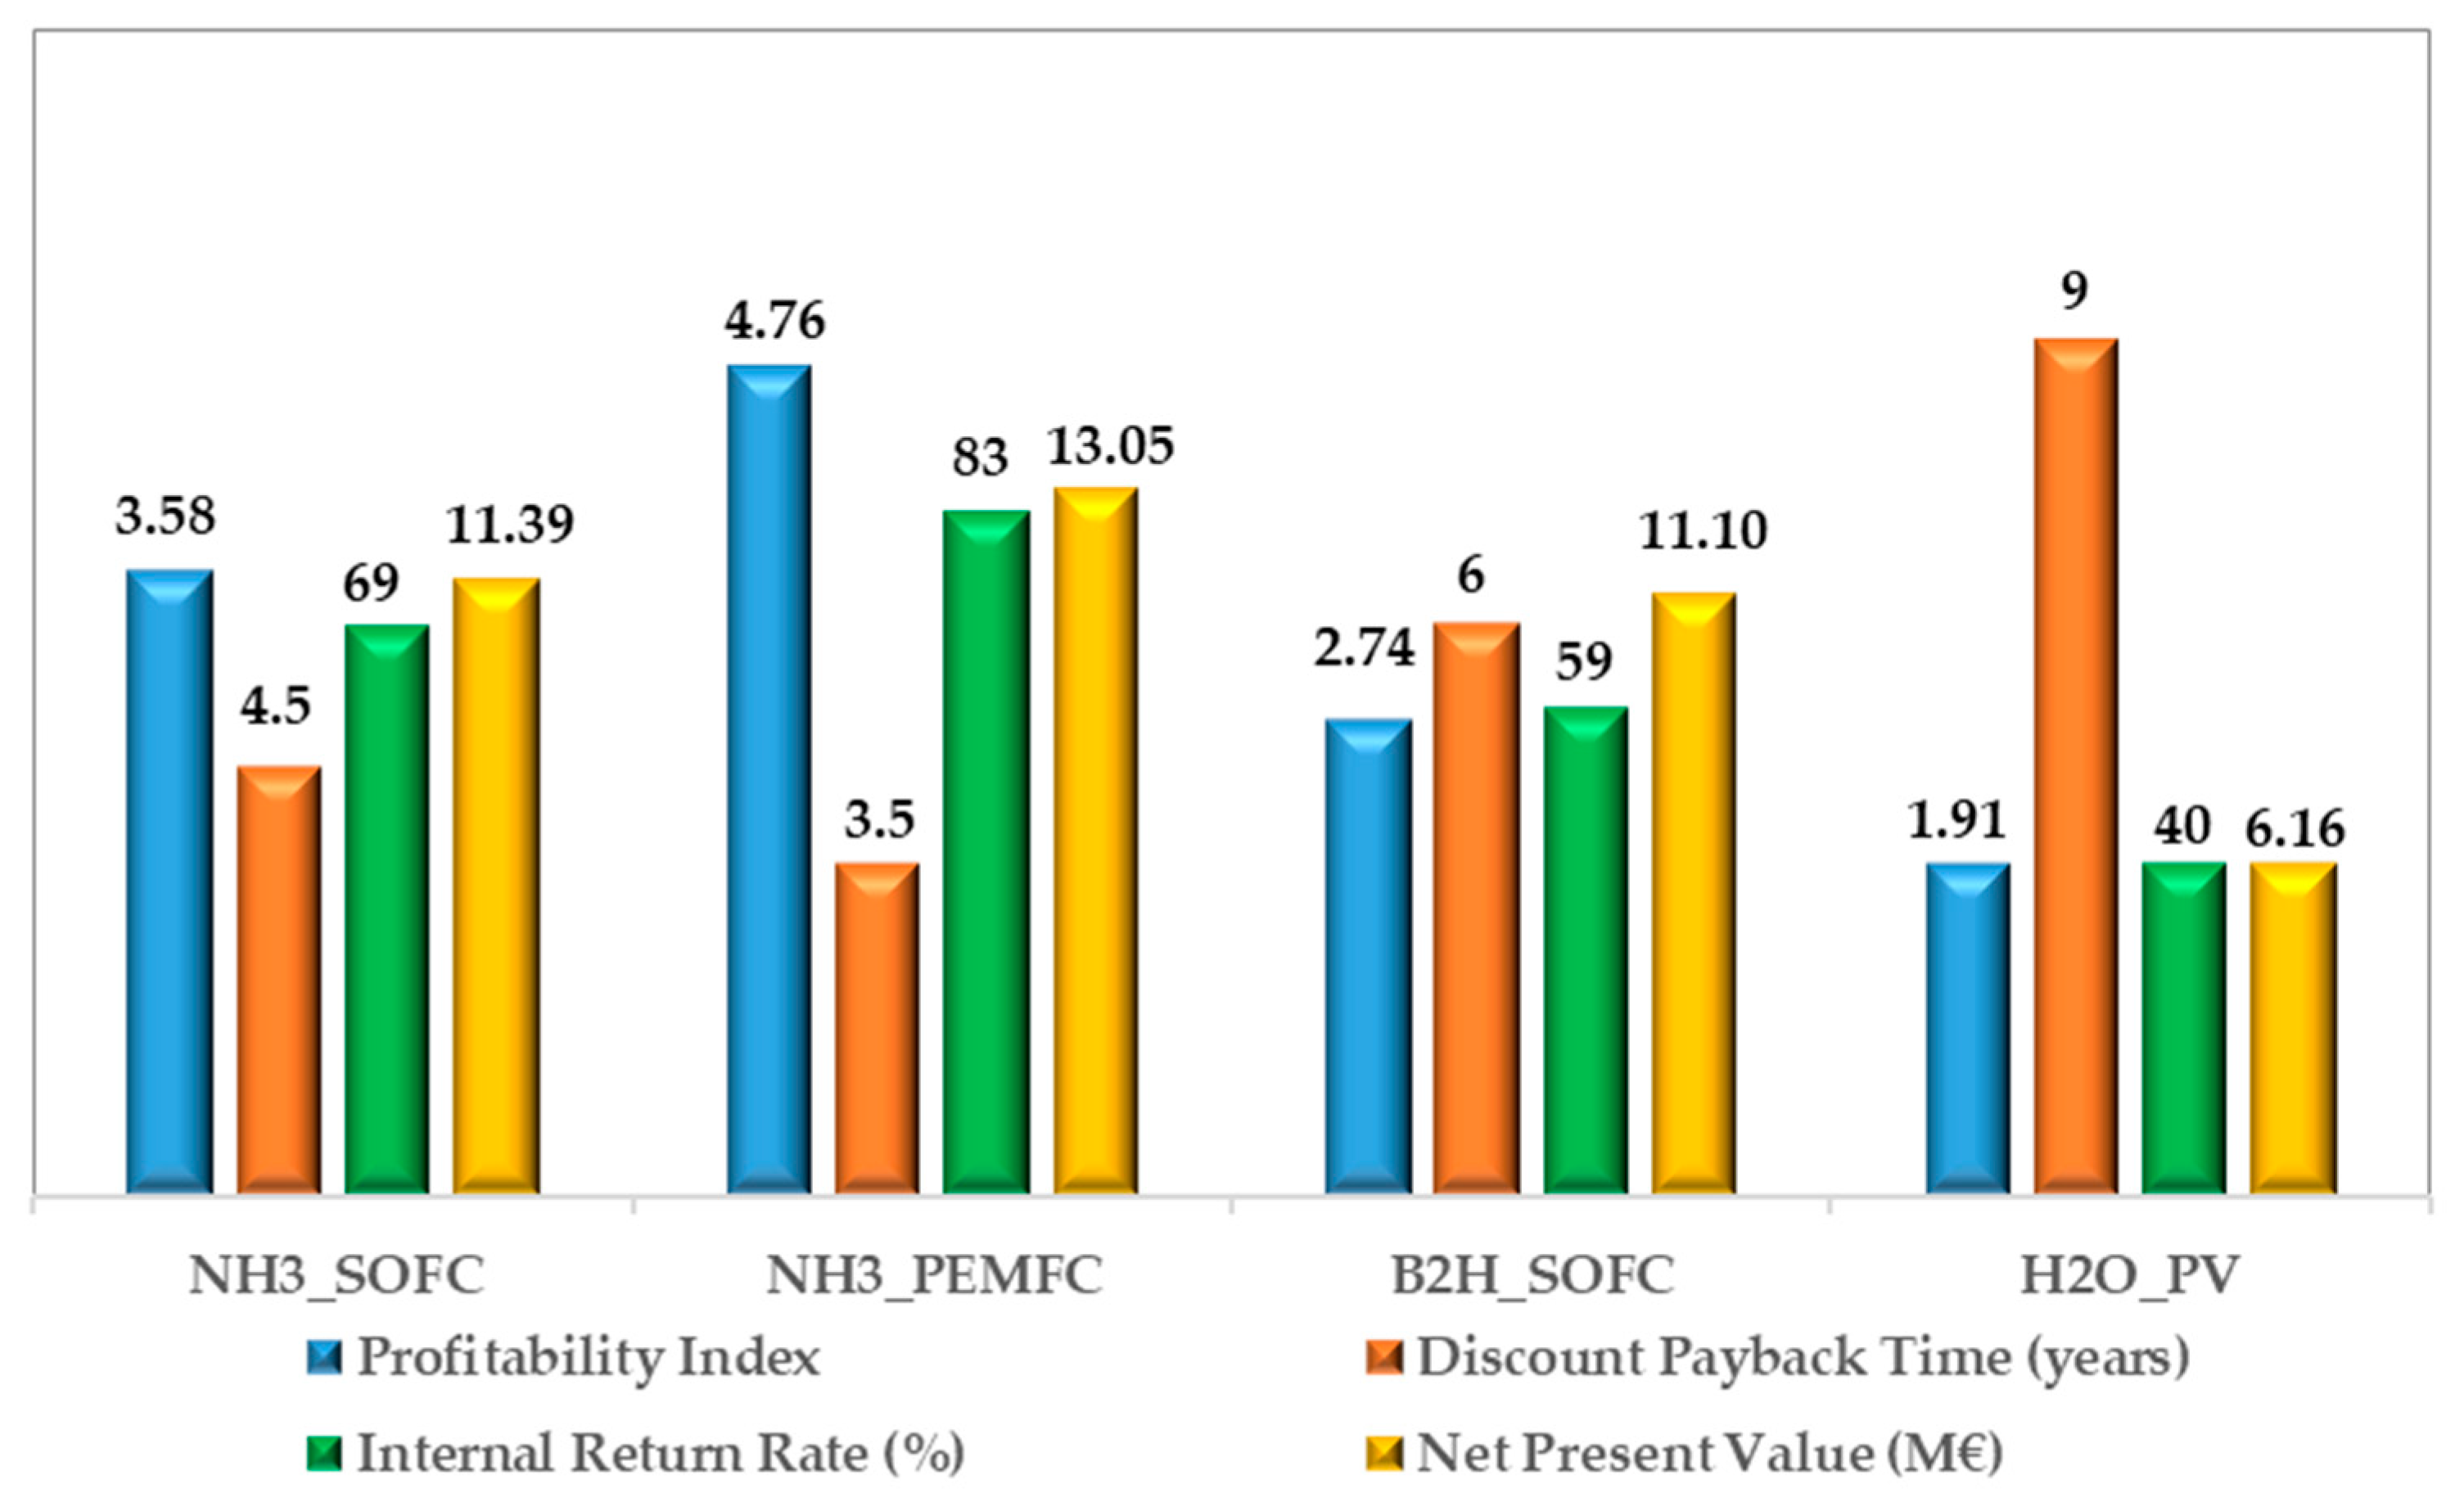
Finally, the economic indexes of the LCC analysis have been reported in Figure 10.
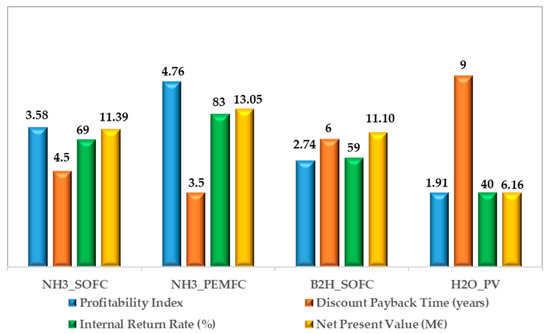
Figure 10.
Economic indexes of the LCC analysis for each analyzed plant configuration.
It is worth noticing that the profitability index is greater than 1.0, demonstrating a high investment’s attractiveness for each configuration. In particular, the NH3_PEMFC based configuration shows the best performance, reaching a value of 4.76, whereas the H2O_PV plant has the smallest value due to the highest and the (Figure 7). From the Discounted Pay Back Time perspective, the fuel-based configurations show remarkable results, with values less than seven years (the DPBT ranges from 4.5 to 6). The NH3_PEMFC based configuration is the best solution, demonstrating that it can return on the initial investment after only three-and-a-half years. The internal rate of return reaches high values in all the investigated solutions, ranging from 40 to 83%.
4. Literature Comparison
The obtained results have been compared with those available in the scientific literature concerning the LCOH for small on-site hydrogen refuelling stations. The comparison, illustrated in Table 3, has been performed considering different hydrogen production capacities, different hydrogen sources, and different adopted technologies.
Table 3.
Comparison of results with literature data.
It is worth noticing that the LCOH for the water electrolysis-based plants ranges from 5.64 to 15.7 EUR/kg according to the different employed hydrogen production technologies. The LCOH value (7.92 EUR/kg) calculated in this work is in good accordance with these data.
Regarding the hydrogen production from ammonia, the LCOHs estimated in this study (6.28 EUR/kg and 6.89 EUR/kg) are lower than that found in [19] (8.06 EUR/kg). In the case of biogas as a hydrogen source, the proposed plant configuration allows having an optimal LCOH value in comparison with the ones found in [20], where the dispensing unit is not accounted for. Finally, by comparing the obtained results with the authors’ previous papers, it is demonstrated that lower values of LCOH for each analyzed configuration are reached, thanks to the increasing plant capacity and the updating of the components’ costs.
5. Conclusions
In this work, a techno-economic assessment of on-site small hydrogen refuelling stations (450 kg/day of H2) based on different hydrogen sources (biogas, ammonia, and water) and power production technologies (autothermal reforming, cracking, and electrolysis) has been performed. The electric energy demands of the HRSs are satisfied by using the fuel cell technology (PEMFC and SOFC) and the PV grid-connected power plant. The energy and mass balances of the plants have been carried out using numerical models developed in the Aspen Plus environment. Each plant model has been built using existing operation blocks (available in the library). Specific components (i.e., SOFC and PEMFC power modules, Pd-membrane unit ionic compressor unit) have been modelled using Hierarchy blocks and implementing specific Fortran block calculators. The technical analysis results have highlighted that the B2H_SOFC plant has the highest electric power consumption and, therefore, the power unit has the highest size (151.6 kW). The two configurations based on the ammonia are quite similar in terms of electric power consumptions (103.3 kW and 98.9 kW for the NH3_SOFC and NH3_PEMFC, respectively). The H2O_PV plant requires several installed kilowatts of panels (4176 kW) because the electricity is required to produce hydrogen using the electrolysis process.
Regarding hydrogen production energy efficiency, the two ammonia-based configurations show similar performances (greater than 71%), whereas the worst value regards the B2H_SOFC configuration (43.8%). The economic feasibility has been performed by calculating the LCOH and applying the life cycle cost (LCC) analysis. Results have pointed out that the LCOH ranges from 6.28 EUR/kg to 7.92 EUR/kg, and the configurations showing the lowest LCOHs are those based on ammonia. In particular, the smaller value (6.28 EUR/kg) is obtained for the NH3_PEMFC configuration (6.89 EUR/kg is the calculated value for the NH3_SOFC plant) because the fuel cell technologies, PEMFC and SOFC, are quite different in terms of investment and replacement costs. Finally, the economic indexes of the LCC analysis have been estimated. The calculated profitability indexes are greater than 1.0, demonstrating a high investment’s attractiveness for each configuration. The best performance is achieved by the NH3_PEMFC based configuration (4.76), whereas the H2O_PV plant has the smallest value (1.92). From the discounted payback time point of view, the fuel-based configurations are characterized by the most remarkable results, with values that range from 4.5 to 6. The internal rate of return has high values, ranging from 40 to 83% for the investigated solutions.
In conclusion, by comparing the obtained results with the authors’ previous papers, it is demonstrated that lower values of LCOH for each analyzed configuration are reached, thanks to the increase in the plant capacity and the updating of the components’ costs.
Author Contributions
Conceptualization, A.P., M.M., S.D.M. and E.J.; investigation, A.P., M.M., S.D.M. and E.J.; methodology, A.P., M.M., S.D.M. and E.J.; writing—original draft preparation, A.P., M.M., S.D.M. and E.J. All authors have read and agreed to the published version of the manuscript.
Funding
This research received no external funding.
Institutional Review Board Statement
Not applicable.
Informed Consent Statement
Not applicable.
Data Availability Statement
MDPI Research Data Policies.
Conflicts of Interest
The authors declare no conflict of interest.
Appendix A
The models of the plant configurations have been developed in the Aspen Plus™ environment by following a modular architecture in which each submodel is conceived as a plant section that interacts with components using mass and energy fluxes.
Thermochemical reactors are simulated by assuming the chemical equilibrium solved by minimising the Gibbs energy method. The thermodynamic equilibrium approach is one of the most common strategies used to investigate thermo-chemical catalytic processes (reforming, gasification) because of the lack of kinetic data for the occurring reactions. The obtained results in fuel conversion were in very good agreement with experimental data available in the literature [35,36].
Table A1 summarizes the main characteristics of the unit operator blocks used for simulating each component of the proposed plant configurations.
Table A1.
Details on the unit operation blocks used for modelling the components of the plants.
Table A1.
Details on the unit operation blocks used for modelling the components of the plants.
| Plant Components | Submodel Description |
|---|---|
| Reforming reactor (ATR) Water Gas Shift reactor (WGSR) Cracking reactor  | These chemical rectors use the RGibbs unit operation block, where the chemical equilibrium is solved by a non stoichiometric approach based on the minimization of the Gibbs energy. In the ATR reactor dry reforming (due to the presence of CO2 in the biogas), steam reforming and partial oxidation processes are combined, and the thermal balance between the endothermic and exothermic reactions is satisfied by adequately selecting the steam to biogas ratio (S/B) and the oxygen to biogas ratio (O/B). The water-gas shift reactor allows increasing the amount of hydrogen in the syngas using the reaction between CO and H2O. In this component, the CH4, eventually present in the inlet stream, is assumed as inert. In the cracking reactor, the ammonia is decomposed into hydrogen and nitrogen. The assumed conversion is 99.7%, as in [36]. |
Heat exchangers (HXs) | The heat exchanger HeatX can model various shell and tube heat exchanger types. The equations are: |
Compressor © | The compression power is estimated through pressure changers operation blocks by fixing the discharge pressure or the pressure ratio and assigning the isentropic or polytropic efficiency. The compression power is calculated as:
|
Catalytic burner | The catalytic burner is simulated through the RStoic reactor in which the stoichiometry of the reactions set is assigned. The considered combustion reactions regard the CO, CH4, and H2:
|
Cooler | The cooler is simulated using a heater block, where the input parameter can be the final temperature or the exchanged thermal power. The thermal power available is estimated as: |
The SOFC unit, the PEMFC unit, the Electrolyzer unit, the Pd-Membrane, and the ionic compressor cannot be modelled using the software library; therefore, specific user-defined blocks have been built, and Fortran calculator blocks have been implemented to estimate their performances. The descriptions of these blocks are presented in Table A2.
Table A2.
Details on the Hierarchy blocks.
Table A2.
Details on the Hierarchy blocks.
SOFC unit (SOFC) | The SOFC unit is modelled using a detail developed in [37]. The model can estimate cell performances under various operating conditions. The thermochemical reactions like reforming and shifting that can occur in the anodic compartment as well as the electrochemical reactions are solved utilizing library components (RStoich and RGibbs for the anodic compartment, Sep for the cathodic compartment, and thermal mixer and splitter for heat balancing), and calculator blocks where the fuel cell governing equations are considered (i.e., overpotentials, Nernst equation and Faraday’s law). The stack voltage results: The stack electric power is: |
PEMFC unit (PEM) | The PEMFC unit is modelled using the Equation suggested by Kim et al. [38]:
|
Electrolyzer unit (ELUNIT) | This component is modelled by integrating an RStoich reactor (for the water decomposition), a SEP component, mixers, and splitters for accounting for the water utilization factor [39]. Moreover, a calculator block has been used for assessing the cell voltage [39]:
|
Pd-Membrane (Pd-M) | The simulation model consists of a separator block and a Fortran calculator block (for implementing the governing equations), as detailed in [40]. The molar flow rate of the permeated hydrogen (mol/s) is: |
Ionic Compressor (IC) | The model of ionic compressor has been developed, taking into account its operations close to the isothermal conditions. For this reason, five adiabatic compression stages with intermediate cooling (heat exchangers are used) have been considered as widely detailed in [41]. The stage compression power is:
The total power consumption is: |
Appendix B
Cost Data Assumption
The cost of each component has been defined taking into account the values suggested by the technical literature. The first part of the dataset defines the capital expenditure (CAPEX), which includes the capital investment for each plant’s component. Afterwards, the operating and maintenance expenditure (OPEX) have been defined as a proper percentage of the initial investment cost of each component. Finally, the Replacement Expenditure (REPLEX) has been considered for the components which wear out during the plant lifetime. Table A3 summarizes the costs selected from the recent literature. Table A4 lists the total CAPEX, the OPEX and the REPLEX for each studied plant configuration.
Table A3.
Costs of the components used in the proposed configurations.
Table A3.
Costs of the components used in the proposed configurations.
| Component | Ref. | Investment Cost | O&M Cost * |
|---|---|---|---|
| Specific value | Specific value | ||
| SOFC | [42] | 8300 (EUR/kW) | 5.5% |
| PEMFC | [42] | 1330 (EUR/kW) | 5% |
| PV module | [43] | 950 (EUR/kW) | 1.6% |
| Electrolyzer | [44] | 1100 (EUR/kW) | 2% |
| Cracker Unit | [21] | 132 (kEUR) | 3% |
| ATR | [11] | 450 (kEUR) | 4% |
| Compressor | [45] | ** (EUR) | 8% |
| Pd-Membrane | [11] | 7991 (EUR/m2) | 2.7% |
| Ionic Compressor (incl.storage&refrigerator) | [46] | 648.1 (kEUR) | 2% |
| Water system (incl.pumping&purification) | [47] | 7.8 (kEUR) | 3% |
| Dispenser | [48] | 65 (kEUR) | 3% |
| Heat Exchanger | [10] | 14.5 (kEUR) | |
| Auxiliaries | [11] | 162 (kEUR) | - |
| NH3 cost | [29] | - | 450 (EUR/ton) |
| Biogas | [30] | - | 42.2 (EUR/MWh) |
| Water | [31] | - | 1.006 (EUR/m3) |
| Electricity | [33] | - | 119 (EUR/MWh) |
* It is calculated as the proper percentage of each component initial investment cost. ** W is the compressor size (kW).
Table A4.
Total CAPEX, OPEX and REPLEX for each proposed plant configuration.
Table A4.
Total CAPEX, OPEX and REPLEX for each proposed plant configuration.
| Configuration | NH3_SOFC | NH3_PEMFC | B2H_SOFC | H2O_PV |
|---|---|---|---|---|
| CAPEX (kEUR) | ||||
| SOFC | 857.4 | - | 1259.1 | - |
| PEMFC | - | 131.5 | - | - |
| PV module | - | - | - | 3967.2 |
| Electrolyzer | - | - | - | 1170.4 |
| Cracker Unit | - | 132.1 | - | - |
| ATR | - | - | 450.0 | - |
| Compressor C1 | 263.9 | 239.6 | 481.2 | - |
| Compressor C2 | 214.2 | 214.2 | 214.2 | - |
| Pd-Membrane | 137.2 | 137.2 | 185.4 | - |
| Ionic Compressor (incl.storage & refrigerator) | 1296.2 | 1296.2 | 1296.2 | 1296.2 |
| Water system (incl.pumping & purification) | - | - | - | 7.8 |
| Dispenser | 260.0 | 260.0 | 260.0 | 260.0 |
| Heat Exchanger | 72.5 | 72.5 | 72.5 | - |
| Auxiliaries | 162.0 | 162.0 | 162.0 | - |
| Total | 3263.4 | 2645.3 | 4380.6 | 6701.6 |
| OPEX (kEUR) | ||||
| Fuel | 600.7 | 625.7 | 481.8 | 659.4 |
| Water | - | - | - | 1.5 |
| SOFC | 47.2 | - | 69.3 | - |
| PEMFC | - | 6.6 | - | - |
| PV module | - | - | - | 62.7 |
| Electrolyzer | - | - | - | 23.4 |
| Cracker Unit | - | 3.9 | - | - |
| ATR | - | - | 13.6 | - |
| Compressor C1 | 21.1 | 19.2 | 38.5 | - |
| Compressor C2 | 17.1 | 17.1 | 17.1 | - |
| Pd-Membrane | 3.7 | 3.7 | 4.9 | - |
| Ionic Compressor (incl.storage&refrigerator) | 25.9 | 25.9 | 25.9 | 25.9 |
| Water system (incl.pumping&purification) | - | - | - | 0.1 |
| Dispenser | 7.8 | 7.8 | 7.8 | 7.8 |
| Heat Exchanger | 2.2 | 2.2 | 2.2 | - |
| Total | 725.7 | 712.1 | 661.1 | 780.8 |
| REPLEX (kEUR) | ||||
| SOFC * | 343.0 | - | 503.6 | - |
| PEMFC ** | - | 56.5 | - | - |
| Electrolyzer | - | - | - | 468.2 |
| Catalyst | 54.0 | 54.0 | - | |
| Compressor C1 | 263.9 | 23.6 | 481.2 | - |
| Compressor C2 | 214.2 | 214.2 | 214.2 | - |
| Water system (incl.pumping&purification) | - | - | - | 7.8 |
| Dispenser | 260.0 | 260.0 | 260.0 | 260.0 |
| Total | 1081.1 | 608.3 | 1513 | 736 |
* The replacement cost for the SOFC is assumed as 40% of the initial investment since only the stack has to be replaced. ** The replacement cost for the PEMFC is assumed as 43% of the initial investment since only the stack has to be replaced.
References
- IEA. Tracking Transport 2020, IEA, Paris, France. 2020. Available online: https://www.iea.org/reports/tracking-transport-2020 (accessed on 2 December 2021).
- Park, S.; Nam, S.; Oh, M.; Choi, I.J.; Shin, J. Preference structure on the design of hydrogen refueling stations to activate energy transition. Energies 2020, 13, 3959. [Google Scholar] [CrossRef]
- Sagaria, S.; Moreira, A.; Margarido, F.; Baptista, P. From Microcars to Heavy-Duty Vehicles: Vehicle Performance Comparison of Battery and Fuel Cell Electric Vehicles. Vehicles 2021, 3, 41. [Google Scholar] [CrossRef]
- Jovan, D.J.; Dolanc, G. Can green hydrogen production be economically viable under current market conditions. Energies 2020, 13, 6599. [Google Scholar] [CrossRef]
- Gu, Y.; Chen, Q.; Xue, J.; Tang, Z.; Sun, Y.; Wu, Q. Comparative techno-economic study of solar energy integrated hydrogen supply pathways for hydrogen refueling stations in China. Energy Convers. Manag. 2020, 223, 113240. [Google Scholar] [CrossRef]
- Peksen, M. Hydrogen technology towards the solution of environment-friendly new energy vehicles. Energies 2021, 14, 4892. [Google Scholar] [CrossRef]
- Asif, U.; Schmidt, K. Fuel cell electric vehicles (Fcev): Policy advances to enhance commercial success. Sustainability 2021, 13, 5149. [Google Scholar] [CrossRef]
- Rösch, C.; Posten, C. Challenges and Perspectives of Deployment of BEVs and FCEVs; Asian Pacific Energy Research Centre: Tokyo, Japan, 2020; Volume 21, ISBN 9784931482609. [Google Scholar]
- Vidas, L.; Castro, R. Recent Developments on Hydrogen Production Technologies: State-of-the-Art Review with a Focus on Green-Electrolysis. Appl. Sci. 2021, 11, 11363. [Google Scholar] [CrossRef]
- Minutillo, M.; Perna, A.; Di Trolio, P.; Di Micco, S.; Jannelli, E. Techno-economics of novel refueling stations based on ammonia-to-hydrogen route and SOFC technology. Int. J. Hydrogen Energy 2021, 46, 10059–10071. [Google Scholar] [CrossRef]
- Minutillo, M.; Perna, A.; Sorce, A. Combined hydrogen, heat and electricity generation via biogas reforming: Energy and economic assessments. Int. J. Hydrogen Energy 2019, 44, 23880–23898. [Google Scholar] [CrossRef]
- Dębowski, M.; Dudek, M.; Zieliński, M.; Nowicka, A.; Kazimierowicz, J. Microalgal hydrogen production in relation to other biomass-based technologies—A review. Energies 2021, 14, 6025. [Google Scholar] [CrossRef]
- Noussan, M.; Raimondi, P.P.; Scita, R.; Hafner, M. The Role of Green and Blue Hydrogen in the Energy Transition—A Technological and Geopolitical Perspective. Sustainability 2021, 13, 298. [Google Scholar] [CrossRef]
- Gökçek, M.; Kale, C. Optimal design of a Hydrogen Refuelling Station (HRFS) powered by Hybrid Power System. Energy Convers. Manag. 2018, 161, 215–224. [Google Scholar] [CrossRef]
- Zhao, L.; Brouwer, J. Dynamic operation and feasibility study of a self-sustainable hydrogen fueling station using renewable energy sources. Int. J. Hydrogen Energy 2015, 40, 3822–3837. [Google Scholar] [CrossRef] [Green Version]
- Barhoumi, E.M.; Okonkwo, P.C.; Farhani, S.; Ben Belgacem, I.; Zghaibeh, M.; Mansir, I.B.; Bacha, F. Techno-economic analysis of photovoltaic-hydrogen refueling station case study: A transport company Tunis-Tunisia. Int. J. Hydrogen Energy 2021. [Google Scholar] [CrossRef]
- Ayodele, T.R.; Mosetlhe, T.C.; Yusuff, A.A.; Ntombela, M. Optimal design of wind-powered hydrogen refuelling station for some selected cities of South Africa. Int. J. Hydrogen Energy 2021, 46, 24919–24930. [Google Scholar] [CrossRef]
- Ulleberg, Ø.; Hancke, R. Techno-economic calculations of small-scale hydrogen supply systems for zero emission transport in Norway. Int. J. Hydrogen Energy 2020, 45, 1201–1211. [Google Scholar] [CrossRef]
- Lee, B.; Park, J.; Lee, H.; Byun, M.; Yoon, C.W.; Lim, H. Assessment of the economic potential: COx-free hydrogen production from renewables via ammonia decomposition for small-sized H2 refueling stations. Renew. Sustain. Energy Rev. 2019, 113, 109262. [Google Scholar] [CrossRef]
- Di Marcoberardino, G.; Vitali, D.; Spinelli, F.; Binotti, M.; Manzolini, G. Green hydrogen production from raw biogas: A techno-economic investigation of conventional processes using pressure swing adsorption unit. Processes 2018, 6, 19. [Google Scholar] [CrossRef] [Green Version]
- Perna, A.; Minutillo, M.; Di Micco, S.; Cigolotti, V.; Pianese, A. Ammonia as hydrogen carrier for realizing distributed on-site refueling stations implementing PEMFC technology. In Proceedings of the E3S Web of Conferences, Kenitra, Morocco, 25–27 December 2020. [Google Scholar]
- Perna, A.; Minutillo, M.; Di Micco, S.; Di Trolio, P.; Jannelli, E. Biogas and ammonia as hydrogen vectors for small refueling stations: Techno-economic assessment. AIP Conf. Proc. 2019, 2191, 020127. [Google Scholar] [CrossRef]
- Minutillo, M.; Perna, A.; Forcina, A.; Di Micco, S.; Jannelli, E. Analyzing the levelized cost of hydrogen in refueling stations with on-site hydrogen production via water electrolysis in the Italian scenario. Int. J. Hydrogen Energy 2021, 46, 13667–13677. [Google Scholar] [CrossRef]
- Kishimoto, M.; Furukawa, N.; Kume, T.; Iwai, H.; Yoshida, H. Formulation of ammonia decomposition rate in Ni-YSZ anode of solid oxide fuel cells. Int. J. Hydrogen Energy 2017, 42, 2370–2380. [Google Scholar] [CrossRef]
- Appari, S.; Janardhanan, V.M.; Jayanti, S.; Maier, L.; Tischer, S.; Deutschmann, O. Micro-kinetic modeling of NH3 decomposition on Ni and its application to solid oxide fuel cells. Chem. Eng. Sci. 2011, 66, 5184–5191. [Google Scholar] [CrossRef] [Green Version]
- Ranieri, L.; Mossa, G.; Pellegrino, R.; Digiesi, S. Energy Recovery from the Organic Fraction of Municipal Solid Waste: A Real Options-Based Facility Assessment. Sustainability 2018, 10, 368. [Google Scholar] [CrossRef] [Green Version]
- Minutillo, M.; Perna, A.; Sorce, A. Green hydrogen production plants via biogas steam and autothermal reforming processes: Energy and exergy analyses. Appl. Energy 2020, 277, 115452. [Google Scholar] [CrossRef]
- Viktorsson, L.; Heinonen, J.T.; Skulason, J.B.; Unnthorsson, R. A step towards the hydrogen economy—A life cycle cost analysis of a hydrogen refueling station. Energies 2017, 10, 763. [Google Scholar] [CrossRef]
- Fasihi, M.; Weiss, R.; Savolainen, J.; Breyer, C. Global potential of green ammonia based on hybrid PV-wind power plants. Appl. Energy 2021, 294, 116170. [Google Scholar] [CrossRef]
- Wegener, M.; Villarroel Schneider, J.; Malmquist, A.; Isalgue, A.; Martin, A.; Martin, V. Techno-economic optimization model for polygeneration hybrid energy storage systems using biogas and batteries. Energy 2021, 218, 119544. [Google Scholar] [CrossRef]
- Napoli ABC. Adeguamento Tariffario 2019; segreteriagenerale@abcnapoli.telecompost.it. Available online: https://www.abc.napoli.it/allegato/allegato_3919_TARIFFE_ACQUA_2019.pdf (accessed on 2 December 2021).
- Satyapal, S. [DOE] 보고서_DOE Hydrogen and Fuel Cell Perspectives and Overview of the International Partnership for Hydrogen and Fuel Cells in the Economy (IPHE). DOE Hydrog. Fuel Cells Progr. 2020, 1–25. Available online: https://www.energy.gov/sites/prod/files/2020/07/f77/hfto-satyapal-gabi-workshop-jul20.pdf (accessed on 2 December 2021).
- Gestore Mercati Energetici (GME)-Mercato del Giorno Prima (MGP). Available online: https://www.mercatoelettrico.org/it/default.aspx (accessed on 2 December 2021).
- Markets, E.E. Q Quarterly Report on European Electricity Markets with Focus on Corporate Power Purchase Agreements and Residential Photovoltaics. Market Observatory for Energy. 2019. Available online: https://ec.europa.eu/energy/sites/ener/files/quarterly_report (accessed on 14 October 2020).
- Izquierdo, U.; Barrio, V.L.; Requies, J.; Cambra, J.F.; Güemez, M.B.; Arias, P.L. Tri-reforming: A new biogas process for synthesis gas and hydrogen production. Int. J. Hydrogen Energy 2013, 38, 7623–7631. [Google Scholar] [CrossRef]
- Cha, J.; Jo, Y.S.; Jeong, H.; Han, J.; Nam, S.W.; Song, K.H.; Yoon, C.W. Ammonia as an efficient COX-free hydrogen carrier: Fundamentals and feasibility analyses for fuel cell applications. Appl. Energy 2018, 224, 194–204. [Google Scholar] [CrossRef]
- Perna, A.; Minutillo, M.; Jannelli, E. Designing and analyzing an electric energy storage system based on reversible solid oxide cells. Energy Convers. Manag. 2018, 159, 381–395. [Google Scholar] [CrossRef]
- Kim, J. Modeling of Proton Exchange Membrane Fuel Cell Performance with an Empirical Equation. J. Electrochem. Soc. 1995, 14, 2670. [Google Scholar] [CrossRef]
- Perna, A.; Moretti, L.; Ficco, G.; Spazzafumo, G.; Canale, L.; Dell’isola, M. SNG generation via power to gas technology: Plant design and annual performance assessment. Appl. Sci. 2020, 10, 8443. [Google Scholar] [CrossRef]
- Perna, A.; Cicconardi, S.P.; Cozzolino, R. Performance evaluation of a fuel processing system based on membrane reactors technology integrated with a PEMFC stack. Int. J. Hydrogen Energy 2011, 16, 9906–9915. [Google Scholar] [CrossRef]
- Van de Ven, J.D.; Li, P.Y. Liquid piston gas compression. Appl. Energy 2009, 86, 2183–2191. [Google Scholar] [CrossRef]
- Battelle Memorial Institute. Manufacturing Cost Analysis: 1, 5, 10 and 25 kW Fuel Cell Systems for Primary Power and Combined Heat and Power Applications; U.S. Department of Energy: Washington, DC, USA, 2017.
- Staffell, I.; Green, R. The cost of domestic fuel cell micro-CHP systems. Int. J. Hydrogen Energy 2013, 38, 1088–1102. [Google Scholar] [CrossRef] [Green Version]
- Schmidt, O.; Gambhir, A.; Staffell, I.; Hawkes, A.; Nelson, J.; Few, S. Future cost and performance of water electrolysis: An expert elicitation study. Int. J. Hydrogen Energy 2017, 42, 30470–30492. [Google Scholar] [CrossRef]
- Blazquez-Diaz, C. Techno-economic modelling and analysis of hydrogen fuelling stations. Int. J. Hydrogen Energy 2019, 44, 495–510. [Google Scholar] [CrossRef]
- Newsom, G. Joint Agency Staff Report on Assembly Bill 8: 2019 Annual Assessment of Time and Cost Needed to Attain 100 Hydrogen Refueling Stations in California; California Energy Commission California Air Resources Board: Sacramento, CA, USA, 2019.
- Mason, J.; Zweibel, K. Centralized production of hydrogen using a coupled water electrolyzer-solar photovoltaic system. In Solar Hydrogen Generation: Toward a Renewable Energy Future; Springer: New York, NY, USA, 2008; ISBN 9780387728094. [Google Scholar]
- Department of energy (DOE)-Fuel Cell Technologies Office Multi-Year Research, Development, and Demonstration Plan, 2015 Delivery Section. Available online: https://www.energy.gov/sites/prod/files/2015/08/f25/fcto_myrdd_delivery.pdf (accessed on 2 December 2021).


Publisher’s Note: MDPI stays neutral with regard to jurisdictional claims in published maps and institutional affiliations. |
© 2022 by the authors. Licensee MDPI, Basel, Switzerland. This article is an open access article distributed under the terms and conditions of the Creative Commons Attribution (CC BY) license (https://creativecommons.org/licenses/by/4.0/).