Article

Thermal Analysis and Optimization of the Phase Diagram of the Cu-Ag Sulfide System

1
Johan Gadolin Process Chemistry Centre, Abo Akademi University, Piispankatu 8, FI-20500 Turku, Finland
2
Department of Chemical and Metallurgical Engineering, Aalto University, Kemistintie 1, FI-02150 Espoo, Finland
*
Author to whom correspondence should be addressed.
Energies 2022, 15(2), 593; https://doi.org/10.3390/en15020593
Submission received: 8 December 2021 / Revised: 6 January 2022 / Accepted: 12 January 2022 / Published: 14 January 2022

Abstract

:
Thermal stabilities of selected ternary phases of industrial interest in the Ag-Cu-S system have been studied by the calorimetric and electromotive force techniques. The ternary compounds Ag1.2Cu0.8S (mineral mackinstryite) and AgCuS (mineral stromeyerite) were equilibrated through high-temperature reaction of the pure Cu2S and Ag2S in an inert atmosphere. The synthesized single solid sample constituting the two ternary phases was ground into fine powders and lightly pressed into pellets before calorimetric measurements. An electrochemical cell incorporating the two equilibrated phase and additional CuS as a cathode material was employed. The measurement results obtained with both techniques were analyzed and thermodynamic properties in the system have been determined and compared with the available literature values. Enthalpy of fusion data of the Ag-richer solid solution (Ag,Cu)2S have also been determined directly from the experimental data for the first time. The thermodynamic quantities determined in this work can be used to calculate thermal energy of processes involving the Ag-Cu-S-ternary phases. By applying the obtained results and the critically evaluated literature data, we have developed a thermodynamic database. The self-developed database was combined with the latest pure substances database of the FactSage software package to model the phase diagram of the Ag2S-Cu2S system.

1. Introduction

Today, the complexities and low grade of the available raw materials from ore deposits are challenging the production of high-grade metals by the conventional metallurgical processes. To address this issue, metallurgists are considering alternatives strategies and modify operating flow sheets for processing more complex feedstock in an energy efficient, environmentally friendly and economically sound way. To make the appropriate modifications, accurate knowledge of existing phase relations and their thermal stabilities during the whole metallurgical processes are essential.
Ongoing research and development efforts to advance extraction metallurgy are aiming at (a) efficient utilization of the chemical energy of the concentrate and minimization/elimination of carbon-based fuel consumption, (b) maximum environmental protection and the production of controlled gas with a high content of SO2, and (c) high recovery of the primary metal and minor metals including the precious metals [1]. The overall result of these efforts will eventually contribute to create adaptive and dynamic metallurgical processes, including roasting as a thermal pretreatment that enriches raw materials and extracts thermal energy. For example, the main steps in the copper production process at the Boliden Rönnskär (Skelleftehamn, Sweden) smelter presented in [2] consist of drying, roasting, smelting, converting and refining. The thermal energy generated mainly from sulfur containing minerals in the fluidized bed roasting process can be utilized for drying the feed materials.
Copper- and silver-containing sulfide minerals are often found in the complex ore minerals that are available for the base and precious metals extraction. Among the silver-based ternary phases, stromeyerite (Ag0.9Cu1.1S) is a relatively common ore mineral in most hydrothermal vein and replacement deposits [3]. Generally, silver is considered as a typical impurity in the sulfide ores for copper extraction. In the ores, it exists as a native silver and as a component of mineral phases [4]. Thus, a significant amount of silver may end up in the primary copper making via pyrometallurgical processing routes. In the high-temperature extraction processes, it is concentrated in the copper phase and subsequently recovered at the electro-refining stages as a byproduct together with the other precious metals [5].
Besides their mineralogical importance in the metal extraction missions, copper and silver halides, chalcogenides, and chalcohalides have attracted attention over the past decades due to their properties to exhibit mixed electronic and ionic conduction [6,7,8,9]. Recently, the Ag-Cu-S-ternary phases were observed to exhibit phase transformations due to temperature dependent cationic mobility [10,11]. This unique property, together with their high ionic conductivity (λ) following phase transformations, initiated the most recent research activities in the Ag-Cu-S system. For example, the face-centered cubic (FCC) structured (Cu,Ag)2S solid solution has been reported to have λ(573 K) ≈ 2.4 S∙cm−1 [12], and also evaluated to have uncommon optical properties [13]. AgCuS belongs to this family and shows several temperature dependent structural transitions and performs p-n-p type conduction switching coupled with a colossal variation of thermopower in connection with the structural changes [8,11]. These unique properties, generally, make Cu-Ag-sulfides candidate inorganic materials for transistors, photovoltaic devices, semiconductor-switches, and temperature-controlled-diodes and transistor devices [14,15].
Inorganic materials research involves the determination of phase transformations, melting, phase equilibria with coexisting phases, and other application-based thermodynamic properties. The availability of these data help to optimize materials processing including extraction and recovery of metals, and from a materials science point of view, the data assist the selection of high-performance and cost-effective materials and enable the optimization of their processing technology [4].
Therefore, well-defined thermodynamic properties of the equilibrium phases in the Ag-Cu-S system and modeling of the system have a great fundamental and practical interest in extractive and physical metallurgy.
The experimental results of an electrochemical and calorimetric study on Ag0.93Cu1.07S (mineral stromeyerite) and the solid solution (Cu,Ag)2S in the Cu2S-rich region, along with thermodynamic considerations, were presented in [4,16]. The present work involves a continuation that follows the previous research and investigates in the Ag2S-richer region, specifically at the vicinity of 65 wt% Ag2S in the Ag2S–Cu2S system, by the means of the simultaneous differential scanning calorimetry (DSC) and thermal gravimetric analysis (TGA) and electromotive force (EMF) techniques. Thus, this experimental work completes the deficiencies in the thermodynamic data of the Ag2S-rich part of the Cu2S-Ag2S system. The previous and current experimental data were utilized together with literature data to complete the optimization of the complex phase diagram of the Ag2S-Cu2S system.

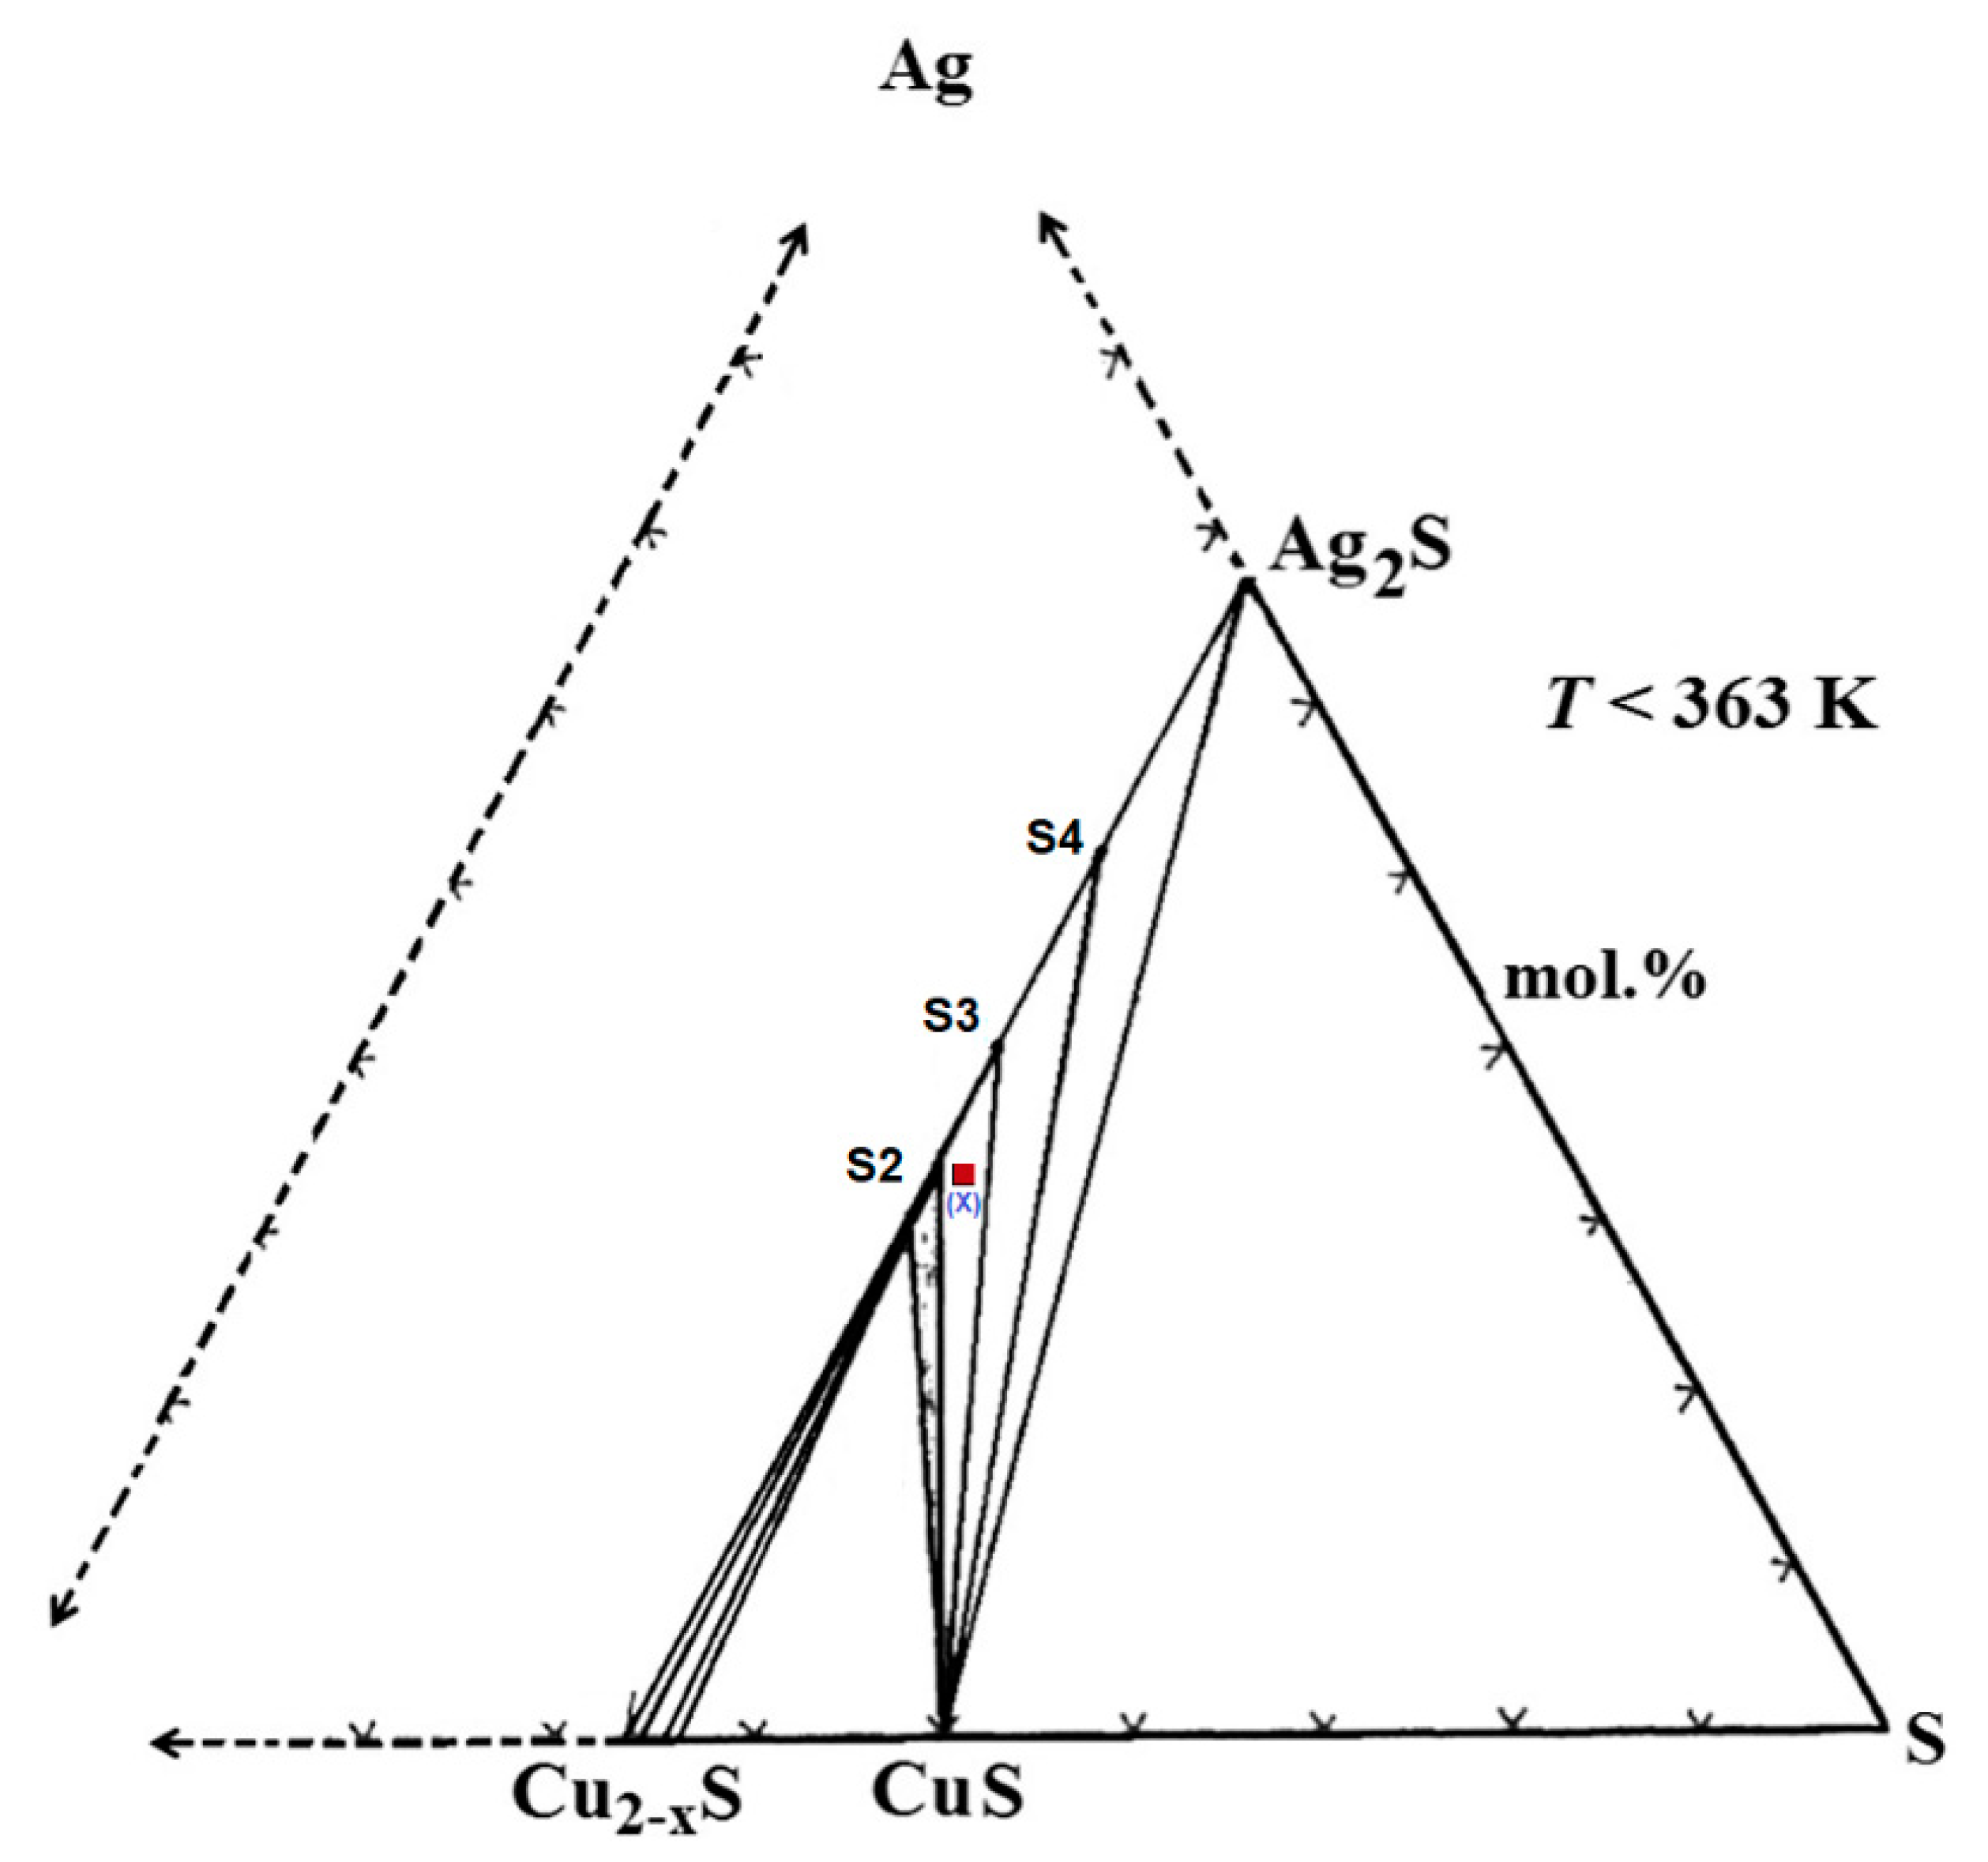
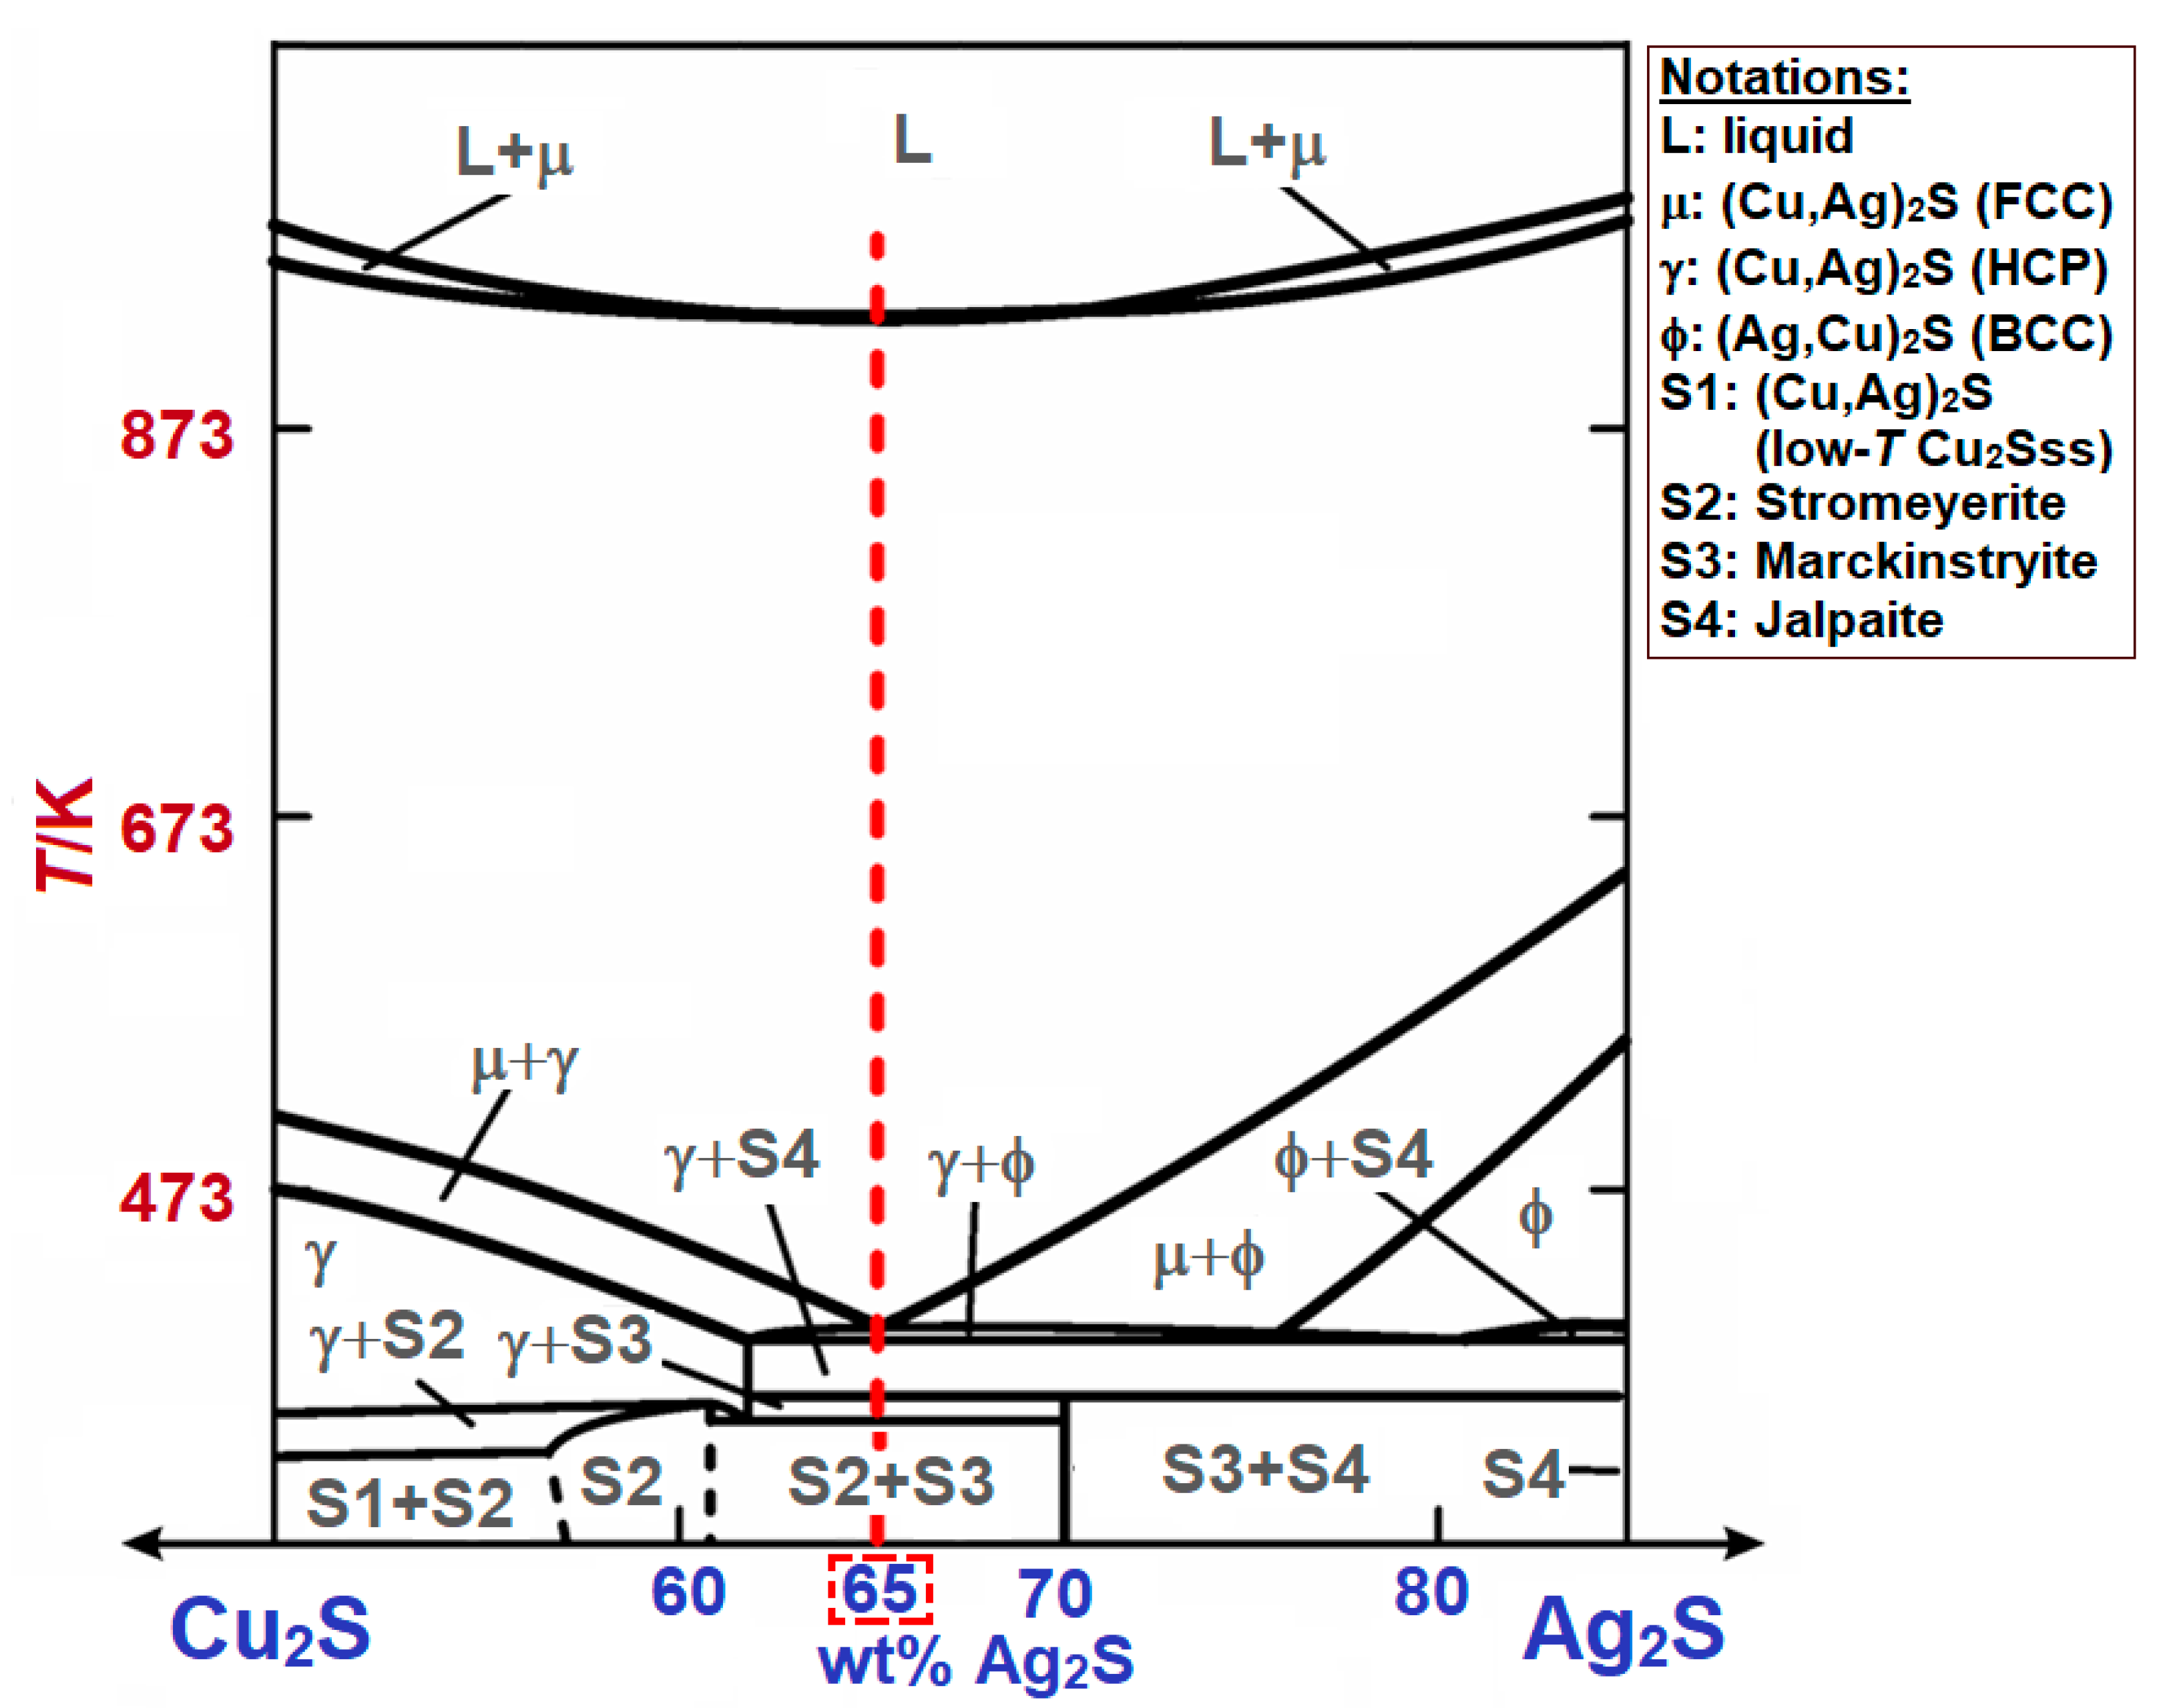
Literature Data on Phase Equilibria and Thermodynamics in the Ag2S-Cu2S System

βCu2S (monoclinic, mineral low-chalcocite) transforms at 376 K to γCu2S (hexagonal, mineral high-chalcocite), which is stable up to 708 K [17]. βCu2S may dissolve up to 1.87 ± 0.37 mol% Ag2S, at 336 K [18]. Thermal stability data for Ag2S is summarized in [19]. At temperatures < 400 K, three ternary compounds in the Ag-Cu-S system are known to be thermodynamically stable; these are body-centered tetragonal Ag1.55Cu0.45S (mineral jalpaite), orthorhombic Ag1.2Cu0.8S (mineral mackinstryite), and orthorhombic Ag1−χCu1+χS (mineral stromeyerite) [18,20,21,22,23,24,25]. All of the ternary compounds exist below 392 K and on the Ag2S-Cu2S tie line [20,21]. Skinner [18] characterized these phases with X-ray diffractometer at elevated temperatures.
Of all the ternary compounds, stromeyerite was reported to exhibit significant compositional range. According to Skinner [18] and Frueh [23], stromeyerite (Ag1−χCu1+χS) exhibits extended stoichiometric variation, 0 ≤ χ ≤ 0.1. The stromeyerite reported in [25], Ag0.89Cu1.10S, is in the range of the proposed stoichiometric variation. Earlier, we synthesized stromeyerite saturated with Cu2S that has a composition of Ag0.93Cu1.07S [4]. Stromeyerite with 1:1:1 molar ratio, AgCuS, has been synthesized by [8,11,26], by applying different methods.
At temperatures above 392 K, Cu2S and Ag2S reacts to form three solid solutions of different crustal structures: (Cu,Ag)2S(BCC), (Cu,Ag)2S(HCP) and (Cu,Ag)2S(FCC) [27,28]. Above 363 K, Ag0.93Cu1.07S restructures as a Cu2S-Ag2S solid solution, i.e., (Cu,Ag)2S(HCP) [20]. The solid solution then becomes a dominant phase together with (Cu,Ag)2S (BCC) [21]. Both the copper- and silver-richer (Cu,Ag)2S (BCC) undergo high-temperature transformation into (Cu,Ag)2S (FCC) [12,20], which has homogeneity regions starting from the pure Ag2S and Cu2S sides [12]. The solidus and liquidus curves of the FCC solid solution were mainly determined by Schwartz [29]. The work of Guin et al. [8] and, recently, Tesfaye et al. [4], confirm that the congruent melting temperature and composition of the FCC solid solution determined by Schwartz [29] is accurate. In the late 1960s and early 1970s, Perrot and Jeannot [30] studied the (Cu,Ag)2S solid solution by means of measuring activities of Ag2S at 790 K, and Werner [31] studied thermodynamic properties of the solid solution at 573 K by the EMF method.
Activities of Ag and Cu were measured in a series of experiments that involved stromeyerite [26], jalpaite [32,33], and mackinstryite [34] on the Ag2S–Cu2S tie line at CuS saturation, by the EMF method. Trots et al. [11] have determined the phase transition temperature of stromeyerite and the melting temperature of the solid solution along the composition AgCuS, by the calorimetric method. Tesfaye et al. [4,16] studied properties of stromeyerite and the solid solution (Cu,Ag)2S at Cu2S saturation by the EMF and differential scanning calorimetry-thermogravimetric analysis (DSC-TGA) methods.

2. Materials and Methods

2.1. Materials Preparation

The chemicals utilized in this study are listed in Table 1 with their purity. The ternary phase assemblage composed of Ag1.2Cu0.8S and AgCuS were synthesized from fine powders of Ag2S (65 wt%) and Cu2S (35 wt%) specified in Table 1. These fine powders were thoroughly mixed with an agate mortar and pressed into pellets with subsequent sealing in an evacuated fused silica ampoule. Prior to sealing, the ampoule was flushed several times with argon gas. The sample was subjected to a heat-treatment in a chamber furnace (AWF 12/25 type, Lenton, UK) with a stepwise-increasing temperature profile: at 573 K for three days, at 873 K for ten days, and at 1173 K for a few minutes. To avoid thermal shock, buildup of partial pressure (which may result in the breakage of the ampoules), and deposition of materials in other parts of the fused silica ampoules, we have followed a slow heating and cooling rate of 10 K/min.
At the last step, the samples were entirely melted to attain high homogeneity level, then cooled down to 338 K and annealed for three weeks. The material produced was analyzed with a LEO 1450 (Carl Zeiss Microscopy GmbH, Jena, Germany) scanning electron microscope (SEM) coupled with an Oxford Instruments X-Max 50 mm2 (Oxford Instruments plc, Abingdon, Oxfordshire, UK) energy dispersive spectrometer (EDS). The SEM-EDS analysis confirmed the coexistence of two ternary phases, synthetic mackinstryite and stromeyerite. The micrograph of the material synthesized is shown in Figure 1. The equilibrated stromeyerite has an approximate composition corresponding to AgCuS, which is in agreement with the literature data [18], suggesting stromeyerite in equilibrium with mackinstryite to have the Ag/Cu ratio 1. The stromeyerite at Cu2S saturation, synthesized in the previous studies [4,16], had an approximate composition of Ag0.93Cu1.07S.
The solid electrolyte RbAg4I5 was synthesized by mixing stoichiometric amounts of high purity AgI and RbI (Table 1) with distilled water to form a dense paste. The mixture was placed in a fused silica crucible and dried in an oven at a slowly increasing temperature. The remaining dry reactants were annealed in a resistance vertical tube furnace (CSC 12/--/450 V type, Lenton, UK) at T = 493 K for two hours. This temperature is an intermediate between the eutectic temperature and the incongruent melting point of RbAg4I5. The synthesis was accomplished by annealing at T = 433 K for two days [35]. The produced solid electrolyte material had a glassy greenish yellow color.

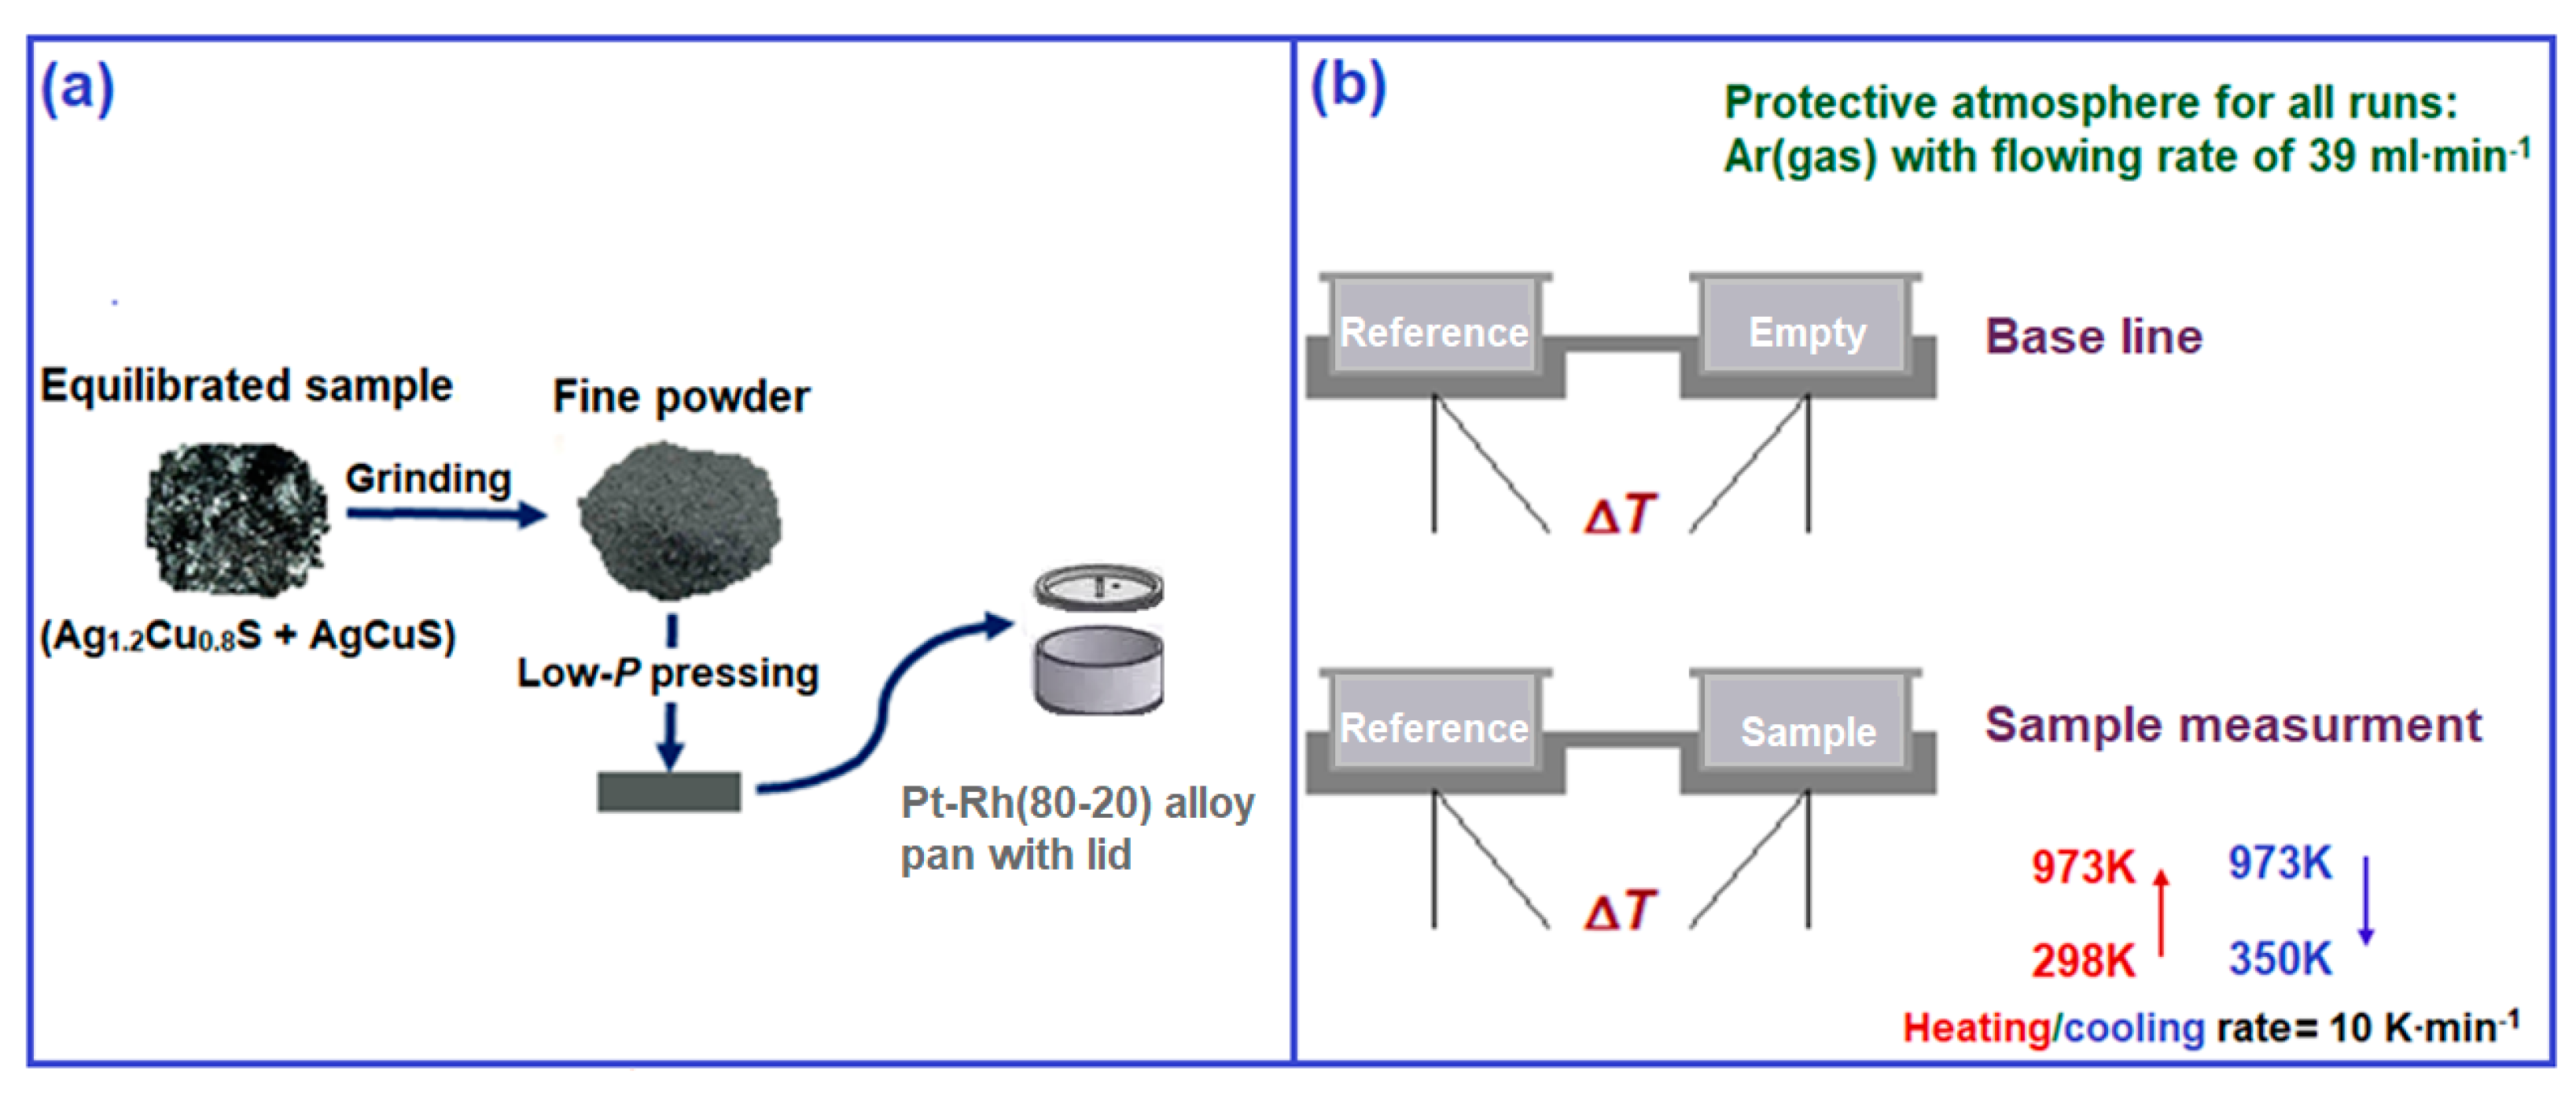
2.2. Thermal Analysis

Thermal characterization of the synthesized specimen comprised of Ag1.2Cu0.8S and AgCuS phases was conducted by the DSC-TGA method. A STA-449-F1-Jupiter®—simultaneous DSC-TGA analyzing equipment of the NETZSCH Group (NETZSCH-Gerätebau GmbH, Selb, Germany)—was employed for the experimental runs. The calorimeter was calibrated with the enthalpies of melting and melting temperatures for ultra-pure substances Zn, Sn, Au, In, Al and Bi. From the observed variations during the calibration measurements, the uncertainties for the temperatures and enthalpies of melting were estimated as ±1 K and ±1.2%, respectively.
Figure 2 shows the sample preparation and experimental procedure applied during all experimental runs. More details of the materials and gas used are described in the figure. Prior to each run (for baseline (empty pans), calibration (one pan with sapphire) and sample measurements), the chamber was evacuated and then backfilled with pure argon gas three times. In the initial stage, the furnace was heated to 298 K and kept at this temperature for ten minutes. Then, the furnace was heated and cooled at the same rate as specified at the bottom right corner of Figure 2. Heat flow and weight losses in all runs were recorded simultaneously.

2.3. Electrochemical Examination

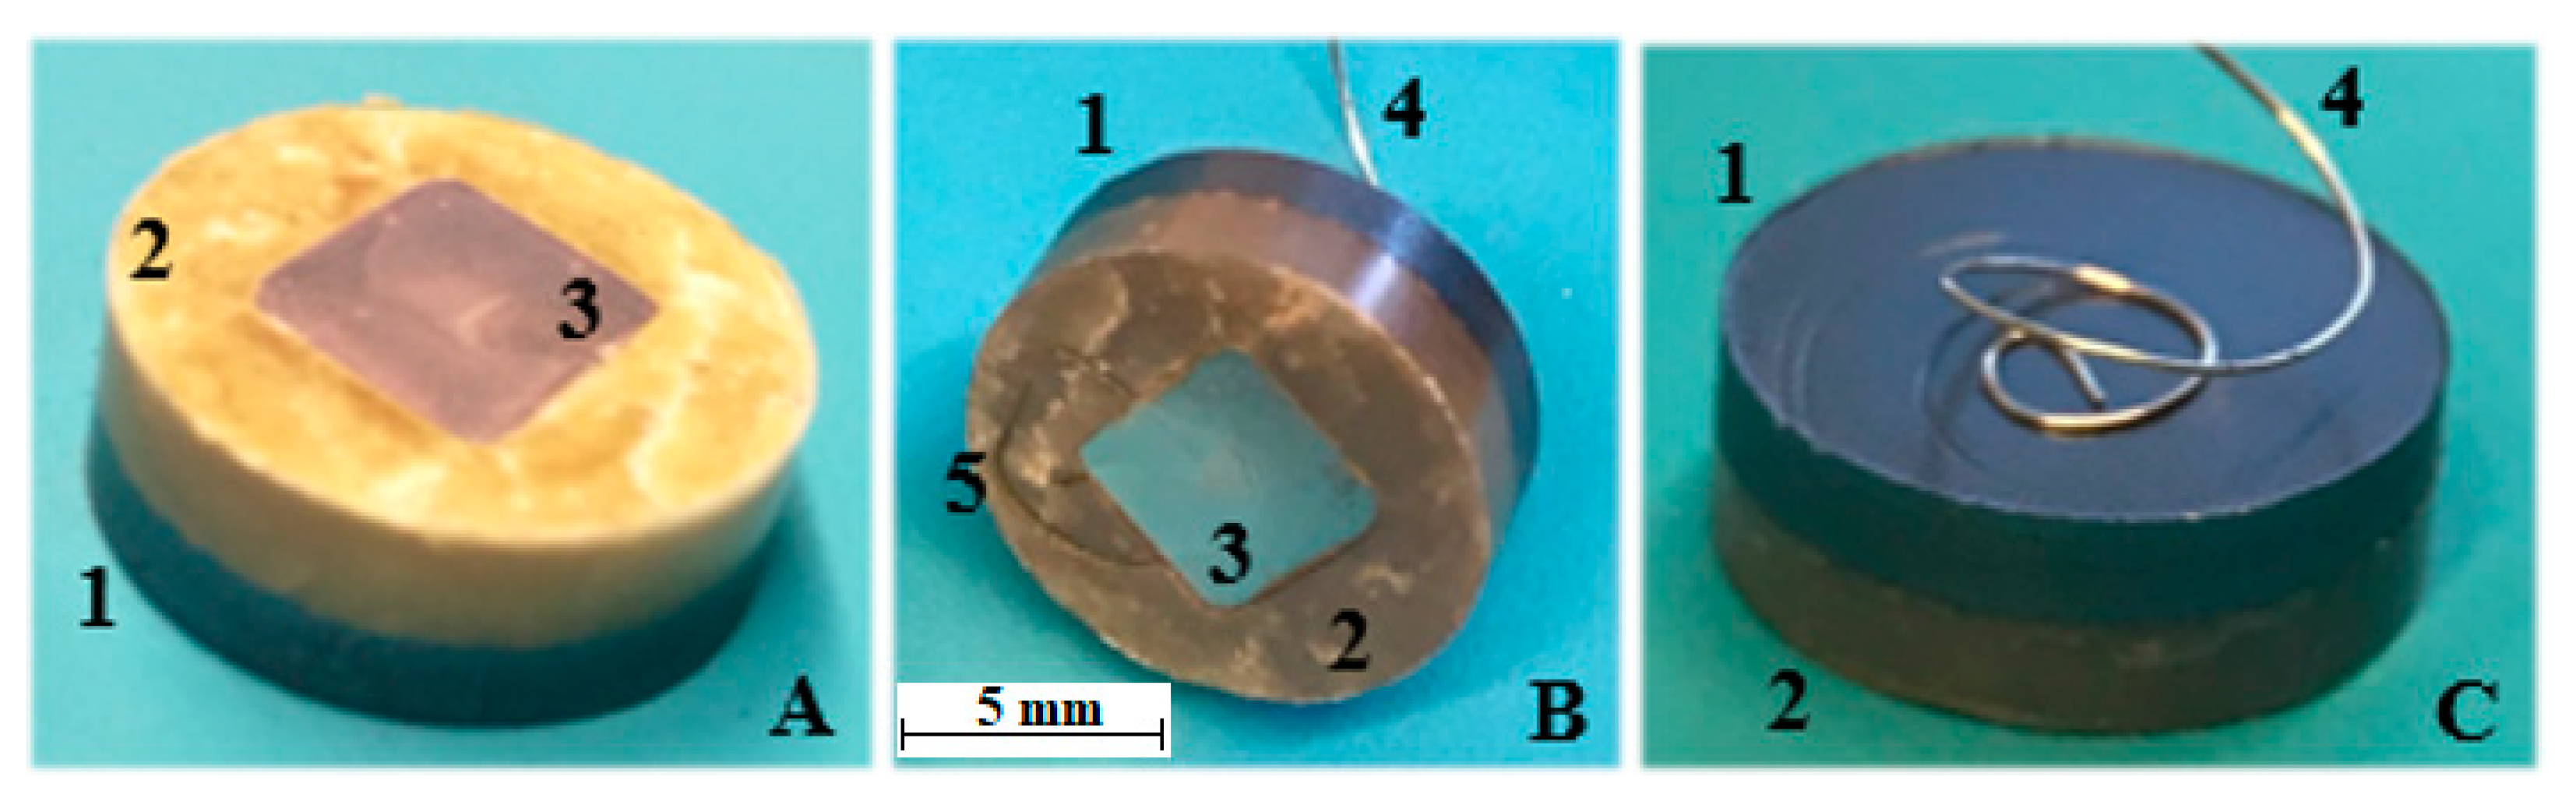
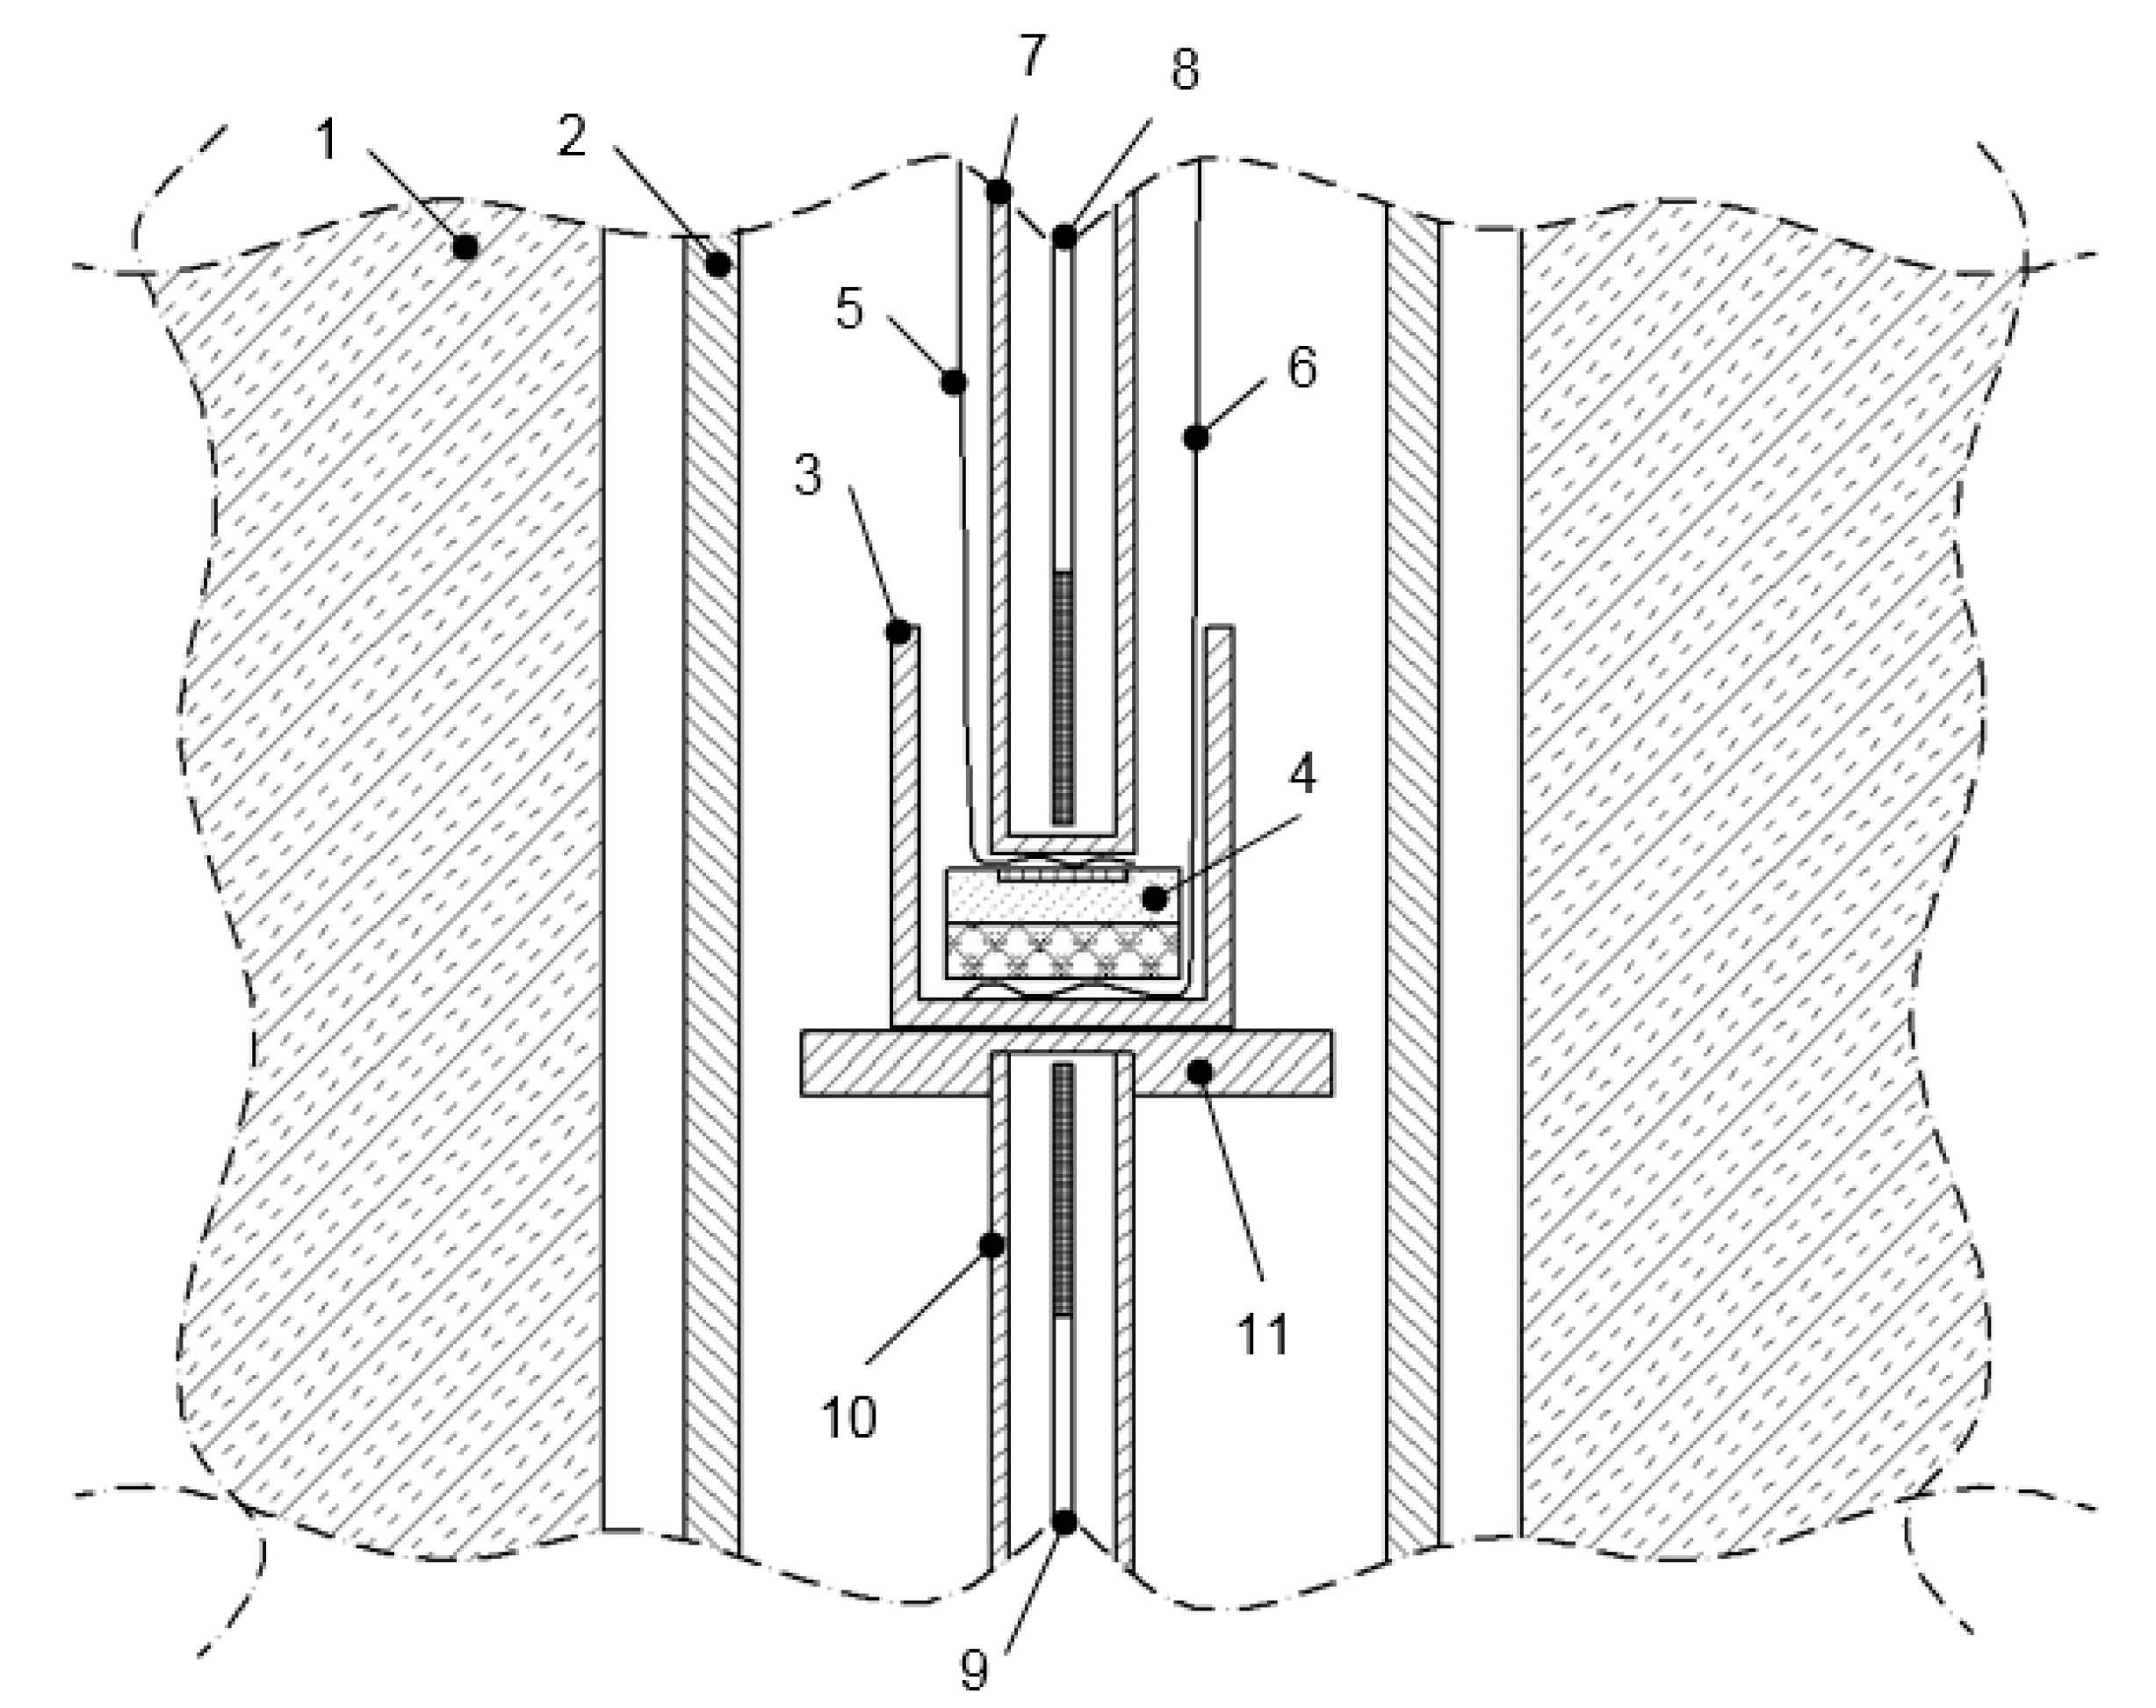
2.3.1. Galvanic Cell Formation and the Experimental Setup

Three essential parts of the galvanic cell, i.e., the electrolyte, the reference electrode, and test electrode, were separately prepared and then assembled together by pressing it into a pellet with a sandwich structure. The solid electrolyte RbAg4I5 synthesized was pulverized and utilized freshly in an amount of approximately 2.8 g. A small piece (8 mm × 8 mm) of high purity silver foil with 0.5 mm thickness (Table 1) was cleaned with a polishing paper from possible contaminations at the surface (e.g., oxide films) and utilized freshly. The choice of the pure silver as the reference electrode is due to the choice of Ag+ ion conducting electrolyte; other researchers, for example, Schmidt et al. [34], have applied Cu+ ion conducting electrolytes and pure copper as a reference electrode. The test electrode comprised of three phases was prepared from highly pure CuS (Table 1) and the synthesized sample containing Ag1.2Cu0.8S and AgCuS. The total mass of the test electrode was about 2 g. The phases were mixed in the following approximate molar ratio: CuS/Ag1.2Cu0.8S/AgCuS = 1/4/4, representing the red solid square in Figure 3.
Prior to mixing, the synthesized assemblage of the two ternary phases was pulverized with an agate mortar. The galvanic cell was pressed with a 15 mm diameter mold, starting with the test electrode layer, followed by the electrolyte layer and the reference electrode at the top (Figure 4A). The final pressure applied was about 0.27 GPa. To maintain excellent contacts between the interfaces and equilibrate, the constructed electrochemical cell was thermally treated for a day at a temperature well below the melting point of the electrolyte (400 K) prior to the start of the actual measurement.
Platinum lead wires (Table 1) were connected to the electrodes and the galvanic cell was put into an alumina crucible. The EMF measurements were conducted in a resistance vertical tube furnace (CSC 12/--/450 V type, Lenton, UK) equipped with a gas-impermeable fused silica work tube, where the crucible with the galvanic cell was disposed (Figure 5). A protective atmosphere was provided inside the work tube by passing a small 10 mL∙min−1 flow of argon (99.999 vol% pure, AGA, Espoo, Finland) controlled by a mass flow controller Aalborg DFC26 (Industrial Process Measurement, Inc., Edison, NJ 08820, USA).
The structure of the electrochemical cell at the beginning of the measurement can be represented by the assemblage (cell I).
Cell I:
(−) Pt|Ag|RbAg4I5|Ag1.2Cu0.8S + AgCuS + CuS|Pt (+)

2.3.2. Measuring Devices and the Procedure

The Pt lead wires were connected to an electrometer Keithley 6517B (Keithley Instruments, Inc., Cleveland, OH, USA) with a high input impedance to measure the EMF of the galvanic cell. The high input impedance of the electrometer for open cell voltage measurements was 2 × 10¹⁴ Ω. It allows the galvanic cell to function in a reversible way without any external current flowing [36].
Calibrated Pt100 resistance thermometers (TERMOTECH SRL, Vigevano, Pavia, Italy), with a tolerance class B 1/10 Din, SKS-Group, were connected to Keithley 2000 multimeters. The temperature was measured from above and from below of the galvanic cell. The galvanic cell was allocated into the isothermal zone of the furnace with the least temperature gradient by adjusting the cell position along the furnace height. The temperature difference between the two thermometers was less than 0.3 K during the entire experiment. Thus, any possible thermoelectric effects in the cell EMF were negligible.
The values of temperature and EMF were measured simultaneously and recorded with a computer with a rate of one measurement point per minute. The measurement was conducted at a constant temperature until equilibrium was attained. The equilibration criterion was behavior of the measured EMF as a function of time. When the EMF was asymptotically approaching a certain value and its changes within the last 24 h were less than 0.1 mV or it was fluctuating in the vicinity of a certain value for the same time, it was considered as an equilibrium. Equilibration time varied from 36 h to three weeks. Once the cell was equilibrated, the temperature was changed and equilibration started at a new temperature. The measurements were conducted through heating and cooling cycles to confirm reversibility and repeatability of the measurements. The measurements were conducted in the temperature range from 308 to 402 K.

3. Thermodynamic Optimization

By combining the critically reviewed literature data and experimental data in this work, we developed a database that enables thermodynamic calculations in the Ag2S-Cu2S system. The optimization was done by combining our own database and the SGPS–SGTE pure substances database, which is compiled by the Scientific Group Thermodata Europe [37]. The calculations and assessments were performed using the FactSage 7.1 software package [38]. Details on the optimization method were described in our recent openly accessible article [39].

4. Results and Discussion

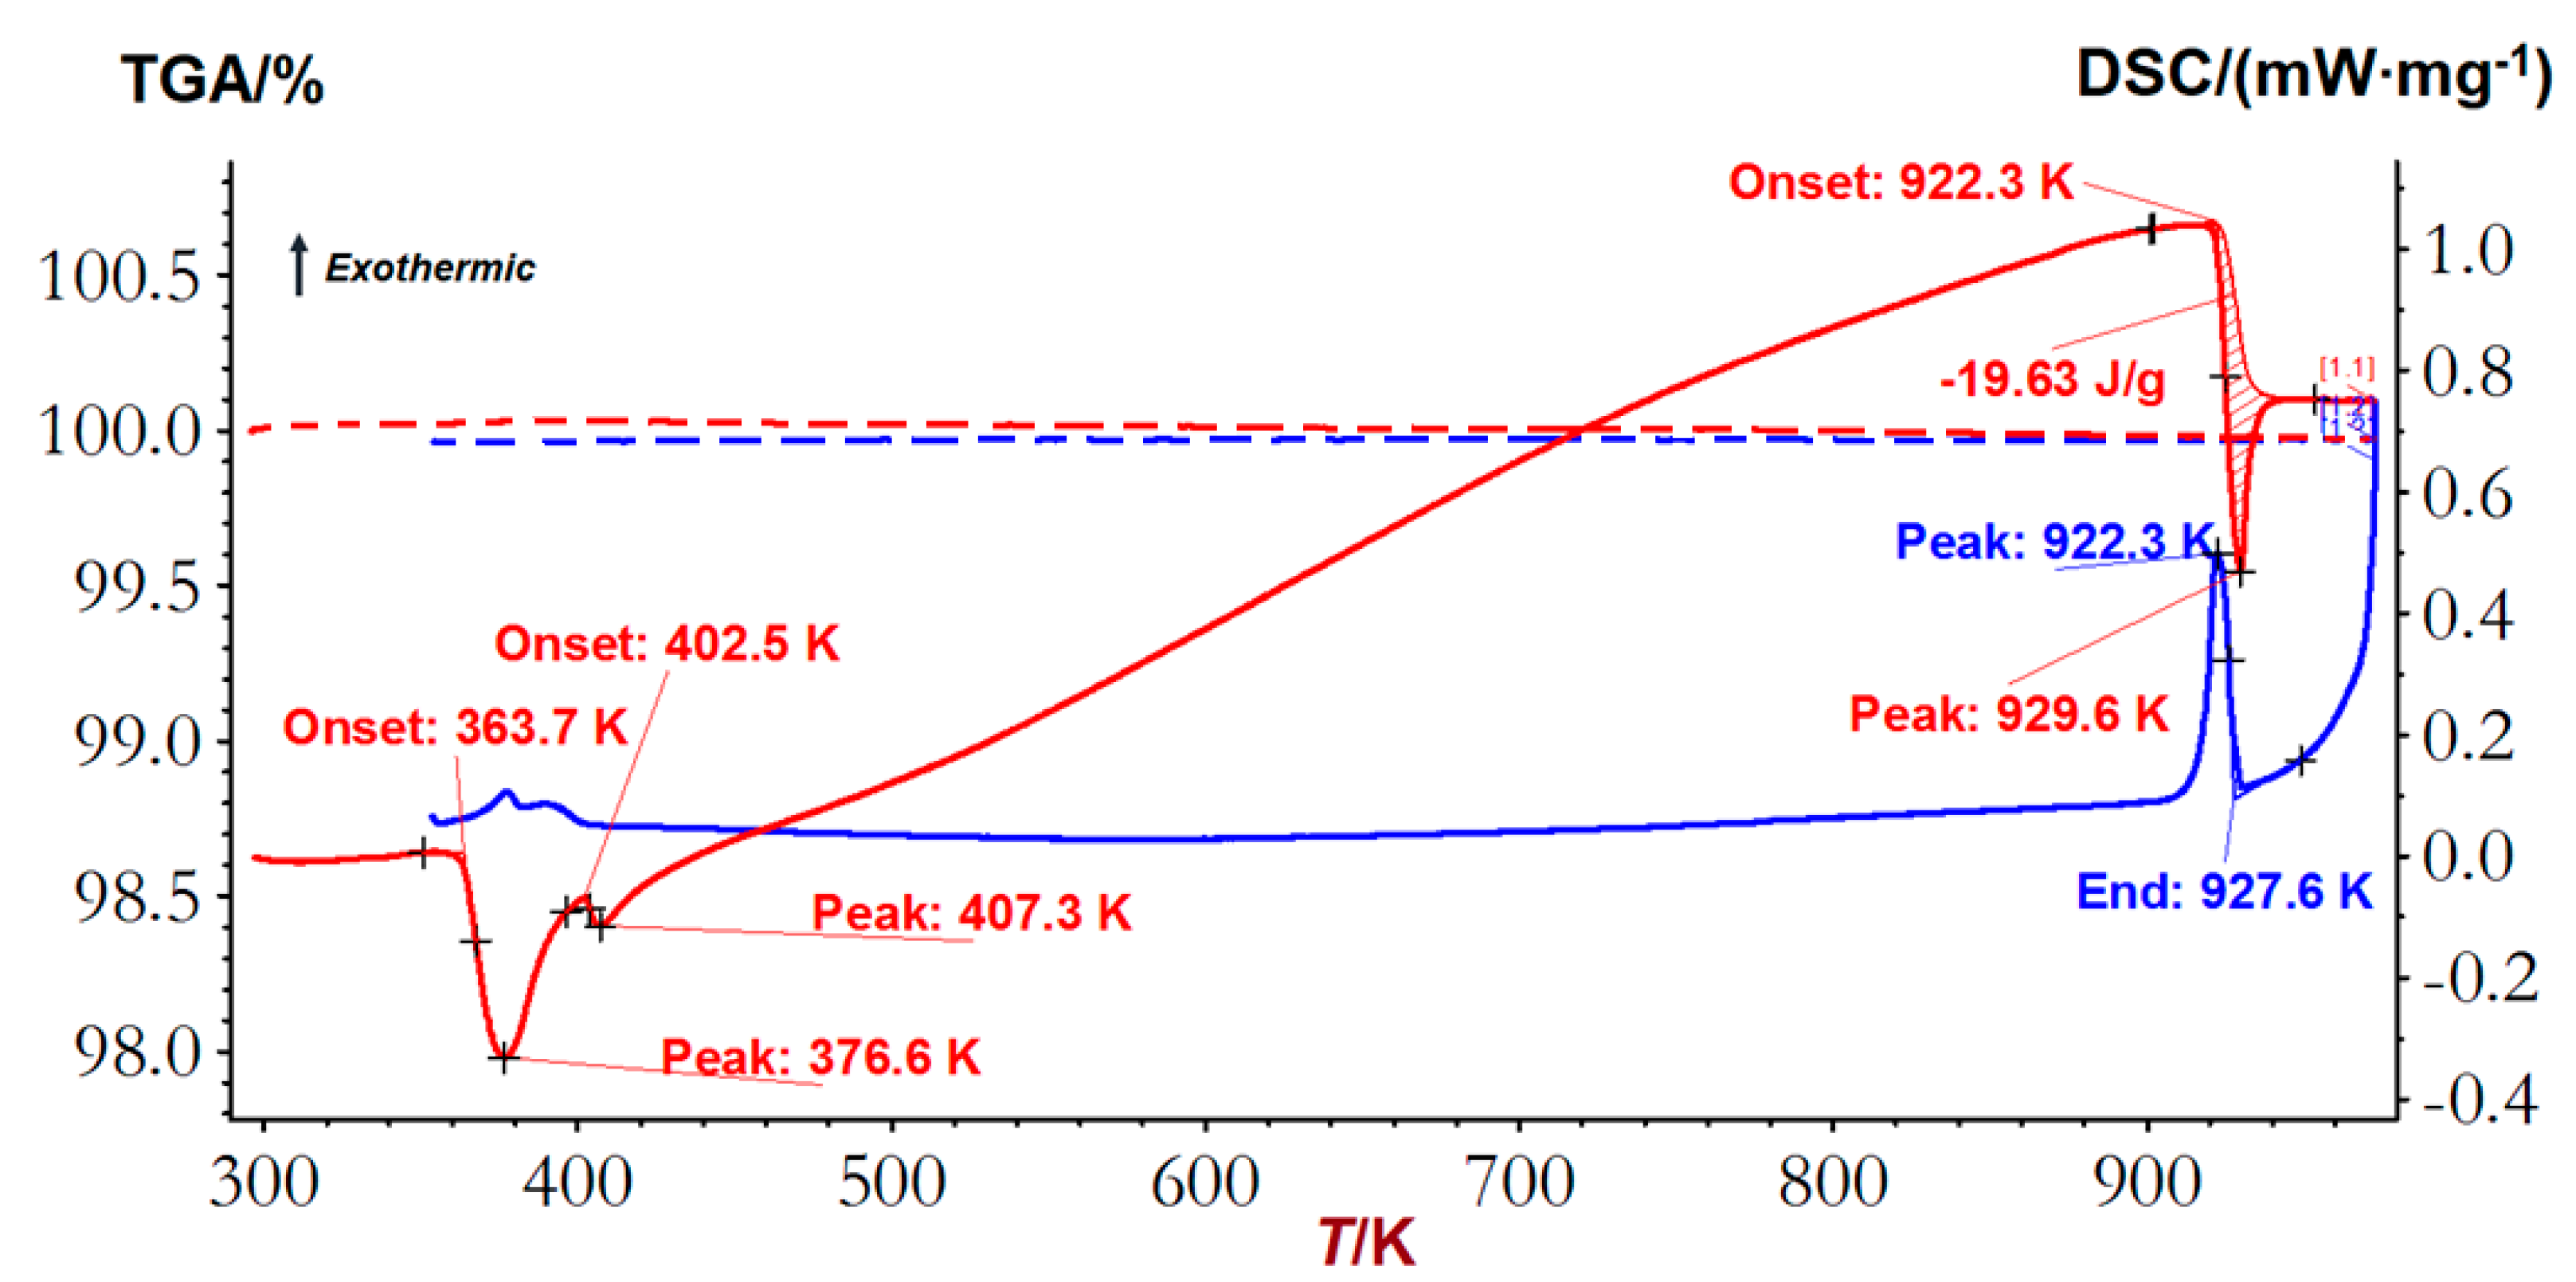
4.1. DSC Measurement Data

The DSC-TGA measurements were conducted for the equilibrated two-phase sample (Ag1.2Cu0.8S and AgCuS) in this work. The dashed straight line in Figure 6 at ~65 wt% Ag2S indicates the composition and temperature range of the DSC-TGA measurement.
The results obtained after heating from 298 to 973 K are presented in Figure 7. On the heating DSC curve, phase transitions and melting temperatures appeared as endothermic peaks. The hatched area of the melting peak depicted in Figure 7 yielded enthalpy of fusion of the Ag-richer solid solution (Ag,Cu)2S.
Temperatures of phase transformation and melting determined by the DSC method are compiled in Table 2, in comparison with the values reported in the published literature. As the TGA curves in Figure 7 show, mass loss of the sample upon heating and cooling is negligible. Therefore, the overall chemical composition of the analyzed sample was assumed to be constant during the thermal cycles, as indicated in Figure 6, i.e., along the 65 wt% Ag2S (the red dashed line).
The observed onset temperatures at 363.7 ± 1, 402.5 ± 1 and 922.2 ± 1 K indicated in Figure 7 correspond well with the phase transition and liquidus temperatures reported in the literature. As can be seen in Table 2, the onset temperature observed at 363.7 K is in good agreement with the stromeyerite transformation into the solid solution (Ag,Cu)2S(HCP), as reported by [4,6,11]. Despite the compositional differences that can alter thermodynamic properties, the transformation temperature presented in the proposed phase diagram of Chang et al. [20] is lower by up to 10 K than our measurement and the recent literature values of [4,6,11]. The onset temperature observed at 402.5 ± 1 K corresponds with the reported temperature of decomposition of stromeyerite into two phases at 399 K [11]. The slight temperature differences could be due to compositional variation as depicted in Table 2. Precisely, this phase transition temperature at 402.5 K, which comes after Ag0.93Cu1.07S transition to (Ag,Cu)2S(HCP) at 364 K (Table 2), represents the phase transition from Ag1.2Cu0.8S to Ag1.55Cu0.45S in the presence of (Ag,Cu)2S(HCP).
The onset temperature 922.3 K of the sharp peak on the heating curve shown in Figure 7 can be interpreted as the melting temperature of the Ag2S-richer solid solution (Ag,Cu)2S (FCC). According to the proposed phase diagram of Chang et al. [20], at the same composition of the experimental runs, the melting temperature of the solid solution is higher by about 15 K. In the previous work [4], melting temperature of the Cu2S-richer solid solution (Cu,Ag)2S (FCC) was determined to be 944 ± 1 K. The temperature difference between the Ag2S- and Cu2S-richer solid solutions suggest that adding a certain amount of Ag2S to the system tend to decrease melt formation temperatures.
Enthalpy of fusion for the Ag-richer solid solution with Ag/Cu ratio of ~1.2 was determined from the DSC measurements and presented in Equation (1) with its corresponding liquidus temperature. ∆meltH value for the Ag-richer solid solution is lower than that of the Cu-richer solid solution determined in our previous work [4], Equation (2), by about ~1.5 kJ·mol−1. The error values indicated in Equations (1) and (2) for both temperatures and enthalpies are average accuracies calculated during the temperature and sensitivity calibrations, as described in the Experimental section. Decimals were rounded to the next whole number.
(Ag1.09Cu0.91)S(s.s., FCC) ⇄ L   ∆meltH = 4.1 ± 1 kJ.mol−1, at Tmelt = 922.3 ± 1 K
(Ag0.92Cu1.08)S(s.s., FCC) ⇄ L   ∆meltH = 5.6 ± 1 kJ.mol−1, at Tmelt = 943.9 ± 1 K

4.2. EMF Measurement Data Analysis

The measured EMF values with electrochemical cell I as a function of temperature are presented in Figure 8. The average temperatures of those measured at both ends of the electrochemical cells were considered in deriving the thermodynamic data. The parasitic cell potential contributions to the cell EMF, resulting from the presence of the slight temperature gradients and contact potential differences, were obtained with the symmetric cells and eliminated from the EMF values at each temperature.
In the range of the experimental temperature, 308–402 K, EMF values increased with heating linearly. Thus, for the solid-state reactions in different thermal stability regions, the temperature dependent EMF values can be expressed by the typical linear equation E = a + b·T [4,16]. In accordance with this equation, the dependencies of the measured EMF values of electrochemical cell I on temperature, in two different temperature ranges, are expressed as Equations (3) and (4).
E(V) = 0.03700 + 0.24100∙T(K)∙10−3       (308 < T/K < 367)
E(V) = −0.04134 + 0.45000∙T(K)∙10−3       (382 < T/K < 402)
When equilibrium is attained, the transfer of the Ag+ ion at the interface into the cathode or the overall reaction of cell I can be represented by the virtual electrochemical cell reactions (5) and (6). Compositions of the solid phases are according to the composition of the cathode materials at the beginning of the measurements
19/20Ag + 19/20CuS + 1/20Ag1.2Cu0.8S = Ag1.01Cu0.99S
19/20Ag + 19/20CuS + 1/20Ag1.2Cu0.8S = (Ag,Cu)2S(HCP)
Solving Equations (3) and (4) simultaneously, the phase transformation temperature over the experimental temperature range 308–402 K were found to be T = 375 ± 1 K. This temperature is about 10 K higher than the value obtained with the DSC technique and the literature values for Ag0.93Cu1.07S = (Ag,Cu)2S(HCP) phase transition temperature, 361–365 K [4,6,11]. The phase transition temperature differences between the result obtained with the EMF method and the literature value could be attributed to the compositional differences, as the solid solution forms in the electrochemical cell in equilibrium with CuS.

Gibbs Energies of Formation (ΔfG°)

Difference in the chemical potential of Ag in the anode and cathode materials of the electrochemical cells I (∆µAg) is directly proportional to the generated EMF values, at an isotherm equilibrium. Thus, from the obtained EMF values as a function of temperature, Gibbs energies, enthalpies, and entropies of reactions (5) and (6) can be determined by applying the fundamental thermodynamic Equation (7) [4].
ΔrG°(T) = −z·F·E(T),
where z is the electrons involved in the electrochemical cell reaction, which is 0.95 (19/20 moles) in reactions (5) and (6), the Faraday constant F is 96,485.33 C·mol−1 [40], and the EMF of the electrochemical cell E is in V. The Gibbs energies of the virtual cell reactions (5) and (6) were calculated from the measured EMF values as a function of temperature according to Equation (7). The determined Gibbs energies of reactions (5) and (6) are formulated as Equations (8) and (9), respectively.
Δr(5)G°/(kJ·mol−1) = −(3.39 ± 0.1) − (22.09 ± 0.5)·10−3·T/K, (308 < T/K < 367)
Δr(6)G°/(kJ·mol−1) = (3.79 ± 0.1) − (41.25 ± 1)·10−3·T/K, (382 < T/K < 402)
The calculated Gibbs energy in Equation (9) is per mole of the actual formula (Ag1.01Cu0.99)S (i.e., (Ag,Cu)2S in reaction (6)).
By combining Δr(5)G° values of reactions (5), i.e., Equation (8), with the molar Gibbs energies of the pure substances obtained from [41], standard Gibbs energies of formation of Ag1.2Cu0.8S were determined to be:
ΔfG°/(kJ·mol−1) = −(50.2 ± 1) − (19.1 ± 0.4)·10−3·T/K, (308 < T/K < 367)
The Gibbs energies of formation of Ag1.2Cu0.8S determined in this work are in fair agreement with those experimentally determined values of Schmidt and Sagua [34] for the similar temperature range. We have also calculated the Gibbs energies of formation of Ag1.2Cu0.8S by applying the Craig and Barton [42] approximation method developed for estimating the Gibbs energies of sulfosalts from simple sulfides, assuming ideal mixing of simple sulfides to form sulfosalts of intermediate composition. To estimate ∆mixG° = ∆mixH° − ∆mixS°∙T, they assumed zero enthalpy of mixing (∆mixH° = 0). Their proposed formula is:
ΔfG°sulfosalt/(kJ·mol−1) = Σ1n(xi·ΔfG°sulfide) − (5.02 ± 3.35)·(R·T·Σ1n(xi·lnxi)),
where xi is number of moles of the component sulfide.
In the calculation of the Gibbs energies of formation of Ag1.2Cu0.8S, we used the Gibbs energies for Cu2S and Ag2S provided in the handbook of Barin [41]. The largest variation of the standard thermodynamic quantities between the experimentally determined and calculated values in this work and the literature value is observed for entropy. A comparative summary of the standard Gibbs energy, enthalpy and entropy values is presented in Table 3.
The Gibbs energy data derived in this study can be utilized in the phase diagram modeling of the Ag-Cu-S system, including the Ag2S-Cu2S system presented in the following section. These thermochemical data can also be extrapolated to different temperature ranges and used to determine the energetics of processes, such as oxidation reactions in the pyrometallurgical processes.

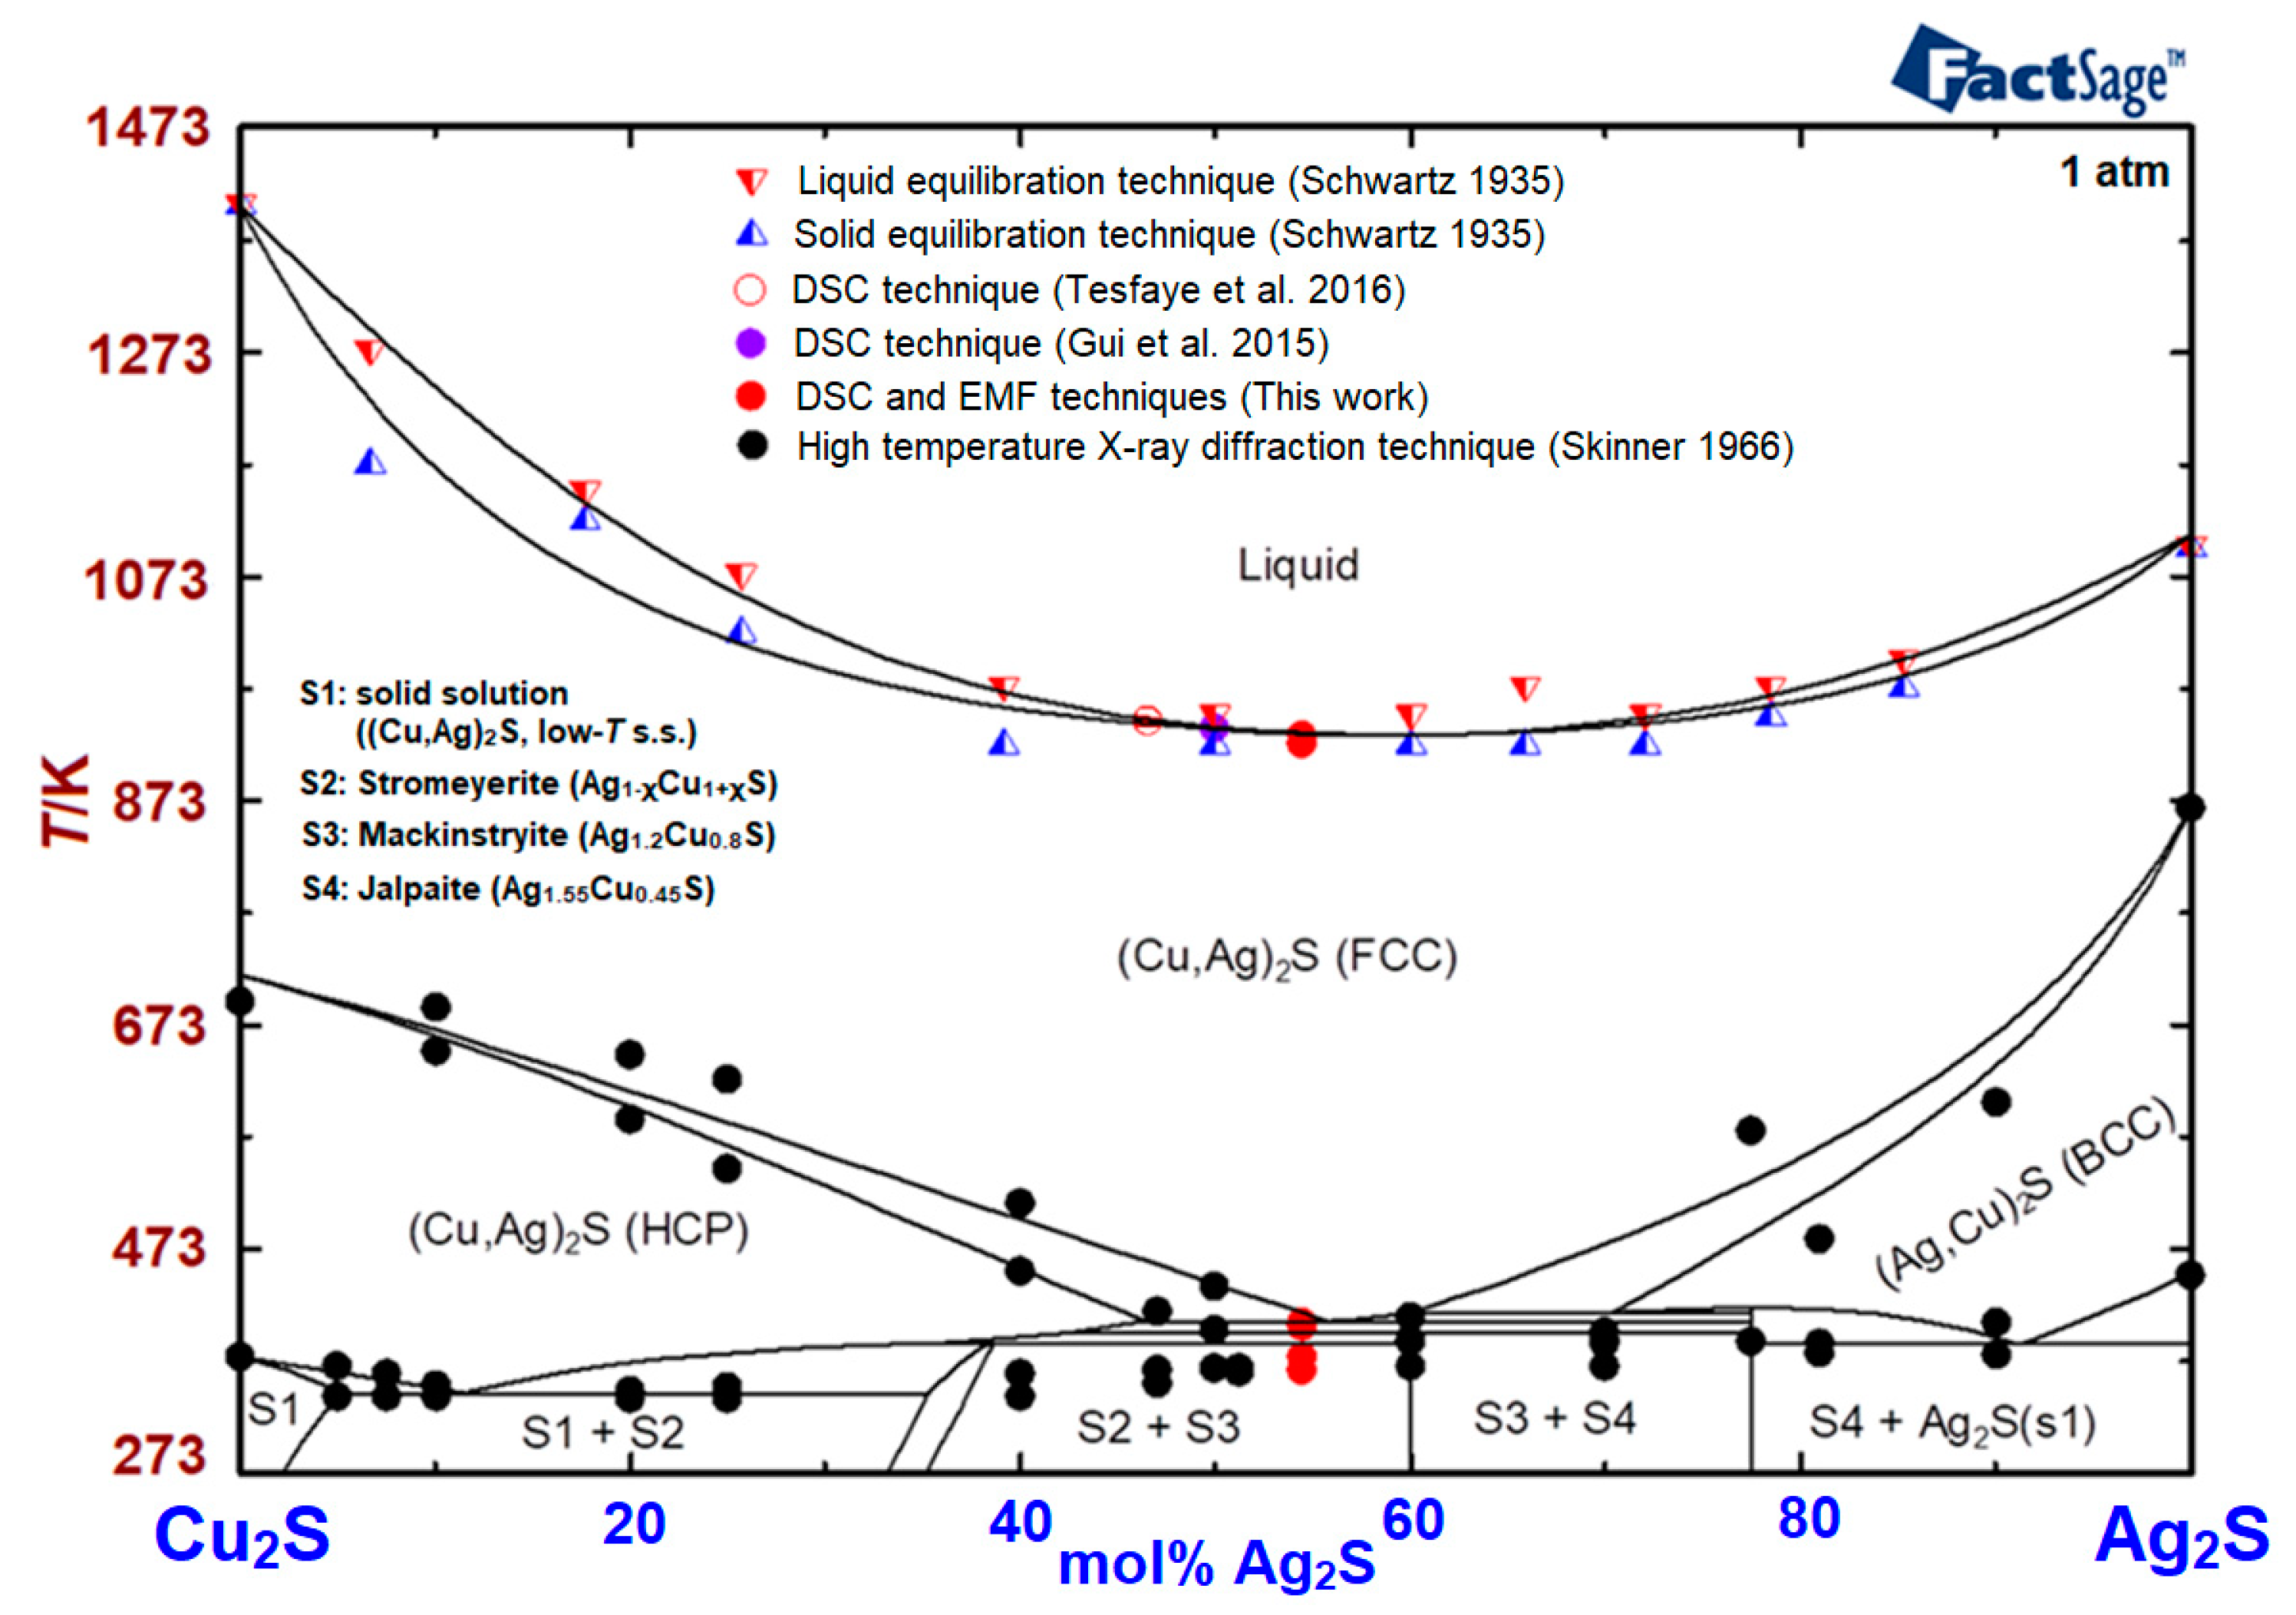
4.3. Results of Thermodynamic Calculations for Optimization

The phase diagram of the Ag2S-Cu2S system has been optimized using the FactSage software package. The optimization includes both the literature data and the DSC and EMF measurement results in this work. Figure 9 depicts the optimized phase diagram at 1 atm, together with superimposed literature data and experimental values determined in this work. The low temperature range consists of fifteen stable solid phase regions. To reveal the narrow and complex phase regions, calculations were made between 273 and 430 K (Figure 10).
In general, the literature and experimental data for the liquidus and solidus boundaries are precise and consistent with the thermodynamic modeling. The literature data in the lower temperatures, particularly in the Ag2S-rich part, of the phase diagram are scarcer and scattered. A summary of the experimentally determined and optimized thermodynamic properties in this work is presented in Table 4. The difference between the optimized and experimentally determined temperatures for the transition from AgCuS to (Ag,Cu)2S(HCP) is about 12 K. This difference could be due to the saturation of the phases with different phases, saturation with Ag1.2Cu0.8S in the modeling and with CuS in the EMF experiment. In the case of the transition from Ag1.2Cu0.8S to Ag1.55Cu0.45S in the presence of (Ag,Cu)2S(HCP), in both cases, the temperature difference is only about 4 K, hence, in good agreement.
Compared to the phase diagram proposed by Chang et al. [20] in the late 1970s, in the higher temperature range, our model presents lower solidus and liquidus boundaries, for most parts of the compositional ranges. However, our optimized direct melting temperatures for the (Ag,Cu)2S solid solutions is in good agreement with the proposed phase diagram of Chang et al. [20]. In the lower temperature range, the biggest difference is in the phase boundary of the phase region where Ag1.2Cu0.8S and AgCuS are in equilibrium. There is also a shift for the stromeyerite solubility limit narrow region to the Cu2S-richer region. Compared to the phase diagram of Chang et al. [20], the (Ag,Cu)2S(BCC) + (Cu,Ag)2S(FCC) phase equilibrium in the new phase diagram is narrower and lower on the temperature scale. The solubility limit of Ag2S in the βCu2S phase (denoted as S1) is also observed to be more than double in the new model compared to the phase diagram proposed by Chang et al. [20].

5. Conclusions

Thermal stabilities of selected ternary phases in the Ag2S-richer part of the Ag-Cu sulfide system have been studied with the DSC-TGA and EMF techniques. The ternary compounds Ag1.2Cu0.8S and AgCuS were equilibrated through high-temperature reaction of the pure Cu2S and Ag2S under vacuum condition. The samples were characterized and then thermally analyzed with the DSC-TGA and EMF techniques under different conditions. From the obtained measurement results, thermodynamic properties of the equilibrium phases have been determined. The determined phase transition temperatures were compared with the available literature values. New data for enthalpy of fusion of the Ag-richer solid solution (Ag,Cu)2S have been determined. From the EMF measurements, we derived the phase transformation AgCuS ⇄ (Ag,Cu)2S(HCP) in the presence of CuS to be 375 ± 1 K and standard Gibbs energies of formation of Ag1.2Cu0.8S below 375 K to be ΔfG°/(kJ·mol−1) = −(50.2 ± 1) − (19.1 ± 0.4)·10−3·T/K. These phase transition properties determined through the two techniques can help to define user limit temperature range for devices incorporating the Ag-Cu-S-ternary phases as functional materials, and the Gibbs energy data can be utilized to determine the energetics of processes such as oxidation reactions in the pyrometallurgical processes.
The experimental results compiled in this work and the critically reviewed literature data incorporating recently published works were combined together with the pure substance database of FactSage version 7.1 to model the latest phase diagram of the Ag2S-Cu2S system. The major differences between the only available phase diagram in the literature, modeled in the late 1970s, and in this work are on the solidus and liquidus temperatures and the phase stability regions where Ag1.2Cu0.8S and AgCuS are in equilibrium.

Author Contributions

Conceptualization, F.T., D.L. and D.S.; methodology, F.T., D.L., D.S. and P.T.; formal analysis, F.T. and D.L.; investigation, F.T., D.L. and L.H.; writing—original draft, F.T.; writing—review and editing, D.L., L.H., D.S. and P.T.; supervision, D.L., L.H. and P.T.; project administration, F.T., D.L. and L.H.; funding acquisition, F.T., D.L., L.H. and P.T. All authors have read and agreed to the published version of the manuscript.

Funding

This research was funded by the Academy of Finland project “Thermodynamic investigation of complex inorganic material systems for improved renewable energy and metals production processes”, Decision number 311537, as part of the Johan Gadolin Process Chemistry Center activities at Åbo Akademi University. The APC was funded by Åbo Akademi University.

Institutional Review Board Statement

Not applicable.

Informed Consent Statement

Not applicable.

Data Availability Statement

Data is contained within the article.

Conflicts of Interest

The authors declare no conflict of interest.

References

  1. Najdenov, I.; Raić, K.T.; Kokeza, G. Aspects of energy reduction by autogenous copper production in the copper smelting plant Bor. Energy 2012, 43, 376–384. [Google Scholar] [CrossRef]
  2. Tesfaye, F.; Lindberg, D.; Hamuyuni, J. Valuable metals and energy recovery from electronic waste streams. In Energy Technology 2017 (The Minerals, Metals & Materials Series), 1st ed.; Zhang, L., Drelich, J.W., Neelameggham, N.R., Guillen, D.P., Haque, N., Zhu, J., Sun, Z., Wang, T., Howarter, J.A., Tesfaye, F., et al., Eds.; Springer: Cham, Switzerland, 2017; Volume 1, pp. 103–116. [Google Scholar]
  3. Craig, J.R.; Kullerud, G. The Cu-Zn-S System. Miner. Depos. 1973, 8, 81–91. [Google Scholar] [CrossRef]
  4. Tesfaye, F.; Lindberg, D.; Taskinen, P. Solid state electrochemical and calorimetric study of the equilibrium phase (Cu,Ag)2S. J. Chem. Thermodyn. 2016, 94, 101–109. [Google Scholar] [CrossRef]
  5. Feng, D.; Taskinen, P. Silver Selenide Thermodynamics for Copper Anode Slime Refining. In REWAS 2013; Kvithyld, A., Meskers, C., Kirchain, R., Krumdick, G., Mishra, B., Reuter, M., Wang, C., Schlesinger, M., Gaustad, G., Lados, D., et al., Eds.; Springer: Cham, Switzerland, 2013; pp. 133–139. [Google Scholar]
  6. Guin, S.N.; Biswas, K. Temperature driven p-n-p type conduction switching materials:current trends and future directions. Phys. Chem. Chem. Phys. 2015, 17, 10316–10325. [Google Scholar] [CrossRef]
  7. Keen, D.A. Disordering phenomena in superionic conductors. J. Phys. Condens. Matter 2002, 14, 19–57. [Google Scholar] [CrossRef]
  8. Guin, S.N.; Pan, J.; Bhowmik, A.; Sanyal, D.; Waghmare, U.V.; Biswas, K. Temperature dependent reversible p-n-p type conduction switching with colossal change in thermopower of semiconducting AgCuS. J. Am. Chem. Soc. 2014, 136, 12712–12720. [Google Scholar] [CrossRef]
  9. Lange, S.; Nilges, T. Ag10Te4Br3: A New Silver(I) (poly)-Chalcogenide Halide Solid Electrolyte. Chem. Mater. 2006, 18, 2538–2544. [Google Scholar] [CrossRef]
  10. Perez, S.D.; Garcia, M.A.; Garcia, M.D.; Domene, G.B.; Mühle, C.; Jansen, M. Structural phase transitions on AgCuS stromeyerite mineral under compression. Inorg. Chem. 2013, 52, 355–361. [Google Scholar] [CrossRef]
  11. Trots, M.; Senyshyn, A.; Mikhailova, D.A.; Knapp, M.; Baehtz, C.; Hoelzel, M.; Fuess, H. High-temperature thermal expansion and structural behaviour of stromeyerite, AgCuS. J. Phys. Condens. Matter 2007, 19, 136204. [Google Scholar] [CrossRef] [Green Version]
  12. Kadrgulov, R.F.; Yakshibaev, R.A.; Khasanov, M.A. Phase relations, ionic transport and diffusion in the alloys of Cu2S-Ag2S mixed conductors. Ionics 2001, 7, 156–160. [Google Scholar] [CrossRef]
  13. Zhu, H.; Lian, C.; Wu, D. Room-temperature synthesis of (Ag,Cu)2S hollow spheres by cation exchange and their optical properties. Mater. Chem. Phys. 2011, 127, 24–27. [Google Scholar]
  14. Dutta, M.; Sanyal, D.; Biswas, K. Tuning of p–n–p-Type Conduction in AgCuS through Cation Vacancy: Thermopower and Positron Annihilation Spectroscopy Investigations. Inorg. Chem. 2018, 57, 7481–7489. [Google Scholar] [CrossRef] [PubMed]
  15. Shin, D.; Lee, S.; Kim, D.R.; Park, J.H.; Kim, Y.; Choi, W.-J.; Son, C.S.; Son, Y.G.; Hwang, D. Effect of RF Power on the Properties of Sputtered-CuS Thin Films for Photovoltaic Applications. Energies 2020, 13, 688. [Google Scholar] [CrossRef] [Green Version]
  16. Tesfaye, F.; Taskinen, P. Thermodynamic properties of equilibrium phases in the Ag-Cu-S system below 500 K: Experimental Study. In EPD Congress 2014; Yurko, J., Zhang, L., Allanore, A., Wang, C., Spangenberger, J.S., Kirchain, R.E., Downey, J.P., May, L.D., Eds.; John Wiley & Sons, Inc.: Hoboken, NJ, USA, 2014; pp. 181–193. [Google Scholar]
  17. Fleet, M. Phase Equilibria at High Temperature. Rev. Mineral. Geochem. 2006, 61, 365–419. [Google Scholar] [CrossRef]
  18. Skinner, B.J. The System Cu-Ag-S. Econ. Geol. 1966, 6, 11–26. [Google Scholar] [CrossRef]
  19. Sharma, R.C.; Chang, Y.A. Ag–S (silver–sulfur). In Binary Alloy Phase Diagrams, 2nd ed.; Massalski, T.B., Okamoto, H., Subramanian, P.R., Kacprzak, L., Eds.; ASM International: Novelty, OH, USA, 1990; pp. 86–87. [Google Scholar]
  20. Chang, Y.A.; Neumann, J.P.; Choudary, U.V. Phase Diagrams and Thermodynamic Properties of Ternary Copper–Sulfur–Metal Systems; INCRA Monograph VII; The Metallurgy of Copper, NBS: Washington, DC, USA, 1979; pp. 191–193. [Google Scholar]
  21. Wu, D. Phase Relations in the System Ag2S-Cu2S-PbS and Ag2S-Cu2S-Bi2S3, and Their Mineral Assemblages. Chin. J. Geochem. 1987, 6, 225–233. [Google Scholar]
  22. Djurle, S. An X-Ray Study on the System Ag-Cu-S. Acta Chem. Stand. 1958, 12, 1427–1436. [Google Scholar] [CrossRef]
  23. Frueh, A.J. The crystal structure of stromeyerite, AgCuS: A possible defect structure. Jr. Z. Kristallogr. 1955, 106, 299–307. [Google Scholar] [CrossRef]
  24. Skomorokhov, A.N.; Trots, D.M.; Ovchinnikov, S.G.; Fuess, H. Lattice vibrations in an α- and β-AgCuS superionic conductor: Experimental time-of-flight inelastic neutron scattering studies. J. Phys. Condens. Matter 2007, 19, 186228. [Google Scholar] [CrossRef] [PubMed]
  25. Takuhara, Y.; Tezuka, K.; Shan, Y.J.; Imoto, H.J. Syntheses of complex sulfides AgCuS and Ag3CuS2 from the elements under hydrothermal conditions. Ceram. Soc. Jpn. 2009, 117, 359–362. [Google Scholar] [CrossRef] [Green Version]
  26. Schmidt, J.A.; Sagua, A.E. Thermodynamic quantities for the ternary compound Stromeyerite: Cu1+δAg1-δS for 0 ≤ δ ≤ 0.1. J. Chem. Thermodyn. 1993, 25, 1453–1459. [Google Scholar] [CrossRef]
  27. Sack, R.O.; Ebel, D.S. Thermochemistry of sulfide mineral solutions. Rev. Mineral. Geochem. 2006, 61, 265–364. [Google Scholar] [CrossRef]
  28. Harlov, D.E.; Sack, R.O. Thermochemistry of Ag2S-Cu2S sulfide solutions: Constraints derived from coexisting Sb2S3- and As2S3-bearing sulfosalts. Geochim. Cosmochim. Acta 1995, 59, 4351–4365. [Google Scholar] [CrossRef]
  29. Schwartz, G.M. Relationship of Chalcocite–Stromeyerite-Argentite. Econ. Geo. 1935, 30, 128–146. [Google Scholar] [CrossRef]
  30. Perrot, P.; Jeannot, C. Relations activite-composition dans les solutions solides Ag2S-Cu2S. Rev. De Chim. Miner. 1971, 8, 87–97. [Google Scholar]
  31. Werner, A. Untersuchungen am System Kupfer-Silber-Schwefel. Z. Für. Phys. Chem. Neue Folge Bd. 1965, 47, 267–285. [Google Scholar] [CrossRef]
  32. Schmidt, J.A.; Sagua, A.E.; Bazan, J.C. Phase equilibrium of (CuS + Ag2S + Ag1.55Cu0.45S) and thermodynamic quantities for the ternary-phase Jalpaite from e.m.f. measurements in solid-state galvanic cells. J. Chem. Thermodyn. 1990, 22, 181–187. [Google Scholar] [CrossRef]
  33. Sagua, A.E.; Schmidt, J.A. Thermodynamic quantities for the ternary compound Jalpaita: Ag1.5 + xCu0.5-xS for 0 <= x <= 0.05. An. Asoc. Quim. Argent. 1997, 85, 197–201. [Google Scholar]
  34. Schmidt, J.A.; Sagua, A.E. Phase equilibrium of (Ag1.55Cu0.45S + Ag1.2Cu0.8S + CuS) and thermodynamic quantities for the ternary phase Ag1.2Cu0.8S. J. Chem. Thermodyn. 1990, 22, 1207–1212. [Google Scholar] [CrossRef]
  35. García, C.; Franco, J.; López Tonazzi, J.; Walsöe de Reca, N. Conductivity behavior of RbAg4I5. Solid State Ion. 1983, 9–10, 1233–1236. [Google Scholar] [CrossRef]
  36. Ipser, H.; Mikula, A.; Katayama, I. Overview: The emf method as a source of experimental thermodynamic data. Calphad 2010, 34, 271–278. [Google Scholar] [CrossRef]
  37. SGTE Substance Database. Scientific Group Thermodata Europe. Available online: https://www.sgte.net/en/neu (accessed on 5 May 2021).
  38. Bale, C.W.; Bélisle, E.; Chartrand, P.; Decterov, S.A.; Eriksson, G.; Gheribi, A.E.; Hack, K.; Jung, I.-H.; Kang, Y.B.; Melançon, J.; et al. FactSage thermochemical software and databases, 2010–2016. Calphad 2016, 54, 35–53. [Google Scholar] [CrossRef] [Green Version]
  39. Tesfaye, F.; Lindberg, D.; Moroz, M.; Hupa, L. Investigation of the K-Mg-Ca Sulfate System as Part of Monitoring Problematic Phase Formations in Renewable-Energy Power Plants. Energies 2020, 13, 5366. [Google Scholar] [CrossRef]
  40. Mohr, P.J.M.; Newell, D.B.; Taylor, B.N. CODATA Recommended Values of the Fundamental Physical Constants: 2014; National Institute of Standards and Technology: Gaithersburg, ML, USA, 2015; pp. 1–11. [Google Scholar]
  41. Barin, I. Thermochemical Data of Pure Substances. Part I & II; VCH Verlagsgesellschaft: Weinheim, Germany; VCH Publishers: New York, NY, USA, 1989. [Google Scholar]
  42. Craig, J.R.; Barton, P.B. Thermochemical approximations for sulfosalts. Econ. Geol. 1973, 68, 493–506. [Google Scholar] [CrossRef]
Figure 1. A scanning electron microscope (SEM) secondary electron image of the material synthesized; light gray—Ag1.2Cu0.8S, dark gray—AgCuS, and black—pores.
Energies 15 00593 g001
Figure 2. (a) Sample preparation for the differential scanning calorimetry-thermogravimetric analysis (DSC-TGA) measurements, and (b) the two-step experimental procedure in the DSC-TGA measurements.
Energies 15 00593 g002
Figure 3. A portion of isothermal phase diagram of the ternary Ag-Cu-S system, below 363 K (illustrated based on the information provided in [4]). Notations: S2 is Ag0.93Cu1.07S (ortho), S3 is Ag1.2Cu0.8S (ortho), S4 is Ag1.55Cu0.45S (bct), and (x) is composition of the cathode material.
Energies 15 00593 g003
Figure 4. The sandwich structured galvanic cell ((A)—freshly prepared, and (B,C)—after the measurement): 1—the test electrode (three phase mixture), 2—the solid electrolyte (RbAg4I5), 3—the reference electrode (Ag foil), 4—the Pt cathode lead wire, and 5—a print of the Pt anode lead wire.
Energies 15 00593 g004
Figure 5. Schematics of the electrochemical setup; 1—vertical resistance furnace, 2—fused silica wok tube, 3—alumina crucible, 4—galvanic cell, 5—Pt anode lead wire, 6—Pt cathode lead wire, 7—upper alumina tube, 8 and 9—Pt100 resistance thermometers, 10—lower alumina tube, 11—alumina disc.
Energies 15 00593 g005
Figure 6. A portion of phase diagram of the binary Ag2S-Cu2S system (depicted based on the information presented in [20]). The red dashed line indicates the temperature range and composition of the sample for which the DSC-TGA measurements were conducted.
Energies 15 00593 g006
Figure 7. The differential scanning calorimetry (DSC) and thermogravimetric analysis (TGA) curves for the synthesized two phases assemblage (Ag1.2Cu0.8S and AgCuS). The red and blue curves represent heating and cooling, respectively. The dashed curves are TGA vs. T and solid curves are DSC vs. T.
Energies 15 00593 g007
Figure 8. A summary of the E vs. T relations measured with the electrochemical cell (cell I), the least square fittings of the experimental points are shown with the solid lines. Notations: —the measurement points attained in the heating cycles, and ○—the measurement points attained in the cooling cycle.
Energies 15 00593 g008
Figure 9. Optimized phase diagram of the Ag2S-Cu2S system with super imposed literature data [4,6,18,29] and the experimental data determined in this work.
Energies 15 00593 g009
Figure 10. Magnified portions of the optimized phase diagram in the temperature range 273–430 K.
Energies 15 00593 g010
Table 1. Purity and provenance of the chemicals consumed in the experiments.
ChemicalPuritySourceCAS No.Form
Ag99.9 wt%Alfa Aesar, Merck (Darmstadt, Germany)7440-22-4Foil
AgI99.9 wt%Alfa Aesar, Merck (Darmstadt, Germany)7783-96-2Powder
Ag2S>99.9 wt%Alfa Aesar, Merck (Darmstadt, Germany)21548-73-2Powder
Ar99.999 vol%Oy AGA Ab (Espoo, Finland)-Compressed gas
CuS99.8 wt%Alfa Aesar, Merck (Darmstadt, Germany)1317-40-4Powder
Cu2S99.5 wt%Alfa Aesar, Merck (Darmstadt Germany)22205-45-4Powder
Pt99.99 wt%Johnson Matthey (Royston, UK) Wire
RbI99.8 wt%Alfa Aesar, Merck (Darmstadt, Germany)7790-29-6Powder
Table 2. A comparative summary of phase transition and melting temperatures for a composition close to the DSC-TGA run in this work. Ttr/melt values from [20] were digitally collected from the phase diagram along the composition of 65 wt% Ag2S.
Ttr/melt/K65 wt% Ag2S [This work]55.4 wt% Ag2S [4]65 wt% Ag2S [20]61 wt% Ag2S [11]61 wt% Ag2S [6]Reaction
Ttr364 ± 1361 ± 1353361365Ag0.93Cu1.07S (ortho) + Ag1.2Cu0.8S ⇄ (Ag,Cu)2S(HCP) + Ag1.2Cu0.8S
Tmelt922 ± 1944 ± 1937936-(Ag,Cu)2S(FCC) ⇄ L
Table 3. A comparative summary of thermodynamic properties of Ag1.2Cu0.8S at 298 K and 1 atm.
ΔfG°/(kJ∙mol−1)ΔfH°/(kJ∙mol−1)ΔfS°/(J∙(K·mol)−1)Reference
−55.9 ± 1−50.2 ± 119.1 ± 0.4This work
−55.5−46.729.67Schmidt and Sagua [34] 1
−50.6−50.50.12Calculated by the Graig and Barton method [42] 2
1 Authors reported a 1% error for the determined quantities. 2 Data for the simple sulfides in a reaction Ag2S + Cu2S = Ag1.2Cu0.8S were adapted from [41].
Table 4. Comparison of the optimized and our experimentally determined thermodynamic properties. Exp. and opt. represent experimental and optimized, respectively.
ReactionTemperature (K)Exp. Method
Exp.Opt.
AgCuS ⇄ (Ag,Cu)2S(HCP) 1375 ± 1387EMF
(Ag,Cu)2S(FCC) 2 ⇄ L922.3 ± 1930DSC-TGA
(Ag,Cu)2S(HCP) 2 + Ag1.2Cu0.8S ⇄ Ag1.55Cu0.45S + (Ag,Cu)2S(HCP) 2402.5 ± 1398DSC-TGA
1 The ratio of Ag/Cu = 1.01/0.99. 2 The ratio of Ag/Cu = 1.09/0.91.
Publisher’s Note: MDPI stays neutral with regard to jurisdictional claims in published maps and institutional affiliations.

