
Thermoeconomic Diagnosis of the Sequential Combustion Gas Turbine ABB/Alstom GT24

 , , , and
Abstract
:
1. Introduction
2. Case Study
Study Considerations
- The system operates at a steady state.
- The working fluids are considered perfect gases.
- The temperature and pressure of the dead state were T0 = 10 °C and P0 = 0.80 bar.
- The molar composition of natural gas was: 0.9687 CH4; 0.0285 C2H6; 0.0024 C3H8; 0.0003 n-C4H10; and 0.0001 i-C4H10 [11].
- The low heating value (LHV) of natural gas was 49,854.53 kJ/kgfuel.
3. Energy and Exergy Analysis
4. Thermoeconomic Analysis
4.1. Residue Formation Costs
4.2. Process for Allocating Costs to Products and Residue
5. Thermoeconomic Diagnosis
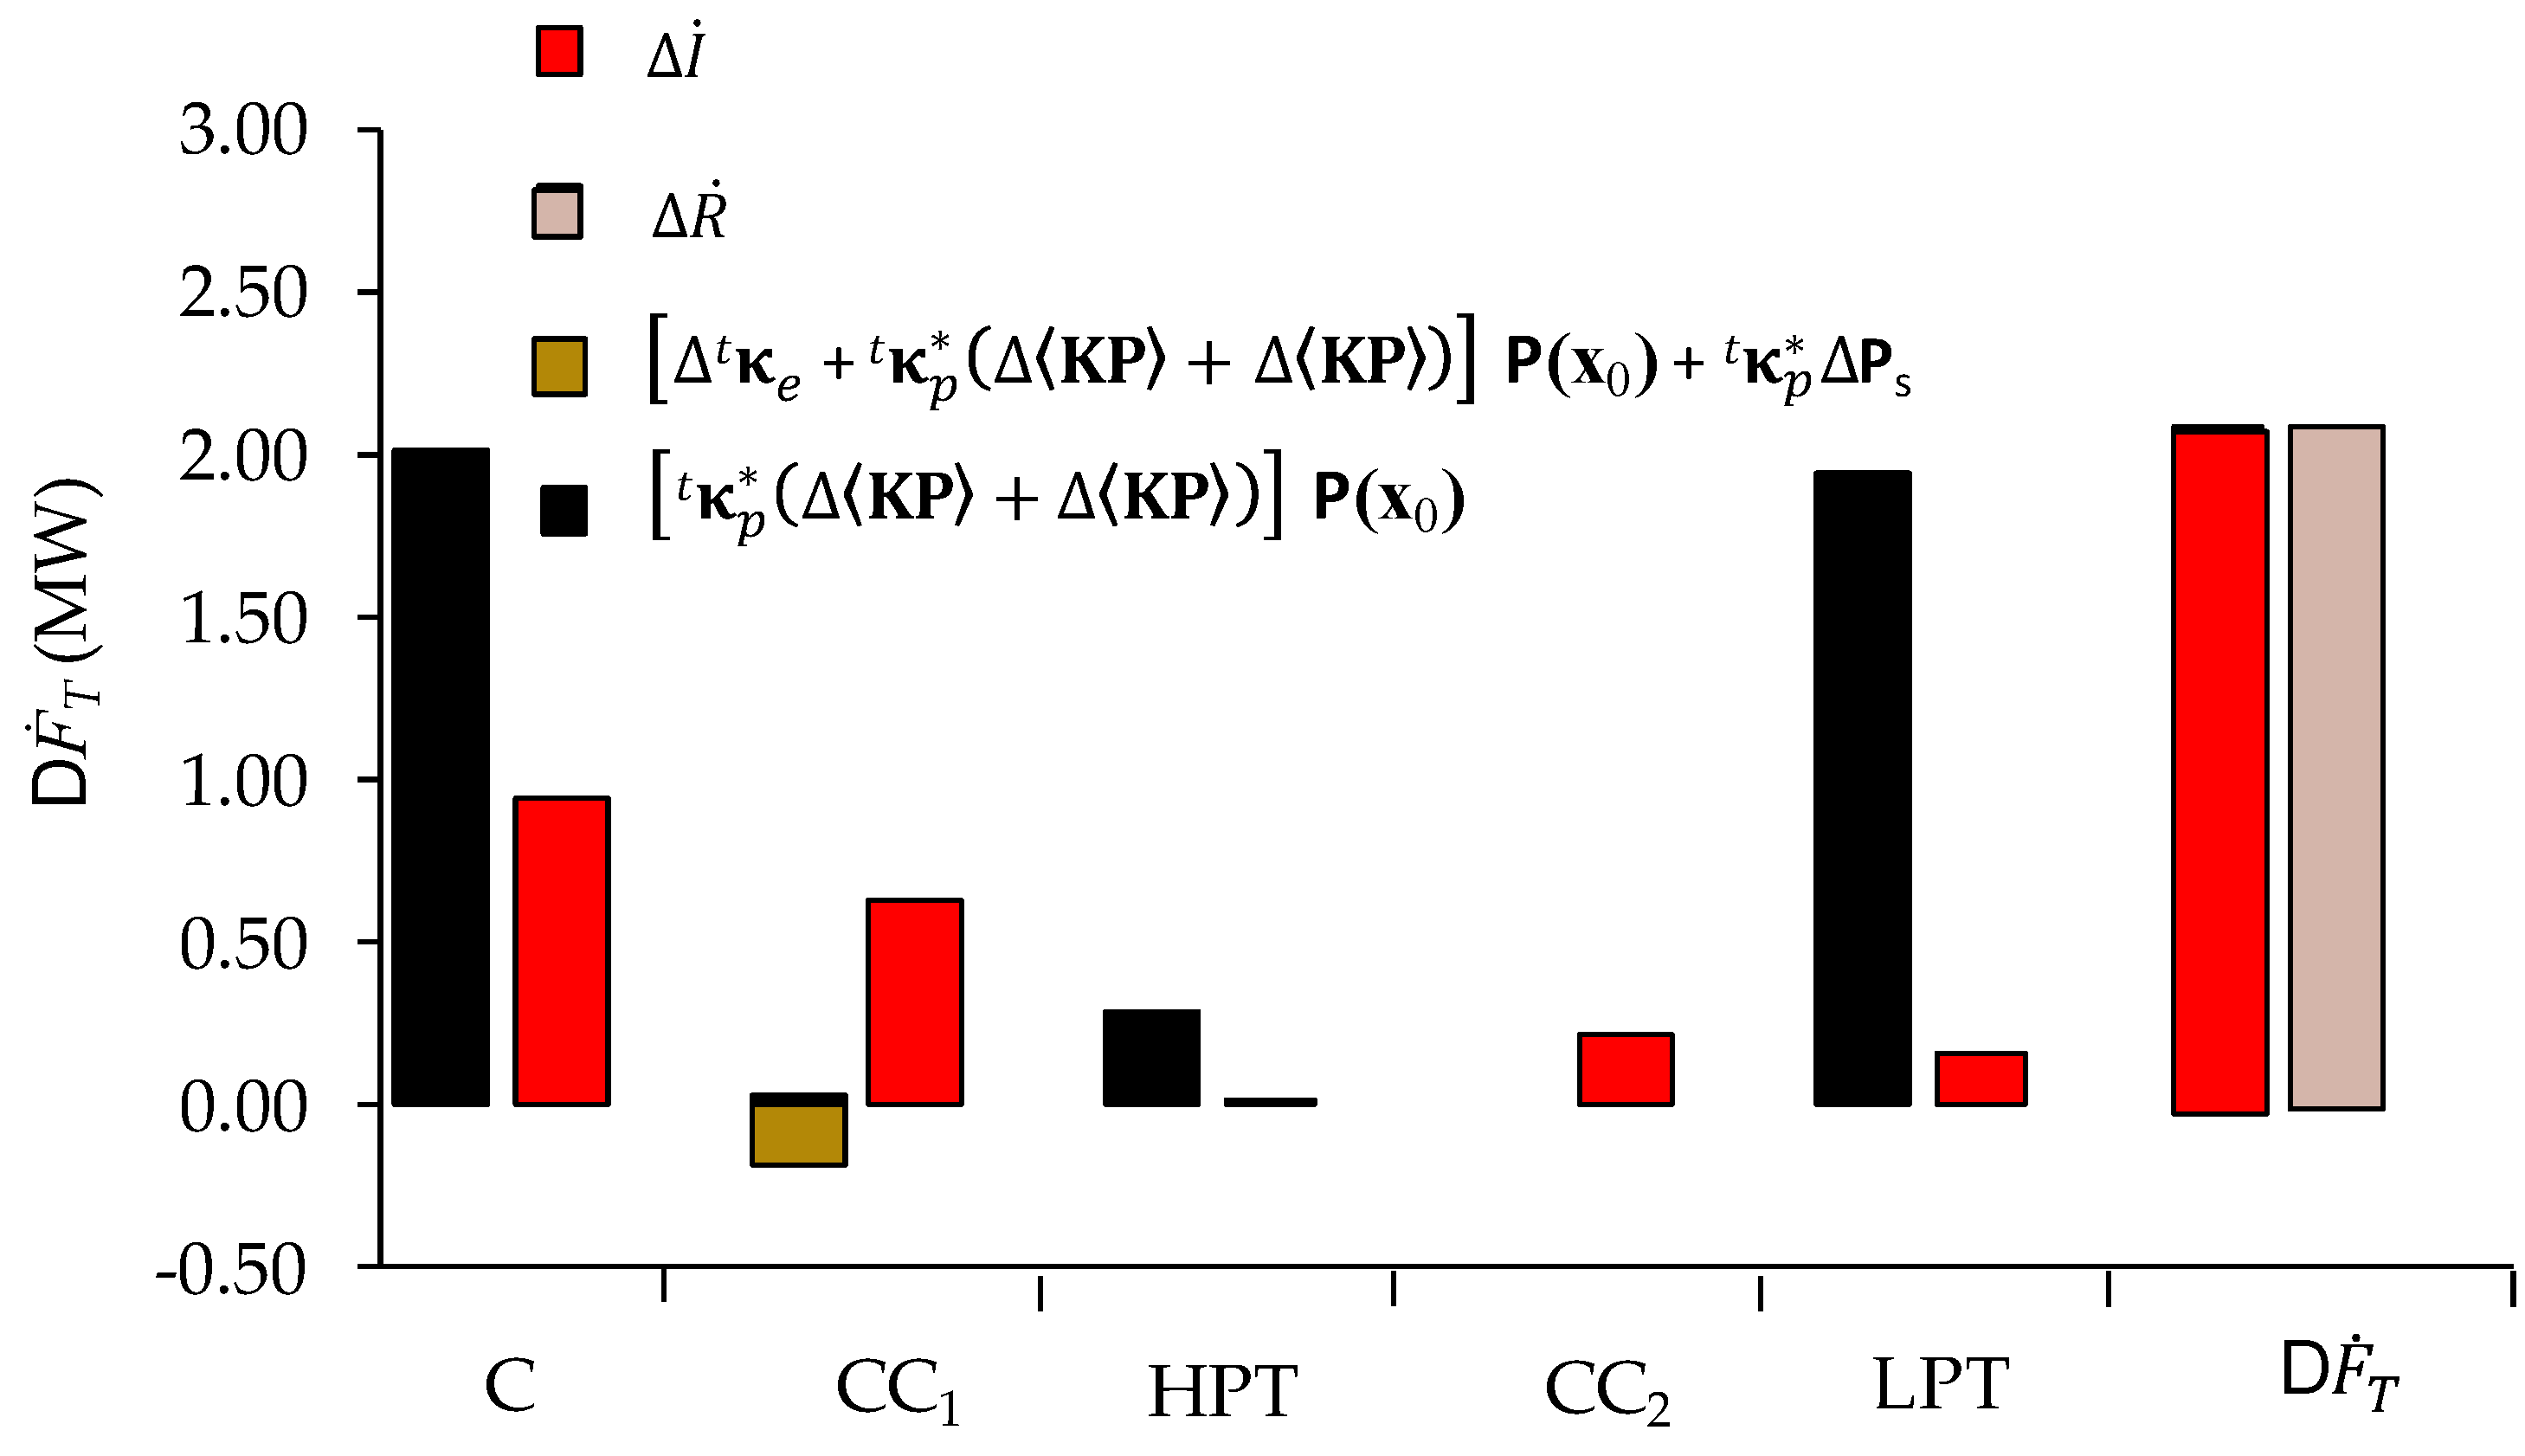
5.1. Fuel impact
- : variation in the unit exergy consumption of external resources, that is, of flows from the environment;
- : the variation in the unit exergy consumption of the component resources, whose exergy cost can be determined by the unit exergy costs of the resources used to compensate for the change in the operating condition;
- : the variation in the unit exergy consumption of the residue, because of the change in the operating condition of the system, which also causes a change in the unit exergy cost of the residue;
- : the variation in the total product of the system caused by the adjustment of the operation of the components before the change in the operating condition of the system.
5.2. Malfunction and Dysfunction Analysis
6. Conclusions
Author Contributions
Funding
Data Availability Statement
Acknowledgments
Conflicts of Interest
References
- Heravi, G.; Salehi, M.M.; Rostami, M. Identifying Cost-Optimal Options for a Typical Residential Nearly Zero Energy Building’s Design in Developing Countries. Clean Technol. Environ. Policy 2020, 22, 2107–2128. [Google Scholar] [CrossRef]
- Ahmadi, P.; Dincer, I. Thermodynamic and Exergoenvironmental Analysis, and Multi-Objective Optimization of a Gas Turbine Power Plant. Appl. Therm. Eng. 2011, 31, 2529–2540. [Google Scholar] [CrossRef]
- Ahmadi, P.; Dincer, I. Thermodynamic Analysis and Thermoeconomic Optimization of a Dual Pressure Combined Cycle Power Plant with a Supplementary Firing Unit. Energy Convers. Manag. 2011, 52, 2296–2308. [Google Scholar] [CrossRef]
- Nadir, M.; Ghenaiet, A. Thermodynamic Optimization of Several (Heat Recovery Steam Generator) HRSG Configurations for a Range of Exhaust Gas Temperatures. Energy 2015, 86, 685–695. [Google Scholar] [CrossRef]
- Frangopoulos, C.A. (Ed.) Exergy, Energy System Analysis and Optimization-Volume II: Thermoeconomic Analysis Modeling, Simulation and Optimization in Energy Systems; EOLSS Publications: Rio de Janeiro, Brazil, 2009; Volume 2. [Google Scholar]
- Ahmadi, P.; Dincer, I. Exergoeconomics. In Comprehensive Energy Systems; Elsevier Inc.: Amsterdam, The Netherlands, 2018; Volume 1–5. [Google Scholar]
- Casarosa, C.; Donatini, F.; Franco, A. Thermoeconomic Optimization of Heat Recovery Steam Generators Operating Parameters for Combined Plants. Energy 2004, 29, 389–414. [Google Scholar] [CrossRef]
- Picallo-Perez, A.; Catrini, P.; Piacentino, A.; Sala, J.M. A Novel Thermoeconomic Analysis under Dynamic Operating Conditions for Space Heating and Cooling Systems. Energy 2019, 180, 819–837. [Google Scholar] [CrossRef]
- Villalón, J.; Torrent, J.; Aragón, E. Termoeconomía y Optimización Energética; Fundación Gómez Pardo: Madrid, Spain, 2009. [Google Scholar]
- Erlach, B. Comparison of Thermoeconomic Methodologies: Structural Theory, AVCO and LIFO. Application to a Combined Cycle; Department of Mechanical Engineering, University of Zaragoza: Zaragoza, Spain, 1998. [Google Scholar]
- Lazzaretto, A.; Tsatsaronis, G. SPECO: A Systematic and General Methodology for Calculating Efficiencies and Costs in Thermal Systems. Energy 2006, 31, 1257–1289. [Google Scholar] [CrossRef]
- Torres, C. Termo-Economía. Curso de Doctorado; Department of Mechanical Engineering, University of Zaragoza: Zaragoza, Spain, 1998. [Google Scholar]
- Torres, C.; Valero, A.; Rangel, V.; Zaleta, A. On the Cost Formation Process of the Residues. Energy 2008, 33, 144–152. [Google Scholar] [CrossRef]
- Agudelo, A.; Valero, A.; Torres, C. Allocation of Waste Cost in Thermoeconomic Analysis. Energy 2012, 45, 634–643. [Google Scholar] [CrossRef]
- Lior, N. Sustainable energy development: A brief introduction to the present situation. In Proceedings of the 24th International Conference on Efficiency, Cost, Optimization, Simulation and Environmental Impact of Energy Systems, ECOS 2011, Novi Sad, Serbia, 4–7 July 2011. [Google Scholar]
- Denise, L.H.; Vicente, T.E.; Sergio, C.; Martín, S.; Teresa, L.; Raúl, L. An Irreversibility-Based Criterion to Determine the Cost Formation of Residues in a Three-Pressure-Level Combined Cycle. Entropy 2020, 22, 299. [Google Scholar] [CrossRef] [PubMed] [Green Version]
- Lozano, M.A.; Valero, A. Thermoeconomic Analysis of a Gas Turbine Cogeneration System; ASME Book No. H00874; ASME: New York, NY, USA, 1993; Volume 30, pp. 312–320. [Google Scholar]
- Seyyedi, S.M.; Ajam, H.; Farahat, S. A New Criterion for the Allocation of Residues Cost in Exergoeconomic Analysis of Energy Systems. Energy 2010, 35, 3474–3482. [Google Scholar] [CrossRef]
- Helen, L.M.; Sergio, C.H.; Martín, S.P.; Javier, V.L.; Vicente, T.G.E.; Raúl, L.L. Residue Cost Formation of a High Bypass Turbofan Engine. Appl. Sci. 2020, 10, 9060. [Google Scholar]
- Torres, C.; Valero, A. The Exergy Cost Theory Revisited. Energies 2021, 14, 1594. [Google Scholar] [CrossRef]
- Lozano, M.A.; Valero, A. Theory of the Exergetic Cost. Energy 1993, 18, 939–960. [Google Scholar] [CrossRef]
- Torres, C.; Valero, A.; Serra, L.; Royo, J. Structural Theory and Thermoeconomic Diagnosis: Part I. Energy Convers. Manag. 2002, 43, 1503–1518. [Google Scholar] [CrossRef]
- Sala, L.; Picallo, A. Operational Diagnosis of Thermal Installations in Buildings. In Exergy Analysis and Thermoeconomics of Buildings; Butterworth-Heinemann: Oxford, UK, 2020; pp. 721–788. [Google Scholar]
- Valero, A.; Correas, L.; Zaleta, A.; Lazzaretto, A.; Verda, V.; Reini, M.; Rangel, V. On the Thermoeconomic Approach to the Diagnosis of Energy System Malfunctions: Part 2. Malfunction Definitions and Assessment. Energy 2004, 29, 1889–1907. [Google Scholar] [CrossRef]
- Carapellucci, R.; Giordano, L. A Comparison between Exergetic and Economic Criteria for Optimizing the Heat Recovery Steam Generators of Gas-Steam Power Plants. Energy 2013, 58, 458–472. [Google Scholar] [CrossRef]
- Perpignan, A.A.; Talboom, M.G.; Levy, Y.; Rao, A.G. Emission modeling of an interturbine burner based on flameless combustion. Energy Fuels 2018, 32, 822–838. [Google Scholar] [CrossRef] [PubMed]
- Sabia, P.; Sorrentino, G.; Ariemma, G.B.; Manna, M.V.; Ragucci, R.; de Joannon, M. MILD combustion and biofuels: A minireview. Energy Fuels 2021, 35, 19901–19919. [Google Scholar] [CrossRef]


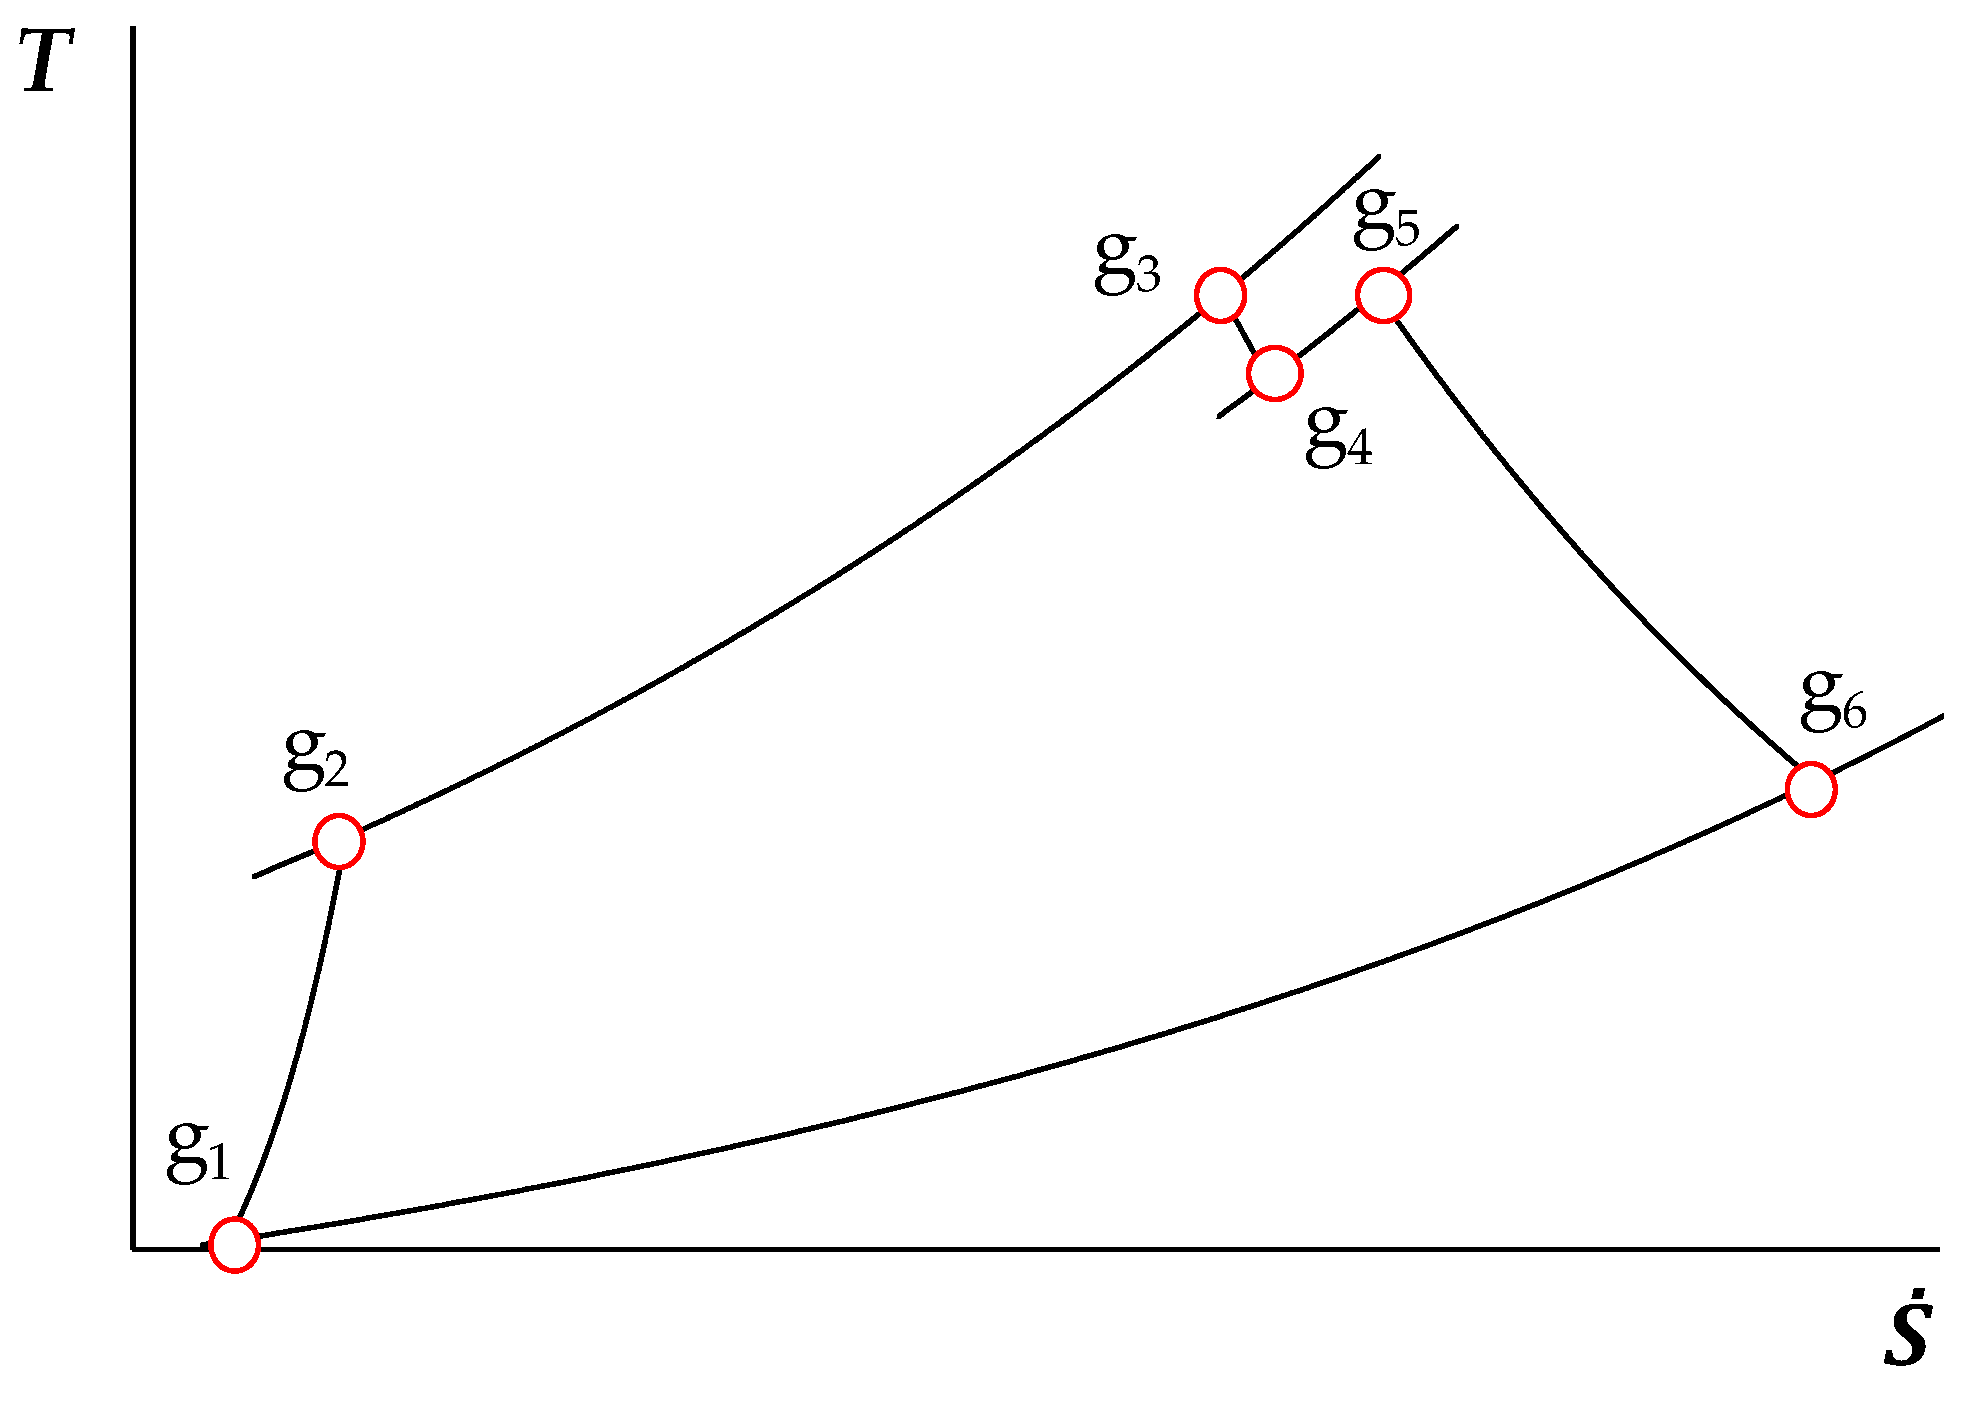
| State | Temperature | Pressure | |
|---|---|---|---|
| g1 | |||
| g2 | |||
| g3 | |||
| g4 | |||
| g5 | |||
| g6 |
| 235,000 | (-) | 0.88 | |
| TIT, (°C) | 1250 | (-) | 0.9 |
| T6, (°C) | 616 | (bar) | 0.04 |
| (-) | 30 | LHV, (kJ/kgfuel) | 49,854.532 |
| cPcg (kJ/kgK) | cVcg (kJ/kgK) | Rcg (kJ/kgK) | gcg (-) | xcg = Rcg/cPcg (-) | |
|---|---|---|---|---|---|
| CC1 | 1.3255 | 1.0331 | 0.2924 | 1.28 | 0.2206 |
| CC2 | 1.4189 | 1.1225 | 0.2964 | 1.26 | 0.2089 |
| State | ṁa (kg/s) | T (K) | P (bar) | (MW) | (MW/K) | (MW) | (MW) |
|---|---|---|---|---|---|---|---|
| g0 | - | 283.15 | 0.80 | - | - | - | - |
| g1 | 440.16 | 283.15 | 0.80 | 0 | 2.91 | 0 | 1.95 |
| g2 | 440.16 | 811.68 | 24.09 | 235.85 | 2.94 | 224.98 | 1.95 |
| g3 | 450.32 | 1523.15 | 23.61 | 742.40 | 3.54 | 583.30 | 7.70 |
| g4 | 450.32 | 1420.54 | 16.58 | 680.96 | 3.54 | 520.49 | 7.70 |
| g5 | 452.72 | 1523.15 | 16.25 | 800.74 | 3.67 | 607.49 | 19.75 |
| g6 | 452.72 | 889.15 | 0.82 | 391.33 | 3.73 | 182.99 | 19.75 |
| Component | (MW) | (MW) | (MW) | (MW) | ηex (-) |
|---|---|---|---|---|---|
| C | 235.85 | 224.98 | 10.86 | 61.42 | 0.95 |
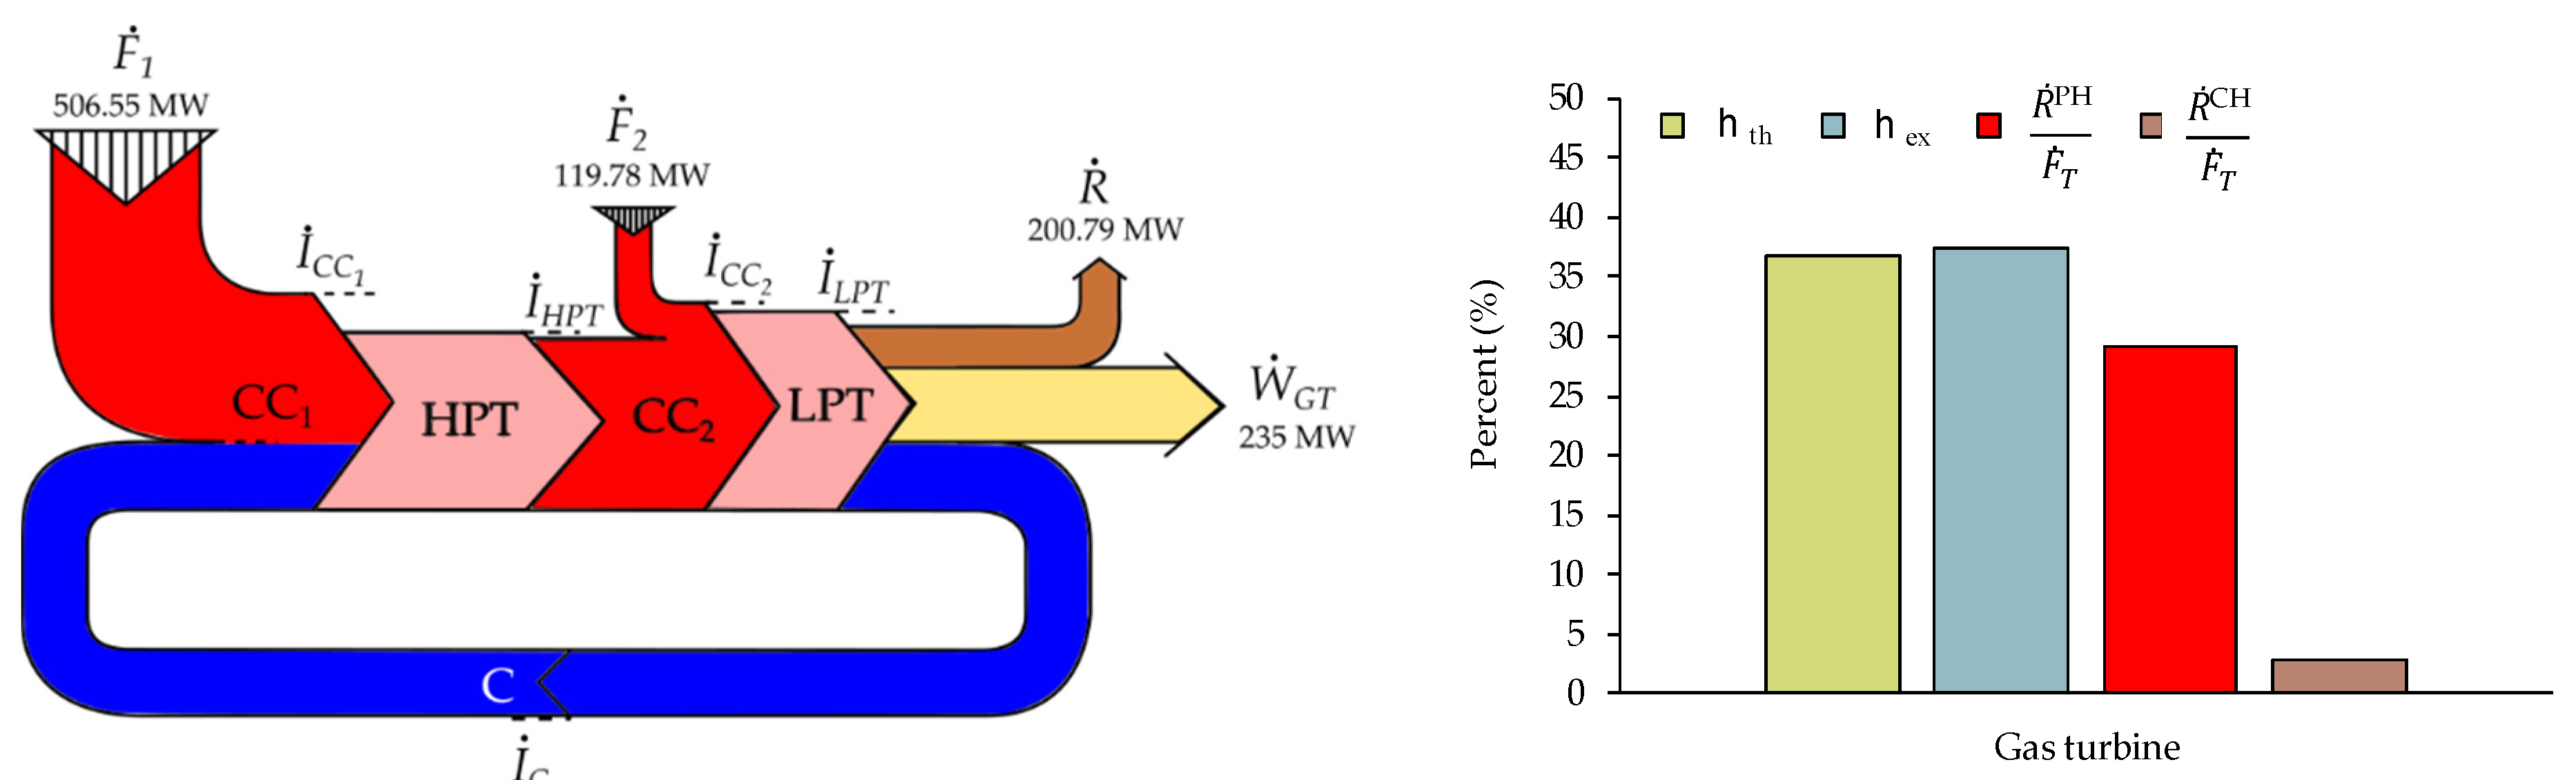
| CC1 | 506.55 | 364.06 | 142.49 | 103.57 | 0.72 |
| HPT | 62.80 | 61.43 | 1.37 | 0 | 0.98 |
| CC2 | 119.78 | 99.05 | 20.73 | 35.80 | 0.83 |
| LPT | 424.50 | 409.41 | 15.09 | 0 | 0.96 |
| GT24 | 626.33 | 235.00 | 190.54 | 200.79 | 0.375 |
| <FP> | <RP> | ||||||||
|---|---|---|---|---|---|---|---|---|---|
| Ḟ0 | ḞC | ḞCC1 | ḞHPT | ḞCC2 | ḞLPT | ḞEG | ṘPH | ṘCH | |
| Ṗ0 | 1.00 | 1.00 | |||||||
| ṖC | 0.34 | 0.34 | 0.34 | ||||||
| ṖCC1 | 0.53 | 0.53 | 0.53 | 0.32 | |||||
| ṖHPT | 0.13 | 0.13 | |||||||
| ṖCC2 | 0.13 | 0.13 | 0.13 | 0.68 | |||||
| ṖLPT | 0.87 | 0.87 | |||||||
| ṖEG1 | 1.00 | ||||||||
| Total | 1.00 | 1.00 | 1.00 | 1.00 | 1.00 | 1.00 | 1.00 | 1.00 | 1.00 |
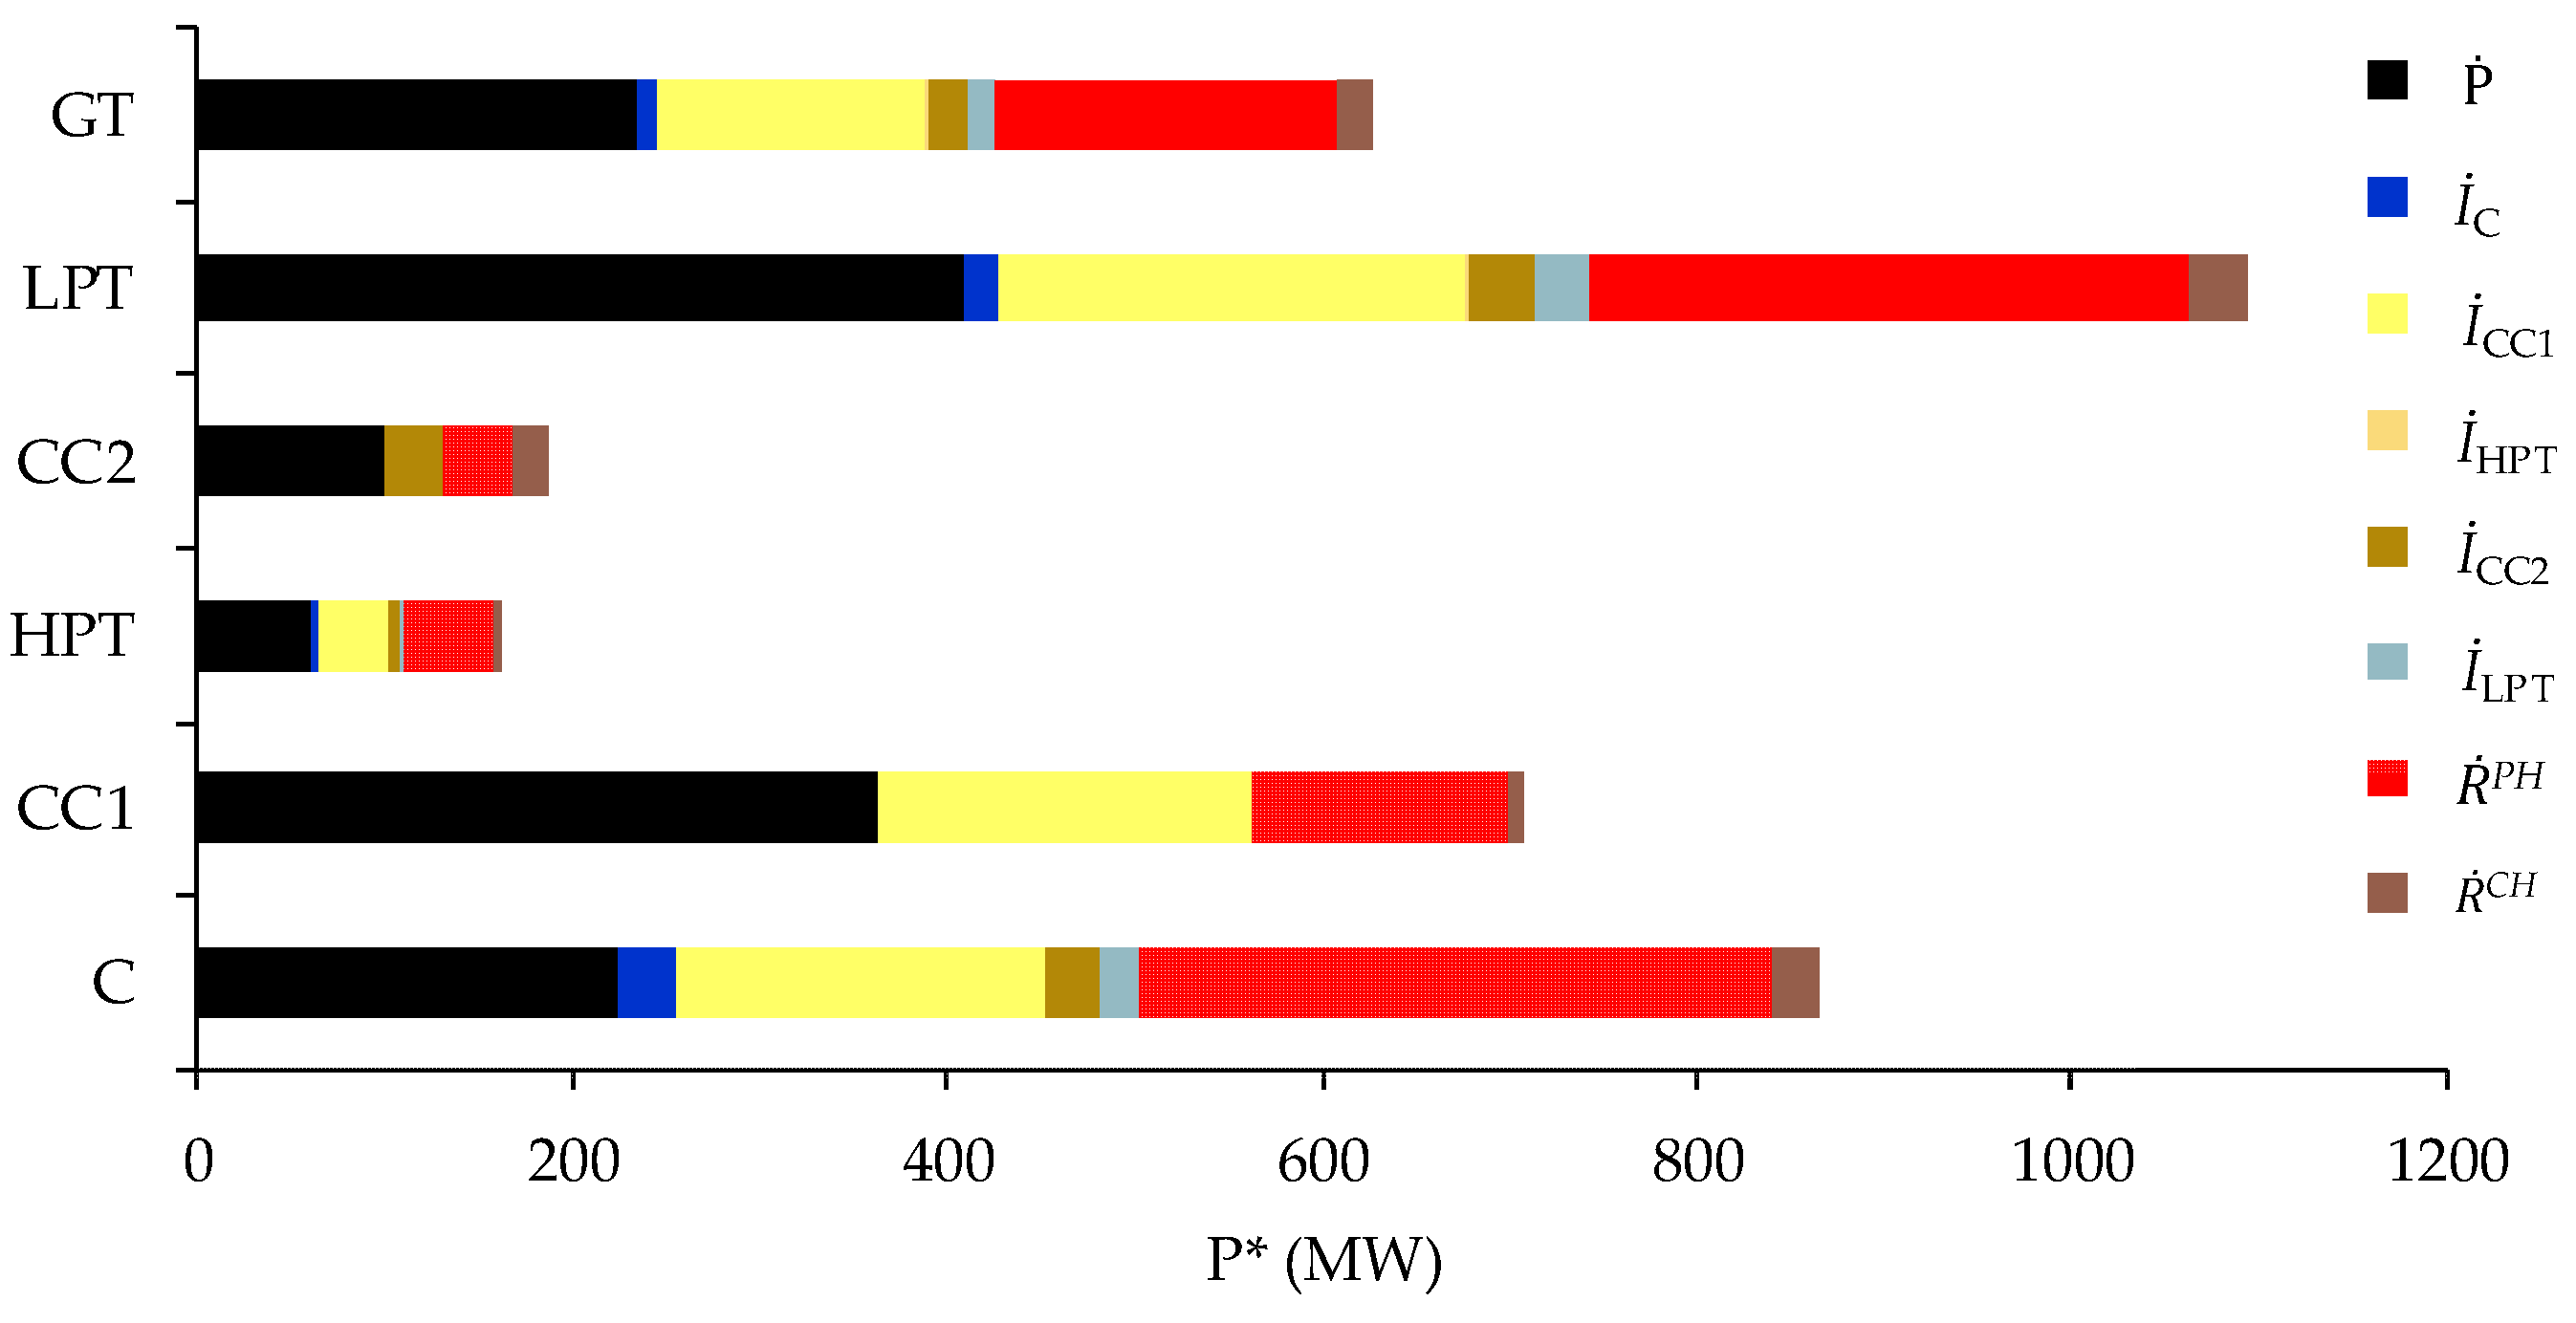
| P* (MW) | F* (MW) | R* (MW) | |
|---|---|---|---|
| C | 864.63 | 628.58 | 236.04 |
| CC1 | 707.95 | 506.55 | 201.40 |
| HPT | 161.73 | 161.73 | 0.00 |
| CC2 | 187.59 | 119.78 | 67.81 |
| LPT | 1093.19 | 1093.19 | 0 |
| GT | 626.33 | 626.33 | 0 |
(USD/h) | (USD/h) | (USD/h) | (USD/h) | (USD/h) | Z (USD/h) | |
|---|---|---|---|---|---|---|
| C | 0 | 16,883.18 | 10,135.06 | 4609.10 | 0 | 2139.02 |
| CC1 | 5328.34 | 7542.28 | 5328.34 | 2026.52 | 119.10 | 68.32 |
| HPT | 0 | 2578.70 | 2448.72 | 0 | 0 | 129.97 |
| CC2 | 1259.96 | 2083.06 | 1259.96 | 499.48 | 253.47 | 70.15 |
| LPT | 0 | 17,655.07 | 16,552.13 | 0 | 0 | 1102.95 |
| TG | 10,098.71 | 10,098.71 | 7507.67 | 3510.41 | ||
| Design | Actual | |||||||
|---|---|---|---|---|---|---|---|---|
| Ḟ | Ṗ | İ | Ṙ | Ḟ | Ṗ | İ | Ṙ | |
| MW | MW | |||||||
| C | 235.85 | 224.98 | 10.86 | 0 | 240.72 | 228.91 | 11.82 | 0 |
| CC1 | 506.55 | 364.06 | 142.49 | 0 | 509.36 | 366.24 | 143.12 | 0 |
| HPT | 62.80 | 61.43 | 1.37 | 0 | 63.45 | 62.07 | 1.38 | 0 |
| CC2 | 119.78 | 99.05 | 20.73 | 0 | 121.02 | 100.08 | 20.94 | 0 |
| LPT | 424.50 | 409.41 | 15.09 | 0 | 428.90 | 413.65 | 15.25 | 0 |
| GT | 626.33 | 235.00 | 190.54 | 200.79 | 630.38 | 235.00 | 192.51 | 202.87 |
| DI | DR | MFt | MRt | DFk | |||
|---|---|---|---|---|---|---|---|
| (MW) | |||||||
| C | 0.95 | 1.07 | −0.40 | 1.15 | 0 | 1.27 | 2.02 |
| CC1 | 0.64 | 0.64 | 0.94 | −1.15 | 0.02 | 1.47 | 1.27 |
| HPT | 0.01 | 0 | −0.10 | 0.10 | 0 | 0.01 | 0.01 |
| CC2 | 0.21 | 0.37 | 0 | 0 | 0 | 0.59 | 0.59 |
| LPT | 0.16 | 0 | −0.65 | 0.65 | 0 | 0.16 | 0.16 |
| 1.97 | 2.08 | −0.21 | 0.75 | 0.02 | 3.49 | 4.05 | |
Publisher’s Note: MDPI stays neutral with regard to jurisdictional claims in published maps and institutional affiliations. |
© 2022 by the authors. Licensee MDPI, Basel, Switzerland. This article is an open access article distributed under the terms and conditions of the Creative Commons Attribution (CC BY) license (https://creativecommons.org/licenses/by/4.0/).
Share and Cite
Castro-Hernández, S.; López-Arenas, T.; Torres-González, E.V.; Lugo-Méndez, H.; Lugo-Leyte, R. Thermoeconomic Diagnosis of the Sequential Combustion Gas Turbine ABB/Alstom GT24. Energies 2022, 15, 631. https://doi.org/10.3390/en15020631
Castro-Hernández S, López-Arenas T, Torres-González EV, Lugo-Méndez H, Lugo-Leyte R. Thermoeconomic Diagnosis of the Sequential Combustion Gas Turbine ABB/Alstom GT24. Energies. 2022; 15(2):631. https://doi.org/10.3390/en15020631
Chicago/Turabian StyleCastro-Hernández, Sergio, Teresa López-Arenas, Edgar Vicente Torres-González, Helen Lugo-Méndez, and Raúl Lugo-Leyte. 2022. "Thermoeconomic Diagnosis of the Sequential Combustion Gas Turbine ABB/Alstom GT24" Energies 15, no. 2: 631. https://doi.org/10.3390/en15020631