3.1. Linear Regression
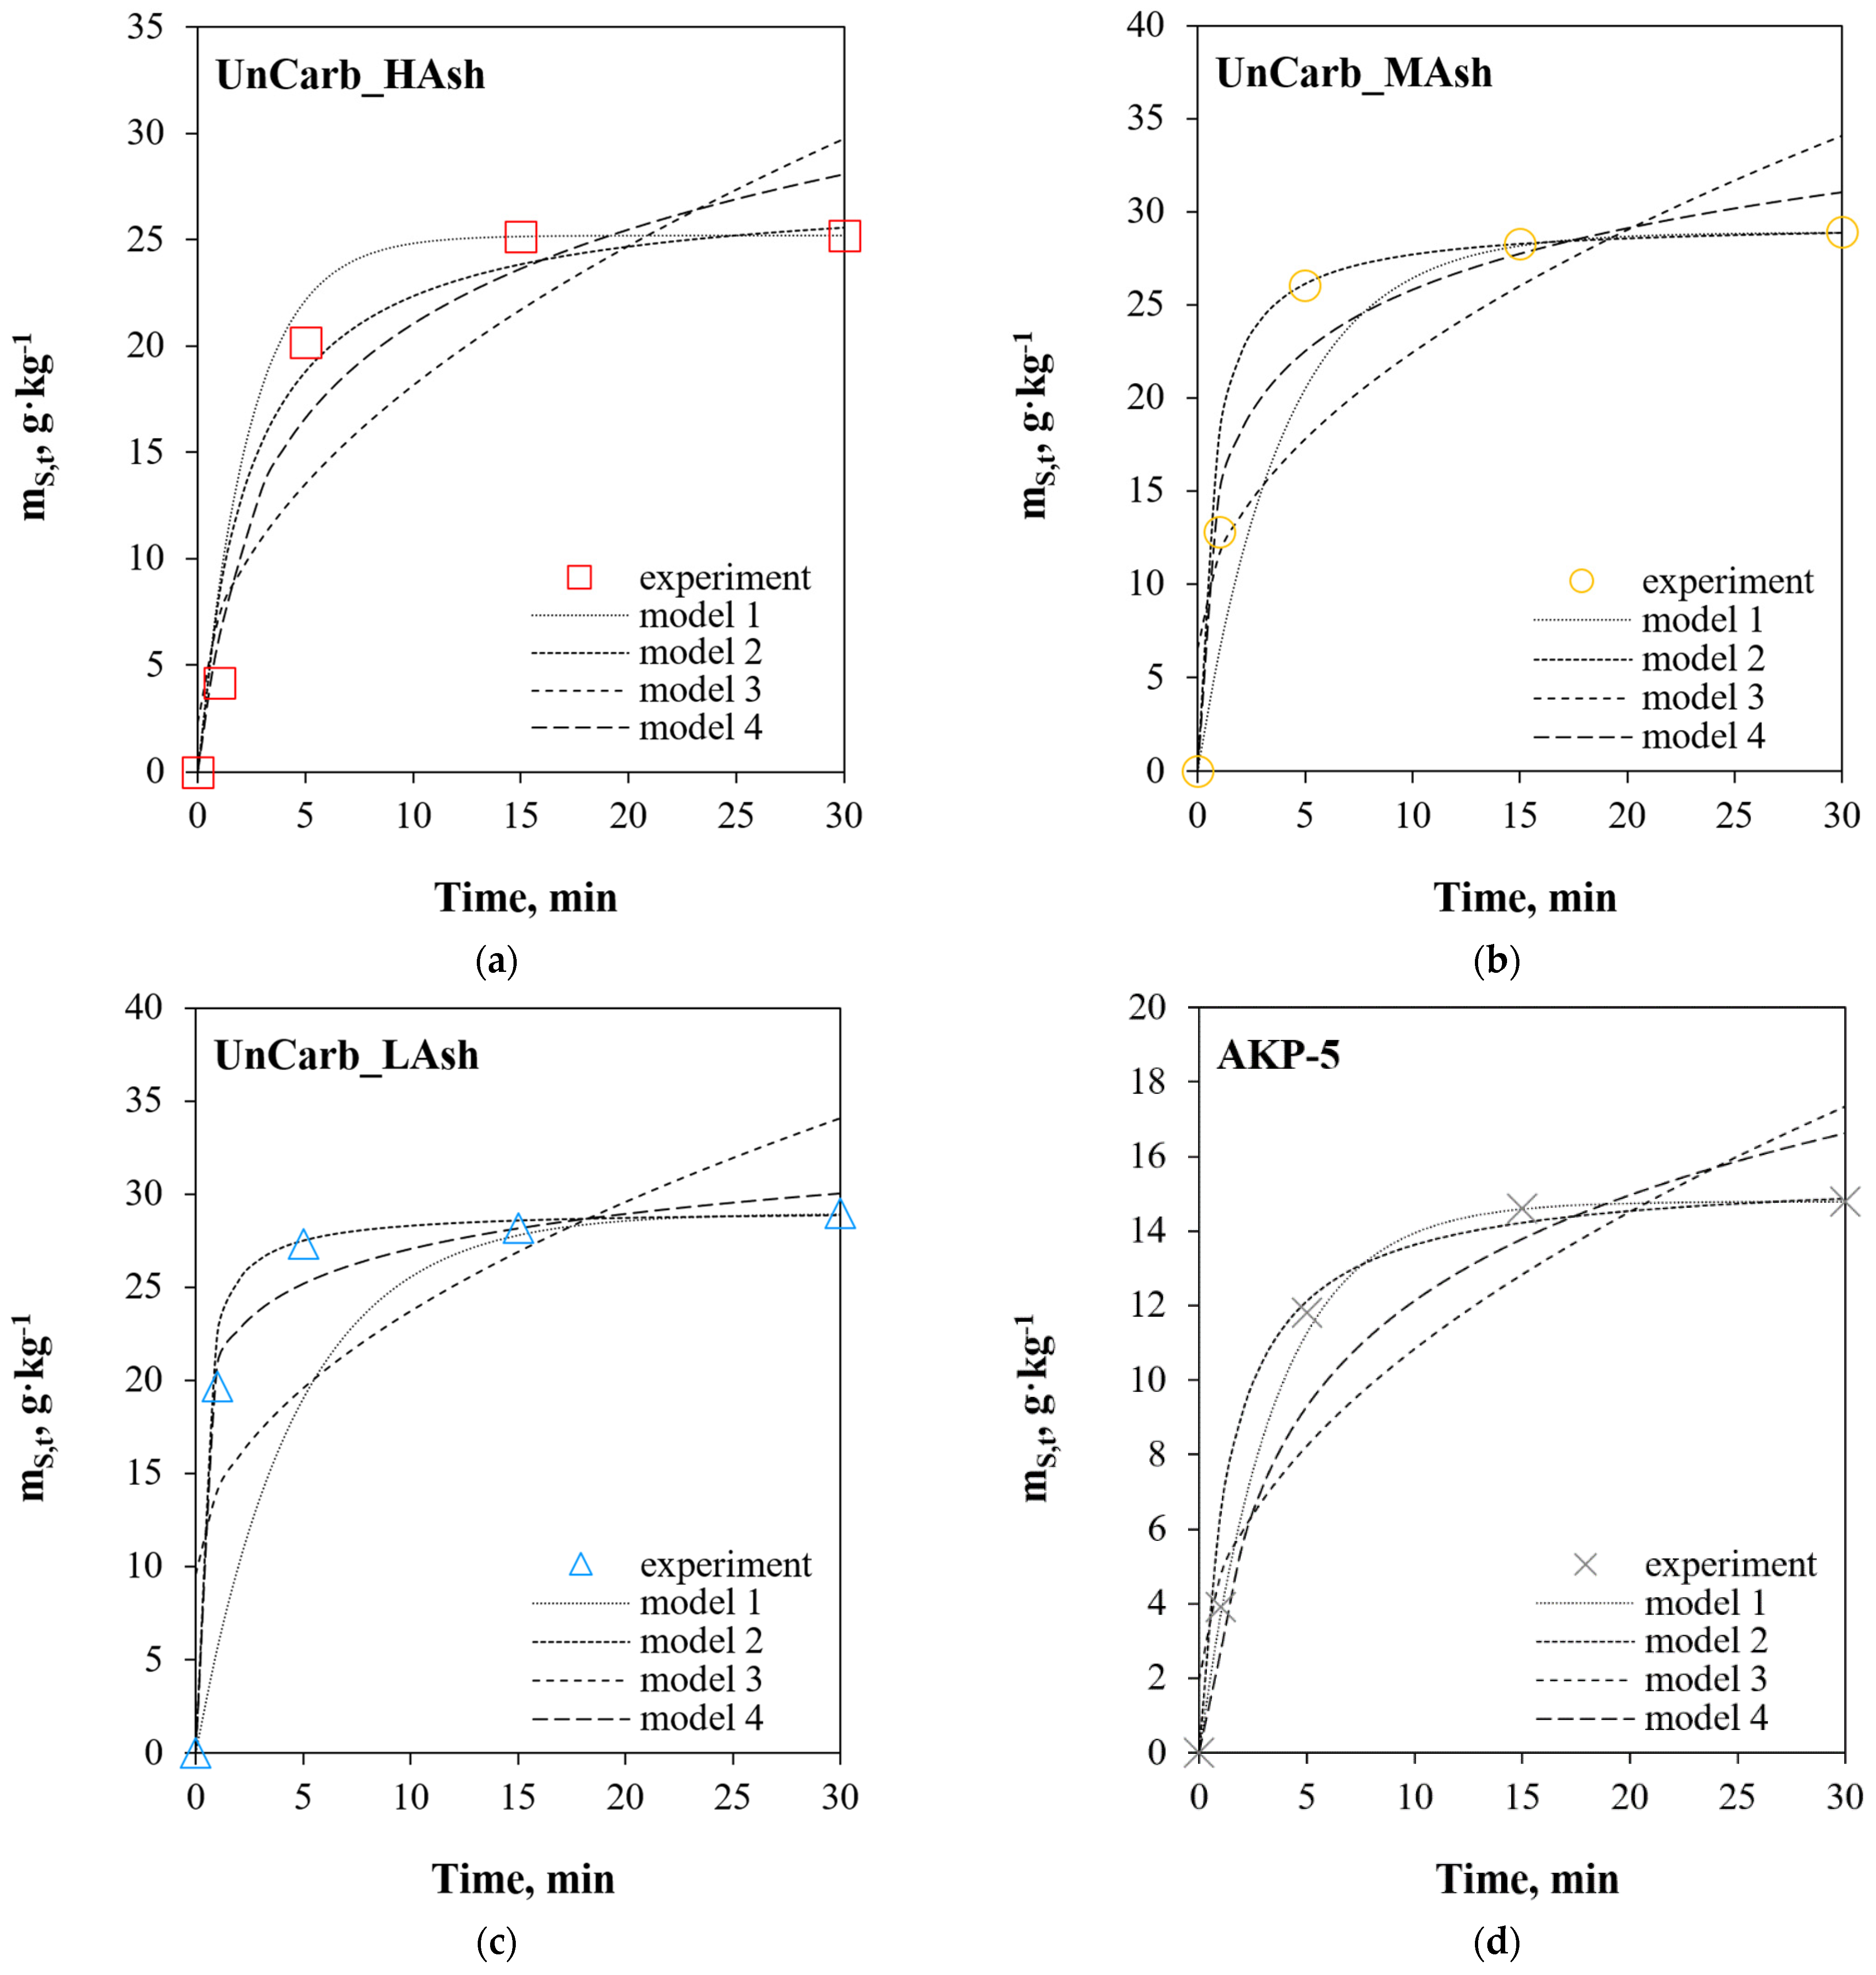
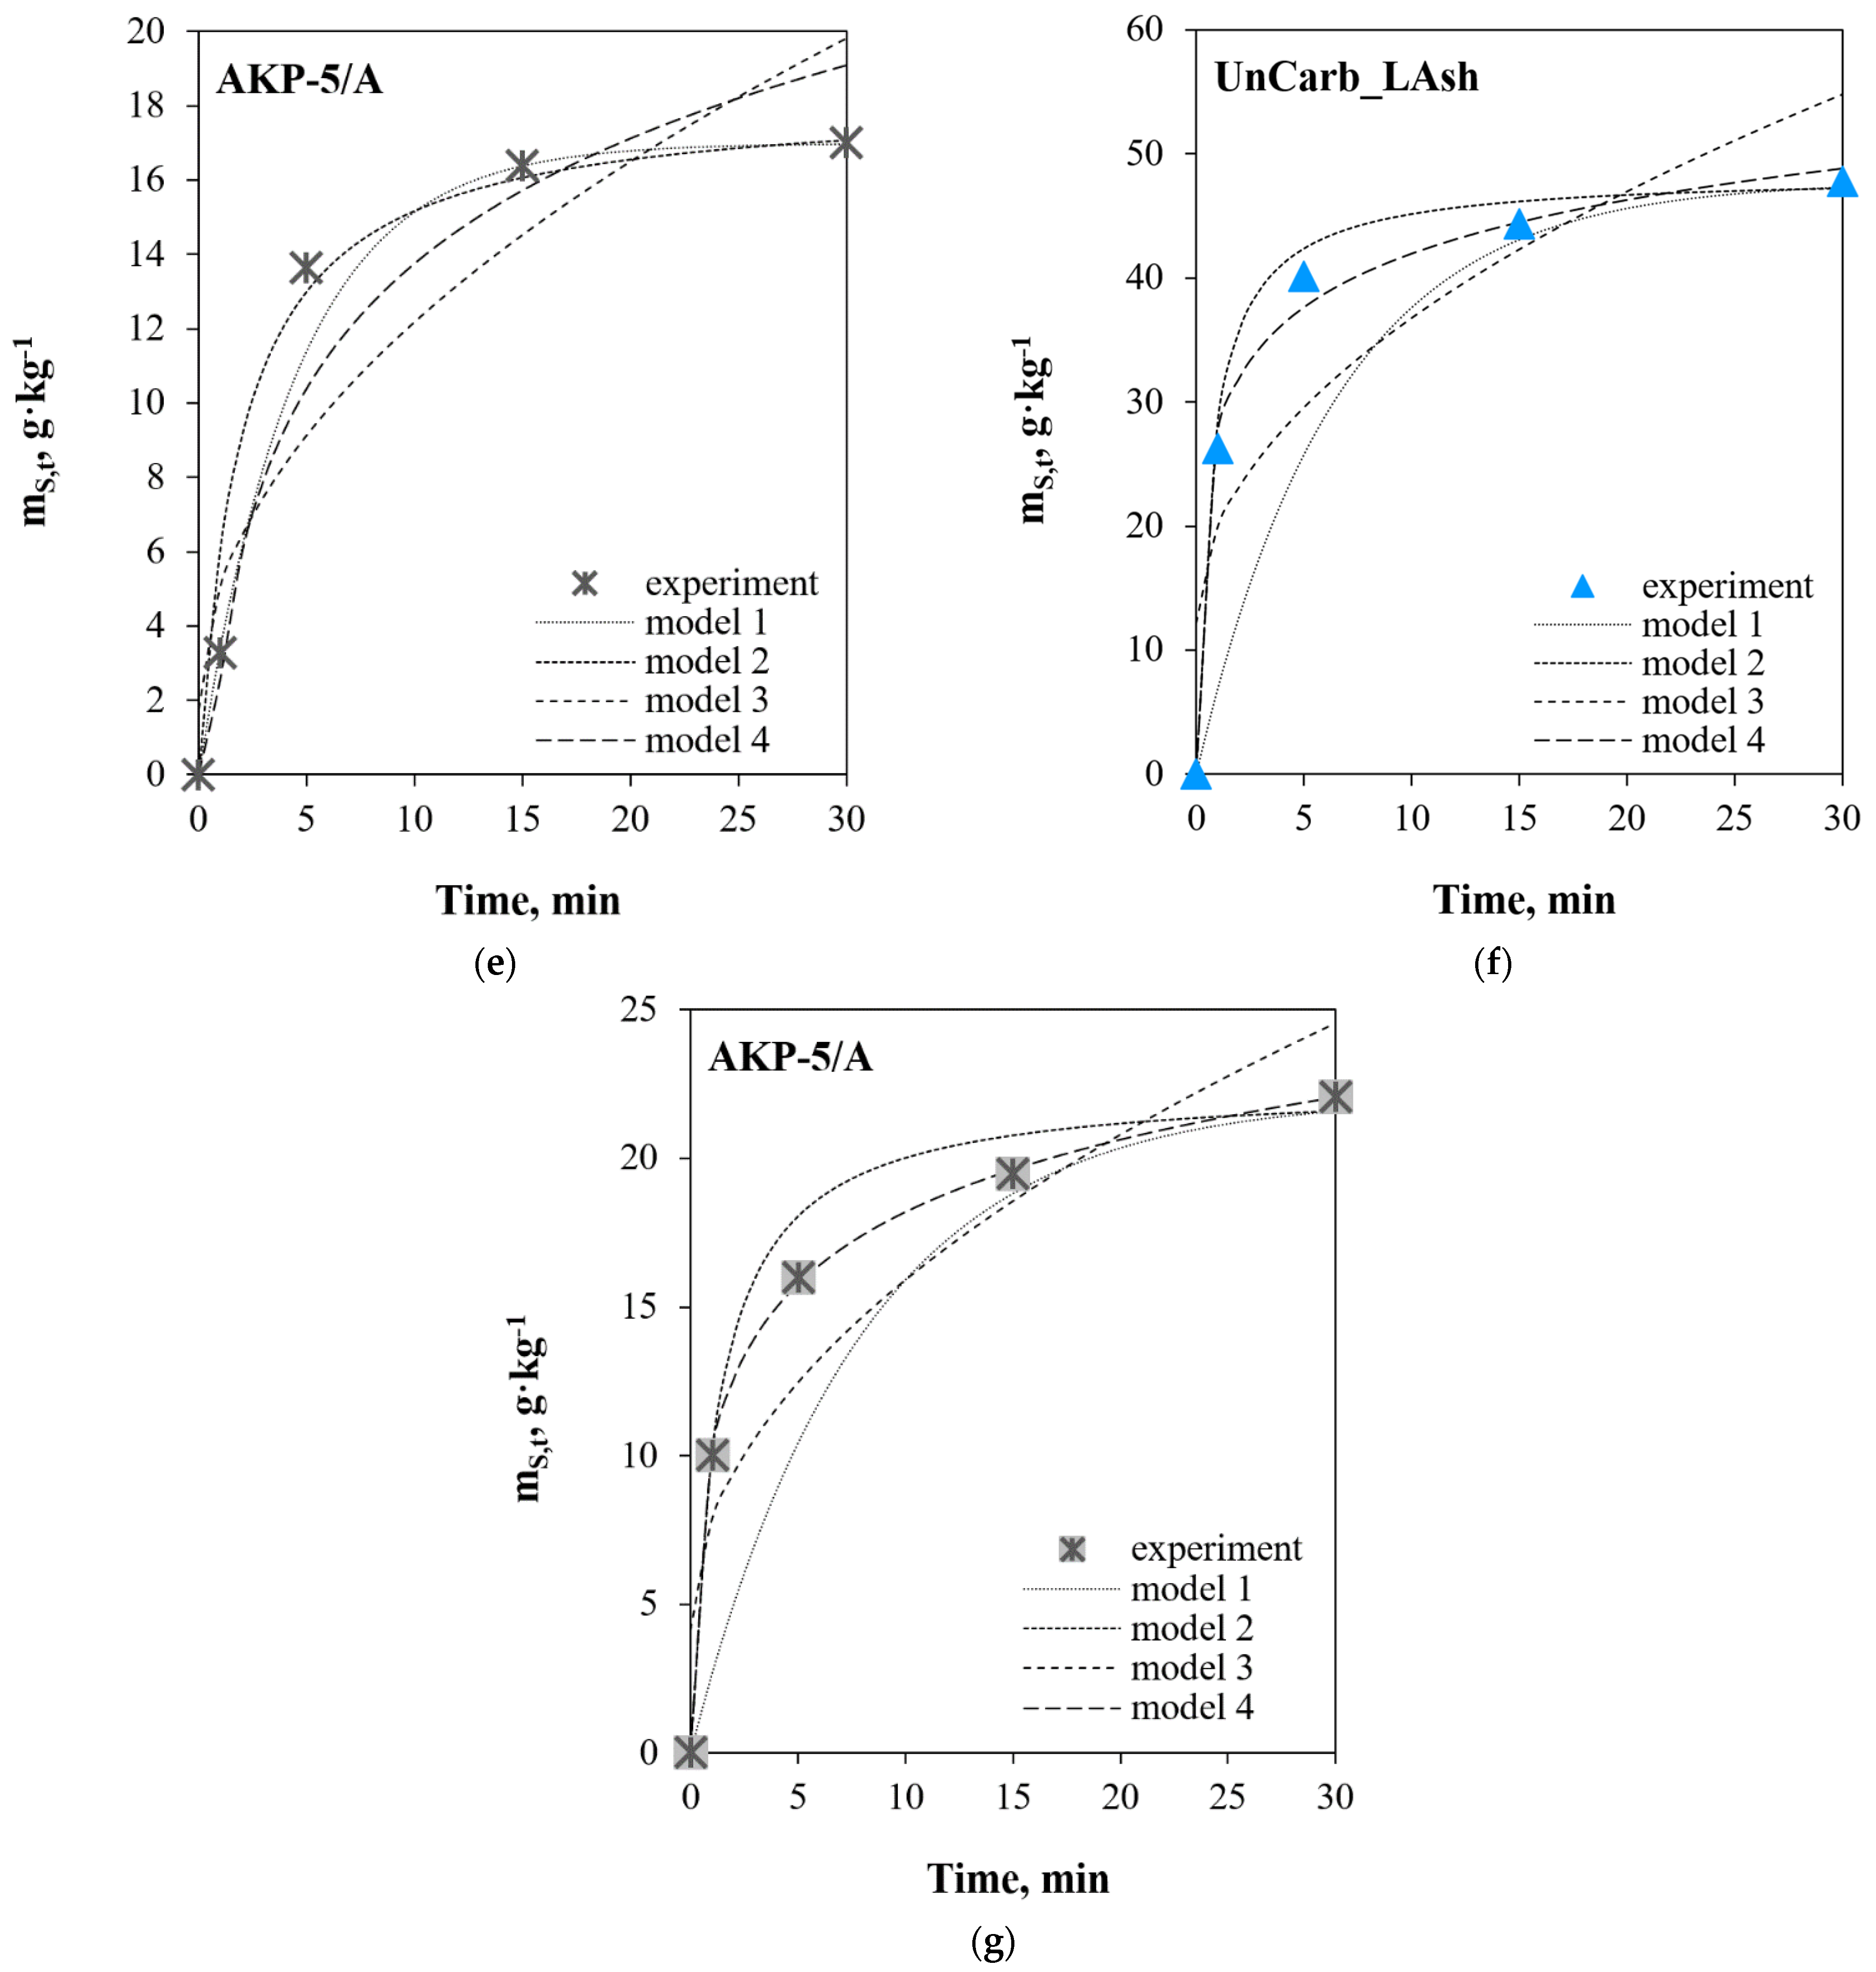
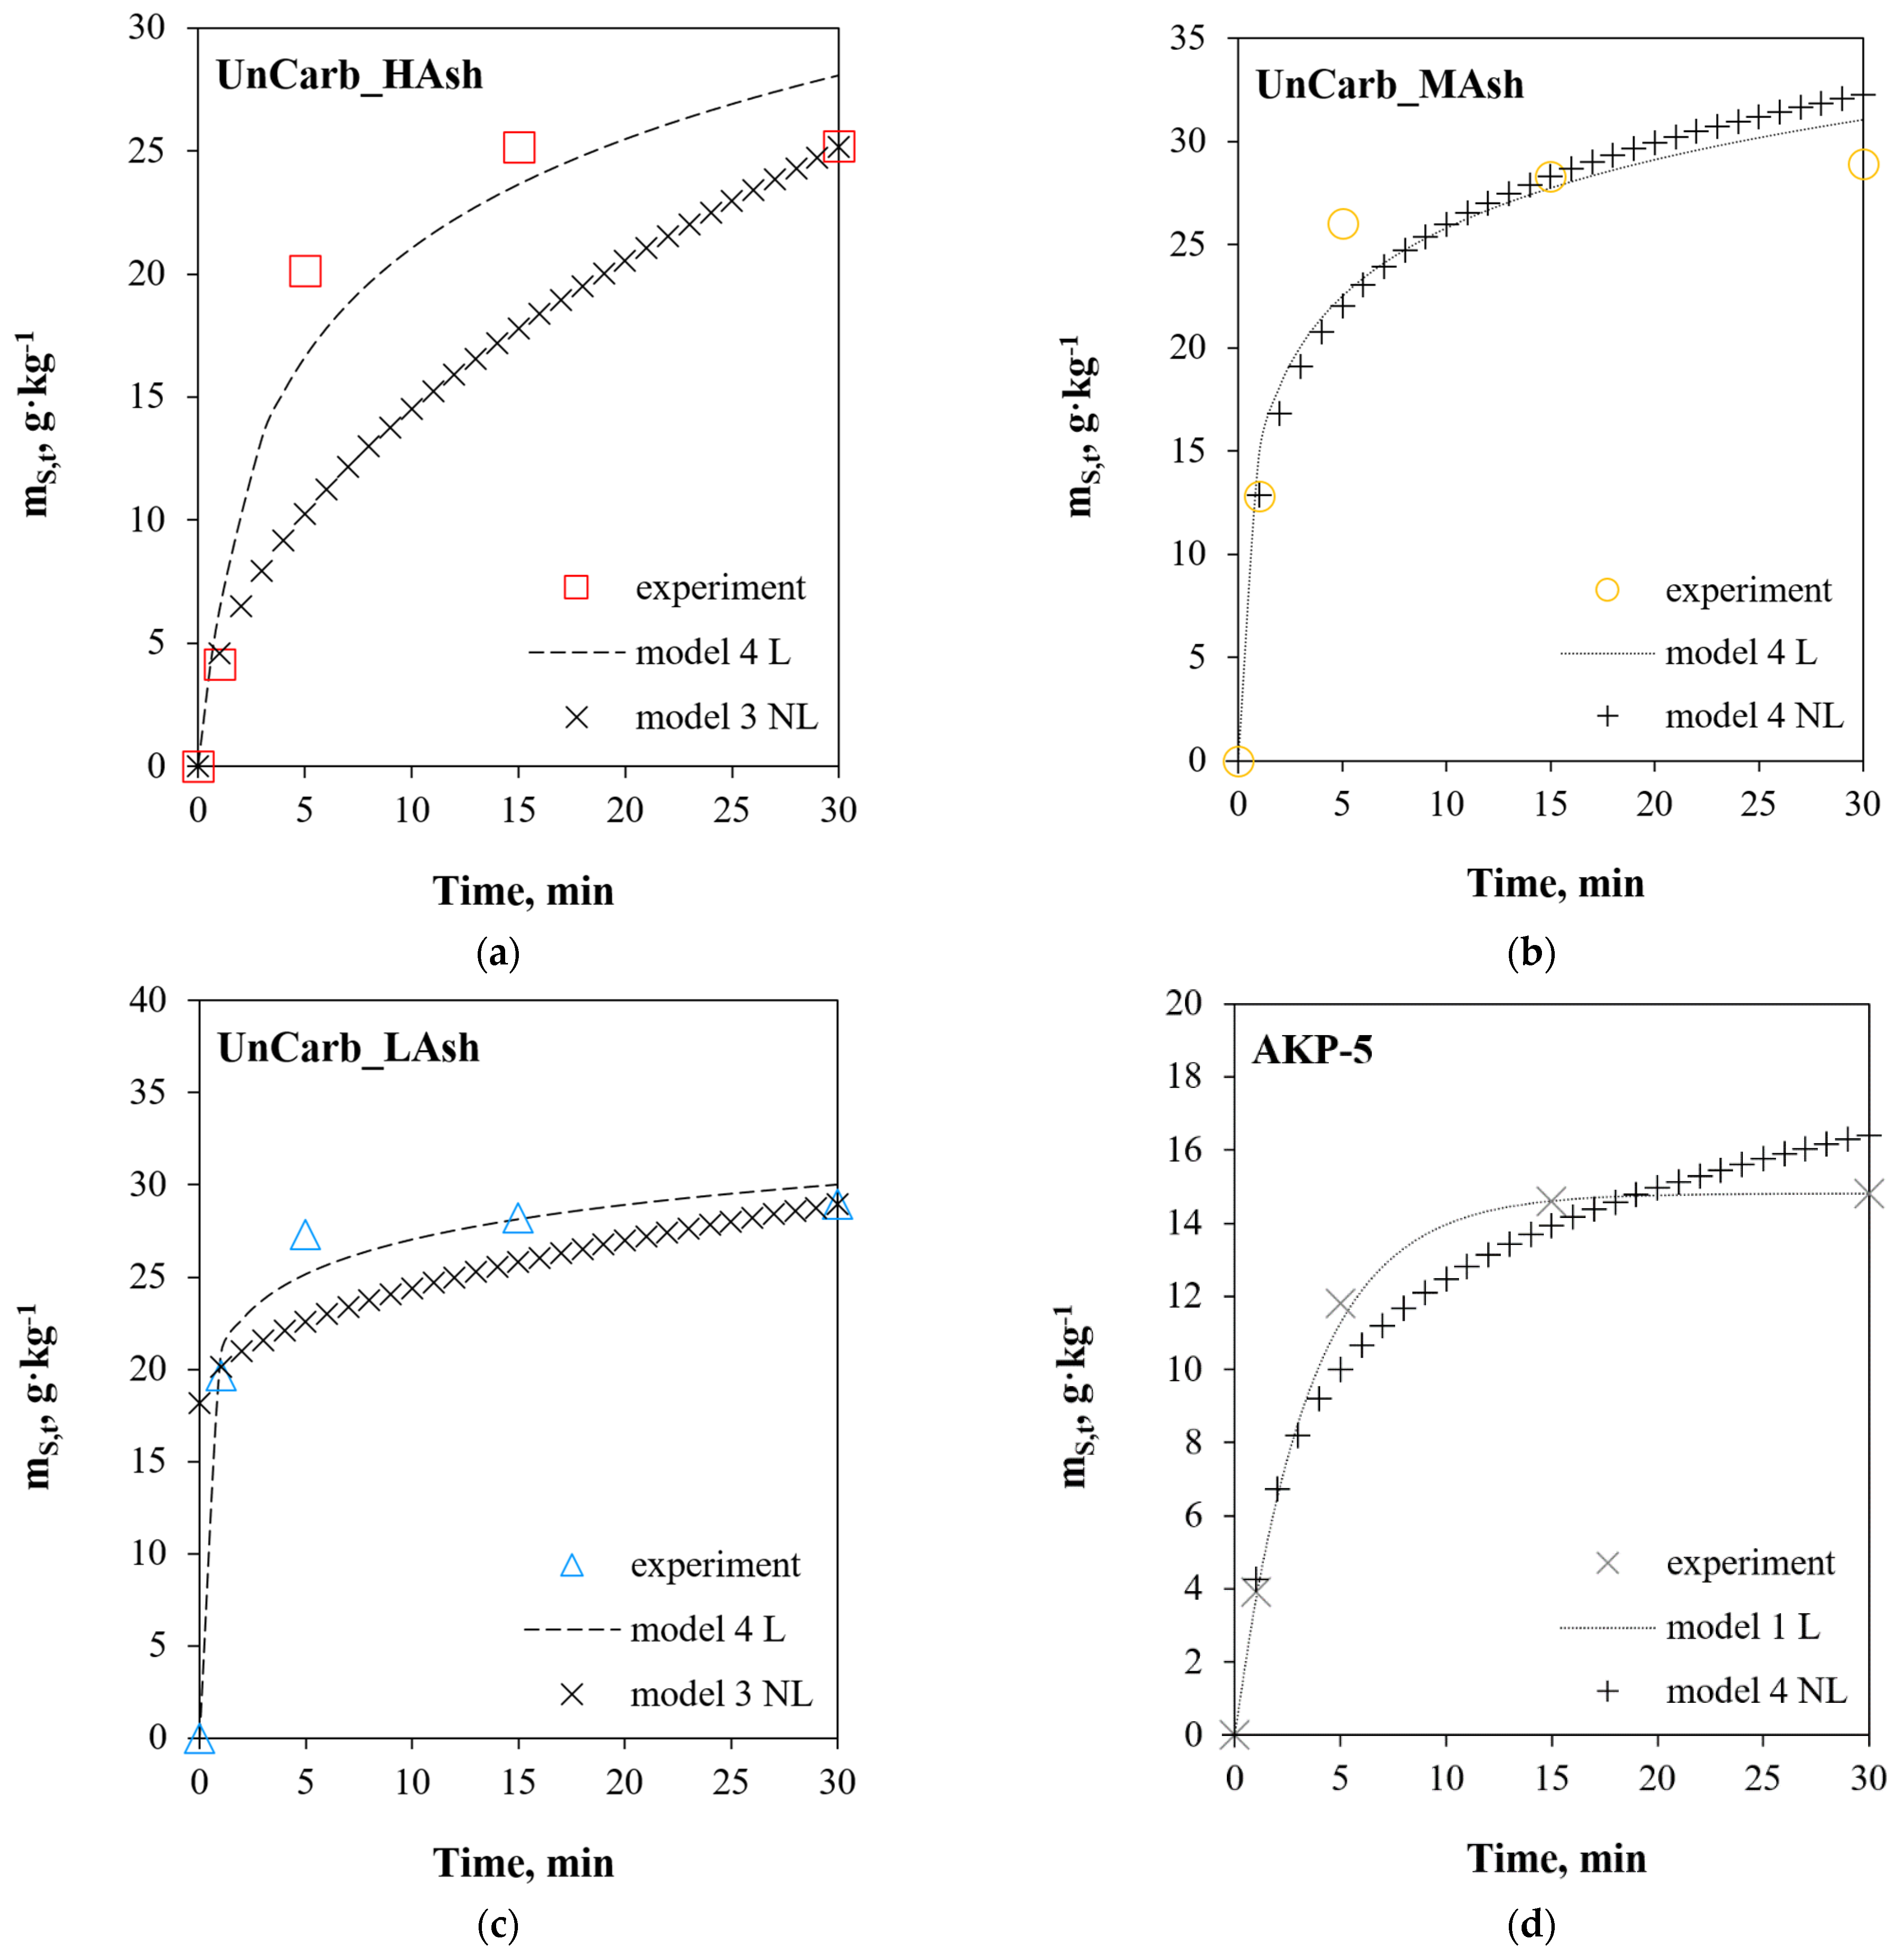
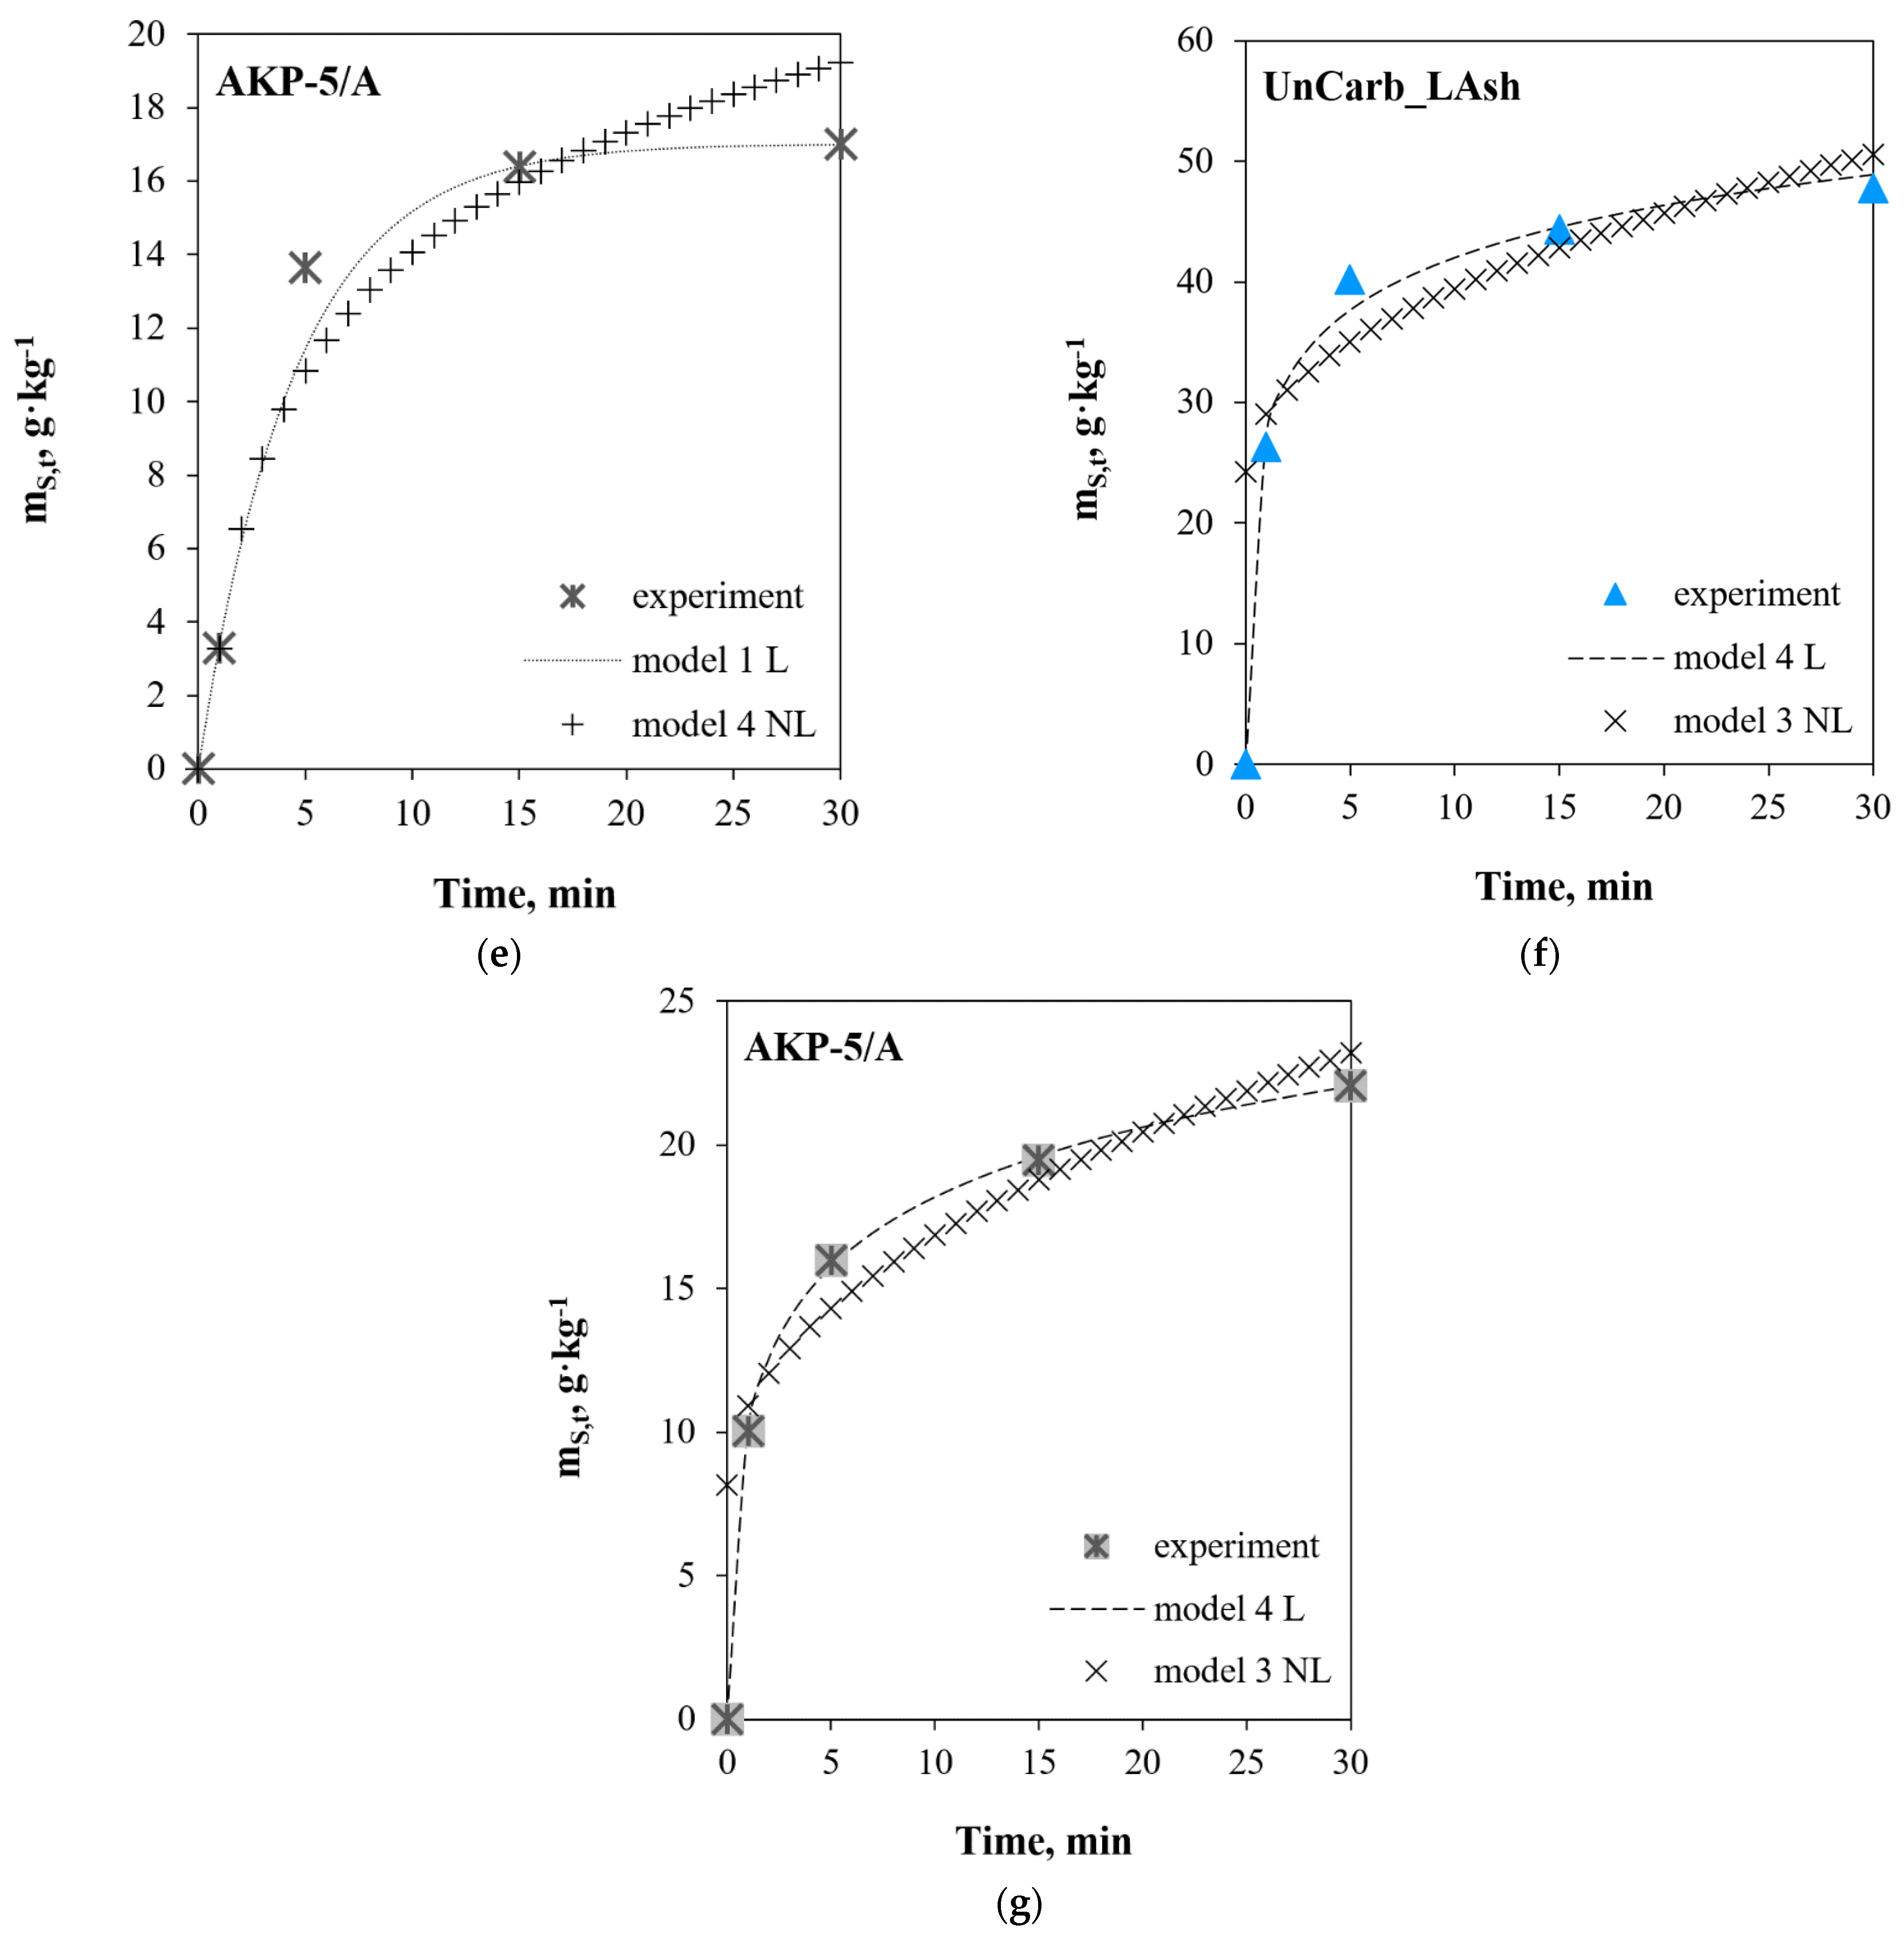
The results of the model tests for linear regression are shown in
Figure 2. As shown by the test results, the highest sorption capacity against sulfur dioxide is shown by unburned carbons UnCarb_MAsh and UnCarb_LAsh (
Figure 2b,c). By mass, these materials adsorbed 28.90 and 28.95 g of S per kg of adsorbent, respectively. Among the selected materials, the lowest concentration of the active agent is characteristic of commercial activated carbons formed on the basis of hard coal dust. The mass of adsorbed sulfur dioxide for the AKP-5 and AKP-5/A samples is 41 and 32% lower than the least adsorbing unburned carbon (UnCarb_HAsh), for which 25.15 g S per kg of adsorbent was demonstrated. Additionally, due to the presence of oxygen and water vapor in the measurement system, the sorption capacity of the samples increased. The percentage of sulfur in the solid phase after the process increased 1.6 times for the UnCarb_LAsh material, while for commercial materials this value did not exceed 1.3 (
Figure 2f,g).
As can be observed, the reaction rate constants determined during the tests range from 0.123 min
−1 (AKP-5/A, SO
2 + Ar + H
2O
(g) + O
2) to 0.423 min
−1 (UnCarb_HAsh, SO
2 + Ar) for model 1 and from 0.0156 kg·g
−1·min
−1 (UnCarb_HAsh, SO
2 + Ar) up to 0.114 kg·g
−1·min
−1 (UnCarb_LAsh, SO
2 + Ar) for model 2 (
Table 2). According to the theory, for both models, materials that quickly bind the adsorbate should be characterized by high reaction rates. However, in practice, the correlation between the values of k
1 and k
2 has not been confirmed. Interestingly, the calculations made for model 1 show a reduction in the rate of the adsorption process in the presence of H
2O
(g) and O
2 (0.123–0.155 min
−1 under SO
2 + Ar + H
2O
(g) + O
2 vs. 0.214–0.423 min
−1 under SO
2 + Ar).
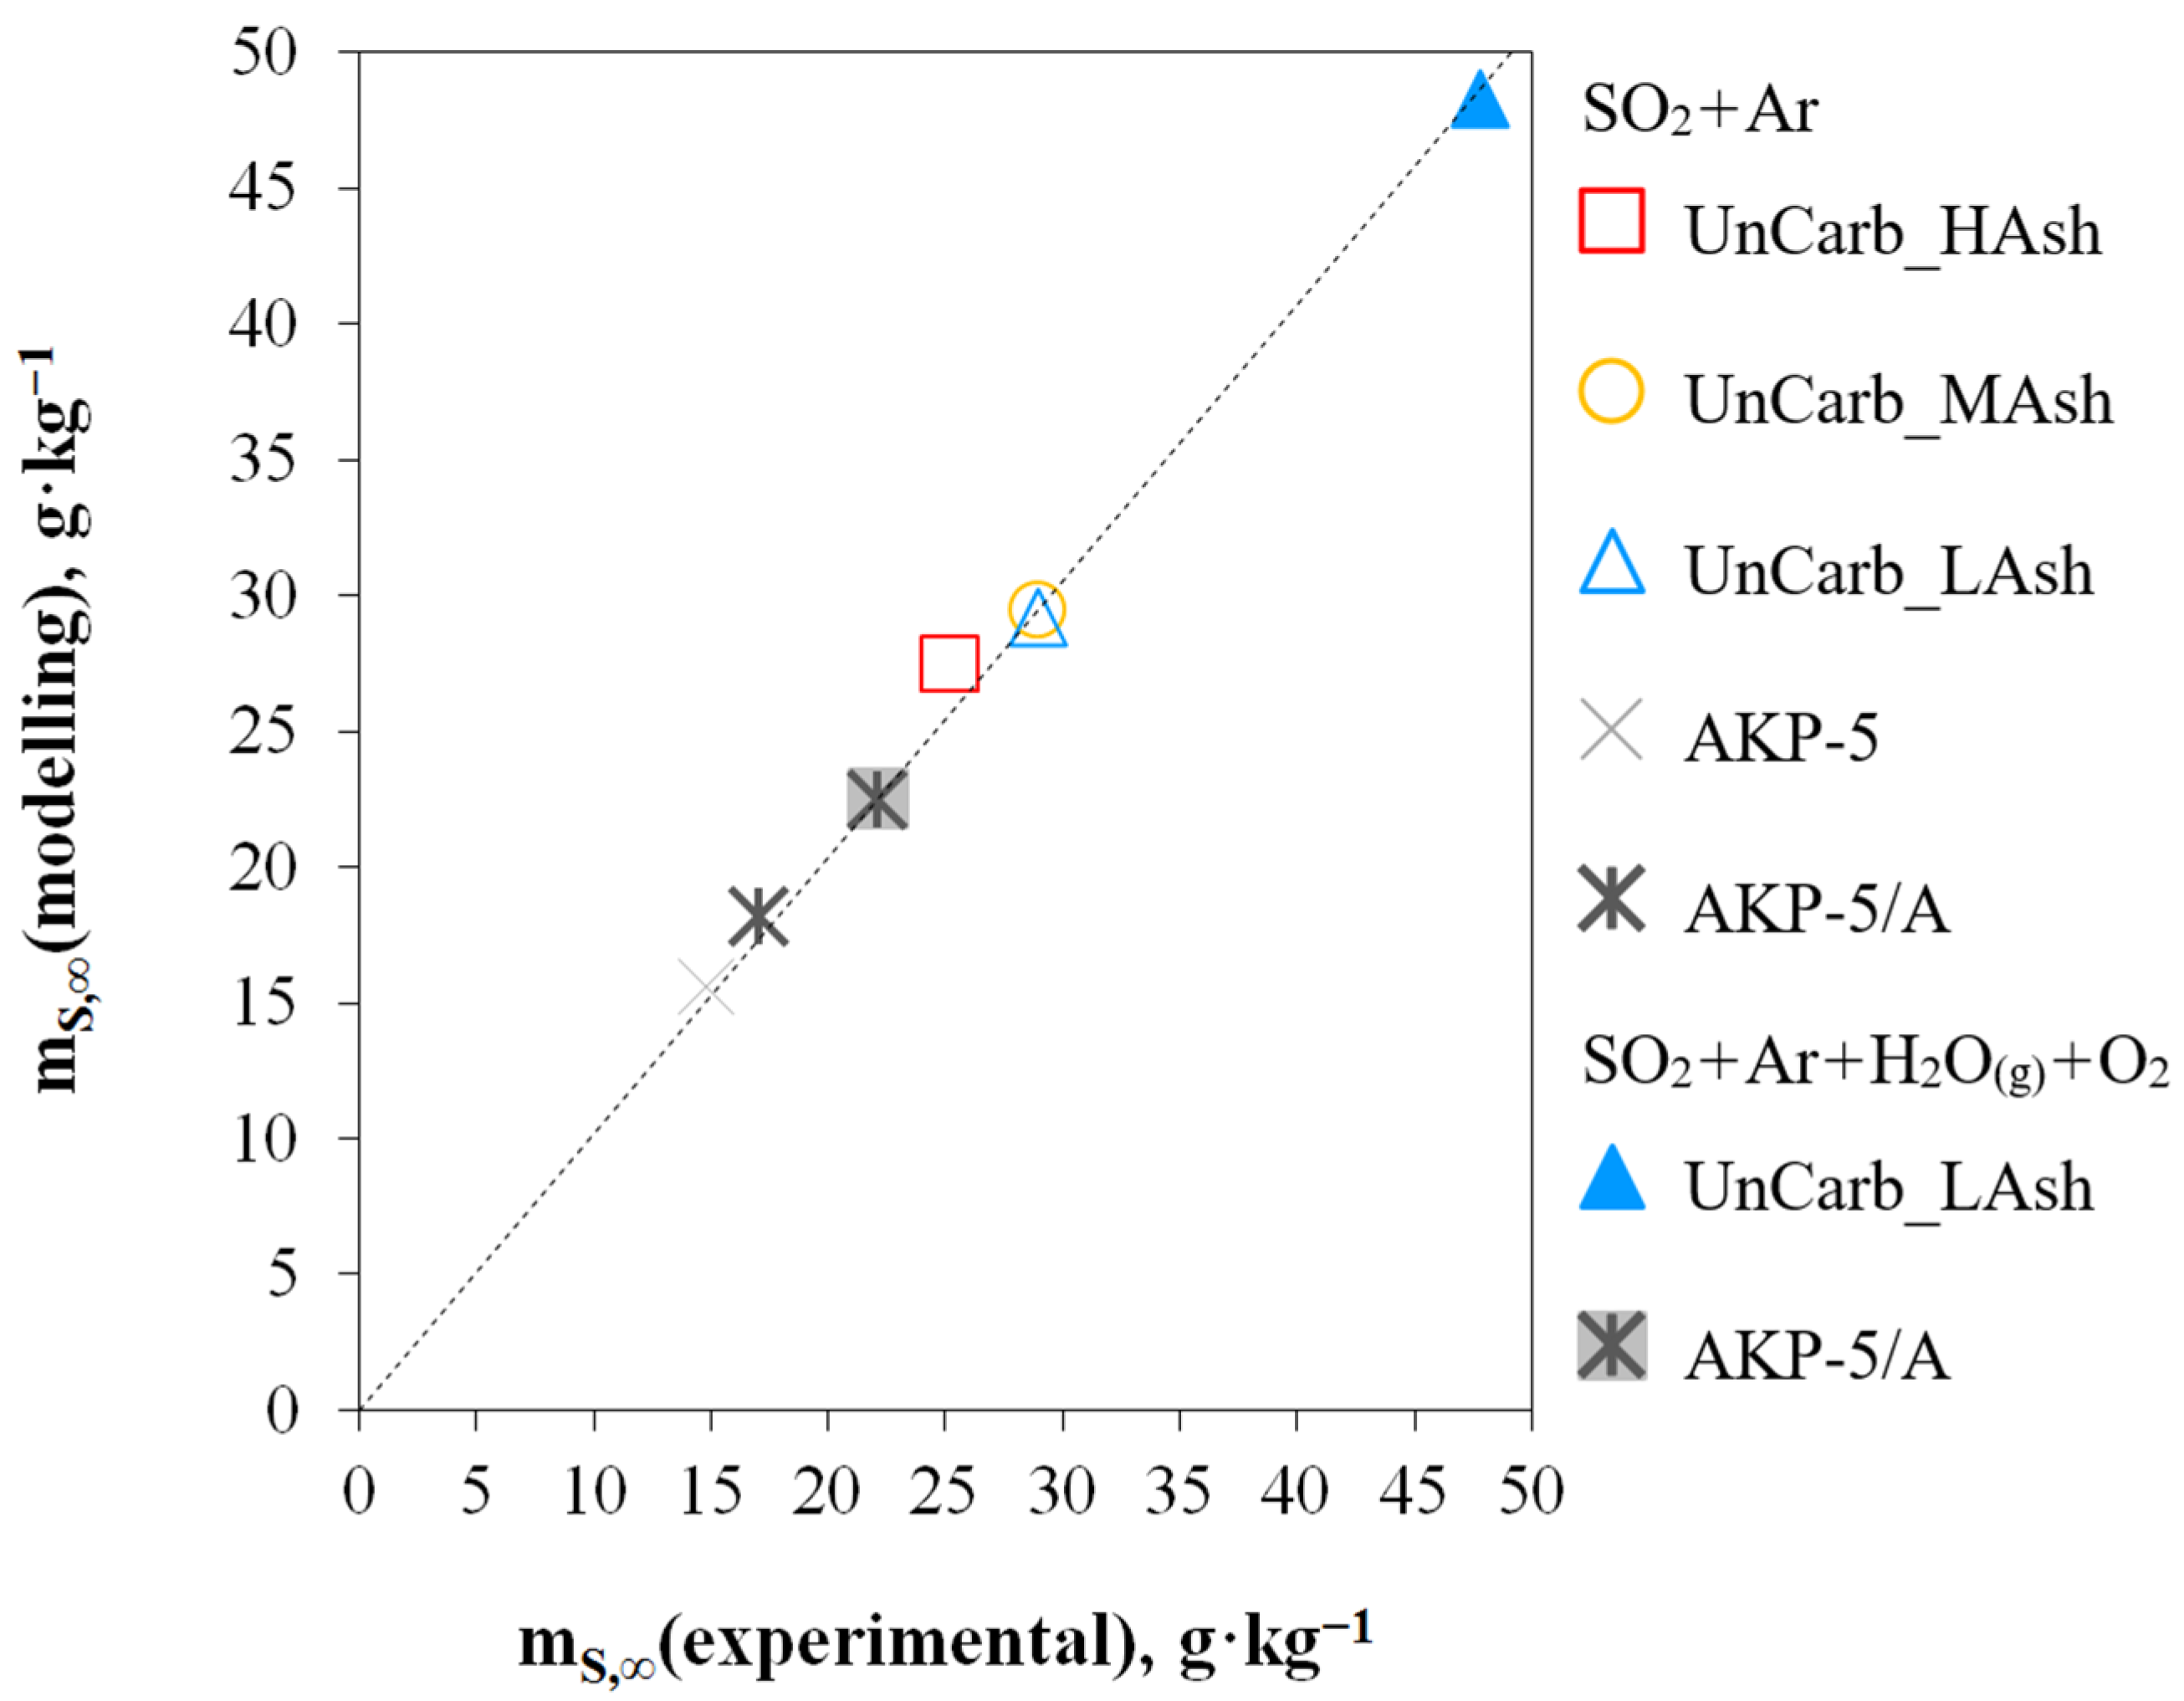
A model parameter of great practical importance is the amount of adsorbate related to the equilibrium conditions m
S,∞ (for unlimited contact time). It is interesting that this coefficient, determined on the basis of model 2, reaches a value similar to that obtained experimentally (for a contact time of 30 min), and the discrepancies (averaged for all analyzes) do not exceed 3.5% (
Figure 3).
The calculations made for model 3 show that the values of the k
id coefficient range from 2.81 AKP-5/A, SO
2 + Ar) to 7.77 g·kg
−1·min
−0.5 (UnCarb_LAsh, SO
2 + O
2 + H
2O
(g) + Ar), while parameter C varies from 1.76 (AKP-5/A, SO
2 + Ar) to 12.1 g·kg
−1 (UnCarb_LAsh, SO
2 + O
2 + H
2O
(g) + Ar) (
Table 2). In view of the information from [
40], high C values and the low k
id would indicate a role that the diffusion-controlled boundary layer could play. The reverse configuration of the discussed parameters would prove that the speed-limiting stage of the process was diffusion inside the pores of the solid phase surface. Nevertheless, as shown in
Figure 2, the described model does not faithfully reflect the course of the reaction, which to some extent confirms the kinetic nature of the experiments performed. However, it is interesting that the addition of H
2O
(g) and O
2 to the gas mixture significantly increased the C value (4.13 and 12.1 g∙kg
−1 vs. 1.76 and 9.56 g∙kg
−1, respectively, for the AKP-5/A and UnCarb_LAsh tests). Considering the information presented above, it should be assumed that under the conditions of the SO
2 + Ar + H
2O
(g) + O
2 mixture, the boundary layer effect in the SO
2 adsorption process will be greater.
The kinetic parameters determined for model 4 are theoretical and physicochemical interpretation is difficult. Moreover, as far as the author is aware, the literature lacks studies on the kinetics of SO
2 adsorption on unburned carbons, which would make it possible to compare the obtained results. Interestingly, the registered change in kinetic parameters for the addition of H
2O
(g) and O
2 to the gas mixture would indicate a change in the kinetics of SO
2 adsorption. In the case of the UnCarb_LAsh test, a decrease was noted in both the value of the reaction rate constant α and the degree of surface coverage with the β adsorbate (0.515 g∙kg
−1min
−1 and 0.160 kg∙g
−1 vs. 5917 g∙kg
−1min
−1 and 0.370 kg∙g
−1); for the AKP-5/A sample, the intensification of each of them (62.6 g·kg
−1min
−1 and 0.285 kg·g
−1 against 8.24 g·kg
−1min
−1 and 0.206 kg·g
−1) (
Table 2).
Table 3 presents the analysis of statistical errors in kinetic models solved by the linear regression method. The highlighted data (in colours and bold) indicate the most appropriate values for a given sample out of the four analyzed models.
In the case of the SO
2 + Ar mixture, for commercial samples of activated carbons, regardless of the statistical error function, the quality of the results suggests that SO
2 adsorption is a first-order kinetic reaction. However, bearing in mind the considerations of Płaziński and Rudziński in [
41,
42], we should be cautious to hypothesize about a specific physical model of adsorption in the case of Equation (3). There is a belief that the indicated equation is not able to reflect changes in the mechanism controlling the adsorption kinetics, and the adjustment of the model data to the experimental data, especially in the case of systems close to the equilibrium state, results rather from mathematical foundations.
In the case of the UnCarb_HAsh trial, inconsistency in the indication of error values was obtained. It is highly likely related to the heterogeneity of the sample (ash content 57.3% for UnCarb_HAsh, 44.6% for UnCarb_MAsh, 12.8% for the UnCarb_LAsh [
30]). Nevertheless, as evidenced in
Table 3, 5 (Δq, ARE, χ
2, HYBRID, MPSD) out of 9 functions indicate that model 4 reflects the empirical data most accurately. The determination (R
2) and correlation (R) coefficients, as well as the sum squared error (SSE) indicate model 2; and the sum of absolute errors (EABS)—model 1. However, bearing in mind the information that in the case of the first and second-order models (models 1 and 2), the ability to fit data may result only from the mathematical properties of Equations (3) and (6), and not from specific physical assumptions, the compliance of adsorption with the kinetic mechanism of chemisorption on a heterogeneous surface was adopted for further comparative analyzes (according to model 4).
In the case of the UnCarb_MAsh and UnCarb_LAsh trials, greater consistency of the statistical error values was obtained, and their quality indicates the importance of the chemisorption phenomenon. This confirms the observations described in [
30] that even in the absence of molecular oxygen in the gas mixture, the interaction between the adsorbate molecules and the carbon material occurs both due to relatively weak intermolecular van der Waals forces (corresponding to physical adsorption), as well as the chemical binding of sulfur dioxide.
The change of the atmosphere into SO
2 + O
2 + H
2O
(g) + Ar indicates that the reliability of the analyzed models changes towards model 1 < model 3 < model 2 < model 4. These data, in line with the results of experimental research [
30], also prove the formation of strong chemical bonds between the adsorbent and the adsorbate in the presence of oxygen and water vapor, thus indicating a strong inhomogeneity of the adsorbent surface.
3.2. Non-Linear Regression
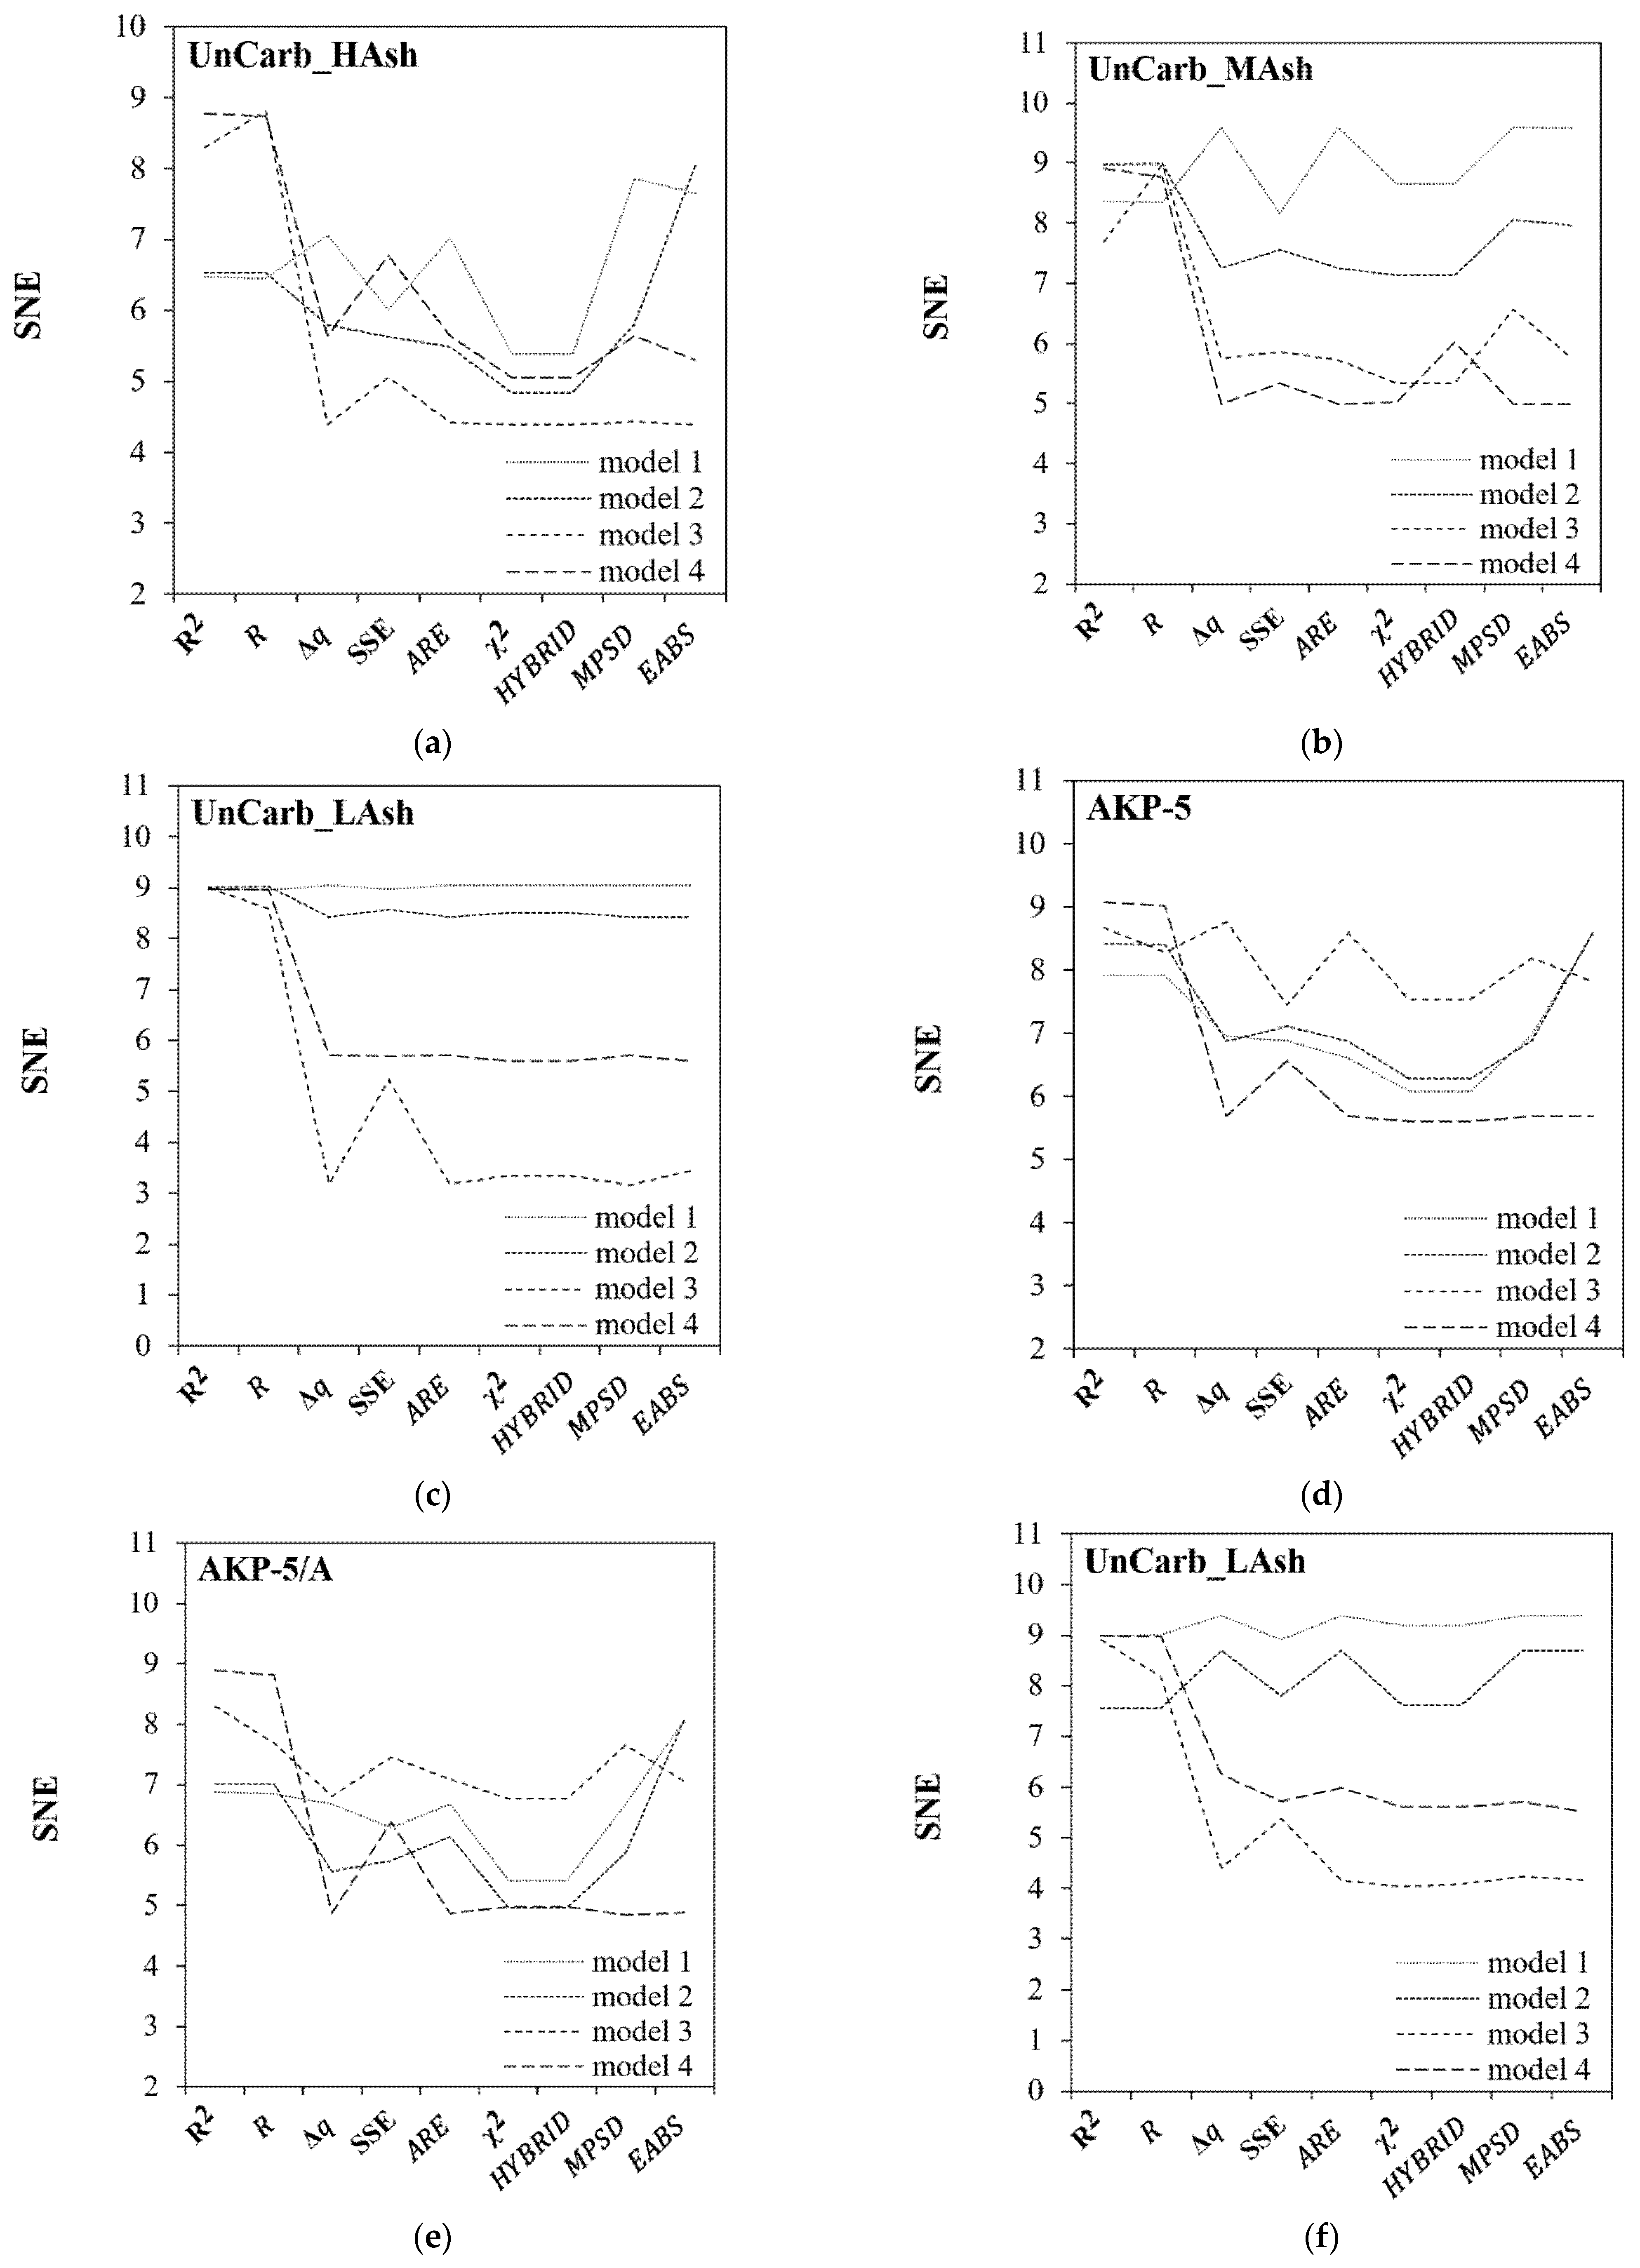
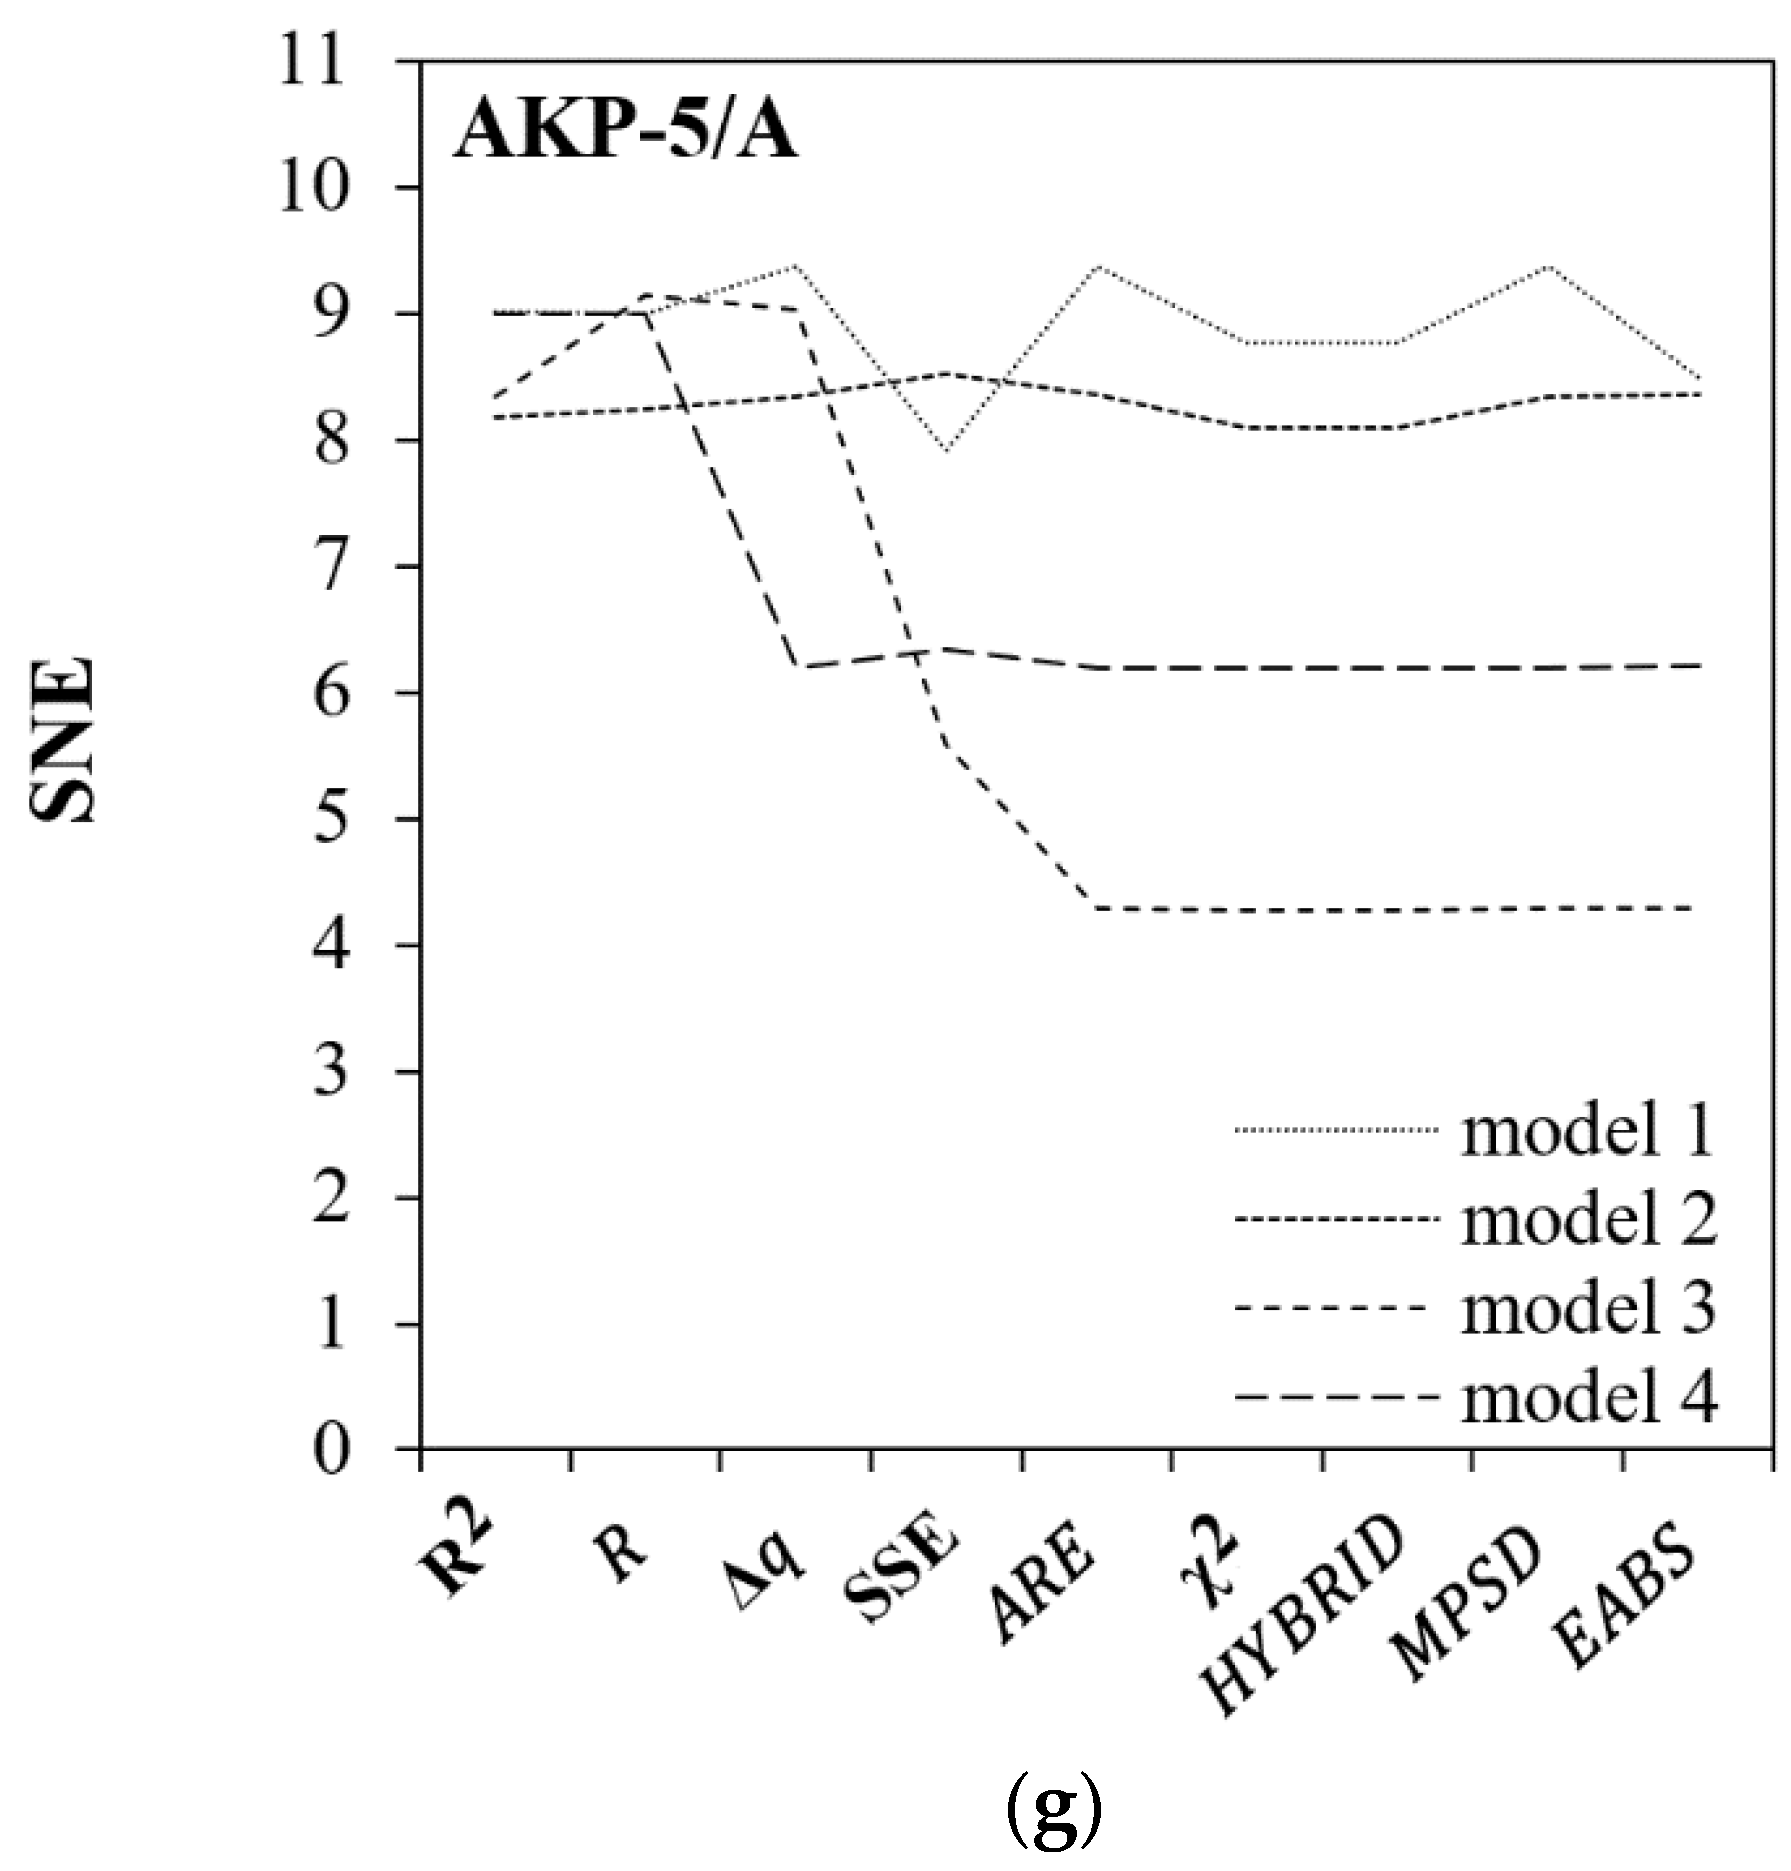
In the case of describing sulfur dioxide adsorption by non-linear regression, the so-called sum of normalized errors (SNE) method was applied, allowing to select the most appropriate error function used to optimize kinetic parameters. This method makes it possible to estimate the values that are not burdened with the error resulting from the use of only one type of function and enables the selection of the model that best describes the adsorption process.
Figure 4 shows the distribution of the parameter of the sum of normalized errors for all tested samples. As can be seen, the SNE value determined for one data series varies greatly. Within a given model, it may even decrease twofold (e.g., for the UnCarb_HAsh trial and model 3: 8.81 in the case of minimizing the R
2 criterion and 4.39 in the case of minimizing the EABS criterion). Especially in the case of models 3 and 4, there is a correlation that minimization of the determination coefficient (R
2) and correlation (R) leads to high SNE values. This observation does not confirm the commonly used assumption that the models with R
2 > 0.7 describe the studied phenomena reliably [
43,
44]. It is therefore clear that fitting data by any of the non-linear equations based on the R or R
2 functions only, cannot be treated as evidence or prerequisite of the existence of a mechanism that determines the kinetics or dynamics of adsorption in a given system. Notwithstanding the fact that it is quite common in the literature to use them as a basis for the assessment of the quality of fitting kinetic data to experimental data [
45,
46,
47]. Interestingly, the analyses were performed to prove a certain universality of the χ
2 and HYBRID functions. As noted, in 15 out of 28 cases the minimization of these functions led to the lowest SNE values for individual models (
Table 4). For example, for the AKP-5 sample, HYBRID values in the range 5.60–6.28 were recorded—the lowest for models 1, 2, and 4; in the case of the AKP-5/A sample (SO
2 + Ar + H
2O
(g) + O
2), the noted values of χ
2 were in the range 4.27–8.09—the lowest for models 2, 3, and 4.
Table 4 distinguishes the error functions used for non-linear regression (out of 9), for which the most appropriate values of the SNE function were obtained. These values served as a criterion for selecting an appropriate mathematical model for the discussed adsorption case. As can be seen, regardless of the tested sample and process conditions, in the case of models 1 and 2, the lowest SNE values were obtained by minimizing the complex fractional error function (HYBRID), and for models 3 and 4, by Marquardt’s percentage standard deviation (MPSD). Interestingly, all the indicated values correspond to the SO
2 + Ar mixture. As a result of wetting and oxygenating the gas mixture, the functions of 9 statistical errors for each model generated higher SNE values.
A detailed analysis of the nonlinear fit and SNE values (
Table 4 and
Table 5), at the level of the tested samples and process conditions, clearly indicates that under the conditions of the SO
2 + Ar mixture, in the case of commercial activated carbons and the unburned activated carbon UnCarb_MAsh sample, permanent bonding of sulfur dioxide could have occurred. Compatibility of adsorption with the Elovich equation (model 4) shows that the adsorption sites increased exponentially with the course of the process, which resulted in multilayer adsorption. Interestingly, for the UnCarb_HAsh and UnCarb_LAsh (SO
2 + Ar and SO
2 + Ar + H
2O
(g) + O
2) and AKP-5/A (SO
2 + Ar + H
2O
(g) + O
2) samples, diffusion in boundary layers or inside the pores of adsorbents (model 3) could have been the stage limiting the adsorption rate. Considering the high values of parameter C (od 8.17 do 24.3 g·kg
−1) (
Table 5), it can be indicated that in the case of the UnCarb_LAsh and AKP-5/A samples, internal diffusion of sulfur dioxide dominated over the general adsorption kinetics. The phenomenon of external diffusion should rather be noted for the UnCarb_HAsh sample (C = 0) (
Table 5), similar to the case [
48].
It is worth emphasizing, disregarding the values of the SNE function, that as a consequence of the addition of H
2O
(g) and O
2 to the gas mixture, the kinetic parameters of SO
2 adsorption have changed (
Table 5). Analogously to the linear regression method (
Table 2), for both samples (UnCarb_LAsh and AKP-5/A) an increase in the boundary layer effect was noted (in accordance with C). Moreover, for the AKP-5/A test, the rate of SO
2 adsorption under the SO
2 + Ar + H
2O
(g) + O
2 mixture was intensified (in accordance k
1, k
2 and α).
3.3. Comparative Analysis of Linear and Non-Linear Regression
To assess the validity of the description of the kinetics and dynamics of adsorption by means of linear or nonlinear regression, the values of statistical errors and model curves were compared for the models for which the smallest deviations from empirical data were recorded (
Figure 5,
Table 6). As can be seen, for 6 out of 7 tested trials, the research clearly proves that it is the linear regression that more accurately reflects the behaviour of the adsorption system (regardless of the process conditions). What is particularly interesting, only for the UnCarb_MAsh sample, the method of linear and nonlinear fitting indicates the same mechanism of the studied phenomenon (model 4). Depending on the applied statistical error, the linear and nonlinear approaches may differ even several dozen times. For example, for the AKP-5/A (SO
2 + Ar + H
2O
(g) + O
2) sample it was noted that the HYBRID error reached the value of 0.2 with linear regression and as much as 56 times more with non-linear regression (11.2).
What is also noteworthy, comparing the kinetic parameters from
Table 2 for the linear regression method with the parameters from
Table 5 for the non-linear regression method, it can be seen that the differences between them can be over 100%. As can be seen, the k
id rate constant for the UnCarb_LAsh trial for the linear fit is 1.97 g·kg
−1·min
−0.5, and for the non-linear fit it is as much as 4.47 g·kg
−1·min
−0.5 (the difference is 227%).


