Article

Optimal Allocation of Distributed Thyristor Controlled Series Compensators in Power System Considering Overload, Voltage, and Losses with Reliability Effect

by
Mohsen Khalili
1,
Touhid Poursheykh Aliasghari
2,
Ebrahim Seifi Najmi
3,
Almoataz Y. Abdelaziz
4,*,
A. Abu-Siada
5,* and
Saber Arabi Nowdeh
6
1
CTIF Global Capsule, Department of Business Development and Technology, Aarhus University, Herning 7400, Denmark
2
School of Industrial and Information Engineering, Politecnico di Milano, 20133 Milan, Italy
3
Roshdieh Higher Institute of Education, Tabriz 5166616471, Iran
4
Faculty of Engineering and Technology, Future University in Egypt, Cairo 11835, Egypt
5
Electrical and Computer Engineering Discipline, Curtin University, Perth, WA 6102, Australia
6
Golestan Technical and Vocational Training Center, Golestan 87349-49318, Iran
*
Authors to whom correspondence should be addressed.
Energies 2022, 15(20), 7478; https://doi.org/10.3390/en15207478
Submission received: 13 September 2022 / Revised: 3 October 2022 / Accepted: 7 October 2022 / Published: 11 October 2022
(This article belongs to the Special Issue Operation and Planning of Integrated Renewable Energy Systems)

Abstract

:
In this paper, optimal allocation of a distributed thyristor-controlled series compensator (DTCSC) in a power system is presented to minimize overload, voltage deviations, and power losses while improving system reliability. The decision variable was defined as the optimal reactance of the DTCSC in the power system, which was determined using a new meta-heuristic algorithm named the improved equilibrium optimization algorithm (IEOA). A nonlinear inertia weight reduction strategy was used to improve the performance of traditional EOA in preventing premature convergence and facilitate a quick global optimum solution. The effect of system critical line outage was evaluated for each of the considered goals. To evaluate the effectiveness of the proposed methodology, IEOA capability was compared with particle swarm optimization (PSO) and manta ray foraging optimizer (MRFO) methods. Simulations were carried out considering different scenarios on 14- and 118-bus test systems. The results showed that, for all scenarios, optimal allocation of DTCSC could result in a significant reduction in overloading, voltage deviation of network buses, as well as power losses under the condition of line outage, due to the optimal injection of reactive power. In all investigated scenarios, our results attested to the superiority of the IEOA over the traditional EOA, PSO, and MRFO in achieving a better value for the objective function. In addition, the results showed that improving reliability in the objective function could eliminate overloading, and hence, introduce further improvement in each of the objectives.

Graphical Abstract

1. Introduction

In power systems, the congestion of transmission lines has been a concerning issue. Excessive use of line capacity causes overloading in the form of congestion of the transmission lines [1,2]. Line blackouts in power systems are often caused by line overloading, bus voltage deviations, and excessive power losses. Using flexible AC transmission system (FACTS) devices [2,3] is one approach to solve such problems, and have significant potential to make power systems operate in a more flexible, secure, and economical way. By using FACTS devices, network load distribution is controlled; in other words, the load distribution path is managed and reduced in high load lines [1,2]. FACTS devices have been used in many applications in power systems, but they have limitations in terms of commercial applications. Among these limitations are the high fault current and insulation stressing the electronic power systems, increasing costs due to the use of a high power gate turn-off (GTO) thyristor, and unfavorable reliability of the power system. Distributed FACTS (DFACTS) have been used in recent years to solve the above challenges [4]. One of the suitable DFACTS devices for power systems is the distributed thyristor-controlled series compensator (DTCSC) [5], which is installed throughout the transmission line. The DTCSC consists of three switches, a capacitor, inductor, and single-turn transformer. A single-turn transformer is designed with many secondary turns. The single-turn transformer is normally bypassed by the electro-mechanical switch and is normally closed. When it is opened, the required impedance is injected. One switch is closed to inject inductance and another switch is closed to inject the capacitor. Thus, the DTCSC is modeled as a variable reactance transformer [5,6]; it can control the reactance of the line in which it is placed, and thus control the load distribution. By floating the DTCSC in the power transmission line, the limits of high fault currents increase and the reliability problem is solved. In addition, non-stop operation is possible in failure conditions, and reliability and availability can be maintained at high levels. The use of the DTCSC device in power systems has many advantages, such as regular control of load flow, minimum production and operational costs, improvement in dynamic stability, enhancement of line transfer capacity, reduction in active losses, reduction in voltage fluctuations, and compensation of reactive power. Therefore, to retain maximum DTCSC performance, its reactance must be tuned using optimization algorithms. Many studies have been conducted on the use of FACTS devices in power systems, but limited studies have been conducted on the optimal allocation of the DFACTS device, especially the DTCSC. In [7], the optimal use of the DTCSC in a 14-bus system was investigated using improved particle swarm optimization (IPSO), with the aim of minimizing voltage fluctuations and power losses, as well as minimizing overloads. In this study, the objective function of the optimization problem was considered multi-criteria. The purpose of the optimization was to determine the optimal reactance of the DTCSC in the condition of line outage. A new load flow model for TCSC was proposed in [8]. The proposed model was in the form of an admittance matrix dependent on the thyristor firing angles, which was included in the load flow algorithm. The firing angles of the thyristor were considered as mode variables of the load spreading formulation, which was combined with the range and angle of the grid voltage. In [9], steady state modeling of the static var compensator (SVC) and TCSC was presented, considering their control and limitations. Constraint management and control modes were evaluated. The optimal installation location of these devices were also determined and continuous load flow was provided to evaluate the effect of these devices on the load capacity of the system. Analysis of the special values of the maximum load point was used to rank the critical busses according to their respective voltage profiles. Considering that the occurrence of any fault in the power system not only causes a power outage in that area, but also creates problems in adjacent areas, system protection is very important under such conditions. Therefore, when considering compensation devices, methods for power system protection should also be updated. In [10], a new transmission line fault analysis method was presented for the series compensator of the transmission line equipped with TCSC. The presented two-step method was developed with the help of discrete wavelet transform and implementation of the Chebyshev neural network. In [11], the use of the SVC and TCSC in the power system were presented using a brainstorming algorithm, with the aim of minimizing losses, voltage fluctuations, and line overload. The purpose of optimization is to determine the optimal location and settings of the used devices. In [12], optimal locations for SVCs and TCSCs were determined to minimize system operating costs by voltage collapse proximity index using the PSO. In [13], optimal allocation of TCSCs was developed to find the optimal locations for these devices in a network, minimizing operating costs via a whale optimization algorithm (WOA). In [14], a hybrid approach was presented for optimal allocation of the TCSCs and static var compensators (SVCs) via a min cut algorithm and cuckoo search algorithm (CSA). In [15], optimal allocation of a D-STATCOM distribution system was performed with power loss minimization and voltage profile and stability improvement via a student psychology-based optimization (SPBO) algorithm. In [16], optimal placement of a STATCOM compensator was developed using the PSO, to provide stability to the system to minimize potential losses. In [17], the optimal allocation of the STATCOM in power networks was studied using artificial intelligence techniques with the aim of improving voltage security of the power system via the GA. In [18], optimal allocation of the DTCSC was implemented to reduce losses in a distribution network and developed by mixed-integer nonlinear programming (MINLP). In [19], mathematical programming via a branch and bound (B&B) method was developed to find the location and size of the TCSC in the power system to maximize loading, improve the network voltage profile, and reduce losses. In [20], the placement and sizing of the TCSC were performed to minimize transmission losses using whale optimization algorithm (WOA).
In this paper, optimal and multi-objective allocation of the DTCSC is proposed with the aim of minimizing overload, voltage deviations, and power losses, as well as reducing the energy not-supplied (ENS) to customers using an improved equilibrium optimization algorithm (IEOA), considering line outages of the IEEE 14- and 118-bus power systems. The traditional equilibrium optimization algorithm (EOA) [21] is inspired by the simple dynamic balance of mass with proper mixing in a control volume. In the EOA, the value of the inertia weight is chosen as a constant, which is used as a nonlinear inertia weight reduction strategy to improve EOA performance to prevent premature convergence and quickly reach the global optimum. Multi-objective optimization based on weighted coefficients method has been developed. The goal of the optimization problem is to determine the decision variables, i.e., the optimal reactance of DTCSC in the power system lines, in such a way that the objective function of the optimization problem is minimized, and the operating and capacity constraints of the DTCSC are satisfied. In this study, the proposed methodology was first implemented without considering reliability in the objective function. Then, the effect of reliability as a part of the objective function was evaluated in how it improved each of the considered objectives. In addition, the effectiveness of the IEOA in solving the optimization problem has been compared with traditional EOA, PSO [22], and MRFO [23] methods. Our results show the superiority of the proposed methodology in improving each of the objectives considering reliability, compared with the EOA, PSO, and MRFO methods.
The main highlights of the paper are listed as follows:
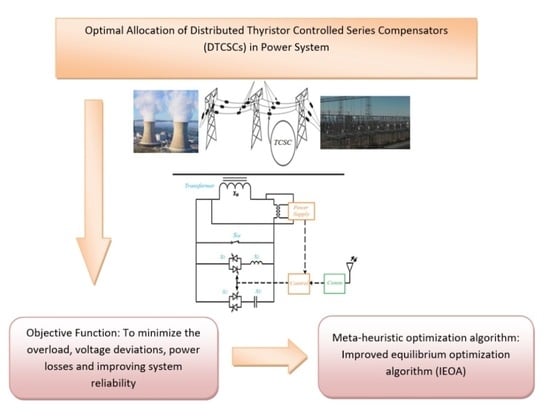
  • Optimal multi-objective allocation of the DTCSC in the power system, considering overload, voltage deviations, and reliability;
  • Evaluation of the system reliability based on energy not-supplied due to line outage;
  • Using a new and improved equilibrium optimization algorithm to determine DTCSC allocation;
  • Achieving zero overload and ENS;
  • Superior performance of the IEOA compared with the traditional EOA, PSO, and MRFO methods.
In Section 2, the formulation of the optimization problem is presented, and in Section 3, the proposed improved optimization algorithm and its implementation are explained. In Section 4, simulation results for different scenarios are presented, and in Section 5, our research findings are summarized.

2. Formulation of the Problem

Although conventional FACTS devices are technically accepted, their commercial applications are limited for several reasons. High fault current and insulation requirements stress the power electronics systems. High system power ratings entail the usage of high power gate turn-off thyristors or gate commutated thyristors, which increases costs. Moreover, power system reliability with conventional FACTS devices is not as high as desired. To try to overcome these challenges, Distributed FACTS (D-FACTS) was proposed. Figure 1 presents a distributed TCSC, in the conventional D-FACTS form, consisting of a large number of modules wrapped around transmission line conductors. D-TCSC offers many advantages over the conventional TCSC [5]. D-TCSCs are clamped onto the transmission line, which simplifies their installation. The D-TCSC uses three switches: a capacitor, inductor, and single-turn transformer (STT), as shown in Figure 2. The STT is designed with many secondary turns. The single-turn transformer (STT) is usually bypassed by the electromechanical switch, which is normally closed. Opening SM allows the injection of the desired impedance. Switch S1 is closed to inject total inductance, whereas S2 is closed to inject capacitance. The D-TCSC controls the reactance of the line it is on, thereby controlling the power flow. It is modeled as a variable reactance transformer [5].
In this study, the DTCSC is used in a system line where reactance is considered a decision vector in the optimization process. The optimization problem of the DTCSC is defined as being multi-objective because it minimizes overloads in transmission lines, voltage deviations, and power losses.

2.1. Objective Functions

2.1.1. Overload Management

The first objective function was overload (OL) management in lines; in other words, the minimization of overloads in transmission lines. The corresponding metric value of this objective function was defined as follows [5]:
O L = i = 1 ( P i P i max ) i = N l ( P i P i max ) 2
where Pi is the current power in the i-th line and Pimax represents the maximum power that can be transmitted in the i-th line. By normalizing this value with the value before optimization (OLo), a better view is provided. Therefore, the first normalized objective function is presented as follows:
O F 1 = O L O L 0

2.1.2. Voltage Deviation

The second objective function of the optimization problem was to minimize the deviation of the network bus voltage from the desired value within an allowed range. In the following equation, the voltage deviation of each bus has been calculated per unit [5,18]:
D E V = i = 1 P V       b u s e s i = N l D E V i
D E V i = 0                                           ; 0.95 < V i < 1.05 ( 1 V i ) 2                 ; 0.9 V i 0.95 & 1.05 V i 1.1 inf                                     ; V i 1.1 o r V i 0.9
where νi is the voltage of each system bus. The normalized value of the voltage deviation of the network buses, with respect to DEV before the optimization, DEV0, was defined as follows:
O F 2 = D E V i D E V 0

2.1.3. Loss Reduction

The third objective function of system loss reduction was considered and its normalized value was expressed as:
O F 3 = P l o s s P l o s s 0
where Ploss0 represents the primary losses of the power system.

2.1.4. Reliability Improvement

One of the key indices of system reliability is the energy not-supplied (ENS) to customers of the network, caused by line outages. When a load point is disconnected from the main feeder due to the outage of the line connected to it, the loads connected to that load point are not supplied. Thus, the total power demand of the loads that are not supplied (over a period of time) due to outage of the network lines is called the ENS to the customers. The objective is to minimize the ENS, which was defined as follows [24,25,26,27]:
E N S = i = 1 ( P l o a d P i ) N t P i
where Pi is the unsupplied load connected to the i-th bus and is proportional to the amount of ENS in 24 h. As normalizing this value with the value before optimization, provides a better view and division is done during normalization, the hour value and line outage time were not included.
O F 4 = E N S E N S o

2.2. Multi-Objective Optimization of the Problem

The method of weighting or using weight coefficients is used to solve multi-objective optimization problems. By using the weighting method, a multi-objective problem becomes a single-objective problem. In this way, weight is considered for each of the objective functions, and the new objective function is the sum of the objective functions with its corresponding weight values. In this study, the method of weight coefficients was used to solve the multi-objective optimization problem [28,29,30].
The objective function of the optimization problem included three objectives of overload, voltage deviations, and power losses, as follows:
O F = ( O F 1 , O F 2 , O F 3 )
To convert this multi-objective problem into a single-objective problem, the weighted sum of each objective function is expressed as follows:
O F = K 1 O F 1 + K 2 O F 2 + K 3 O F 3
where K1, K2, and K3 are weight coefficients of the objective function that must add up to a unit. This is shown below:
K 1 + K 2 + K 3 = 1
The objective function of the optimization problem, including the four objectives of overload, voltage deviations, power losses, and reliability, was considered as follows:
O F = ( O F 1 , O F 2 , O F 3 , O F 4 )
O F = K 1 O F 1 + K 2 O F 2 + K 3 O F 3 + K 4 O F 4
where K1, K2, K3, and K4 are weight coefficients of the objective function. Theymust satisfy the following condition:
K 1 + K 2 + K 3 + K 4 = 1
The value of weighted coefficients for Equations (11) and (14) were determined considering the most important objective, i.e., overload and its effect on other objectives, especially reliability, using a trial-and-error method and repeated executions of optimization for different sets of coefficients and evaluating the results to obtain the best set of weighted coefficients. For Equation (11), K1, K2, and K3 were considered as 0.5, 0.3, and 0.2, respectively, and for Equation (14), K1, K2, K3, and K4 were set as 0.4, 0.2, 0.2, and 0.2, respectively.

2.3. Constraints

The power balance equations in the network lines must be established. This is equivalent to load distribution relations for all system buses [5,18].
P g i P l i = V i j = 1 j = N B V j [ B i j sin ( δ i δ j ) + G i j cos ( δ i δ j ) ]
Q g i Q l i = V i j = 1 j = N B V j [ G i j sin ( δ i δ j ) + B i j cos ( δ i δ j ) ]
where Pgi and Qgi are respectively the active and reactive power produced in the i-th bus and Pli and Qli are the active and reactive loads in the i-th bus, respectively. Bij and Gij are the real and imaginary parts of the admittance matrix of the network, respectively. δ i and δ j are the bus voltage angle at bus i and j, respectively.
The value of the decision variable, which is the reactance of DTCSC, must have limited values and cannot have any relation to the reactance of the line in which DTCSC is installed. Therefore, the following inequality constraints must be satisfied [5]:
2 X L i X D T C S C i 2 X L i
where XLi is the i-th line reactance before DTCSC installation and XDTCSCi is the i-th line reactance after DTCSC installation.
DTCSC controls the reactance of the line in which it is installed, and thus, the load flow. DTCSC is modeled in the form of a variable reactance transformer whose capacity value in each line is optimized using the IEOA, considering a multi-objective optimization framework.

3. Proposed Optimization Approach

3.1. Introduction of EOA

The EOA is modeled using the simple dynamic equilibrium of mass with the right combination in a control volume. The first-order differential equation describing the mass equilibrium is presented in (18), according to which the changes in mass are equal to the sum of the mass entering the system and the mass produced within it, minus the amount of mass leaving the system [21]:
V d c d t = Q C e q Q C + G
where C is the mass inside the control volume (V), VdC/dt is the amount of mass change in the control volume, Q is the amount of inlet and outlet flow rate, Ceq is the equilibrium mass, and G is the amount of mass produced among the control volume. Equation (18) can be rewritten as follows [21]:
d c λ C e q λ C + G V = d t
By integrating (19):
C = C e q + C 0 C e q F + G λ V 1 F
Therefore, based on (20), F is presented as follows [21]:
F = e λ t t 0
That is, t0 and C0 are the initial start time and mass.
In the EOA, a particle is equivalent to one solution, which is the mass of the same particle position in the PSO.

3.1.1. Initializing and Calculating the Fitness

Raw masses are produced randomly in the search space by particle numbers and dimensions with initialization:
C i   i n i t i a l = C min + r a n d i C max C min                       i = 1 , 2 , , n
where Ciinitial is the initial mass vector corresponding to the i-th particle, Cmin and Cmax are the lower and upper edge, respectively, randi denotes the random vector in the range [1, 0], and n is the EOA population particle numbers. The value of the suitability function of each particle was examined and after storage, equilibrium candidates were identified.

3.1.2. Balance Pool (Ceq)

In the EOA, the equilibrium state refers to the convergence condition of the algorithm, which represents the global optimal. Initially, no equilibrium information was available, and only equilibrium candidates were selected to achieve a particle search strategy. Four candidates were considered to make the EOA method more explorable and their average strengthened the operation phase. Equilibrium candidates were defined as equilibrium pool vectors based on the following relation [21]:
C e q , p o o l = C e q 1 , C e q 2 , C e q 3 , C e q 4 , C e q a v e
In the EOA, in each iteration, each particle randomly updates itself from among the candidates presented with a similar probability.

3.1.3. Exponential Expression (F)

The exponential expression (F) in the EOA strikes a balance between the exploration and exploitation phases. Over time, the rate of return fluctuates in a real control volume, so the value of λ is defined as a random vector in the range [1, 0]. Equation (21) is rewritten as follows [21]:
F = e λ t t 0
The duration t in terms of repetition (Iter) is expressed as follows [29]:
t = ( 1 I t e r M a x i t e r ) ( a 2   I t e r M a x i t e r )
That is, Iter and Max_iter refer to the number of present iterations and the maximum number of EOA iterations; respectively. Parameter a2 is a fixed number and is used for EOA usability. The following equation was presented to strengthen the convergence of the EOA method and improve the capability of phases related to exploration and exploitation [21]:
t 0 = 1 λ I n ( a 1 s i g n ( ( r 0.5 ) 1 e λ t ) + t
where a1 is a constant value that is responsible for controlling the discovery of the algorithm. Larger values of a1 improve exploration and reduce operating phase performance. On the other hand, smaller values of a2 weaken exploration and improve exploitation. The expression sign(r − 0.5) affects the direction of exploration and exploitation. r represents a random vector in the range [1, 0]. In this study, a1 and a2 are selected as 2 and 1, respectively.
Using (24) and (26), the following equation can be derived [29]:
F = a 1 s i g n   ( r 0.5 ) e λ t 1

3.1.4. Production Rate (G)

Production rate is one of the important parameters in achieving an accurate solution by improving the operation phase. The final set of production rate equations was expressed as follows [21]:
F = a 1   s i g n ( r 0.5 ) e λ t 1
G = G 0   e λ t t 0 = G 0   F
G 0 = G C P C e q λ C
G C P = 0.5   r 1                 r 2 G P     0                             r 2 G P
where G0 represents the initial value and k refers to the damping constant. r1 and r2 are random numbers in the range [1, 0]. The GCP vector represents the production rate control parameter and GP represents the production probability.
Therefore, the EOA update rule was defined based on the following relation [21]:
C = C e q + C C e q   .   F + G λ   V 1 F
where the first expression refers to the equilibrium mass and the second and third expressions refer to the mass changes. The role of the second expression is to achieve the optimal value through global search. The task of the third phrase is to further strengthen the exploration phase.

3.1.5. Particle Memory Storage

In the current iteration, the fitness value of particle is evaluated with respect to its previous value, and if the value of the fitness function is better, it is rewritten. Therefore, this strategy strengthens the operation phase and improves the performance of EOA in trapping in local optimization [21].

3.2. Overview of IEOA

In solving the optimization problem, the amount of inertia weight is very effective. In a situation where the inertia weight has a large number, the algorithm has a better capability in global search. However, in a situation with a small inertia weight, the algorithm has a better capability in local search. In the EOA, the value of the inertia weight in the initialization was considered a fixed number of 1. Therefore, it was necessary to consider the dynamics of inertial weight in strengthening its performance to reach the global optimum faster and avoid premature convergence and get trapped in the local optimal. In the optimization process of the EOA, the nonlinear inertia weight reduction strategy [31] was used to improve convergence, as follows:
ϖ ( t ) = ϖ L o w e r + ( 1 + cos ( π I t e r M a x _ i t e r ) 2 ) ε × ϖ U p p e r ϖ L o w e r
where ϖ L o w e r and ϖ U p p e r are the lower and upper values of ϖ , respectively. Here, ε = 10 [31].
By combining (26) and (27), the concentration update is given as follows:
(34) C = ϖ ( t ) C e q + ( C C e q ) F + G λ V ( 1 F ) (35) C = ( ϖ L o w e r + ( 1 + cos ( π I t e r M a x _ i t e r ) 2 ) ε × ϖ U p p e r ϖ L o w e r ) C e q + ( C C e q ) F + G λ V ( 1 F )

3.3. IEOA Implementation

In this section, the steps of optimal and multi-objective allocation of the DTCSC in the power system is presented, with the aim of minimizing overload, voltage deviations, and power losses and improving reliability. First, a contingency ranking considering overload values in different scenarios was implemented (item i means disconnection of line i). According to this emergency rating, cases 1, 2, and 10 were the most severe scenarios. The emergency contingency ranking determined that the line 9 outage was the most severe line outage incident in the IEEE 118-bus system. The flowchart of the proposed methodology is depicted in Figure 3.
Step (1) Identifying information of the studied system, including generators, transformers, and lines and determining the parameters of the algorithm, including iteration number and algorithm population.
Step (2) Load flow is performed and basic values of overload, voltage deviations, power losses, and reliability are calculated without the connection of the DTCSC.
Step (3) Based on the algorithm population, the optimization variables ( X D T C S C ) are randomly selected within its constraints.
Step (4) The value of the objective function is calculated for each set of variables selected in the previous step and the member corresponding to the best objective function is determined.
Step (5) The population of the IEOA is updated based on Equation (32).
Step (6) The value of the objective function is calculated for the updated population. If the best variable set has a better value than the previous one, the old value is updated with the new set.
Step (7) The population of the IEOA is updated based on Equation (35).
Step (8) The value of the objective function is calculated for the updated population in step 7. If the best variable set has a better value than the previous one in terms of the objective function, the old set is replaced with the new one.
Step (9) The conditions for achieving convergence (achieving the lowest value of OF and implementing maximum iterations of IEOA) are checked, and if the convergence conditions are established, go to step 10; otherwise, go to step 5.
Step (10) The optimal X D T C S C values are obtained.

4. Simulation Results and Discussion

The IEEE standard 14- and 118-bus power systems were selected for the implementation of the proposed methodology. First, our proposed methodology was implemented without considering the reliability index (ENS) in the objective function, and the performance of the IEOA was compared with the traditional EOA, PSO, and MRFO methods. Then, the problem was implemented considering the reliability of the objective function using the proposed IEOA algorithm and we compared it with the case without reliability.

4.1. Results of 14-Bus System

The IEEE 14-bus power system shown in Figure 4 consists of five generators, twenty branches, and three transformers. The demand for active power was 259 MW and reactive power was 73.5 MW. The rated power and voltage for the 14-bus power system were 100 MVA and 69 kV, respectively. The 14-bus network data were obtained from Ref. [32]. The parameters of each algorithm for solving the problem on the 14-bus system are presented in Table 1. The values of the coefficients of the algorithms were identified by trial-and-error and through simulations. The algorithm population was 100, the maximum number of repetitions was selected as 200, and there were 20 independent executions of each algorithm. In this system, lines 1, 2, and 10 were the most critical lines due to their outage probability from overloading. In Table 2, three scenarios are presented based on the outage of lines 1, 2, and 10 of the 14-bus power system. The objective values including overload, voltage deviations, and losses in the basic state of the system and without outage of the lines are given in Table 3.

4.1.1. Results of the First Scenario (Outage of Line One)

The convergence curves of different optimization methods in solving scenario one, are shown in Figure 5. As can be seen, compared with the traditional EOA, PSO, and MRFO methods, the proposed IEOA was able to achieve the lowest objective function value after 100 iterations, which indicates better performance of the IEOA over the other methods.
Statistical analysis based on 30 independent executions of the proposed IEOA compared with the EOA, PSO, and MRFO methods in terms of the mean, best, worst, and std values of the objective function for optimal allocation of the DTCSC is presented in Table 4. The objective function minimum values using the IEOA, EOA, PSO, and MRFO was 0.0320, 0.0429, 0.0437, and 0.0529, respectively. The IEOA achieved a lower best value compared with the other methods, confirming its superior performance.
In Table 5, different values of the objectives belonging to the best solution for each algorithm are listed. In the first column, the value of the objectives before optimization under the outage of line one is given. The IEOA obtained better objective value compared with other methods. The values of OL, DEV, and losses in scenario one, without optimal allocation of the DTCSC, were found to be 2.1555, 0.0252, and 0.4197, respectively. Using the IEOA, EOA, PSO, and MRFO methods, the values of OL were 0, 0.0069, 0.0263, and 0.0433, respectively; the values of DEV were 0.0021, 0.0021, 0.0024, and 0.0022, respectively; and the values of losses were 0.0148, 0.0341, 0.0190, and 0.0331, respectively. The results obtained from the different methods validated the superior performance of the IEOA in achieving lower OL, DEV, and losses for scenario one. As a result, the IEOA obtained lower values fpr OF1, OF2, OF3, and OF compared with the other methods.
The reactance values of each of the DTCSCs installed on the 14-bus power system are shown in Figure 6. The best solution obtained from the different algorithms is presented in Figure 6. As line number one was out of service, the DTCSC was not installed there. The program did not consider DTCSC for some lines.

4.1.2. Results of the Second Scenario (Outage of Line Two)

The convergence curve of different algorithms to solve scenario two is shown in Figure 7. Similar to the above case study, IEOA converged to the lowest objective function value, which indicated the effectiveness of this method in solving the problem.
In Table 6, a statistical analysis is performed based on 20 independent executions of the program for different methods, and the values of the objective function in terms of the mean, best, worst, and std values are presented. The IEOA obtained the lowest best value compared with other methods, showing its effectiveness.
In Table 7, the value of the objective using different methods was given, considering the line two outage. The IEOA method led to greater improvement in each of the objectives than the EOA, PSO, and MRFO methods. In scenario two, the objectives of OL, DEV, and loss without the DTCSC were obtained as 2.1555, 0.0252, and 0.4197, respectively. After DTCSC optimization based on IEOA, EOA, PSO, and MRFO methods, the value of OL was equal to zero for all methods; values of DEV were 0.0021, 0.0022, 0.0032, and 0.0021, respectively; and amounts of loss were 0.0245, 0.0285, 0.0258, and 0.0398, respectively. The superior performance of IEOA was confirmed in its lower values of OL, DEV, and losses for scenario two, compared with the other methods. The optimal value of DTCSC reactance for scenario two, determined for installation in lines of the 14-bus power system by different methods, is shown in Figure 8.

4.1.3. Results of the Third Scenario (Outage of Line 10)

The convergence profiles of the different algorithms used to solve scenario three are demonstrated in Figure 9. The superiority of the IEOA in achieving the lowest objective function value is confirmed in comparison with the other algorithms.
To assess the superiority of the IEOA over the EOA, PSO, and MRFO methods, a statistical analysis is presented considering the mean, best, worst, and std criteria, as listed in Table 8. According to Table 8, the IEOA obtained a better solution than the other algorithms. The values of the best solutions by IEOA, EOA, PSO, and MRFO were 0.0624, 0.0875, 0.0971, and 0.1076, respectively.
The numerical results related to solving scenario three are presented in Table 9. The IEOA reduced the overload value to 0 and obtained a lower objective function value by making compromises between different objectives. In scenario three, using the IEOA, EOA, PSO, and MRFO methods, the values of the OL were 0, 0, 0.0617, and 0.0764, respectively; values of DEV were 0.0021, 0.0038, 0.0022, and 0.0022, respectively; and values of losses were 0.0379, 0.0478, 0.0359, and 0.0337, respectively. The numerical results reveal the robustness of the IEOA in enhancing compromise of the objectives compared with other methods.
The optimal reactance values of the DTCSC using IEOA, EOA, PSO, and MRFO methods for this scenario in 14-bus system lines are depicted in Figure 10. The IEOA, by optimizing the reactance of DTCSC, improved network performance and eliminated overload.

4.2. Results of the 118-Bus System

In this section, the effectiveness of the proposed methodology was implemented on a large and interconnected power system: the IEEE 118-bus system [32]. According to Figure 11, the 118-bus system has 186 lines, 54 PV generator buses, and 132 load buses. Moreover, 14 installed parallel admittances provided a total of 4242 MW and 1438 MVAr of active and reactive power, respectively. The rated power and voltage for 118-bus power system were 100 MVA and 138 kV, respectively. By examining line outage, line nine was determined to be the most critical network line. The effect of the most critical line outage, line number nine, is examined in this section. The values of parameter coefficients from the different algorithms are given in Table 10. As the number of system lines was 186 branches, the algorithm had to determine 186 optimal values for DTCSC reactance. Due to the high volume of decision variables and complexity of the problem with 186 variables, the number of search particles was set at 1000.
In the 118-bus system, with the outage of line nine, the most overloads were imposed on network lines. In Table 11, different values of the objective function are presented without and with the outage of line nine. With the outage of line nine, the power loss of the system increased, and the voltage deviation of the network buses also increased. In addition, the overload on the system lines without DTCSC increased from 0 in the base case (without line nine outage) to 78.46 MW (with line nine outage).
The optimal and multi-objective DTCSC allocation was conducted using the proposed IEOA and the EOA, PSO, and MRFO methods for the 118-bus system. The convergence curves of the IEOA, EOA, PSO, and MRFO methods are shown in Figure 12. The IEOA achieved the lowest value of the objective function with a higher convergence speed.
Statistical analysis was conducted with 30 independent implementations for the IEOA, then compared with the EOA, PSO, and MRFO methods in terms of the mean, best, worst, and std values of the objective function. As listed in Table 12, the IEOA method obtained the lowest best value, compared with the other methods.
The results of the multi-objective allocation of the DTCSC in the 118- bus system using the IEOA, EOA, PSO, and MRFO methods are presented in Table 13. The results revealed that the IEOA converges to a lower value of the objective function. The values of OL, DEV, and losses without optimal DTCSC were 0.7846, 0.0126, and 2.0557, respectively. Using IEOA, EOA, PSO, and MRFO methods, the values of OL became 0.0387, 0.0216, 0, and 0.0449, respectively; values of DEV were 0.0041, 0.0049, 0.0032, and 0.0055, respectively; and the amounts of losses were 0.2326, 0.8065, 1.7222, and 1.02516, respectively. The obtained results indicated better performance of the IEOA in achieving lower OL, DEV, and losses compared with the EOA, PSO, and MRFO methods. Therefore, the IEOA obtained lower values of OF1, OF2, OF3, and OF compared with the other methods. The optimal reactance values of DTCSC installed on the lines of the 118-bus system based on the IEOA method are given in Table 14.

4.3. The Effect of Considering Reliability

In this section, the multi-objective allocation of the DTCSC in the 14- and 118-bus power systems is presented with the aim of minimizing overload, voltage deviations, power losses, and ENS by considering the effect of reliability in conditions of system line outages. The convergence curves of the DTCSC multi-objective allocation using the IEOA, considering reliability for a 14-bus power system for the three scenarios, are presented in Figure 13. The numerical results for the three different scenarios of the 14-bus system and the one scenario of the 118-bus system are presented in Table 15, Table 16, Table 17 and Table 18. By adding reliability to the objective function, we observed that the overload of the lines was reduced to zero in the 14- and 118-bus power system and all network loads were fed and no load was left without energy supply; in other words, ENS reached zero.

4.4. Effect of Load Demand Variations

In this section, we evaluate the effect of load demand variations (75 and 125% of nominal load) on solving the problem. The obtained IEOA results for the 14-bus system (scenario one) and 118-bus system are presented in Table 19 and Table 20, respectively. The results showed that, in the conditions of decreasing and increasing load demand, the amount of overload was zero. In addition, the load demand was fully met in this situation. In other words, the proposed methodology, even under conditions of increased load, resulted in the elimination of overload and a sufficient supply for system load demand, considering reliability as a part of the objective function. In addition, the results demonstrated that with an increase in load, the amount of losses and voltage deviations increased, and vice versa.

4.5. Effect of DTCSC Reactance Minimization (RM)

In this section, the numerical results of adding DTCSC reactance minimization to the overall objective function of the system, along with reliability, for 14- (scenario one) and 118-base systems using the IEOA method are given in Table 21 and Table 22, respectively. The results showed that considering minimization of the DTCSC reactance reduced the injection of reactive power into the system, as the amount of power losses and voltage deviations in this state was slightly higher than when not considering DTCSC reactance minimization. On the other hand, the results showed that considering the reliability in these conditions also led to the removal of overload and having full supply for the system demand.

4.6. Comparison with Previous Studies

The study carried out in this paper was based on the multi-objective allocation of the DTCSC in 14- and 118-bus power systems with the aim of minimizing overload, voltage deviations, power losses, and ENS under line outage, compared with results published in [5]. In [5], the allocation of DTCSC in the 14- and 118-bus systems was performed to minimize the overload, voltage deviations, and power losses with enhanced leader PSO (ELPSO) algorithms, galaxy-based search algorithm (GBSA), invasive weed optimization (IWO), and PSO.
Reliability assessment was not considered in [5]. In this paper, reliability was considered as part of the objective function and a new improved meta-heuristic algorithm was used to solve the optimization problem.
In Table 23, Table 24, Table 25 and Table 26, the IEOA performance in solving different scenarios related to the 14- and 118- bus systems is compared with results from Ref. [5]. This comparison showed that methodology based on the IEOA showed better ability in achieving lower values of overload, voltage deviations, and power losses. In addition, by considering reliability, the value of overload and energy supplied to customers reached zero. Therefore, the proposed methodology based on the IEOA was shown to be superior compared with the ELPSO, PSO, and GBSA methods used in Ref. [5].

5. Conclusions

In this paper, the optimal and multi-objective allocation of the DTCSC for minimizing overload, voltage deviations, power losses, and ENS was performed based on the improved equilibrium optimization algorithm (IEOA), incorporating reliability and power system line outage in different scenarios. The decision variables included DTCSC reactance in the power system lines. The proposed methodology was implemented on 14- and 118-bus power systems and performed without and with reliability in different scenarios of line outage. The capability of the IEOA method in solving the optimization problem without reliability was compared with the traditional EOA, PSO, and MRFO methods. The results showed that the optimal and multi-objective allocation of the DTCSC in 14- and 118-bus power systems minimized overload, voltage deviations, and power losses. Compared with other methods, the IEOA achieved better objectives in different scenarios. Moreover, the results showed that considering reliability had a significant effect on system overload, such that the amount of overload and ENS in all scenarios reached zero. The obtained results demonstrated that, with an increase in the load demand, the amount of losses and voltage deviations increased, and vice versa. Moreover, the findings showed that considering minimization of the DTCSC reactance resulted in slightly higher losses and voltage deviations. The results of demand variations and DTCSC reactance minimization demonstrated that considering reliability led to the elimination of overload and a full supply for the system demand. In addition, the comparison of the IEOA methodology with previous studies attested to the superiority of the presented methodology in terms of achieving the highest improvement in each of the objectives of the problem. We suggest implementing multi-objective allocation of the DTCSCs in power systems to improve the power quality indices for future work.

Author Contributions

M.K.: conceptualization, methodology, software, and writing—original draft; T.P.A.: conceptualization, methodology, software, and writing—original draft; E.S.N.: software and writing; A.Y.A.: investigation, supervision, validation, and writing—review and editing; A.A.-S.: writing—review and editing and funding; S.A.N.: investigation and writing—review and editing. All authors have read and agreed to the published version of the manuscript.

Funding

This research received no external funding.

Data Availability Statement

Not applicable.

Conflicts of Interest

The authors declare no conflict of interest.

References

  1. Farooq, Z.; Rahman, A.; Lone, S.A. Power generation control of restructured hybrid power system with FACTS and energy storage devices using optimal cascaded fractional-order controller. Optim. Control. Appl. Methods 2022, 43, 757–786. [Google Scholar] [CrossRef]
  2. Shakarami, M.R.; Davoudkhani, I.F. Wide-area power system stabilizer design based on grey wolf optimization algorithm considering the time delay. Electr. Power Syst. Res. 2016, 133, 149–159. [Google Scholar] [CrossRef]
  3. Kang, T.; Yao, J.; Duong, T.; Yang, S.; Zhu, X. A hybrid approach for power system security enhancement via optimal installation of flexible AC transmission system (FACTS) devices. Energies 2017, 10, 1305. [Google Scholar] [CrossRef] [Green Version]
  4. Khan, B.; Redae, K.; Gidey, E.; Mahela, O.P.; Taha, I.B.; Hussien, M.G. Optimal integration of DSTATCOM using improved bacterial search algorithm for distribution network optimization. Alex. Eng. J. 2022, 61, 5539–5555. [Google Scholar] [CrossRef]
  5. Jordehi, A.R.; Jasni, J.; Abd Wahab, N.; Kadir, M.Z.; Javadi, M.S. Enhanced leader PSO (ELPSO): A new algorithm for allocating distributed TCSC’s in power systems. Int. J. Electr. Power Energy Syst. 2015, 64, 771–784. [Google Scholar] [CrossRef]
  6. Ahmed, E.M.; Rakočević, S.; Ćalasan, M.; Ali, Z.M.; Hasanien, H.M.; Turky, R.A.; Aleem, S.H.A. BONMIN solver-based coordination of distributed FACTS compensators and distributed generation units in modern distribution networks. Ain Shams Eng. J. 2022, 13, 101664. [Google Scholar] [CrossRef]
  7. Wei, Z.; Shi, Y.; Ma, D.; Liu, G. Modified Particle Swarm Optimization algorithm by enhancing search ability of global optimal particle. In Proceedings of the 2015 12th IEEE International Conference on Electronic Measurement & Instruments (ICE-MI), Qingdao, China, 16–18 July 2015; pp. 451–457. [Google Scholar] [CrossRef]
  8. Ambriz-Perez, H.; Acha, E.; Fuerte-Esquivel, C.R. TCSC-firing angle model for optimal power flow solutions using Newton’s method. Int. J. Electr. Power Energy Syst. 2006, 28, 77–85. [Google Scholar] [CrossRef]
  9. Kazemi, A.; Badrzadeh, B. Modeling and simulation of SVC and TCSC to study their limits on maximum loadability point. Int. J. Electr. Power Energy Syst. 2004, 26, 619–626. [Google Scholar] [CrossRef]
  10. Vyas, B.Y.; Maheshwari, R.P.; Das, B. Improved fault analysis technique for protection of Thyristor controlled series compensated transmission line. Int. J. Electr. Power Energy Syst. 2014, 55, 321–330. [Google Scholar] [CrossRef]
  11. Jordehi, A.R. Brainstorm optimisation algorithm (BSOA): An efficient algorithm for finding optimal location and setting of FACTS devices in electric power systems. Int. J. Electr. Power Energy Syst. 2015, 69, 48–57. [Google Scholar] [CrossRef]
  12. Khan, A.N.; Imran, K.; Nadeem, M.; Pal, A.; Khattak, A.; Ullah, K.; Younas, M.W.; Younis, M.S. Ensuring reliable operation of electricity grid by placement of FACTS devices for developing countries. Energies 2021, 14, 2283. [Google Scholar] [CrossRef]
  13. Nadeem, M.; Imran, K.; Khattak, A.; Ulasyar, A.; Pal, A.; Zeb, M.Z.; Khan, A.N.; Padhee, M. Optimal placement, sizing and coordination of FACTS devices in transmission network using whale optimization algorithm. Energies 2020, 13, 753. [Google Scholar] [CrossRef] [Green Version]
  14. Tashakkori, A.; Abu-Siada, A.; Wolfs, P.J.; Islam, S. Optimal Placement of Synchronized Voltage Traveling Wave Sensors in a Radial Distribution Network. IEEE Access 2021, 9, 65380–65387. [Google Scholar] [CrossRef]
  15. Dash, S.K.; Mishra, S.; Abdelaziz, A.Y.; Hong, J.; Geem, Z.W. Optimal Planning of Multitype DGs and D-STATCOMs in Power Distribution Network Using an Efficient Parameter Free Metaheuristic Algorithm. Energies 2022, 15, 3433. [Google Scholar] [CrossRef]
  16. Tuzikova, V.; Tlusty, J.; Muller, Z. A novel power losses reduction method based on a particle swarm optimization algorithm using STATCOM. Energies 2018, 11, 2851. [Google Scholar] [CrossRef] [Green Version]
  17. Devi, S.; Geethanjali, M. Optimal location and sizing determination of Distributed Generation and DSTATCOM using Particle Swarm Optimization algorithm. Int. J. Electr. Power Energy Syst. 2014, 62, 562–570. [Google Scholar] [CrossRef]
  18. Fadel, W.; Kilic, U.; Taskin, S. Placement of Dg, Cb, and Tcsc in radial distribution system for power loss minimi-zation using back-tracking search algorithm. Electr. Eng. 2017, 99, 791–802. [Google Scholar] [CrossRef]
  19. Pereira, J.S.; Belati, E.A.; do Nascimento, C.F.; Silva, P.F.; Rossoni, P. A Mathematical Programming Approach for Allocation and Analysis of TCSC in Power Transmission Systems. IEEE Lat. Am. Trans. 2021, 20, 2001–2009. [Google Scholar] [CrossRef]
  20. Shiva, C.K.; Badi, M.; Babu, R.; Mahapatra, S.; Vedik, B.; Rangarajan, S.S. Thyristor controlled series compensator for the solution of reactive power management problem. AIP Conf. Proc. 2022, 2418, 040002. [Google Scholar]
  21. Faramarzi, A.; Heidarinejad, M.; Stephens, B.; Mirjalili, S. Equilibrium optimizer: A novel optimization algorithm. Knowl. -Based Syst. 2020, 191, 105190. [Google Scholar] [CrossRef]
  22. Kennedy, J.; Eberhart, R. Particle swarm optimization. Proceedings of ICNN’95—International Conference on Neural Networks, Perth, WA, Australia, 27 November–1 December 1995; Volume 4, pp. 1942–1948. [Google Scholar]
  23. Zhao, W.; Zhang, Z.; Wang, L. Manta ray foraging optimization: An effective bio-inspired optimizer for engineering applications. Eng. Appl. Artif. Intell. 2020, 87, 103300. [Google Scholar] [CrossRef]
  24. Naderipour, A.; Abdul-Malek, Z.; Nowdeh, S.A.; Ramachandaramurthy, V.K.; Kalam, A.; Guerrero, J.M. Optimal allocation for combined heat and power system with respect to maximum allowable capacity for reduced losses and improved voltage profile and reliability of microgrids considering loading condition. Energy 2020, 196, 117124. [Google Scholar] [CrossRef]
  25. Nowdeh, S.A.; Davoudkhani, I.F.; Moghaddam, M.H.; Najmi, E.S.; Abdelaziz, A.Y.; Ahmadi, A.; Razavi, S.E.; Gandoman, F.H. Fuzzy multi-objective placement of renewable energy sources in distribution system with objective of loss reduction and reliability improvement using a novel hybrid method. Appl. Soft Comput. 2019, 77, 761–779. [Google Scholar] [CrossRef]
  26. Sun, H.; Ebadi, A.G.; Toughani, M.; Nowdeh, S.A.; Naderipour, A.; Abdullah, A. Designing framework of hybrid photovoltaic-biowaste energy system with hydrogen storage considering economic and technical indices using whale optimization algorithm. Energy 2022, 238, 121555. [Google Scholar] [CrossRef]
  27. Jafar-Nowdeh, A.; Babanezhad, M.; Arabi-Nowdeh, S.; Naderipour, A.; Kamyab, H.; Abdul-Malek, Z.; Ramachandaramurthy, V.K. Meta-heuristic matrix moth–flame algorithm for optimal reconfiguration of distribution networks and placement of solar and wind renewable sources considering reliability. Environ. Technol. Innov. 2020, 20, 101118. [Google Scholar] [CrossRef]
  28. Hadidian-Moghaddam, M.J.; Arabi-Nowdeh, S.; Bigdeli, M.; Azizian, D. A multi-objective optimal sizing and siting of distributed generation using ant lion optimization technique. Ain Shams Eng. J. 2018, 9, 2101–2109. [Google Scholar] [CrossRef]
  29. Naderipour, A.; Nowdeh, S.A.; Saftjani, P.B.; Abdul-Malek, Z.; Mustafa, M.W.B.; Kamyab, H.; Davoudkhani, I.F. Deterministic and probabilistic multi-objective placement and sizing of wind renewable energy sources using improved spotted hyena optimizer. J. Clean. Prod. 2021, 286, 124941. [Google Scholar] [CrossRef]
  30. Naderipour, A.; Abdullah, A.; Marzbali, M.H.; Nowdeh, S.A. An improved corona-virus herd immunity optimizer algorithm for network reconfiguration based on fuzzy multi-criteria approach. Expert Syst. Appl. 2022, 187, 115914. [Google Scholar] [CrossRef]
  31. Jahannoush, M.; Nowdeh, S.A. Optimal designing and management of a stand-alone hybrid energy system using meta-heuristic improved sine–cosine algorithm for Recreational Center, case study for Iran country. Appl. Soft Comput. 2020, 96, 106611. [Google Scholar] [CrossRef]
  32. Christie, R. Power Systems Test Case Archive; Electrical Engineering Dept., University of Washington: Washington, DC, USA, 2000; Volume 108. [Google Scholar]
Figure 1. TCSC modules in transmission lines.
Energies 15 07478 g001
Figure 2. Circuit scheme of the DTCSC.
Energies 15 07478 g002
Figure 3. Proposed methodology based on the IEOA.
Energies 15 07478 g003
Figure 4. The 14-bus power system.
Energies 15 07478 g004
Figure 5. Convergence curve of different algorithms in solving scenario one for 14-bus system.
Energies 15 07478 g005
Figure 6. Optimal size of DTCSC using different algorithms in solving scenario one for 14-bus system.
Energies 15 07478 g006
Figure 7. Convergence curve of different algorithms in solving scenario two for 14-bus system.
Energies 15 07478 g007
Figure 8. Optimal size of DTCSC using different algorithms in solving scenario two for 14-bus system.
Energies 15 07478 g008
Figure 9. Convergence curve of different algorithms in solving scenario three for 14-bus system.
Energies 15 07478 g009
Figure 10. Optimal size of DTCSC using different algorithms in solving scenario three for 14-bus system.
Energies 15 07478 g010
Figure 11. Schematic of IEEE 118-bus system.
Energies 15 07478 g011
Figure 12. Convergence curve of different algorithms.
Energies 15 07478 g012
Figure 13. Convergence curves of different algorithms for 14-bus system considering reliability.
Energies 15 07478 g013
Table 1. Parameters of different algorithms for solving the problem on 14-bus system.
Algorithm/ParameterVariable NumberVariables LimitPopulation NumberMaximum IterationRepetition Number
IEOASystem Lines 2 X L i X L i + 2 X L i 10020020
EOASystem Lines 2 X L i X L i + 2 X L i 10020020
PSOSystem Lines 2 X L i X L i + 2 X L i 10020020
MRFOSystem Lines 2 X L i X L i + 2 X L i 10020020
Table 2. Investigated scenarios for the 14-bus power system.
ScenarioLine OutageSending BusEnding Bus
1112
2215
31056
Table 3. The values of different objectives for base system without outage.
TemValue
Ploss (MW)13.39
DEV0.0349
OL55.84
Table 4. Statistical analysis of the objective function using different methods in solving scenario one for 14-bus system.
OF/MethodIEOAEOAPSOMRFO
Mean0.04010.04430.04510.0538
Std0.0180.020.0220.028
Best0.0320.04290.04370.0529
Worst0.04310.04780.04820.0551
Table 5. The results of different objectives using different methods in solving scenario one for 14-bus system.
OF/MethodBase SystemIEOAEOAPSOMRFO
OL2.155500.00690.02630.0433
DEV0.02520.00210.00210.00240.0022
Ploss (MW)0.41970.01480.03410.0190.0331
OF1-00.00320.01220.0201
OF2-0.08320.08430.09530.0902
OF3-0.03520.08140.04530.0789
OF10.0320.04290.04370.0529
Table 6. Statistical analysis of the objective function using different methods in solving scenario two for 14-bus system.
OF/MethodIEOAEOAPSOMRFO
Mean0.05170.05460.05960.0573
Std0.0290.0270.0320.037
Best0.04580.05050.05880.0597
Worst0.05370.05620.06260.0541
Table 7. Results of different objectives using different methods in solving scenario two for 14-bus system.
OF/MethodBase SystemIEOAEOAPSOMRFO
OL2.15550000
DEV0.02520.00210.00220.00320.0021
Ploss (MW)0.41970.02450.02850.02580.0398
OF1-0000
OF2-0.07480.0780.1140.0728
OF3-0.11710.13570.12290.1859
OF10.04580.05050.05880.0597
Table 8. Statistical analysis of the objective function using different methods in solving scenario three for 14-bus system.
OF/MethodIEOAEOAPSOMRFO
Mean0.06590.08860.09830.1087
Std0.0320.0280.0350.038
Best0.06240.08750.09710.1076
Worst0.07840.08920.10480.1102
Table 9. The results of different objectives using different methods in solving scenario three for 14-bus system.
OF/MethodBase SystemIEOAEOAPSOMRFO
OL2.1555000.06170.0764
DEV0.02520.00210.00380.00220.0022
Ploss (MW)0.41970.03790.04780.03590.0377
OF1-000.07280.0971
OF2-0.05640.10010.05870.0573
OF3-0.22740.28770.21550.2266
OF10.06240.08750.09710.1076
Table 10. Parameters of different algorithms for solving the problem on the 118-bus system.
Algorithm/ParameterVariable NumberVariables LimitPopulation NumberMaximum IterationRepetition Number
IEOASystem Lines 2 X L i X L i + 2 X L i 100020020
EOASystem Lines 2 X L i X L i + 2 X L i 100020020
PSOSystem Lines 2 X L i X L i + 2 X L i 100020020
MRFOSystem Lines 2 X L i X L i + 2 X L i 100020020
Table 11. Different objective values in the 118-bus system for base system and with line nine outage.
OF/ScenarioBase SystemOutage of Line Nine
Ploss (MW)1.32862.0557
DEV0.00870.0126
OL00.7846
Table 12. Statistic analysis of the objective function using different methods for 118-bus system.
OF/MethodIEOAEOAPSOMRFO
Mean0.06590.08860.09830.1087
Std0.0320.0280.0350.038
Best0.14480.20880.24370.2592
Worst0.07840.08920.10480.1102
Table 13. Results of different objectives using different methods for 118-bus system and scenario one.
Objective FunctionBase SystemIEOAEOAPSOMRFO
OL0.78460.03870.021600.0449
DEV0.01260.00410.00490.00320.0055
Ploss (MW)2.05570.23260.80651.72221.0251
OF1-0.04930.027500.0572
OF2-0.32540.38880.25390.4365
OF3-0.11130.39230.83770.4986
OF10.14480.20880.24370.2592
Table 14. Optimal size of DTCSC using the IEOA in solving scenario one for 118-bus system.
BranchXDTCSCBranchXDTCSCBranchXDTCSCBranchXDTCSC
1−0.040948−0.157895−0.00591420.0362
20.0608149−0.032396−0.1326143−0.1369
30.01022500.0028597−0.05881440.04021
40.08757510.02402980.04087145−0.0942
50.05599520.2107499−0.0372146−0.135
6−0.0325530.208721000.29028147−0.0314
70.0028554−0.1017101−0.05851480.3237
8−0.012955−0.01871020.00425149−0.0427
9−0.020156−0.02761030.172841500.13505
100.0046157−0.00261040.003681510.08896
110.13658−0.0126105−0.2023152−0.1877
120.02225590.33347106−0.07811530.00196
130.0076860−0.2914107−0.02711540.11603
140.25069610.12221108−0.0012155−0.0072
15−0.0296620.194921090.297771560.10101
16−0.0977630.248461100.065511570.15156
170.12479640.09243111−0.1118158−0.006
180.055865−0.0027112−0.03821590.09702
190.28409660.151411130.044941600.16449
200.16266670.397591140.104791610.07149
21−0.024768−0.0816115−0.0766162−0.2113
22−0.229869−0.01611160.138591630.05529
230.03803700.043641170.033381640.1502
24−0.0307710.00927118−0.0041165−0.0653
250.2273672−0.0867119−0.00631660.31964
260.02386730.2186120−0.05621670.458
270.136274−0.10821210.022881680.01671
28−0.123875−0.16331220.0155169−0.0499
29−0.068876−0.3448123−0.0351700.16234
300.00184770.08263124−0.1825171−0.06
310.01152780.01851250.086031720.28423
320.02321790.023691260.03244173−0.0359
33−0.092980−0.0251127−0.0695174−0.2714
340.1304881−0.1351128−0.13131750.05373
350.1428682−0.16341290.018591760.11113
36−0.016683−0.133130−0.06211770.00536
370.04151840.37442131−0.02421780.02964
380.11898850.14479132−0.0959179−0.129
390.23832860.07913133−0.02811800.02407
400.0436687−0.14011340.00521810.11211
41−0.072288−0.04921350.0961182−0.0151
42−0.122389−0.0091360.184781830.0047
430.08456900.00715137−0.1409184−0.1099
44−0.1338910.07332138−0.1373185−0.0212
450.4937292−0.0121390.056821860.01484
46−0.017993−0.0414140−0.0588
47−0.0899940.01813141−0.0146
Table 15. Results of different objectives using IEOA for 14-bus system with and without reliability (scenario one).
OF/ModeWithout ReliabilityWith Reliability
OL00
DEV0.00210.00217
Ploss (MW)0.01480.0184
ENS125.10950
OF100
OF20.08320.0861
OF30.03520.0439
OF4--0
OF0.0320.026
Table 16. The results of different objectives using IEOA for 14-bus system with and without reliability (scenario two).
OF/ModeWithout ReliabilityWith Reliability
OL00
DEV0.00210.002
Ploss (MW)0.02450.0322
ENS176.96570
OF100
OF20.07480.0728
OF30.11710.1537
OF4--0
OF0.04580.0453
Table 17. Results of different objectives using IEOA for 14-bus system with and without reliability (scenario three).
OF/ModeWithout ReliabilityWith Reliability
OL00
DEV0.00210.0045
Ploss (MW)0.03790.0304
ENS223.05150
OF100
OF20.05640.116
OF30.22740.1824
OF4--0
OF0.06240.0596
Table 18. Results of different objectives using IEOA for 118-bus system with and without reliability.
OF/ModeWithout ReliabilityWith Reliability
OL0.03870
DEV0.00410.001
Ploss (MW)0.23260.4585
ENS280
OF10.04930
OF20.32540.0817
OF30.11310.223
OF4--0
OF0.14480.0609
Table 19. Results of load demand variation for 14-bus system (scenario one) using IEOA.
OF/Mode75% Demand100% Demand125% Demand
OL000
DEV0.002130.002170.0023
Ploss (MW)0.01010.01840.0424
ENS000
OF1000
OF20.0550.08610.0912
OF30.0240.04390.1007
OF4000
OF0.02220.0260.0382
Table 20. Results of load demand variation for 118-bus system (scenario one) using IEOA.
OF/Mode75% Demand100% Demand125% Demand
OL000
DEV0.00090.0010.0011
Ploss (MW)0.25610.45850.9857
ENS000
OF1000
OF20.0514 0.010280.08170.0863
OF30.12930.2230.4083
OF4000
OF0.03610.06090.0989
Table 21. Results of DTCSC reactance minimization (RM) for 14-bus system (scenario one) using IEOA.
OF/ModeWithout RMWith RM
OL00
DEV0.002170.00231
Ploss (MW)0.01840.0219
ENS00
OF100
OF20.08610.0918
OF30.04390.0522
OF400
OF0.0260.0288
Table 22. Results of DTCSC reactance’s minimization (RM) for 118-bus system (scenario one) using IEOA.
OF/ModeWithout RMWith RM
OL00
DEV0.0010.001
Ploss (MW)0.45850.5593
ENS00
OF100
OF20.08170.0819
OF30.2230.272
OF400
OF0.06090.0707
Table 23. Results of different objectives using different methods for scenario one for 14-bus system.
OF/MethodBase CaseIEOA (without Reliability)IEOA (with Reliability)GBSA [5]PSO [5]ELPSO [5]
OL2.1555000.35780.03150.0229
DEV0.02520.00210.002170.00132.06 × 1049.09 × 104
Ploss (MW)0.41970.01480.01840.12340.05570.0623
ENS285.32125.10950------
OF--0.0320.0260.20630.04280.0394
Table 24. Results of different objectives using different methods for scenario two for 14-bus system.
OF/MehtodBase CaseIEOA (without Reliability)IEOA (with Reliability)IWO [5]PSO [5]ELPSO [5]
OL2.1555000.05120.0160.025
DEV0.02520.00210.00210.00215.63 × 1042.11 × 104
Ploss (MW)0.41970.02450.03220.08350.05130.0456
ENS285.32176.96570------
OF--0.04580.04530.1620.07240.0638
Table 25. Results of different objectives using different methods for scenario three for 14-bus system.
Objective FunctionBase CaseIEOA (without Reliability)IEOA (with Reliability)IWO [5]PSO [5]ELPSO [5]
OL2.1555000.03220.14790.1724
DEV0.02520.00210.00450.0120.0020
Ploss (MW)0.41970.03790.03040.08190.09980.0811
ENS285.32223.05150------
OF--0.06240.05960.30730.36720.077
Table 26. The results of different objectives using IEOA for 118-bus system.
OF/MehtodBase CaseIEOA (without Reliability)IEOA (with Reliability)IWO [5]PSO [5]ELPSO [5]
OL0.78460.038702.71252.08191.5885
DEV0.01260.00410.0010.002200
Ploss (MW)2.05570.23260.45851.60331.62511.452
ENS113.46280------
OF--0.14480.06090.48460.36620.2921
Publisher’s Note: MDPI stays neutral with regard to jurisdictional claims in published maps and institutional affiliations.

