1. Introduction
The Kingdom of Saudi Arabia (KSA) is one of the largest oil producing countries with a considerable share of oil and gas production [
1]. For this reason, it is heavily reliant on fossil fuel for its energy supply, including electricity generation [
2]. In 2019, 56.4% of electricity was generated by gas, followed by 43.5% from oil, with renewable energy resources only contributing around 0.1% [
3]. Saudi Arabia has embarked on a path of energy diversification for electricity generation to address both environmental concerns and to maximise the financial return from its fossil fuel reserves. However, the country is blessed with both high solar irradiance [
4] and a good wind resource [
5], which creates the opportunity for a renewable-based transition for its electricity power generation [
6].
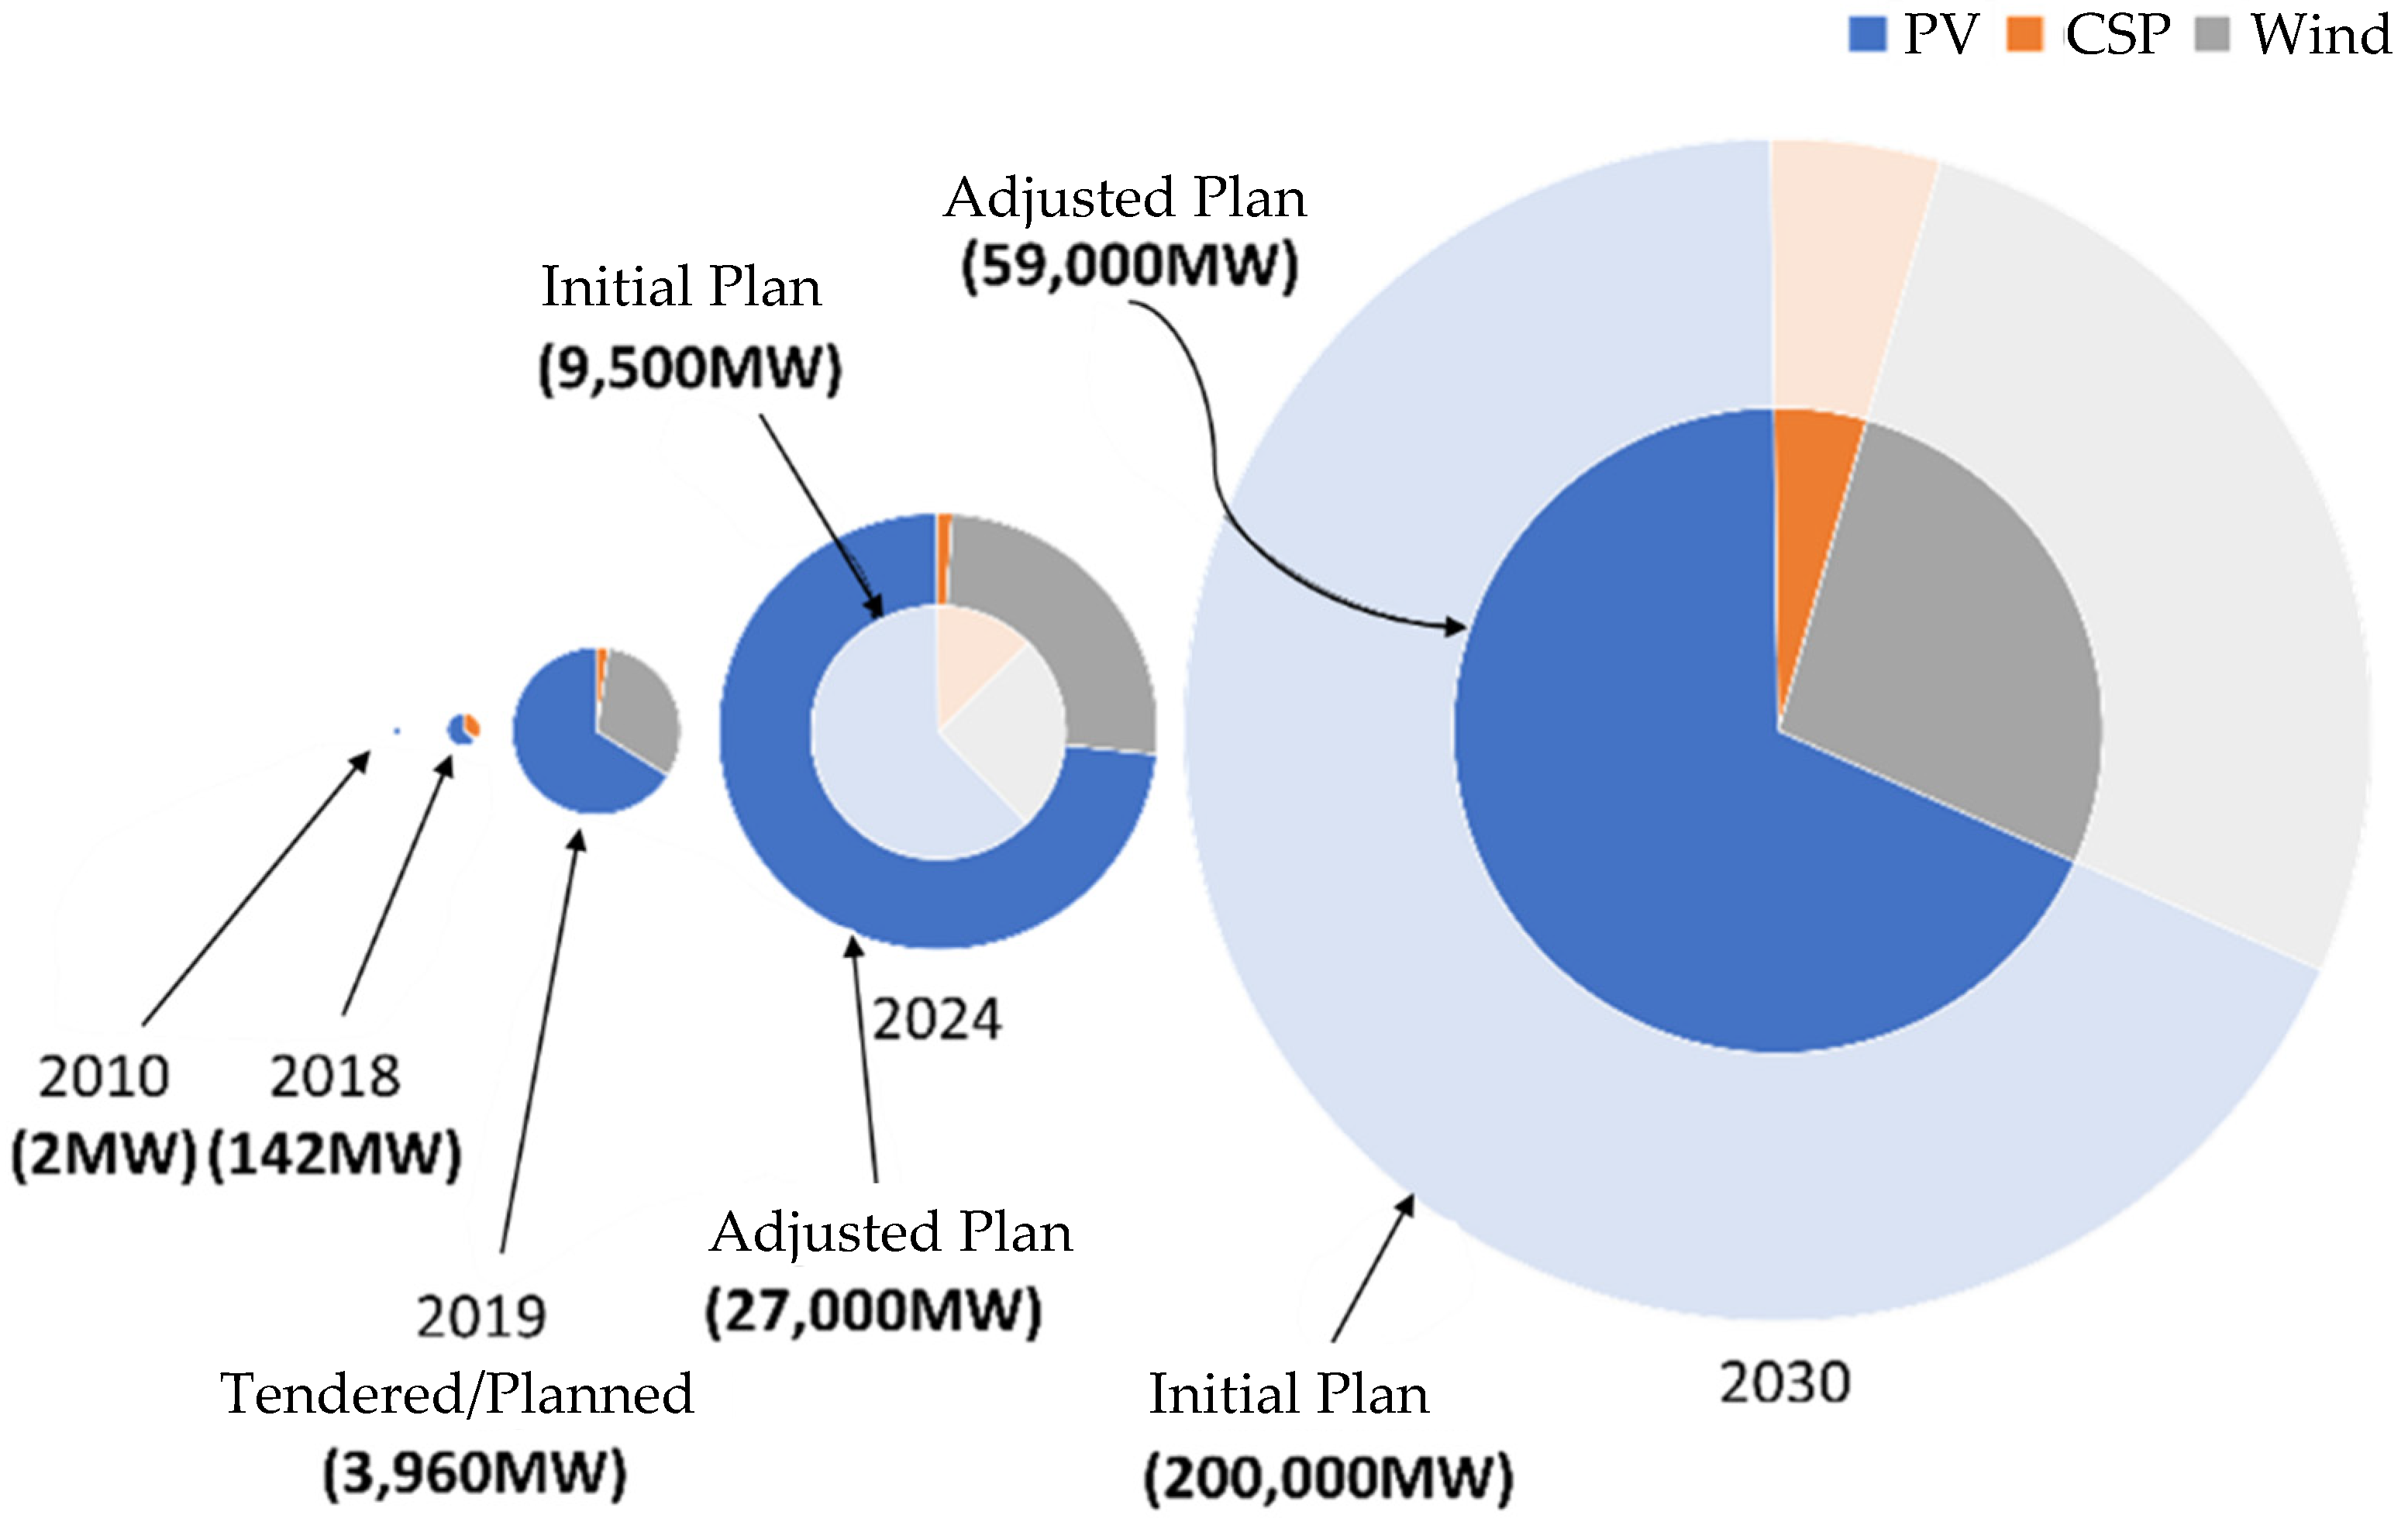
The exploitation of the renewable energy resources has been discussed across various governmental entities. One of the most solid proposals is the Ministry of Energy’s (ME) plan to have approximately 60 GW of renewable energy capacity installed by 2030, consisting of 40 GW solar photovoltaics (PV), 16 GW of wind and 2.7 GW of concentrated solar power (CSP),
Figure 1 [
6].
These plans were announced by the Renewable Energy Projects Development Office (REPDO), which was established by the ME to realise the capacity targets. REPDO has set a limit to how much of the projects’ value can be imported and how much should be delivered by the country’s local suppliers and service providers. The project value includes fixed and variable costs associated with the construction and running of the project. This limit is referred to hereafter as local content (LC). REPDO has three LC targets for PV and wind developments in KSA. Currently, the LC is required to be 17–19% of a project cost, rising to 33–35%, by 2024–2025, with a long-term target from 2028 and beyond of 40–45% [
6]. Such LC targets for renewable energy projects are also in-line with the recently announced plan to reach net zero greenhouse gas emissions by 2060 [
7].
Figure 1.
Saudi Arabia historical capacity and future projected expansion of renewable energy deployment [
6,
8].
Figure 1.
Saudi Arabia historical capacity and future projected expansion of renewable energy deployment [
6,
8].
Having only 0.36 GW of solar PV installed capacity in 2020 [
8] means that KSA needs to expand by more than 110 times its current solar PV capacity to reach 40 GW by 2030. The currently installed 300 MW solar PV farm Sakaka project covers an area of approximately 6 km
2 [
9]. For a target of 40 GW capacity at the same area density would require around 800 km
2, which represents around half the area of Greater London [
10]. Clearly, such an expansion will require a robust and optimised supply chain and local content understanding to attain the ambitious 40 GW target. Hence, this work addresses the needed evidence to support the needed expansion in PV deployment to achieve the required target through novel approaches in supply chain requirements. Such a study is seminal, as it models large-scale PV and for the first time in the region.
2. Renewable Energy Decisions and Deployment in Saudi Arabia
Entities involved in the renewable energy sector in KSA and their interrelationship are shown in
Figure 2.
Decisions considering renewable energy needs and targets are taken by the Council of Ministers (COM) [
11], and these may be influenced by the Consultative Assembly of Saudi Arabia (CASA) [
12]. Then, a royal decree of the decisions made is passed to the Ministry of Energy (ME) [
13], where the details are set by REPDO and the National Renewable Energy Program (NREP), which both belong to ME [
6]. REPDO then creates a Request For Qualification (RFQ), which is open for local and international developers and contractors [
14]. This is followed by the planning of a bidding-based competition and the required timeline for the renewable energy projects in Saudi Arabia to be deployed [
15]. At the same time, REPDO and the Local Content Governmental Purchases Authority (LCGPA) [
16] set the minimum limit of the LC required for local and international contractors to meet. REPDO also creates a “marketplace”, which is a database for RE local suppliers and manufacturers. Local and international contractors access this marketplace to increase the project’s LC to the established limit. Concurrently, King Abdullah City for Atomic and Renewable Energy (K.A.CARE) [
17] provides the required data and studies about renewable energy resources and locations to local and international contractors. In a separate initiative, the Public Investment Funds (PIF) collaborates with the ME and K.A.CARE to work on potential increments in renewable energy projects in addition to those set by ME [
6]. Another funding entity is the Saudi Industrial Development Funds (SIDF), which also works in collaboration with ME to fund local businesses that are willing to be part of the renewable energy sector in KSA [
18].
In addition to REPDO and PIF plans to increase the renewable energy capacity in Saudi Arabia, NEOM, a multibillion-dollar futuristic green city being built in the North of Saudi Arabia, announced undetailed plans to install between 4 GW and 30 GW of renewable energy capacity by 2030 [
19]. The most recent announced breakdown by NEOM is their plan to utilise between 16 GW and 20 GW of solar PV power capacity and between 8 GW and 10 GW for wind power capacity [
20]. In addition to the installation and database, K.A.CARE is currently designing training courses to support capacity building that cover various aspects of renewable energy-related industries [
17].
3. Assessing Local Content in Saudi Arabia
The LC for a PV farm can be considered across seven aspects: (i) PV module, (ii) inverter, (iii) structure, (iv) electrical, (v) civil works, (vi) administration and (vii) other.
REPDO has established a company registration system to try and understand the growth of in-country capacity across these sectors. Whilst the number of PV suppliers and manufacturers registered with REPDO has been increasing [
21], there is a need to understand if this company mix will enable the 2030 LC goals to be achieved. It is, however, unlikely that KSA will become a manufacturer of solar cells in its own right within the target timeframe. This is because China currently dominates this sector with around 80% of worldwide production [
22]; hence, there will be no LC associated with solar cell manufacture in KSA.
In
Table 1, the 2018 data from [
23] shows that the local content percentage cost of modules is 34%, whilst for 2023, it was projected to be 45% by the same study. The last column of
Table 1 indicates the project cost of the modules for 2023 will be 15.3% {34 × 45/100} of the project total cost. The same process is applied to estimate the other LC values in the table. For 2018, the overall LC for the 10 MW plant is 47%, which is projected to rise to 74% in 2023. According to [
23], the cost of the solar cells was 56% out of the total module costs (=34% of the overall system cost). Therefore, if Saudi Arabia were to assemble all PV modules in the country, as opposed to importing modules from overseas, it would achieve an LC uplift of 15% {34 × (100 − 56)% = 15%}. However, for a project similar to Sakaka where the module component represents 44% of the total cost, the uplift can be 19% {44 × (100 − 56)% = 19%}. In terms of deployment by 2030, this aspect alongside increasing local manufacture of inverter components appears to be the most realistic option to enhancing the LC in Saudi Arabia renewables projects.
Table 2 shows details of the 300 MW Sakaka 2019 project for which we calculated local content as per the text below.
The website of the developer Sakaka Solar Energy Company (SSEC) states that their project achieved a local content level of >30% [
24]. However, our communication with SSEC confirmed that the local content exceeded 35% for the 300 MW project [
25]. ACWA Power’s IPP financing for the SAKAKA project was USD 302 million [
26]. We used Bloomberg/IEA published monocrystalline PV module costs [
27] to estimate the fraction of the Sakaka project associated with PV modules. As per [
27], the average for the year 2017 (USD (2015) 0.4
$/Wp) and 2018 (USD (2015) 0.3
$/Wp) module prices have been adjusted to USD 2021 (+25%) to give a module price of 0.44
$/Wp. Hence, based on IEA module cost data, for a 300 MW farm, the module cost corresponds to USD 131 million, or 44% of overall project costs (
Table 2). The overall local content cost was estimated to be 35%. The overall local content percentage is obtained by multiplying 56%, which is the cost of non-module components in the project by 63%, which is the local content percentage of the non-module components. Since the local content percentage for module part is zero, the total local content for the Sakaka project is the local content percentage for non-module components.
In our considerations, we assume that the local content of the PV modules is zero for the Sakaka project, as the project website indicates a Chinese module manufacturer as a partner [
27]. Furthermore, at the time, all solar PV modules in the Saudi market were imported [
28]. Hence, using the local content value given by the developer SSEC [
25] of 35% (which is consistent with our analysis using IEA figures mentioned above (
Table 2)), the local content of non-module aspects of the project is therefore around 63%. Hence, in this work, we consider future projects to follow the Sakaka local content profile but with the provision of in-country module fabrication.
By using module fabrication cost percentage of both 10 MW and 300 MW projects as shown in
Table 1 and
Table 2, and excluding cell cost percentage from the module cost, it is apparent that KSA’s LC targets (33–35% by 2024) can be achieved without in-country module fabrication. However, the subsequent higher LC targets will require in-country module fabrication. This poses the question if the projected trend for module fabrication capacity in Saudi Arabia is in-line with the planned deployment rate of PV or if there is a potential shortfall. This work endeavours to provide the evidence of the issue through a modelling approach discussed in the following sections.
4. Assessing PV Module Fabrication Capacity in Saudi Arabia
As indicated previously, REPDO established an online database where renewable energy local manufacturers and service providers can register. The purpose of this database is to provide local and international contractors with a one-stop website to find local businesses involved in the sector. The number of companies registered on this platform between 2017 and 2020 [
21] was logged by accessing the platform and recording each company registration (and their characteristics) at monthly intervals.
In this work, only companies classified as PV module manufacturers were considered to assess PV module fabrication capacity.
Figure 3 shows a linear projection of the number of registered companies to 2030. The projection assumes that the number of local registered renewable energy companies will not be affected by external factors, such as additional (not yet announced) governmental incentives or subsidies, and so the rate of local manufacturer growth will remain constant.
Saudi Arabia is starting from a low base in terms of PV module manufacturing (three companies as of October 2019 [
21]), which suggests that in-country capacity to support 40 GW of PV by 2030 is quite limited. This trend can be considered as a business-as-usual scenario development.
The capacity of each local PV manufacturer will need to be estimated because there are no real data available in this regard. To address this paucity of data, we considered the work of Hirshman et al. [
29], who in 2015 surveyed the cell production and gathered capacity and production data of notable PV module manufacturers from 49 manufacturers, 17 countries, who produced 7 different PV module technologies for the year 2015. This source was selected because it was the only one that offers diverse manufacturers along with their capacity and real production for the respective year. Our analysis of the data provided a median for the production of 143 MW/factory/year. A box-and-whisker diagram was plotted (
Figure 4) to examine the extreme values and outliers.
In addition to the scenario of the business-as-usual (BAU) projection (
Figure 3 trend) of PV module local fabrication capacity, REPDO has announced a more optimistic plan, which states that there will be financial support for up to six PV module manufacturers with annual capacity between 500 MW and 1000 MW [
18].
This plan is to increase in-country manufacturing and is referred to as the REPDO support plan, representing a second scenario in our study.
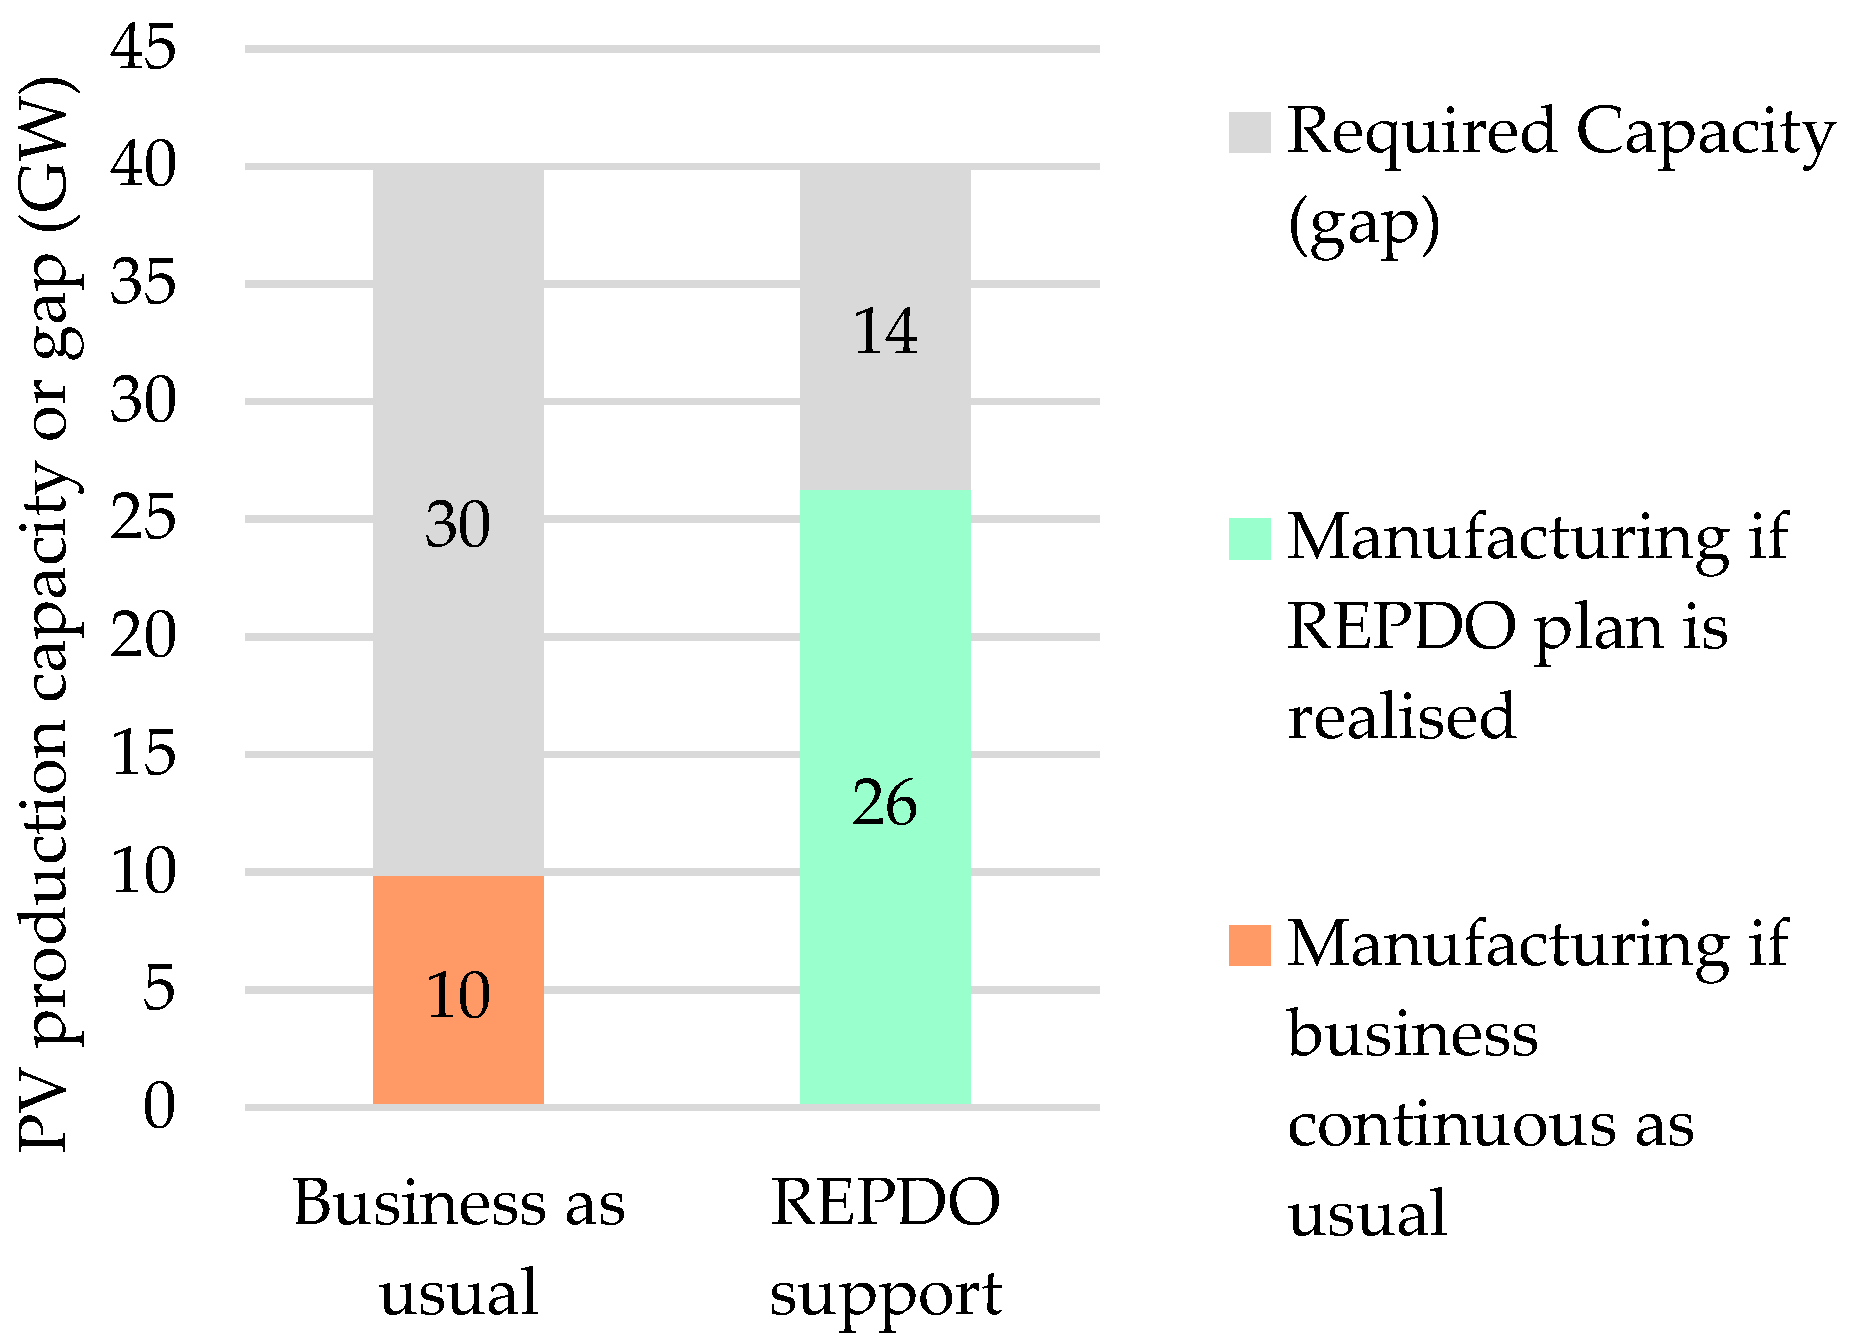
Figure 5 shows an escalating deployment trend for the 40 GW of the PV target (green line) compared with the in-country manufacturing capacity for business-as-usual (blue) and REPDO enhanced (grey, assumed as even investment between 2020 and 2029).
By 2030, it is estimated that there will be a shortfall of 30 GW (40—total cumulative capacity under BAU trend giving installed capacity of 10 GW in
Figure 5) of PV module manufacturing if the business-as-usual approach continues, or 14 GW (40—total cumulative capacity under REPDO trend giving installed capacity of 26 GW in
Figure 5) if the REPDO initiative to support local PV module manufacturers is realised (
Figure 6). This is equivalent to an average annual shortage of 3 GW/year for the business-as-usual and 1.5 GW/year for the REPDO proposed plan.
Using the median manufacturing capacity of 143 MW/factory/year mentioned earlier, the additional number of factories required will be 21 for business-as-usual and 10 for the REPDO plan. If this number is met, 100% of required PV modules for the 40 GW solar PV plan could be sourced locally. This is because a gap of 30 GW over 10 years means a gap of 3 GW every year. By dividing 3 GW by the median manufacturing capacity of 143 MW/factory/year, we obtain the required number of factories that covers this gap, which is 21 factories. Similarly, by dividing 14 GW over 10 years, we estimate the yearly gap with the REPDO plan will be 1.4 GW. It will take 10 factories at the capacity of 143 MW/factory/year to cover this gap. An assessment of how a new manufacturing capacity can be achieved in location in Saudi Arabia is considered in the following sections.
5. Supply Pathways and Logistics Scenarios
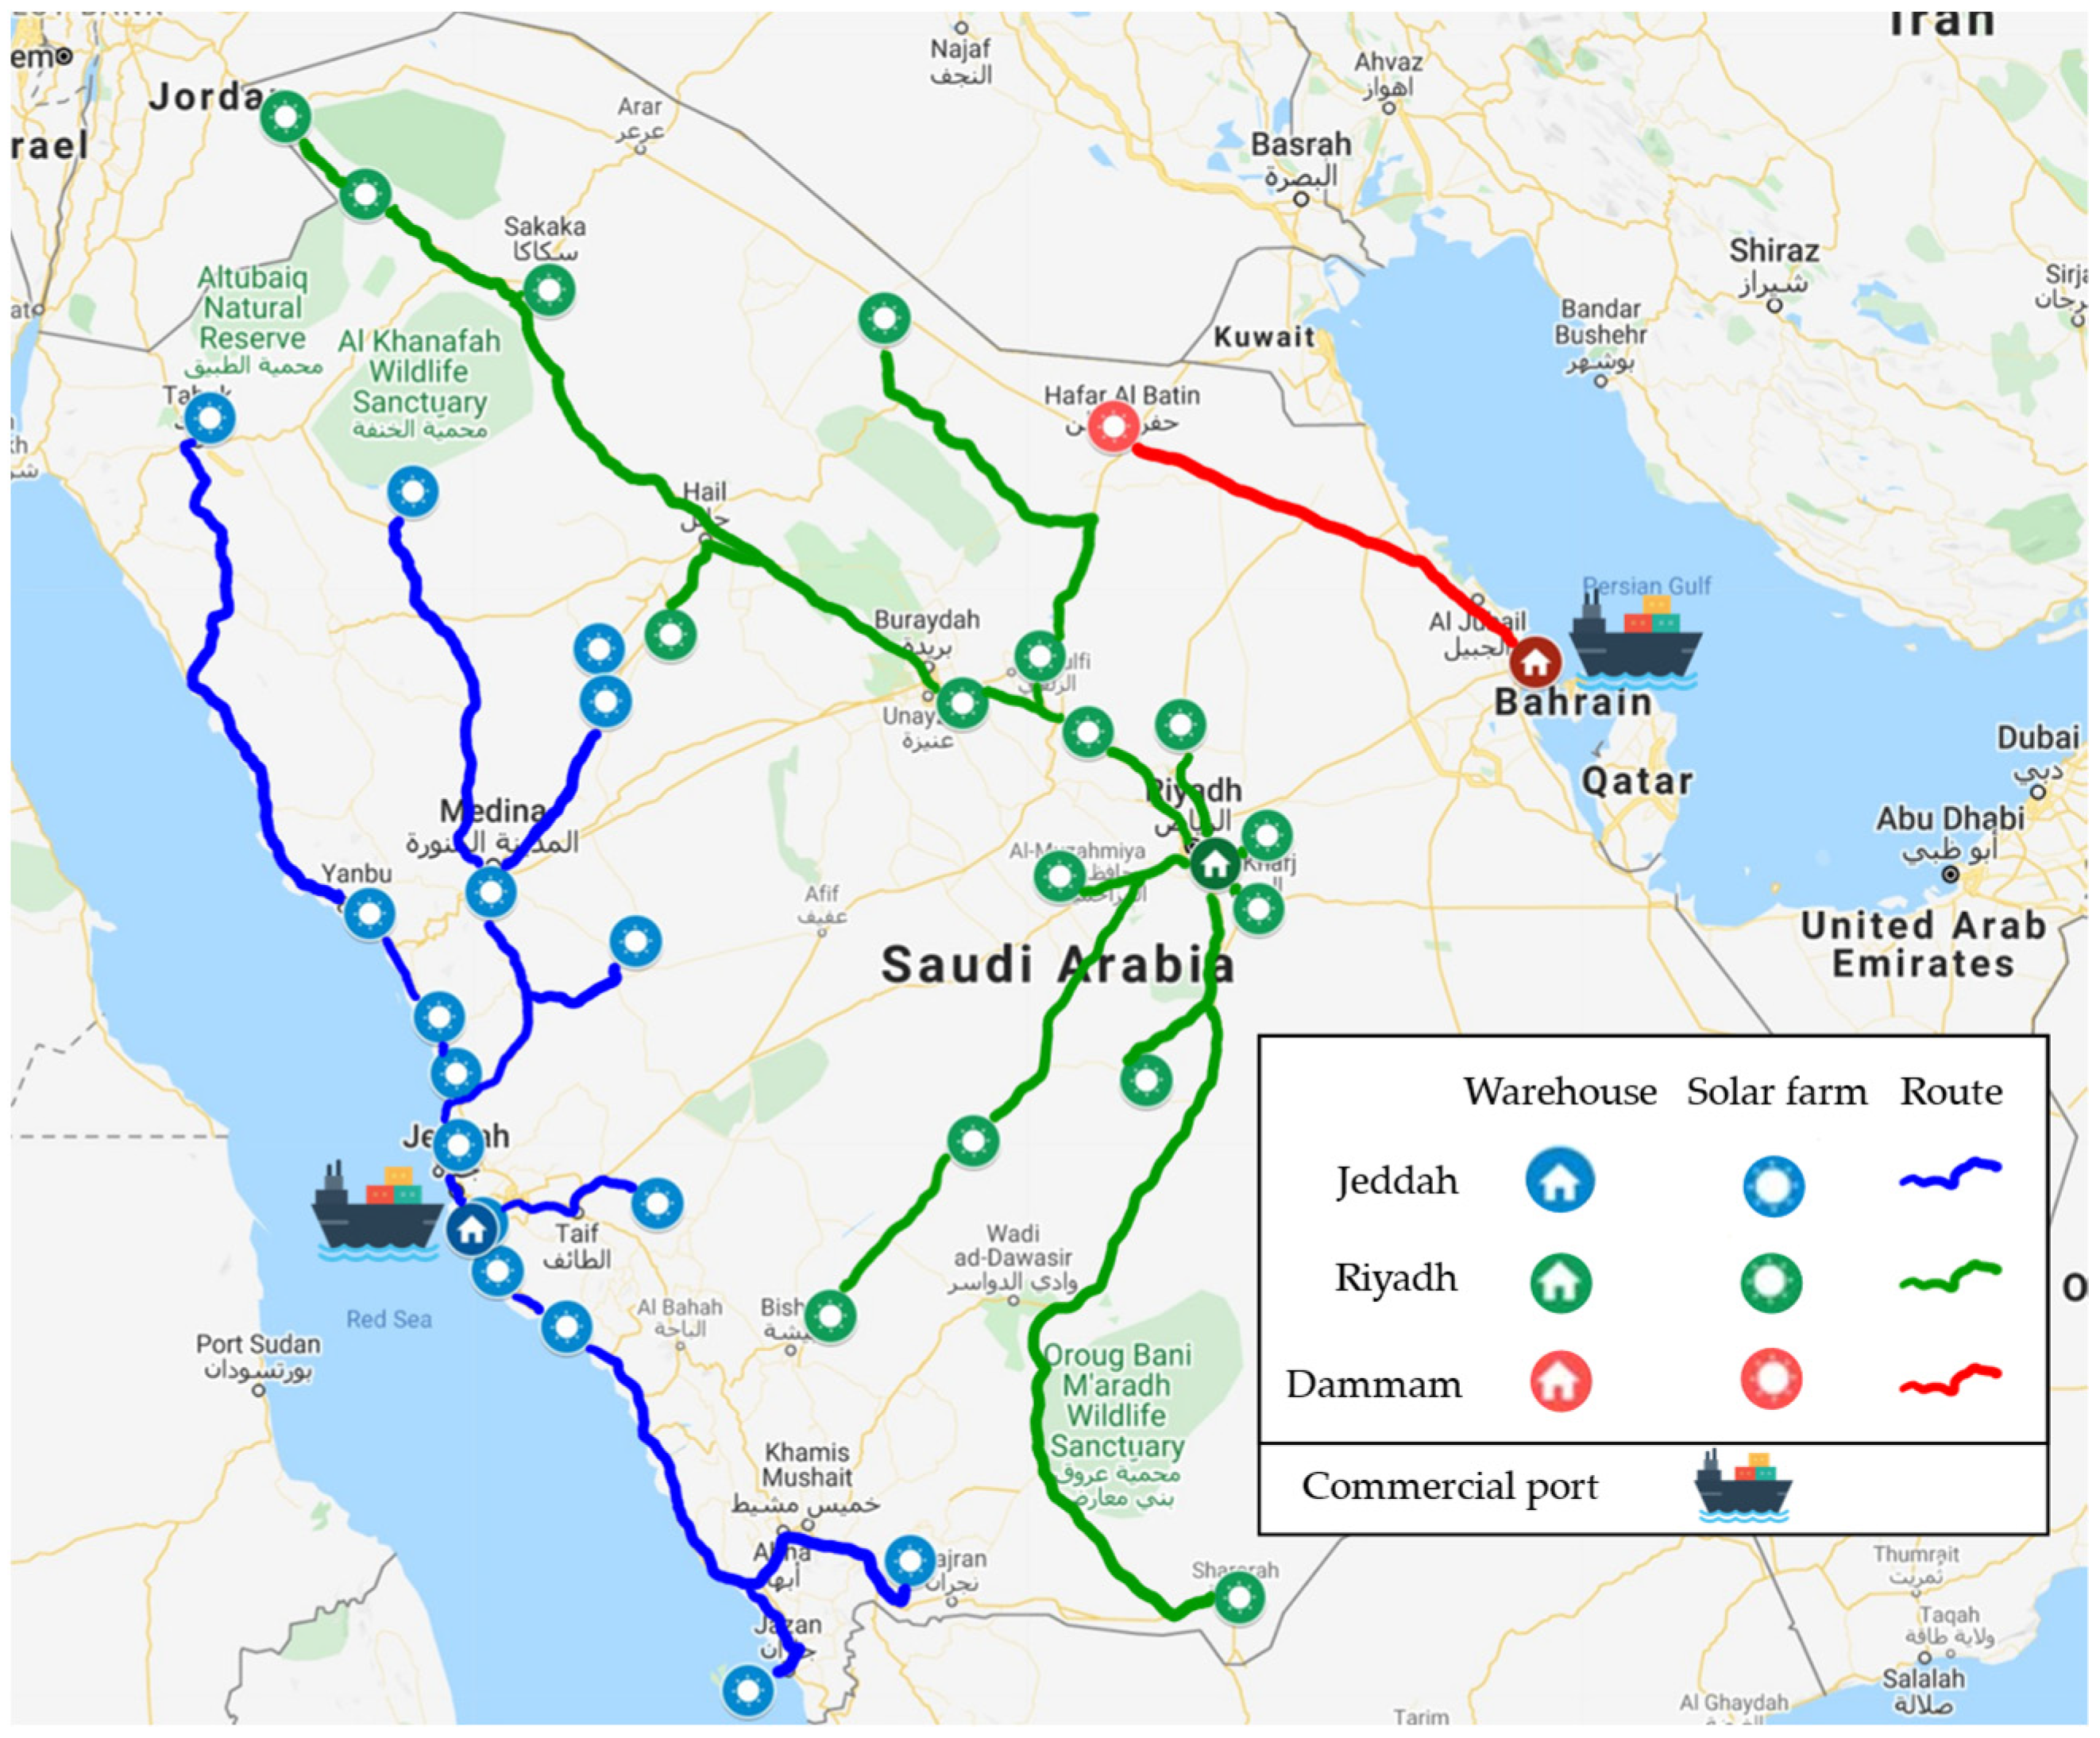
This paper indicates that additional in-country PV module manufacturing will be required to support the KSA’s LC targets. Here, we consider three possible locations for the PV module fabrication site within the country, the two port cities of Jeddah and Dammam, alongside the capital city of Riyadh, as these are the most appropriate routes for the supply chain. The presented modelling assesses the delivery of fabricated modules (and the associated support structure) to the proposed deployment sites in KSA. A range of illustrative examples are provided for an in-country supply chain of PV modules to the planned solar farms in Saudi Arabia over a 10-year period.
The model was structured to have fabrication and associated warehousing in the three major cities highlighted above to hold inventory of PV equipment (modules, inverter, etc.) coupled with truck queuing at the warehouses to deliver modules to project sites. Initially, each warehouse was considered to have unlimited capacity in terms of inventory to allow the simulation to suggest warehouse locations and capacities accordingly. REPDO data indicate that there are 33 solar PV farm sites that will need supply from the suggested warehouses. Trucks carry a volume of an estimated 450 PV modules of 250 Wp capacity, which is equivalent to 113 kWp per truck. The 250 Wp panels were chosen, as this capacity was used in the Sakaka project (1.2 million PV modules with a total capacity of 300 MWp [
9]).
The modelling using Arena [
30] considers different possible scenarios. These are defined by changing different control variables in the model encompassing: PV module production rate, number and location of proposed warehouses, number of trucks needed and supply rates to deployment sites. Five illustrative scenarios are shown in
Table 3.
The aim of modelling these scenarios is to optimise the logistics of PV modules delivery to project sites, reducing cost and time for both inventory and transportation. In the scenarios, the travel time from strategic warehouse locations to project sites was estimated using Google Maps [
31]. Both travel distance and travel time were considered initially. However, travel time was used as an input to the simulation because travel time has a higher impact on reducing the total cost. Based on travel time, each potential PV project site (PV farm) was assigned to a warehouse.
Figure 7 shows PV farm sites obtained from REPDO [
6], supply ports obtained from Saudi Ports Authority [
32] and suggested warehouse locations based on major industrial zones in Saudi Arabia [
33], as well as the most appropriate routes to the sites selected by shortest travel time interrogated in Google Maps [
31].
Scenarios are assessed in terms of their indicative cost (a function considering costs for waiting and storage) for distribution as follows:
IC = Indicative Cost.
NPV = Average number of PV loads in inventory waiting.
TPV = Average PV inventory waiting time.
CR = Truck to inventory cost ratio.
NTr = Average number of trucks waiting.
TTr = Average truck waiting time.
The indicative cost (Equation (1)) is a combination of delivery costs (number of trucks and waiting times) and storage costs (fabricated PV modules at module fabrication site awaiting delivery to site). In this context, the Truck cost ratio to PV load holding cost ratio is 50:1 (i.e., delivery costs dominate).
5.1. Scenario 1: Randomly Allocate PV Module Fabrication Production to PV Farms
The outcome of this scenario analysis is the optimal number of trucks needed to deliver a particular load of PV modules to a site and is used as a benchmark reference. The lowest indicative cost is achieved with a pool of 66 trucks (
Figure 8). This is an idealised scenario, as it does not reflect the anticipated real supply patterns to deployment sites. This is because not all farms will be deployed at the same time over the 10-year period to 2030.
5.2. Scenario 2: Shortest Travel Time and Zero-Inventory
In the second scenario, the initial number of trucks was selected based on an average of the first scenario and the ratio of warehouse usage. Then, the number of trucks was increased until the inventory queue reached zero, as shown in
Figure 9. This would provide zero inventory holding cost but very high cost of non-utilised trucks. This serves as a starting point for scenario 3, and it gives an upper boundary for the required number of trucks.
5.3. Scenario 3: Optimising Number of Trucks
The number of trucks that results in minimum indicative cost is 62, 76 and 30 trucks for Jeddah, Riyadh and Dammam warehouses, respectively.
Figure 10 shows the normalised optimization curve for indicative cost for each city. Note that operation at the Dammam site has a significantly higher indicative cost than either Jeddah or Riyadh, which raises the question whether this location is required.
5.4. Scenario 4: Warehouse Mix
In this scenario, there are two runs. The first considers the optimum number of trucks from Scenario 3 whilst using all three warehouses. The second omits the highest cost and least used warehouse, which in this case is Dammam. This is because Dammam warehouse supplies only one solar farm. This farm—by travel time—is closer to Dammam warehouse but not far away from Riyadh warehouse. So, this farm is assigned to Riyadh warehouse. This reduced the average waiting time for PV modules from 100 h to 83 h. In addition, the indicative cost (explained in
Section 5) decreased by 57% when eliminating Dammam warehouse compared to the base scenario, which includes all three warehouses.
5.5. Scenario 5: Increasing Deployment Rate
Instead of the constant annual deployment rate method used in previous scenarios, this scenario considers a gradual increment of deployment rate. This reflects a more realistic approach as the PV industry grows and in-country supply chains strengthen. The function of incremental deployment was derived from the deployment rates of several countries and group of countries to compare the results. Two datasets were developed, one covering the “global” deployment rate and the other the “Middle East” deployment rates; both were based on a selected number of countries. Data from 2010 to 2019 were used to forecast the Saudi deployment rate up to 2029.
In this work, scenario 5 (
Table 2), which was split into two sub-scenarios; where the global deployment trend was assigned scenario S5A and the Middle Eastern trend assigned to scenario S5B, was considered. The proposed cumulative Saudi deployment rates based on global and Middle East trends are shown in
Figure 11.
Since the Middle East deployment rate is significantly lower in the initial years and the increment is exponential towards the end of deployment period, the inventory time became high, which is reflected in the cost of inventory. On the other hand, the global trend follows a smoother trend line, which resulted in less inventory waiting time, and hence, less inventory cost.
Figure 12 below shows the level of inventory time following global and Middle East PV deployment trends modelling.
As can be seen, the truck waiting time was lower for S5A compared to S5B at the Riyadh warehouse but higher for S5A compared to S5B in Jeddah warehouse. However, the difference in Jeddah warehouse was less than 9%.
Figure 13 shows the difference in truck waiting time for both sub-scenarios.
Similarly, the total inventory area required for S5A is much less than the inventory area required for S5B, as shown in
Figure 14. In addition, the average transfer time if the Middle East trend is followed would be 19% more than the average transfer time if the global trend was followed for each truck trip.
6. Discussion
To maximise the benefit of the planned 40 GW of solar PV and to improve the wider solar PV sector in KSA, the local content should be exploited, and the supply chain needs to be optimised.
In this work, the local content has been assessed based on the different main components of the PV project supply chain (see
Section 3). The Sakaka 300 MW project, which is the only operating utility-scale solar PV project in KSA, has been the basis of our comparative analysis. Sakaka achieved a local content percentage of ≥35% despite the fact that PV modules, which represented 44% of the project cost, were imported. By considering a “what-if” scenario in which all modules are supplied locally, our analysis indicates that the local content for these modules having a cost of 34% of project cost would rise by 15 percentage points (from 47% to 62% local content for projects such as the 10 MW KACST study). Furthermore, for larger projects, this could rise to 19 percentage points for projects similar to the Sakaka 300 MW, where the PV module is 44% of the total project cost. That means for the Sakaka case and taking into account all components, the local content could have been 54% instead of 35% if all modules were fabricated locally but with imported cells. This analysis assumed that all other components—aside from PV modules—retain the same local content percentage as the KACST/Sakaka project as per the original Sakaka project. While this study assumes the local content percentage will only change for PV modules and not the other components, Alotaibi’s [
23] work considered change in the local content percentage in other components (such as inverters, structure, electrical, admin and other costs) for a 10 MW solar project in KSA. Their work predicted that local content could increase by 27 percentage points between 2018 and 2023.
In addition to the local content assessment, a supply chain gap study was conducted, and a simulation model was created to further optimise the supply chain of PV modules in KSA. The gap study suggests that based on the current trend of PV module manufacturers registering at the Ministry of Energy renewable energy website, local PV fabrication is unlikely to satisfy the future demand of 40 GW of solar PV projects. If business continues as usual, this gap is estimated to be around 30 GW over a period of ten years of PV deployment in KSA (
Figure 6). The gap is predicted to be smaller if REPDO’s incentive plan for local PV manufacturers is realised, narrowing to around 14 GW (
Figure 6). In both cases, there will be a need to establish more PV module fabrication factories locally. Using the average yearly capacity of 143 MW/factory/year estimated in this work, 21 additional PV fabrication factories will be required for the business-as-usual scenario, and 10 additional factories will be required if the REPDO incentive plan is realised. This outcome is in line with the findings of Liang et al. [
34] for analysing barriers influencing solar energy in India, where the authors concluded that, out of 29 analysed barriers, “unreliable local technology” and “limited manufacturing facilities” are the top two barriers impacting solar energy.
The additional in-country PV module fabrication capacity required in the business-as-usual development scenario is 3 GW. A key question is whether in-country module fabrication is a cost effective and job-creating approach to local content. The NREL PV roadmap report [
35] states that “the CapEx for module assembly is currently the lowest CapEx among all steps in the supply chain: likely U.S.
$3–
$5 million to start a 100-MW annual capacity module assembly plant, or U.S.
$20–
$30 million to purchase all the equipment for a fully scaled 1-GW plant. This is roughly half the CapEx for entry into Cz wafer production or cell conversion activities”. KSA would therefore require an investment of
$60–90 million USD to deliver the 3 GW of plant required to achieve the local content uplift. In comparison, the CapEx investment for 40 GW of PV cells (at a cell cost of 0.25
$/Wp, see
Section 3) would be ~9.9 billion USD.
It is necessary to have an in-country supply of float glass for PV module fabrication to operate. In a KSA context, there are three main float glass manufacturers with a combined capacity of 2200 tonnes per day [
36]. According to [
37], manufacturing 1 MW of solar PV modules requires 70 tonnes of glass. For the proposed PV manufacturing expansion of 3 GW per year, 210,000 tonnes of glass are required each year. This is around 26% of KSA’s float glass production capacity in 2018 for these three manufacturers. Whilst this is a significant percentage, in-country float glass availability is not considered by the authors as a future barrier that cannot be addressed, as this is a mature industry.
KSA already has the infrastructure and the capacity to provide all the other components required for deployment of PV farms at scale in-country (apart from inverters). For the 40 GW expansion of solar PV in KSA, the copper requirement for PV farms appears the most challenging, but even this is attainable. A total of 21,000 tonnes of copper is required per year (to install 3 GW of PV each year); this would account for 28% of KSA’s 2020 production. Other materials account for a small percentage of the current production capacity in KSA. Aluminium, steel and plastic will only be required at 6% [
38], 2% [
39] and 0.1% [
40] of yearly production, respectively, as calculated from the referenced sources and [
37].
In our scenario simulations model for the supply chain, we included all 33 announced locations of solar farms in KSA assumed to be supplied from three selected warehouses located in major cities, having a variable number of trucks depending on the scenario considered and allocation of a total of 158 million PV modules for the 40 GW. It was further assumed that each truck carries 450 modules to be transferred to the assigned farm and from an allocated warehouse. The main indicator in these scenarios is the indicative cost (discussed in
Section 5), which is linked to truck delivery waiting periods and warehousing costs. Five different scenarios were created in the simulation model.
The 1st scenario was the random allocation of PV modules from different warehouses to the solar farms. This scenario provided a baseline of the number of trucks, which resulted in a reference indicative cost. The obtained number of trucks were then used as a starting point and/or benchmarking for subsequent scenarios.
The 2nd scenario used the shortest road travel time to allocate each solar farm to a specific warehouse. It examined the impact of distribution capacity by increasing the number of trucks until a zero inventory was reached (the storage time for PV in the warehouse becomes negligible). The result from this scenario was the upper boundary of the number of the trucks, which was used in the subsequent scenario.
The 3rd scenario was an optimisation of reducing the cost through assessing the required number of the trucks from a warehouse. This optimised required number of trucks was then used as an input for subsequent scenarios. The obtained optimum number of trucks to be used was 62, 76 and 30 for Jeddah, Riyadh and Dammam, respectively.
The 4th scenario examined several warehouse combinations to predict the minimum indicative cost solution. The minimum indicative cost solution was found to be two warehouses—one in Jeddah and one in Riyadh.
In the 5th scenario, the PV deployment rate followed the historical trend for either (i) global or (ii) Middle East solar PV installations (
Figure 11). The results from this scenario showed that following the global trend will result in significantly less waiting time for PV modules in the inventory and less area required to store PV modules.
As a result of these five scenarios, it is clear that the solar PV sector in KSA will need an in-country manufacturing capacity of PV modules as well as optimisation of its supply chain. A similar principle has been used by Baghizadeh et al. [
41] in another field, namely, to improve the forestry industry in Iran by optimising its supply chain.
7. Conclusions
This research modelled the required supply of PV inventory to solar farms in KSA to support the country’s 40 GW deployment by 2030. The work identified a gap between projected PV module manufacturing capacity and the anticipated demand based on renewable energy goals in KSA. This is true even when considering the proposed initiative by REPDO and SIDF to support local PV module manufacturing. This shortfall is 75% in PV module production if business continues as usual and 35% if the proposed governmental support is realised. The 300 MW Sakaka project achieved a local content of 35%, which we estimate would rise to 54% if all modules were fabricated in-country using imported PV cells. The long-term (2028 onwards) local content target is 40–45%; to achieve this will require Sakaka type projects going forward with between 58 and 84% of modules being fabricated in-country. The CapEx investment required for an additional 3GW per annum of in-country module fabrication would be around $60–90 million USD, which is less than 1% of the CapEx of the PV cells to be imported. KSA is seen to have good capacity in other PV components such as steel and float glass, and these are unlikely to be a barrier to local content targets.
The costs of logistics in the PV module supply chain (i.e., acquiring, inventory and delivery) can be reduced if centralised PV module fabrication/warehouses are introduced. The results show that two warehouse locations result in optimal time and logistics cost over a three-location option in Saudi Arabia. Eliminating the least utilised warehouse (Dammam) reduced the PV modules waiting time in the inventory by 17% comparing to the next best mix, which is using three warehouses.
The extrapolated global trend for PV deployment is steeper than the current Middle East trend, which has implications for scheduling and costs. Using the former will provide Saudi Arabia with a cheaper PV deployment than the current Middle Eastern trend. Following the global trend will also mean 92% and 94% less inventory waiting time in Jeddah and Riyadh warehouses, respectively. Additionally, the average transfer time or PV modules is reduced by 16%. In addition, the required area in the warehouse site following global trend is around 85% less for both Jeddah and Riyadh warehouse compared to following the Middle East trend.
There are also a number of policy disruptor announcements, which may change the PV deployment landscape significantly in Saudi Arabia. In particular, new PV projects beyond the Ministry of Energy, such as NEOM [
19], Aramco [
42] and PIF [
6], need to be incorporated. These issues will be developed in future work.
This work provided for the first time indicative simulated results to fulfil the 40 GW target of KSA in an optimised manner, taking into account the both the current the global and local Middle Eastern growth in PV installations. The achieved results will be used to inform policy makers in KSA through planned engagement events in the country.


