Article

Research on Energy Conversion in the Arc-Extinguishing Process of a Long-Gap Gas Lightning-Protection Device

High-Pressure Laboratory, Guangxi University, Nanning 530004, China
*
Author to whom correspondence should be addressed.
Energies 2022, 15(20), 7490; https://doi.org/10.3390/en15207490
Submission received: 16 September 2022 / Revised: 6 October 2022 / Accepted: 10 October 2022 / Published: 12 October 2022
(This article belongs to the Special Issue Advanced Research of High Voltage Insulation)

Abstract

:
In this paper, a two-dimensional axisymmetric module of gas arc extinguishing was simulated using energy balance theories. We used simulation to study the energy distribution change during the gas arc-extinguishing process. We built a lightning impulse current experimental platform according to the IEC standard, and experiments verified the preliminary conclusions of the simulation. Comparison curves of the experimental data and simulation calculations were drawn in the range of 20 kV to 70 kV. Simulation and experimental results showed that the arc-extinguishing ability of long-gap gas arcs is negatively correlated with voltage level and positively correlated with distance. Furthermore, within the allowable range of conditions, increasing the length of the chamber rather than shortening it helps to extinguish the arc more effectively and quickly.

1. Introduction

Lightning, as an atmospheric discharge phenomenon, is a critical concern for the over-voltage protection of transmission and distribution lines. Lightning can cause serious safety problems, such as insulator damage and transmission line disconnection. Even with lightning-protection devices, lightning often causes line tripping, affecting the reliability and safety of power supply lines. Lightning accidents with transmission and distribution lines occur more frequently in mountainous and hilly areas [1].
In recent years, gas arc-extinguishing lightning-protection technology has been widely used. This technology extinguishes the arc of the high-temperature and high-pressure effect of lightning on the gas, increases arc energy loss during arc extension, and cuts off the arc channel, thus playing a role in rapid arc extinguishing [2,3].
Reference [4] theoretically analyzed and calculated the electrode region and arc column region by studying the model of DC plasma. Compared with the finite element method, it improved the accuracy of arc detection in the electrode region. In reference [5], the gas self-energy arc-extinguishing design was carried out at 10 kV through a multi-pipe structure. The long gap was segmented, and the extinguishing effect of the compressed arc-extinguishing device gas on the arc was studied. However, the whole long-gap arc streamer was not discussed. The pressure characteristics of arc discharge in water were studied in reference [6]. Similar to pressure-impact gas arc extinguishing, the pressure was found to be dispersed outward with the arc column at the center, and the pressure was in the order of tens to hundreds of MPa. In reference [7], the probability of lightning striking transmission lines of each grade was calculated, which provided data reference for determining the voltage grade of the test and simulation. Reference [8] made a simulation calculation of the corona discharge process. However, it did not involve a simulation of higher voltage and arc stage. Nonetheless, the time division of the discharge process provided some inspiration for this paper. Reference [9] only made a detailed theoretical analysis and discussion of factors influencing the shock wave in the arc process but did not physically test this form of energy conversion analysis; it also lacked lightning protection and arc-extinguishing direction. In reference [10], lightning protection of a radar system was improved by combining a surge protector and isolation transformer. However, the tolerance of this protection mode under high-voltage lightning strikes was not considered. These results have contributed to the numerical study of gas medium pressure and electrical change. However, the arc-extinguishing effect and energy conversion process have not been thoroughly studied.
In this paper, the discharge process of lightning in the long-gap gas arc-extinguishing chamber was simulated. The influence of a single chamber’s length and the voltage level on the arc-extinguishing effect of the gas lightning-protection device was studied from the perspective of energy conversion. The state of the arc in the arc-extinguishing chamber at different periods was analyzed. Furthermore, through the actual lightning impulse current experiment, the simulation results illustrated the influence of the gas chamber and voltage level on the arc-extinguishing effect and the energy conversion distribution in the arc-extinguishing process.
The main innovations of this paper are:
(1) The energy change of the whole process of lightning discharge in a gas arc-extinguishing device is simulated. Furthermore, the arc-extinguishing ability of different chambers was evaluated from the energy point of view.
(2) The influence of lightning voltage level and arc-quenching chamber length on energy change and discharge current peak is discussed. This method’s conclusions and feasibility were further verified by developing the relevant arc-extinguishing lightning-protection device.
(3) Based on the energy balance control equation, this paper evaluates and compares energy conversion in the whole process of gas arc extinguishing through simulation and experimental data calculation.

2. Experimental Principles

2.1. Arc-extinguishing Lightning-Protection Technology

Gas arc-extinguishing lightning-protection technology uses the gas impact force produced by a lightning arc explosion to extinguish the arc. The arc extension is limited by the explosion impact force, and the arc energy is rapidly dissipated, thereby extinguishing the arc. Commonly used structures include multiple breaks, multiple chambers, etc. These devices are designed to better promote an increase in the consumption of the arc’s power so as to extinguish the arc quickly [11,12]. This technical route realizes the self-conversion of lightning energy and achieves the effect of arc-extinguishing lightning protection by using the energy of the lightning strike itself. In addition, this arc-extinguishing method can also weaken the amplitude of the lightning impulse current and better limit the destructive effect of the arc [13,14].
In addition, transmission and distribution lines often use other electronegative gases as a better alternative to air in lightning protection [15,16].
After the formation of the arc, part of the energy forming the arc is converted into arc-extinguishing energy, and the other part flows into the ground through damage energy or dissipates through internal energy, such as through heat exchange and gas convection. The converted arc energy Wh, can be expressed as follows [17,18]:
W h = P h P s d t
The arc-extinguishing device extinguishes the arc by expanding the arc’s emitted energy. Ph is the arc power; that is, the arc maintains its consumption of power from the external lightning voltage, and Ps is the divergence power, which is mainly converted into the internal energy form and inhibits the maintenance and expansion of the arc. During arc combustion, the Ps < Ph. divergence power is less than the arc power. When Ps > Ph, the arc energy gradually dissipates into internal energy and other forms of energy, thus completing the arc’s extinction [19,20,21].
As shown in Figure 1, the three main processes in the gas arc-extinguishing process are as follows. Firstly, the arc injection increases the pressure and temperature, further compresses as the temperature rises, and further boosts the pressure. Then, the explosive airflow is generated, and the arc’s ejection is elongated until it is truncated under the action of airflow [22].
The arc energy’s weakening effect gives a conversion energy utilization rate [23]. Its energy utilization rate is weakened arc energy that is converted into other forms of energy as a percentage of the total lightning energy:
μ = P s P h d t
Gas arc-extinguishing technology uses self-energy conversion for lightning protection and arc extinguishing. Firstly, the arc is formed by the breakdown effect of lightning on gas. The gas is heated and boosted by the arc to realize the mutual transformation of electric and internal energy [24]. If an external force and temperature drop cause channel cooling, the arc will gradually extinguish because the thermal ionization effect is less than the combined effect. In addition, as long as a part of the arc column becomes an insulating layer and the conductance of the channel disappears, the gap presents the state of the insulating medium. It can also force the arc to be extinguished by external action [25,26]. The input power of gas arc extinguishing is calculated as follows:
P h = U l 2 R = I l 2 ( t ) R
R is the equivalent time-varying resistance. Il(t) is the input current excitation. Ul is the potential input at both ends of the chamber. The initial radius of the arc has the empirical formula
r 0 = 0.26 U l R
The initial input power of the arc in the simulation calculation can be determined by Equations (3) and (4) [27].
For the dissipation power Ps, the primary heat dissipation mode is forced-convection heat dissipation, which accounts for more than 90% of the total energy under closed conditions; other methods include radiation cooling [28,29]. Since the airflow and the arc direction are mainly longitudinal, the contact area is the cross-sectional area of the arc [30,31]:
P s = γ α υ P S ( γ 1 ) + Q
ν is the propagation velocity of a shock wave in the air, which is about 5 km/s; the value for liquid is about four times that of gas. γ is the adiabatic index; generally, considering the ideal model is the ideal gas of adiabatic expansion, combined with the actual situation, the value is 1.25~1.4. P is the gas impact pressure. α is the compression coefficient of air in forced-flow conduction. S is the cross-sectional area of the arc. Q is the heat absorbed by the gas in the chamber during the process.

2.2. MHD Theoretical Simulation of the Arc

The multi-physical field coupling simulation of the electric field, magnetic field, fluid heat transfer, and laminar flow was established using COMSOL. The non-isothermal flow and balanced discharge boundary heat source were added to determine the temperature change in the chamber. The static current density and non-isothermal flow physical field were used to determine the current density change and further calculate the channel current. The channel pressure change was obtained using non-isothermal flow and laminar flow simulation. The physical field takes the energy balance equation as the simulation control equation.
The main physical field control equations are as follows.
Electric field:
{ J = Q J J J e = σ E + D t E = U
J is the current density mode. Je is the external current density mode, QJ is the joule measurement of the heat generated by the current, E is the electric field intensity, D is the electric displacement, and U is the potential. The above equation is based on the current conservation equation.
Fluid flow:
{ ρ v t + ρ ( v ) v = ( P + K ) + F ρ t = ( ρ v )
ρ is the fluid density, K is the velocity vector, F is the Lorentz force. The above equations are established based on the assumption of momentum conservation of the airflow in the chamber.
Fluid heat transfer:
{ ρ C p T t + ρ C p v T + q = Q + Q p q = k T
Cp is the constant pressure heat capacity, T is the temperature, and Qp is the total kinetic energy obtained by the gas, including the sum of the work done by the pressure and the kinetic energy of the airflow.
We constructed an ideal device model using a long gap based on the above equations. The internal gas was an ideal gas, ignoring the influence of gravity. The arc plasma was in thermodynamic equilibrium, the internal pressure airflow was a laminar flow model, and the tube wall was insulated without slip.
The simulation model in COMSOL was set as a two-dimensional axisymmetric model, as shown in Figure 2. The boundary conditions were as follows: the internal channel materials were set as an ideal gas, and the outer wall was an insulating material. It was set as an iron electrode, and the gap on both sides simulated the actual device sealing the microgap. The probe was placed in the channel to measure the changes in pressure, temperature, conductivity, and other parameters. The pointer could more accurately measure the peak value and on-time of the channel in the center of the channel and then judge the on–off condition of the arc and the internal state of the channel. The channel length was 50 mm to 100 mm, and the radius was 5 mm. the initial pressure was 1 atm, the initial temperature was 293 K, the grounding potential was 0 V, the excitation was a 25 kA impulse current of 8/20 μs, and the current peak changed with the simulated voltage level. The simulation step was set to 0.1 μs. The simulation time was set to 300 μs.
The probe was placed in the channel to measure the changes in pressure, temperature, conductivity, and other parameters. The probe in the center of the channel could more accurately measure the channel’s current peak and arc duration and then determine the on–off of the arc and the internal state of the channel.
Taking the arc-extinguishing process of the 100 mm gap under the condition of 70 kV as an example, the cloud diagram of pressure and conductivity change in the chamber obtained by simulation was as follows:
Figure 3 and Figure 4 show that the arc was divided into three stages according to the conductivity change curve measured by the probe and the COMSOL simulation cloud diagram. The pre-breakdown stage is seen at 0~15. At this time, no penetrating conductive channel was formed in the chamber, the arc was in the extension stage, and the conductivity in the channel rose rapidly. The maintenance stage of the arc was at 15~80 μs. A short dynamic balance was formed through the strong lightning current in the arc, and the conductivity and temperature in the channel were incredibly high. After 80 μs, the arc was strongly pressured by the gas medium, and the discharge current made it difficult to maintain the self-sustaining arc discharge. As the temperature in the channel gradually decreased, the pressure and airflow accelerated the recombination of conductive particles, and the conductivity decreased rapidly.
According to the simulation results, which showed in Figure 5 and Figure 6. Under the condition of 70 kV, the maximum impact pressure of 100 mm was about 60 atm. The impact of pressure formed overpressure in a short time. In the early stage, the arc channel had not yet formed, and the pressure fluctuation rose during the gas breakdown, which inhibited the development of the arc. In the formation stage of the arc channel, the pressure in the chamber was also gradually increasing, which eventually broke the dynamic balance of the arc channel, blocked the arc channel in time, and destroyed the subsequent development of the arc. After the channel broke, the arc was gradually extinguished, and the pressure dropped. Furthermore, the arc-extinguishing high pressure gradually formed an uneven pressure wave through the airflow in the narrow channel to attenuate the atmospheric pressure.
The cloud diagram shows that during the formation and duration of the arc, the pressure in the center of the chamber was the highest and rose gradually. As the arc was impacted and extinguished, the pressure fluctuation in the chamber decreased. After 250 μs, the pressure in the chamber returned to atmospheric pressure.
During the entire arc formation to extinction, the energy distribution curve in the chamber obtained by the COMSOL simulation was as follows:
In the Figure 7, Q is the change in internal energy of the gas, Qp is the change in kinetic energy of the gas, and Wh is the change in electric energy input from the arc. According to the area estimation, the proportion of gas converted into internal and kinetic energy was about 56.76% of the total energy during the formation and continuation of the arc.
The reference ground current (simulated discharge of a standard ground current without the arc-extinguishing chamber) and voltage level relationship are shown in the Table 1. The actual test device obtained the data in the Table 1.
At the same time, it was also found in the experiment that the arc duration decreased slightly with an increase in the channel length and a decrease in the voltage level of the excitation source. However, the change was relatively imperceptible on the overall arc-extinguishing timescale.
By adjusting the voltage level and chamber length, the following curves for the pressure and current peaks are drawn using the COMSOL simulation:
It can be seen from the Figure 8 that both the current peak level and the pressure peak are related to the length of the chamber, and the change in the pressure peak is evident. With the increase in the voltage level, the shorter the chamber, the more pronounced the decrease in the arc-extinguishing ability, which shows that the short chamber has limited arc-extinguishing ability for high voltage levels.

3. Impulse Current Experiment

3.1. Experimental Scheme

The impulse current generation circuit (Figure 9) was used to simulate the action of the experimental device under a lightning strike.
In Figure 9, K is the contact switch. AC is the AC power supply. ICG refers to the charging capacitor group. At the beginning of the experiment, the capacitor was closed to charge through K and ICG, and then the charge accumulated by the charging capacitor and the transformer T boost was used to make the gap S undergo lightning breakdown to simulate a lightning strike. TN is the voltage regulator, T is the booster discharge transformer for the experiment, and the primary and secondary sides are grounded into GND1 and GND2. J is the relay, r is the current limiting protection resistance, D is the arc-extinguishing device, and S is the discharge gap. DSO is a digital oscilloscope, and C is a high-speed camera.
An oscilloscope (DSO) measured the lightning impulse current simulated by the experimental device. The inner diameter of the experimental device is 10 mm. The experimental voltage was set to 70 kV. In the experiment, the ICG was a 30 μF capacitor bank, the equivalent resistance r was 20 Ω, the wave front time was 8 μs, the wave tail time was 20 μs, and the current peak was 25 kA.

3.2. Experiment Preparation

The primary purpose of the experiment was to measure the main calculation data and to obtain the lightning impulse current reduction degree and energy conversion rate of gas arc-extinguishing in practice.
The structure of the experimental sample is shown in Figure 10.
In Figure 10, 1 is a sealed electrode, 2 is a discharge gap, 3 is an internal insulating wall, 4 is an external umbrella skirt to prevent flashover outside the device, 5 is the elastic protective shell of the container, and 6 is a grounding electrode.
The total size of the experimental device is about 200 mm × 100 mm, the discharge gap of the internal pipe is about 10 cm, and the sectional pipe diameter is about 1 cm2.
The primary purpose of the experiment was to verify the simulation calculation results. According to the ground current waveform and experimental phenomena, the lightning impulse current amplitude and energy conversion rate of gas arc extinguishing in practice were obtained. By comparing the simulation results with the experimental data, the rationality of the theoretical prediction and the feasibility of evaluating the ability to extinguish the arc using energy conversion are further verified. The relationship between the gas’s arc-extinguishing ability and the lightning voltage level under the same gap length is summarized.
The main steps of the experiment were as follows:
(1)
It was determined that the experimental device was well-installed, the grounding and insulation were good, and the discharge gap distance was adjusted to 20 cm and fixed for the experimental device.
(2)
A high-speed camera was set up, the shot and shooting time were adjusted, it was determined the oscilloscope was in the trigger state, and the range was adjusted.
(3)
The experimental high-voltage device was charged, the boost transformer was adjusted, and the spheric gap was narrowed until it closed.
(4)
The experimental apparatus was checked and the experimental phenomena recorded.
The experimental grounding waveform is shown in Figure 11. The abscissa of the oscilloscope in the figure was 5 μs per grid, and the ordinate was 5 kA per grid. The experimental current waveform was a standard 8/20 waveform, and the peak value of the impulse current was about 25 kA. The impulse current test device set the instantaneous discharge voltage at 50 kV. In the experiment, the internal arc resistance was calculated according to the general lightning internal resistance of 10 Ω, and the total lightning energy was about 2500 J. The intersecting guidelines represent the maximum peak current.
Before the beginning of the experiment, the sealing and strengthening device was adjusted to ensure that the sealing gap length of the device was 100 mm and the equivalent cross-sectional area of the arc-extinguishing chamber was about 1 cm2. The initial pressure in the cavity was approximately standard atmospheric pressure. The impulse current experimental device simulated a lightning strike, and the arc-blasting effect and arc-extinguishing situation were observed. The experimental data were read by oscilloscope. After the end of the experiment, we checked the experimental device and found no noticeable damage.

3.3. Experiment of 70 kV Impulse Current in 100 cm Gas Arc-extinguishing Chamber

Figure 12 shows the experimental waveform. The oscilloscope abscissa was 5 μs per grid, and ordinate was 5 KA per grid. Peak current intensity was about 17 kA, and the overall duration was about 32 μs. The front-end oscillation waveform influenced the blast generated by the arc impact on the arc forming current. During the impact process, the conductive channel oscillated, the duration was about 5 μs, and the pre-breakdown stage was about 12 μs, which is close to the simulation results. The intersecting guidelines represent the maximum peak current.
In the 70 kV experimental conditions, the initial pressure inside and outside the integral recoil tube was equal, and the internal pressure was about one atmosphere. In Figure 12, gas explosion occurred in the current waveform before the breakdown, and stable discharge occurred after arc formation. Due to the hindrance of the gas gap, the measured current caused oscillation in the early stage of arc formation, which affected the natural rising process of the discharge current. At the same time, the impact blast effect caused by the breakdown of the gas gap also hindered the natural process of the discharge. The result of the waveform is that the amplitude is significantly lower than the ground discharge waveform, and the front-end current rises. As a result, the process has a violent shock, and the overall current fluctuation rises.
The experiment set a high-speed camera to 0.02 μs a frame. Photos taken from several frames of noticeable process changes constitute the group seen in Figure 13. The starting time of the photographs was about 100 μs, measured by the corresponding oscilloscope. From the above shots, from (a) to (c) are the pre-breakdown stages, (d) and (e) show the arc’s continuation process, and (f) to (d) show the arc-extinguishing process during the gas medium process, with no subsequent reignition. The breakdown delay was long, but the arc-extinguishing speed was fast. The development process of arc channel pressure and the arc development stage coincided. The arc radius expansion time was short because the gas medium was quickly cut off and extinguished. These photos prove that the energy conversion in the gas arc-extinguishing process was consistent with the simulation.

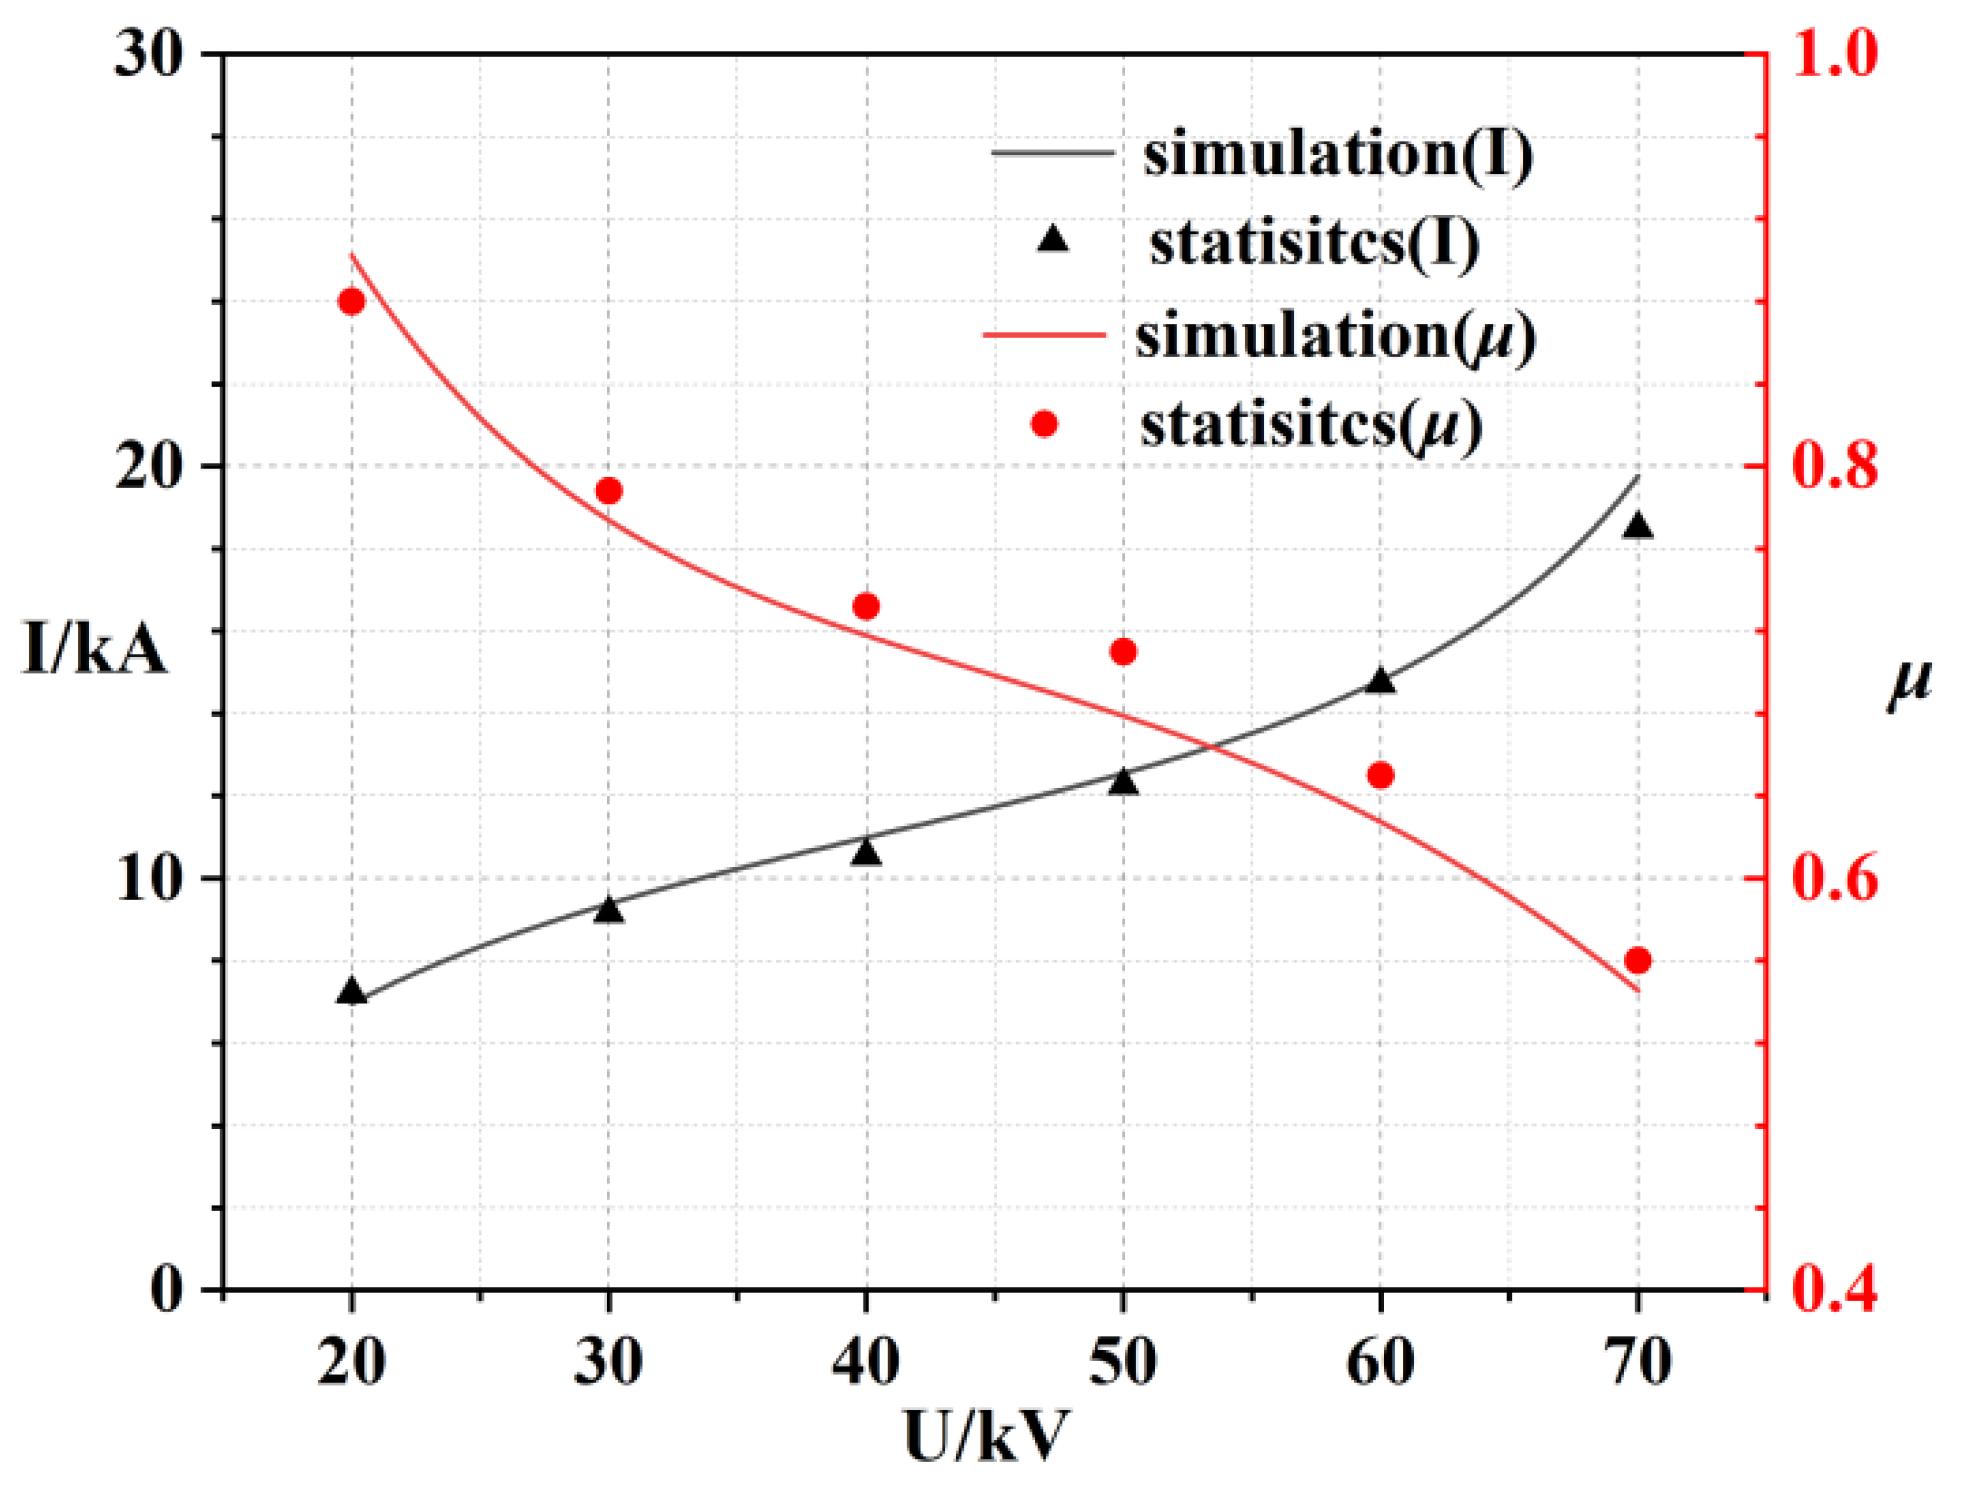
3.4. Comparison of Theory and Practice

The comparison of the experimental results and simulation curves for the 100 cm device is shown in Figure 14, where μ is the ratio of the estimated non-electrical energy portion to the total input energy, and I is the max peak current. U is the voltage level set by the impulse current test device, and the corresponding relationship with the peak value of the grounding current can be referred to in Table 1.
The oscilloscope showed the peak value of the impact current in the actual experiment. The simulated peak current was converted from the simulation data from COMSOL. As seen in Figure 14, the gas arc-extinguishing effect was better in the case of low lightning voltage, but with the increase of lightning voltage level the lightning impulse level that could be suppressed in the case of the long gap was limited, and the effect gradually decreased. This comparison shows that arc-extinguishing energy is negatively correlated with the voltage peak. The arc-extinguishing energy was converted from the arc energy. The more the converted energy, the more the current peak was reduced, and the less the converted energy, the less the current peak was reduced. For the arc at a high voltage level, the arc-extinguishing energy conversion was relatively limited, so the arc-extinguishing effect decreased.
The simulation results are in good agreement. However, because the experimental results are statistically significant, the error of some different experiments is large. The main reason may be that in practice, with a higher experimental voltage, other forms of energy loss also gradually increase, resulting in increased prediction error and measurement error. In addition, the discharge factors lead to an irregular increase in the gap between the fitting results and the actual situation.
As the voltage increases within a limited range, the gas medium’s ability to extinguish the arc and suppress the peak value of the lightning current decreases. The main reasons are as follows:
Firstly, the proportion of explosion energy in the gas medium gradually decreases. Secondly, the steepness of the high-voltage impact current is larger, the action time of the airflow is shorter, and the ability to affect the arc is reduced. Third, the airflow energy in the closed cavity is limited, and the effect of suppressing and blocking the arc is reduced.
However, increasing the gap length is still proven to effectively improve the arc-extinguishing capability of lightning-protection devices.

4. Conclusions

(1) In this paper, a model for an arc-extinguishing process in a long-gap chamber was established, in which the energy change was related to the change in conductivity and pressure. The energy conversion model during arc extinguishing can reflect the changing process of the ground current.
(2) Under the experiment with a 70 kV impulse current, the gas chamber which was used in the test could extinguish a 25 kA lightning impulse current arc in 0.1 ms, and reduced the peak value of the discharge impulse current up to 50%.
(3) The research showed that as the voltage level increases, the gap length decreases, the proportion of electric energy increases, and the arc-extinguishing capacity of the gas device decreases. The maintenance time of the arc channel is also shortened because greater arc-extinguishing pressure can be generated. With the increase in voltage level, the arc-extinguishing gap caused by the chamber length is more obvious. Therefore, increasing the length of the arc-extinguishing chamber can also be an excellent response to higher-voltage arc-extinguishing requirements.
(4) Through the actual impulse current experiment, the test sample’s lightning simulation proved the simulation conclusion’s reliability and the usefulness of the estimated data. As the chamber length increased from 50 cm to 100 cm, the resulting peak arc-extinguishing pressure also increased by about one time.

Author Contributions

Conceptualization, J.W.; data curation, Q.H.; formal analysis, Y.L. and H.L.; investigation, Y.L. and Z.J.; methodology, Q.H., J.W. and Y.S.; project administration, Y.W. and Y.Z.; resources, J.W., Y.W. and Y.Z.; software, Y.S.; supervision, J.W. and Y.Z.; validation, Z.J.; writing—original draft, Q.H.; writing—review and editing, Q.H. All authors have read and agreed to the published version of the manuscript.

Funding

This project was supported by the Guangxi Innovation-driven Development Project (major science and technology projects) number AA18242050.

Institutional Review Board Statement

Not applicable.

Informed Consent Statement

Not applicable.

Data Availability Statement

Not applicable.

Conflicts of Interest

The authors declare that there is no conflict of interest.

References

  1. Lei, X.; Lan, Q.; Liu, S.; Cui, T. Research on lightning overvoltage and its prevention and control methods of 10 kV distribution transformer. Sichuan Electr. Power Technol. 2020, 43, 48–52. [Google Scholar]
  2. Li, Y.; Li, S.; Guo, Y.; Yan, J. The influence of arc extinguishing chamber parameters on the breaking performance of self energy circuit breakers. Electr. Manuf. 2013, 4, 40–42+61. [Google Scholar]
  3. Wang, J.; Bi, J. Summary of research on lightning protection measures for transmission lines. High Tech. Commun. 2019, 29, 1025–1032. [Google Scholar]
  4. Liang, P.; Groll, R. Numerical Study of Plasma–Electrode Interaction During Arc Discharge in a DC Plasma Torch. IEEE Trans. Plasma Sci. 2018, 46, 363–372. [Google Scholar] [CrossRef]
  5. Zhang, H.; Wang, J.; Zhou, X. Research and application of multi pipeline compressed gas arc extinguishing lightning protection gap. Electr. Porcelain Arrester 2019, 3, 27–31. [Google Scholar] [CrossRef]
  6. Xing, Z.; Wang, Z.; Cao, Y. Characteristics of direct impact pressure in plasma channel of pulsed arc discharge in water. High Volt. Eng. 2019, 45, 832–838. [Google Scholar] [CrossRef]
  7. Zhao, C.; Lei, M.; Chen, J.; Gu, S.; Wang, P.; Zhao, J. Statistical Method of Lightning Current Amplitude Distribution in Transmission Line Corridor. High Volt. Technol. 2017, 43, 1609–1614. [Google Scholar] [CrossRef]
  8. Gong, X.; Shen, H.; Dai, H.; Guo, J.; Li, L. Peak value of shock wave overpressure of high current pulsed arc and its influencing factors. High Volt. Technol. 2021, 47, 4412–4419. [Google Scholar] [CrossRef]
  9. Ai, J.; Xu, L.; Niu, H.; Zhuang, X.; Luo, X. Micro simulation of air positive corona discharge and influence of model coefficients on pulse current characteristics. High Volt. Technol. 2021, 47, 4377–4387. [Google Scholar] [CrossRef]
  10. Xia, L.; Yang, J.; Deng, B. Research and design of integrated lightning protection system for radar station power supply. Power Syst. Prot. Control 2019, 47, 143–150. [Google Scholar] [CrossRef]
  11. Wang, J.; Huang, Z.; Wang, Y. A dynamic model of explosive gas field coupled arc based on chain. Chin. J. Electr. Eng. 2012, 32, 154–160, 204. [Google Scholar] [CrossRef]
  12. Yan, Z.; Sun, Z.; Zhang, B.; Ma, C.; Li, J. Application of AC Air Arc Generator in Arc Characterization Study. In Proceedings of the 2021 IEEE 2nd China International Youth Conference on Electrical Engineering(CIYCEE), Chengdu, China, 15 December 2021; pp. 1–5. [Google Scholar]
  13. Wang, J.; Liang, X.; Guo, W. Demonstration of the effectiveness of the new jet arc extinguishing lightning protection gap based on Navier Stokes equation. High Volt. Technol. 2015, 41, 28–34. [Google Scholar] [CrossRef]
  14. Ge, G.; Cheng, X.; Liao, M.; Xue, Q.; Zou, J. Influence of the pulsed AMF arc control on the vacuum arc and post arc characteristic in vacuum interrupters. In Proceedings of the 2017 4th International Conference on Electric Power Equipment-Switching Technology (ICEPE-ST), Xi’an, China, 22–25 October 2017; pp. 157–160. [Google Scholar] [CrossRef]
  15. You, T.; Dong, X.; Zhou, W. SF_6 in medium voltage equipment experimental research on alternative gases. Electr. Mach. Control 2022, 26, 59–65. [Google Scholar] [CrossRef]
  16. Zhang, H.; Yao, Y.; Wang, Z.; Zhang, B.; Hao, X.; Liu, Y.; Du, Y. Application of arc breaking simulation in development of extra high voltage SF6 circuit breaker. In The 16th IET International Conference on AC and DC Power Transmission (ACDC 2020); IET: London, UK, 2020; pp. 842–845. [Google Scholar] [CrossRef]
  17. Wang, J.; Lu, J.; Peng, Y. Measurement of lightning parameters and its device research. Power Grid Technol. 2009, 33, 162–165. [Google Scholar]
  18. Dadda, S.; Bouthiba, T.; Seghir, S. Primary Arc Modeling in Transmission Line. In Proceedings of the 2018 International Conference on Electrical Sciences and Technologies in Maghreb (CISTEM), Algiers, Algeria, 28–31 October 2018; pp. 1–3. [Google Scholar] [CrossRef]
  19. Ye, Q. A Simple Analytical Method of Gas Discharge Based on Logistic Model. IEEE Trans. Plasma Sci. 2019, 47, 1413–1420. [Google Scholar] [CrossRef]
  20. Liu, X.; Huang, X.; Cao, Q. Simulation and Experimental Analysis of DC Arc Characteristics in Different Gas Conditions. IEEE Trans. Plasma Sci. 2021, 49, 1062–1071. [Google Scholar] [CrossRef]
  21. Yin, J.; Li, X.; Gao, T.; Liu, C. Analysis of Arc Dynamic Characteristics in DC Disconnecting Switch. In Proceedings of the 2021 IEEE 4th International Electrical and Energy Conference (CIEEC), Wuhan, China, 28–30 May 2021; pp. 1–4. [Google Scholar] [CrossRef]
  22. Chen, Y.; Wang, J.; Yang, Z.; Li, Q. Research on arc extinguishing characteristics of semi enclosed structures based on normal reflection theory of shock wave. J. Guangxi Univ. (Nat. Sci. Ed.) 2022, 47, 399–405. [Google Scholar] [CrossRef]
  23. Xia, Y.; Wu, X. Study on conductivity calculation of arc plasma in local thermodynamic equilibrium. Electr. Switch 2020, 58, 19–23. [Google Scholar]
  24. Feng, N.; Ma, T.; Chen, C.; Yao, B.; Gao, W. Simulation and Study of DC Corona Discharge Characteristics of Bar-Plate Gap. Energies 2022, 15, 6431. [Google Scholar] [CrossRef]
  25. Li, Q.; Wang, J.; Zhang, Y.; Wang, Y.; Chen, Y.; Yang, Z.; Tan, S.; Wang, X. Research on the performance of the air blowing arc extinguishing device based on the magnetic fluid theory. Power Grid Technol. 2022, 46, 2025–2031. [Google Scholar]
  26. Shi, Y.; Cui, B.; Chen, Y.; Lin, S.; Zhang, J.; Zhong, J.; Wu, Y. Research on non-equilibrium conductivity of switching arc. High Volt. Appar. 2020, 56, 27–33. [Google Scholar]
  27. Andreotti, A.; Pierno, A.; Verolino, L. A New Channel-Base Current Model for Lightning-Induced Voltage Calculations. IEEE Trans. Electromagn. Compat. 2019, 61, 617–622. [Google Scholar] [CrossRef]
  28. Lu, S. Research on the Electronic Electrothermal Current Calculation Method of a Small Terminal Circuit Breaker; Shenyang University of Technology: Shenyang, China, 2021. [Google Scholar] [CrossRef]
  29. Wang, J.; Zhu, L.; Lu, J. Simulation analysis of gap lightning protection based on improved Mayer arc model. Guangxi Electr. Power 2008, 5, 50–52, 64. [Google Scholar] [CrossRef]
  30. Yu, Q.; Zhang, H.; Yang, R. Numerical simulation of hydroelectric shock wave based on LS-DYNA. Explos. Shock. 2022, 42, 128–139. [Google Scholar]
  31. Wang, J.; Lu, X.; Han, L.; Mao, C. Experimental study on extinguishing DC arc by self-energy multi fracture arc extinguishing device. Electr. Meas. Instrum. 2022, 09–14, 1–6. Available online: http://kns.cnki.net/kcms/detail/23.1202.TH.20210107.1404.010.html (accessed on 10 September 2022).
Figure 1. Schematic diagram of the gas arc-extinguishing process. (a) Pre-breakdown (b) Arc maintenance (c) Arc extinguished.
Energies 15 07490 g001
Figure 2. Two-dimensional axisymmetric COMSOL simulation model diagram.
Energies 15 07490 g002
Figure 3. Simulation curve of conductivity change.
Energies 15 07490 g003
Figure 4. Conductivity change cloud diagram. (a) 5 μs, (b) 20 μs, (c) 90 μs, (d) 120 μs, (e) 180 μs, (f) 250 μs.
Energies 15 07490 g004
Figure 5. Simulation curve of pressure change.
Energies 15 07490 g005
Figure 6. Pressure change cloud diagram. (a) 5 μs, (b) 20 μs, (c) 40 μs, (d) 70 μs, (e) 205 μs.
Energies 15 07490 g006
Figure 7. Energy distribution curve (70 kV).
Energies 15 07490 g007
Figure 8. Simulation curves of pressure and current peaks varying with voltage (100 mm).
Energies 15 07490 g008
Figure 9. Electrical schematic diagram of the experimental device.
Energies 15 07490 g009
Figure 10. Schematic diagram of experimental sample structure.
Energies 15 07490 g010
Figure 11. Experimental grounding waveform.
Energies 15 07490 g011
Figure 12. Arc−extinguishing waveform of the 100 mm gas gap explosion (70 kV).
Energies 15 07490 g012
Figure 13. The development process of the arc channel.
Energies 15 07490 g013
Figure 14. 100 cm gap μ and I actual and theoretical value comparison diagram.
Energies 15 07490 g014
Table 1. Simulation reference ground current peaks.
Voltage/kV203040506070
Current/kA101214172025
Publisher’s Note: MDPI stays neutral with regard to jurisdictional claims in published maps and institutional affiliations.

