Abstract
The Ri-Qing-Wei Basin is a newly discovered Late Mesozoic rift basin on the eastern Shandong coast in recent years. Thick, continuous deposited source rocks are found in the Lingshan Island scientific drilling project. Therefore, it is necessary to evaluate the distribution and hydrocarbon generation potential of source rocks in this area. Organic geochemical experiments were carried out on samples from the core of LK-1 and outcrops in the Lingshan Island, the Laoshan area, and the Jimo Zhougezhuang area to evaluate the maturity, abundance, and type of organic matter in source rocks. The results show that the cumulative thickness of the source rocks in the study area is more than 500 m, and the TOC content is generally greater than 1.0%. The organic matter type is good (mainly type II1 and type II2 kerogen) and the Ro value is more than 2.0. The thermal evolution degree of the organic matter is high with natural gas predominantly generated. We carried out Rock-Eval, PY-GC and gold tube experiments on low-maturity samples of Laikong 2 and established a chemical kinetic model to quantitatively evaluate the study area in combination with sedimentary burial history and thermal history data. The results show that the total resources of the five sags in the study area are about 476 billion cubic meters, and the average resource intensity is about 82.2 million cubic meters/km2. Among them, the resource intensities of the Lingshan Island Sag and Laoshan Sag are 112.6 million cubic meters/km2 and 98.8 million cubic meters/km2, respectively. Studied sites are “small and fertile” and may be used as favorable exploration prospect areas.
1. Introduction
Source rocks is a rock having the capability to produce sufficient hydrocarbons quantity to form a gas or oil reservoir. Geochemical analysis and geophysical characteristics analysis are usually conducted on rock samples to obtain detailed information about the capacity and quality of source rocks [1,2].
The Ri-Qing-Wei Basin is located in the middle section of the Sulu orogenic belt, the junction of the North China Plate and the Yangtze Craton, and a long and narrow sea-land transition zone between the southeastern margin of the Shandong Peninsula and the Qianliyan uplift [3]. Previously, the Fourth Geological and Mineral Exploration Institute of Shandong Province (2003) suggested that the study area belonged to the Jiaolai Basin, and this view has been followed for more than ten years. Zhou et al. (2015) first discovered the “Late Mesozoic rift basin in the eastern Shandong coast”, which is now referred to as the “Ri-Qing-Wei Basin”, based on regional gravity and magnetic data combined with field geological outcrops, through sedimentological analysis and zircon U-Pb dating of this set of strata. The overall exploration level of the Ri-Qing-Wei Basin is relatively low, and the previous studies on it are seldom and mostly concentrated in the Lingshan Island area [3,4,5,6,7,8,9]. In 2018, Well Lingke 1 was drilled to a depth of 1352 m, and the continuous deposition of the Laiyang Formation was discovered. In this set of strata, huge thick argillaceous source rock deposits were found. Combined with the field profile, the cumulative thickness of the source rock exceeded 500 m. The preliminary source rock evaluation results show that the residual total organic carbon content (TOC) in the mudstone is generally greater than 1.0%, the highest content is 2.3%, and the average is 1.2%, which generally reaches the standard of medium-good source rock; the vitrinite reflectance (Ro) is above 2.0%. The source rocks in the Jiaolai Basin have limited distribution, small thickness, low maturity, and medium abundance of organic matter, resulting in limited hydrocarbon generation potential, which limits the oil and gas exploration in this basin [10,11,12,13]. Based on the study of Well Lingke 1, this paper preliminarily reveals that the organic matter types of source rocks in Ri-Qing-Wei Basin and Jiaolai Basin are similar, mainly II [14], but the source rocks in Ri-Qing-Wei Basin is thicker and has higher organic matter content, and has reached a high evolution stage, reflecting that the basin has high oil and gas exploration potential. However, at present, the qualitative evaluation of source rocks in the study area is seldom carried out and the quantitative evaluation has not been carried out yet [5,7]. There is a lack of understanding of the oil and gas resource potential in the study area, and it is urgent to carry out investigations related to source rock evaluation. The study of source rock evaluation is very important and meaningful for the prospect of understanding the block and future exploration work [15].
Based on the organic geochemical test and analyses of the outcrop and drilling source rocks in the field, this paper clarifies the distribution characteristics of the source rocks in the Laiyang Formation and determines the organic matter abundance, type, and maturity of the source rocks. Combined with the low-maturity samples of Well Laikong 2, the thermal simulation experiment of hydrocarbon generation was carried out. Using the hydrocarbon generation kinetics to calculate the hydrocarbon generation intensity of the source rocks, the favorable oil and gas exploration areas in the Ri-Qing-Wei Basin are proposed, which will lay the foundation for the future oil and gas resource exploration in the Ri-Qing-Wei Basin.
2. Geological Setting
The geographical scope of the Ri-Qing-Wei Basin in eastern Shandong is mainly the offshore area around Rizhao, Qingdao, and Weihai cities, with an area of about 20,000 square kilometers. It is a late Mesozoic rift basin formed by strong lithospheric extension on the Sulu orogenic belt, and is located at the junction of the North China and Yangtze Cratons. The late development of the Ri-Qing-Wei Basin was influenced by the Yanshan Movement and the Himalayan Movement. As a result, the basin was uplifted and denuded, forming the current pattern of residual basins in the Late Mesozoic rifted basins [3]. It is a NE-trending narrow and long marine rift basin, located in the middle of the Sulu orogenic belt, the Qingdao-Wulian fault zone, and the Muping-Jimo fault zone in the southeast direction, and the Qianliyan fault zone in the northwest direction (Figure 1). The scope of the Ri-Qing-Wei Basin may extend to the Qianliyan uplift, and the southern boundary of the basin may extend to the Jiashan-Xiangshui fault zone in the South Yellow Sea Basin, showing a structural pattern of alternating sags and uplifts [3,4]. Seven sags have been initially identified in their interior, namely the Rizhao Sag, the Lingshan Island Sag, the Laoshan Sag, the Haiyang Sag, the Rushan Sag, the Shidao Sag, and the Rongcheng Sag.
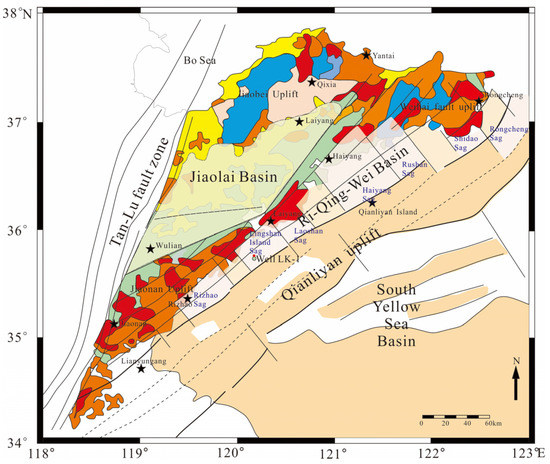
Figure 1.
Geological map of the Ri-Qing-Wei Basin (Adapted with permission from Ref. [10]. 2021, Zhou, T.).
3. Organic Geochemical Characteristics
3.1. Distribution Characteristics of Source Rocks
Ri-Qing-Wei Basin mainly develops the Laiyang Formation and the Qingshan Formation, of which the Laiyang Formation is the main source rock in the study area. The analysis of datum from Well LK-1 (the stratum of the Laiyang Formation was encountered about 1300 m) [10], outcrops, seismic reflection characteristic profile of Haiyang Sag (strata thickness between 1800 m and 2000 m) and Bouguer gravity anomaly map shows that the thickness of the Laiyang Formation in the Ri-Qing-Wei Basin is more than one kilometer, among which the Laoshan and Haiyang sags are thicker, and the thickness of the center of the sag is generally higher than 1800 m. In the Lingshan Island sag, the thickness of the center is generally higher than 1400 m, and the thickness of the Rizhao sag is relatively thin, basically less than 1400 m (Figure 2). The mudstone/strata ratio in the study area can be obtained by the content of terrigenous sedimentary rocks in the Zhougezhuang section, the Lingshan Island section, and the Laoshan Yakou section [7]. Figure 3 shows that the mudstone/strata ratio of the Laiyang Formation in the Ri-Qing-Wei Basin is generally higher than 20%, of which the Lingshan Island Sag is the largest, with an average mudstone/strata ratio of 40%. Followed by the Laoshan Sag and the Rizhao Sag, with an average of 20–35%, the Haiyang Sag and the Rushan Sag with the lowest mudstone/strata ratio, basically lower than 30%.
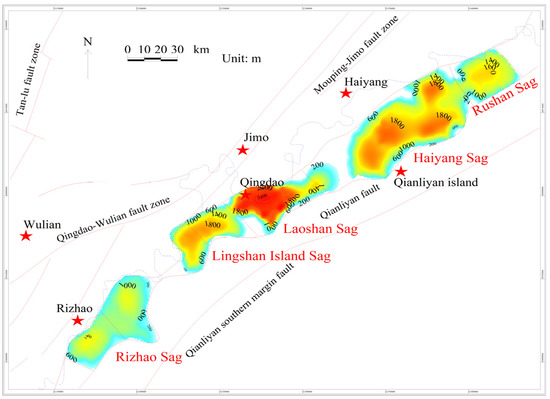
Figure 2.
Contour map of formation thickness of the Laiyang Formation in the Ri-Qing-Wei Basin.
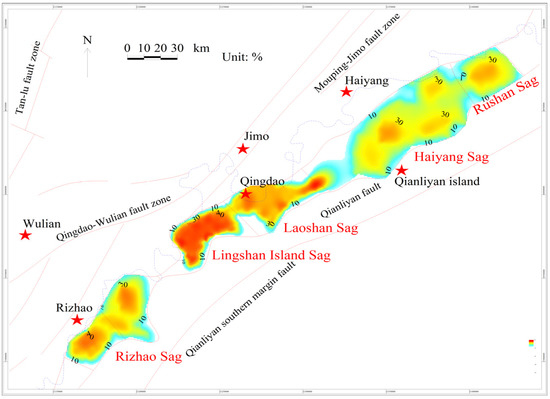
Figure 3.
Contour map of the mudstone/strata ratio of the Laiyang Formation in the Ri-Qing-Wei Basin.
The development of source rocks in the Laiyang Formation is depicted by the thickness of the Laiyang Formation and the mudstone/strata ratio (Figure 4). The thickness of mudstone in the Laoshan Sag of the Ri-Qing-Wei Basin is the largest, up to 800 m thick. The second is the Lingshan Island Sag, whose thickness is generally greater than 400 m. The thickness of mudstone in the other three sags is smaller, between 200 m and 600 m.
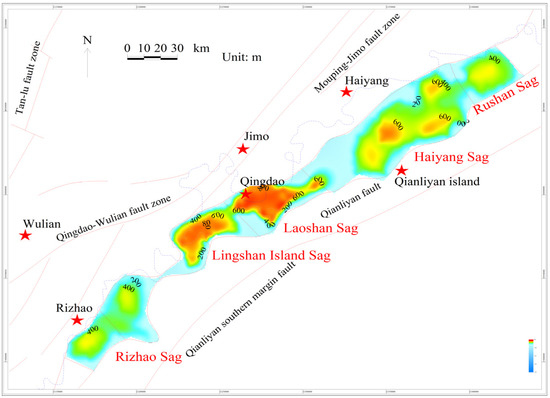
Figure 4.
Contour map of the mudstone thickness of the Laiyang Formation in the Ri-Qing-Wei Basin.
3.2. Organic Matter Maturity
This paper mainly used vitrinite reflectance (Ro) to study the maturity of source rocks in the study area. Vitrinite reflectance (Ro) refers to the ratio of the reflected light to the incident light intensity measured when the sample is placed under an oil immersion objective [16]. It is irreversible and continuous, and is the most reliable parameter for the study of organic matter maturity. The vitrinite reflectance (Ro) of the 18 argillaceous source rock samples collected from Well LK-1 ranged from 3.59% to 4.65%, with an average value of 4.30%, which indicated that the organic matter of the source rocks in the Laiyang Formation in the study area was in the over-mature stage. The sampling in the study area was limited, and thereby, the parameters of Well Laican 1 (19 samples), Well Laiqian 2 (38 samples), and Well Laikong 2 (19 samples) in the Jiaolai Basin were used, combined with the sedimentary evolution history, to deduce the normal evolution trend of the source rocks of the Laiyang Formation in the Ri-Qing-Wei Basin. Comparing the vitrinite reflectance of samples from Well Laican 1 and Well Laiqian 2 in Jiaolai Basin that was baked by volcanoes in Figure 5 and the samples with normal evolution, it could be found that under the influence of volcanic baking, the vitrinite reflectance of the samples (Ro) increased by around 1%. Therefore, about 1% of the vitrinite reflectance measured in Well LK-1 was potentially caused by volcanic baking, and the remaining 3% was likely achieved by normal evolution, which was inconsistent with the depth of the samples at this time. Therefore, it was speculated that the source rocks of the Laiyang Formation in the study area had a large burial depth of about 3000 m in history.
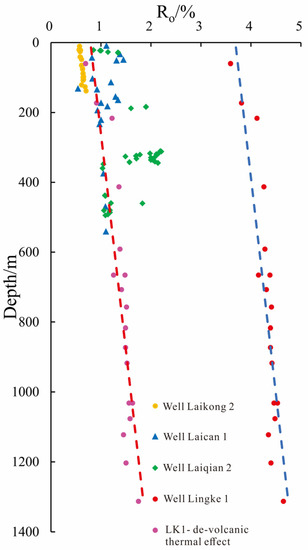
Figure 5.
Evolution trend of source rocks in the Laiyang Formation.
At present, no volcanic rock bodies had been found in the sea area of the Ri-Qing-Wei Basin, which was presumed to be a normal thermal evolution trend. On the basis of the restoration of sedimentary burial history and thermal history, the Easy-Ro% method was used to reconstruct the Ro evolution history of the source rocks of the Laiyang Formation [17], revealing that the center of the sag was generally in the over-mature stage and was dominated by natural gas resources. According to the contour map of vitrinite reflectance (Ro) in the Ri-Qing-Wei Basin in various periods, it was found that the Laiyang Formation source rocks had basically entered the mature stage at the end of the Laiyang Formation deposition. At the end of the Qingshan period, the source rocks of the Laiyang Formation rapidly entered the high-mature to over-mature stage due to the influence of sedimentary burial depth and volcanic baking. At the end of the Wangshi period, the burial depth of the Laiyang Formation further increased, and the source rocks generally entered the overmature stage. From the Paleocene to the end of the Quaternary sedimentary period, the current Ro of the source rocks was similar to that of the late Wangshi period (Figure 6).
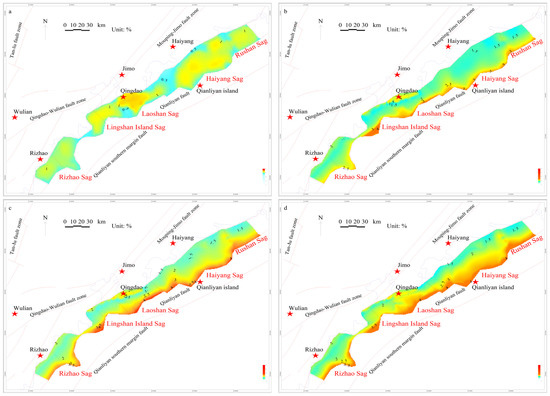
Figure 6.
Contour map of Ro in different periods in the Ri-Qing-Wei Basin ((a). Ro contour at the end of the Laiyang period; (b). Ro contour at the end of the Qingshan period; (c). Ro contour at the end of the Wangshi period; (d). present-day Ro contours).
3.3. Organic Richness
Organic richness is one of the important evaluation criteria for the enrichment of organic matter in source rocks, which refers to the quantity of organic matter per unit mass of rock. Generally speaking, under the premise of similar other conditions, the higher organic richness in the rock, the stronger its hydrocarbon-generating ability and the better the source rocks [18,19,20]. At present, the indicators to measure organic richness in rocks mainly include TOC, chloroform bitumen “A”, total hydrocarbons (saturated hydrocarbons and aromatic hydrocarbons in chloroform “A”), and pyrolysis hydrocarbon generation potential (S1 + S2) [21,22,23,24,25,26].
The outcrop source rock samples in the Ri-Qing-Wei Basin are greatly affected by weathering due to their long-term exposure to the surface. The organic matter thermal evolution degree of source rocks in the basin is relatively high [7], and the evaluation index of hydrocarbon generation potential (S1 + S2) is greatly affected by the type and maturity of source rocks, while the evaluation index of TOC content is less affected by factors such as weathering [27,28,29,30]. Therefore, the evaluation index of TOC was selected in this paper to evaluate organic richness in the outcrop samples collected in the field and 161 samples from Well LK-1. The Lingshan Island Sag in the Ri-Qing-Wei Basin had the highest TOC, generally higher than 1.2%, with a maximum of 2%. The Laoshan Sag and Rizhao Sag were next, with TOC ranging from 0.8% to 1.6%. The Haiyang-Rushan Sag had the lowest TOC, generally lower than 1.2% (Figure 7).
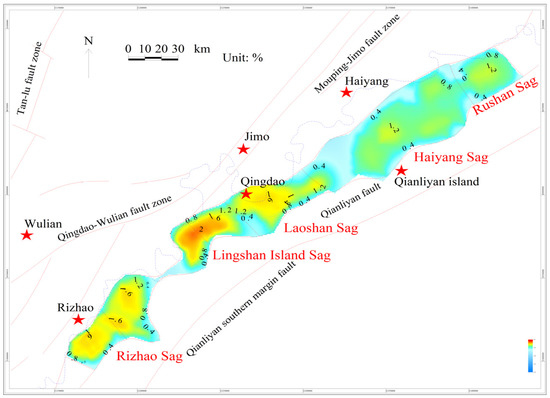
Figure 7.
Contour map of TOC in the Laiyang Formation in the Ri-Qing-Wei Basin.
3.4. Organic Matter Type
Organic matter type is one of the important factors determining the hydrocarbon production amount and the composition of hydrocarbon products of source rocks [31,32], an important indicator of source rock quality, and important evidence for evaluating the hydrocarbon generation potential of source rocks [33,34,35]. Through the analysis of the microcomponent content of 19 core samples, it was found that organic matter types of the argillaceous source rock samples of the Laiyang Formation in the study area were mainly sapropel-humus (type II2) and humus-sapropiate (type II1), accounting for 84.21%. Based on the analysis of kerogen microcomponent content of 14 outcrop samples, it was found that the samples in the Laohuzui section, the Beilaishi section, and the Jimo Zhougezhuang section in the Lingshan Island area were humic type (type III), and the samples of other sections were characterized by humic-sapropiate type (type II1) and sapropel type (type I). Comprehensive analysis of core and outcrop samples showed that the Laiyang Formation source rocks in the Ri-Qing-Wei Basin contained good organic matter types, mainly type II1 and type II2 kerogens, and exhibits high oil-generating potential.
Based on the sedimentary characteristics of the study area, the kerogen in the study area were divided into three types. The source rock with better kerogen type was represented by a mixture of 70% type II1 and 30% type II2, the source rock with moderate kerogen type was represented by a mixture of 50% type II1 and 50% type II2, while the source rock with poor kerogen type was represented by a mixture of 30% type II1 and 70% type II2 (Figure 8).
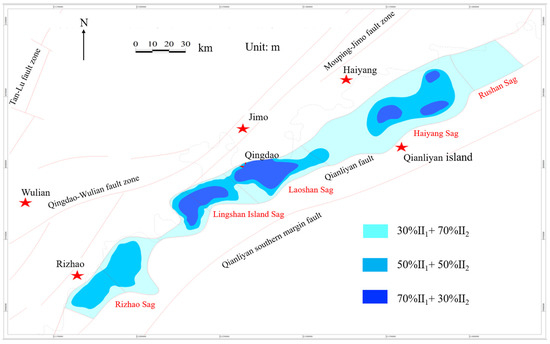
Figure 8.
Distribution of the kerogen types of the Laiyang Formation source rocks in the Ri-Qing-Wei Basin.
4. Resource Evaluation
4.1. Materials and Methods
The selection of samples requires considerations of not only the representativeness but also factors such as the maturity and abundance of the samples [36]. The drilling and outcrop datum showed that the source rocks in the study area generally reached the standard of medium-good source rocks, but the samples were all in the high and over-mature stage (Ro > 2.0%), which were not suitable for thermal simulation experiments of hydrocarbon generation and could not reflect the whole process of hydrocarbon generation and evolution. A comparison of regional data showed that gravity collapse caused by thickened crust or lithosphere that occurred in the study area during the Laiyang period (150–125 Ma) was similar to that in the Jiaolai Basin. The difference was that the rifting in this area was more intense, resulting in the formation of narrow rifts, which in turn evolved into a marine rift basin [4]. The sedimentary thickness of the Laiyang rift basin far exceeded that of the Jiaolai Basin. Due to the water body communication between the Ri-Qing-Wei Basin and the Jiaolai Basin during this period, the paleoclimate environment and biological population of the two basins were similar [37], and low-mature samples could be found in the Jiaolai Basin for experiments. In this paper, two dark gray mudstone samples from Well Laikong 2 in the Laiyang Sag were selected for thermal simulation experiments of hydrocarbon generation kinetics. The analytical results showed that the hydrocarbon generation potentials of the two samples were 620 mg/g TOC and 266 mg/g TOC, respectively, and the parent material types were type II1 and type II2. The measured Ro of the two samples were 0.50% (0.47–0.53%, number of measuring points is 21, standard deviation: 0.02) and 0.51% (0.48–0.56%, number of measuring points is 23, standard deviation: 0.03), respectively, which were in the low maturity stage (Table 1). Therefore, these two samples were quite representative and could represent the type II1 and type II2 source rocks in the Laiyang Formation, respectively.

Table 1.
Geochemical analysis results of source rock samples from thermal simulation experiment in Well Laikong 2.
Rock-Eval, PY-GC, and gold tube experiments were designed and carried out in order to obtain the temperature–gas production rate relationship curve necessary for calibrating the chemical kinetic model of organic matter to oil and gas. Pyrolysis experiments were carried out on a Rock-Eval-II pyrolyzer. Starting from 200 °C, the sample was heated to 600 °C at heating rates of 5, 10, and 20 °C/min, respectively, and the relationship between the amount of product and the heating temperature was recorded in real-time. Meanwhile, the pyrolysis products were collected at temperature intervals of 30 °C and analyzed by gas chromatography (PY-GC analysis) under the same heating temperature range and heating rate. Combined with previous experimental results, the hydrocarbon production rate–temperature relationship curve could be converted into two curves of oil production rate–temperature and gas production rate-temperature relationship, which could be used to calibrate the kinetic parameters of oil and gas respectively. Under the pressure of 50 MPa in the gold tube experiments, a series of experiments were carried out by heating the extract from 200 °C to above 600 °C at a heating rate of 20 °C/h and 10 °C/h, respectively. The ratio of the gas production rate to the limit gas production rate at each experimental point was the gas conversion rate at each point, from which the gas conversion rate-heating temperature relationship curve could be obtained, which was used for calibrating the chemical kinetic model of oil-to-gas.
4.2. Model Selection and Calibration
In this paper, the chemical kinetic model of parallel first-order reaction with wide applicability was selected. The models of kerogen oil, gas and oil cracking into gas were as follows [38,39,40,41,42,43,44,45,46,47]:
The calibration of the hydrocarbon generation kinetic model was realized by the variable scale optimization algorithm [48,49,50,51].
4.3. Model Calibration Results
Figure 9 shows the relationships between the conversion rates of kerogen to oil, kerogen to gas, and oil to gas obtained from two dark mudstone samples of the Laiyang Formation or theoretical conversion rates under the corresponding conditions calculated by the calibrated model in open and closed systems and temperature at different heating rates. Under the conditions of different heating rates, both of them showed good agreement, which indicated the accuracy and the feasibility of the model calibrated in this paper [51]. Figure 10 showed the activation energy distribution of kerogen into oil, kerogen into gas, and oil into gas after calibration, indicating that the two samples exhibit strong hydrocarbon generation potential. The activation energy of oil generation of type II1 kerogen samples was mainly distributed around 47.85 kcal/mol, the average activation energy was 47.88 kcal/mol, the average activation energy of gas generation was 51.57 kcal/mol, and the average activation energy of oil cracking to gas was 54.94 kcal/mol, indicating that the cracking of crude oil in the formation required higher temperature (Figure 9a1–a3). Type II1 kerogen had high activation energy and single components started hydrocarbon generation late and generated large amounts of hydrocarbons in a short period of time. The amount of oil generated was higher than that of gas, and the total gas volume was dominated by crude oil cracking. The average activation energy of oil generation of type II2 kerogen samples was 40.89 kcal/mol, the average activation energy of gas generation was 47.86 kcal/mol, and the average activation energy of oil cracking into gas was 56.57 kcal/mol, indicating that as the type of kerogen became worse, the gas generation period of source rocks was earlier and easier to generate gas (Figure 9b1–b3). Type II2 kerogen had low activation energy and diverse components, started hydrocarbon generation early and had a long hydrocarbon generation cycle. The proportions of kerogen oil generation and gas generation were the same, and the total gas volume also showed that the crude oil cracking gas volume was equivalent to the kerogen gas generation volume. On the whole, the distribution range of the reaction activation energy of type II2 source rocks in Well Laikong 2 was wider than that of the former, indicating that the worse the organic matter type, the wider the bond energy distribution, and its hydrocarbon generation window was larger than that of the better type.
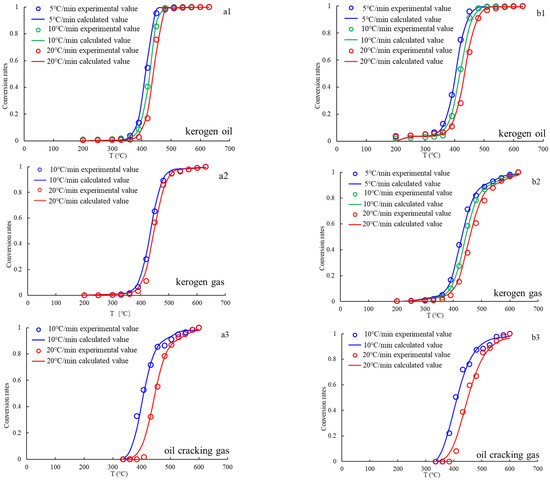
Figure 9.
Relationship between temperature and hydrocarbon conversion rate of kerogen ((a1–a3). type II1; (b1–b3). type II2).
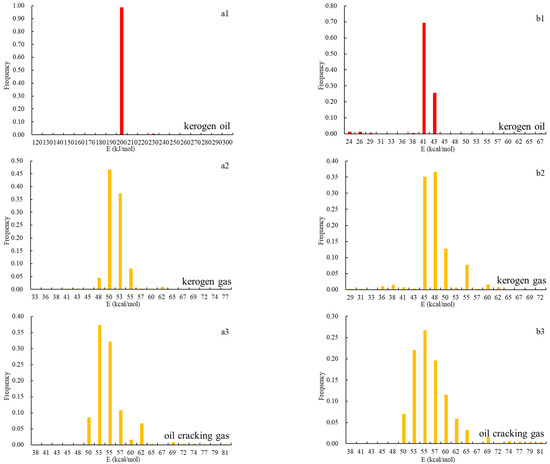
Figure 10.
Activation energy distribution of kerogen((a1–a3). type II1; (b1–b3). type II2).
4.4. Evaluation of Hydrocarbon Generation Potential
According to the genetic mechanism of oil and gas, the amount of hydrocarbon generation per unit mass of source rock depends on the abundance, type, and maturity of organic matter. Organic matter type determines the original hydrocarbon-generating capacity of the organic matter, and the maturity reflects the degree of hydrocarbon transformation. Therefore, the amount of oil and gas generated can be expressed as:
where S is the area of the source rock; H is the thickness of the source rock; ρ is the density of the source rock, taking 2.3 g/cm3; TOC is the organic carbon content of the source rock; is the original hydrocarbon generation potential per unit mass of organic matter; X is the conversion rate of hydrocarbons.
According to the activation energy of hydrocarbon generation reaction of different types of organic matter and the characteristics of geohistory/thermal history of the study area, combined with the chemical kinetics method and the EasyRo model [17], the evolution characteristics of different types of kerogen oil generation, kerogen gas generation, and oil cracking gas conversion rate with Ro were established (Figure 11). From this, the conversion rates of kerogen to oil, kerogen to gas, oil to gas, net oil, and total gas in three regions were calculated according to the corresponding proportions.
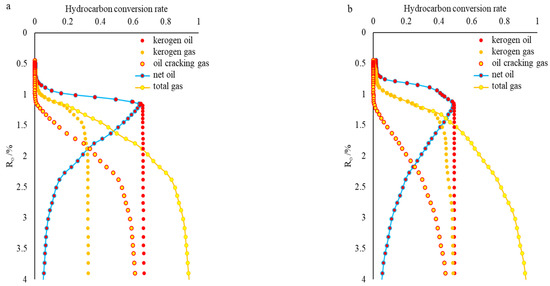
Figure 11.
Conversion rate profiles of different types of organic matter into hydrocarbons ((a). type II1; (b). type II2).
According to the principle of Formula (4), the Ri-Qing-Wei Basin was evenly divided into 5791 evaluation areas on the plane using a grid of 1 km × 1 km. The total area of the study area was 5791 km2, of which the Rizhao Sag was about 1217 km2, the Lingshan Island Sag was about 720 km2, the Laoshan Sag was about 946 km2, the Haiyang Sag was about 2240 km2, and the Rushan Sag was about 667 km2. According to the geological age, it is divided into four periods: Laiyang period, Qingshan period, Wangshi period, and Paleocene-Quaternary period. We calculated the gas generation volume in each grid area in each period separately and added up the gas volume to get the gas generation volume in each period. The total gas generation volume of the entire Ri-Qing-Wei Basin could be obtained by adding up the gas generation volume in each period.
At the end of the Laiyang Formation deposition, it basically entered the mature stage. The total gas generation volume in the study area was 13.2 trillion cubic meters, and the kerogen gas generation volume was 12.31 trillion cubic meters, accounting for 93% of the total gas generation. The Laoshan and Haiyang sags had relatively large gas generation volume (Figure 12a). At the end of the Qingshan period, affected by the depth of sedimentary burial and volcanic baking, the source rocks of the Laiyang Formation quickly entered the stage of high-mature to overmature, and the total gas generation volume in the study area was 57.7 trillion cubic meters (Figure 12b). During this period, a large amount of crude oil was cracked into gas, the oil cracking gas volume was 21.56 trillion cubic meters, accounting for 37% of the total gas volume. At the end of the Wangshi period, the burial depth of the Laiyang Formation of the Laiyang Group further increased, and the source rocks generally entered the high maturity stage. The total cumulative gas generation volume in the study area was 66.5 trillion cubic meters. The kerogen gas generation volume basically ended, the crude oil was further cracked, and the oil cracking gas accounted for about 44% of the total gas volume, and the Laoshan and Haiyang sags had larger gas volume (Figure 12c). The Paleocene to Quaternary sediments failed to make up for the uplifting and denudation at the end of the Cretaceous. The differences between the current Ro and the late Wangshi period of the source rocks were small, but the crude oil was still cracking continuously. The total gas volume in the study area was about 75.4 trillion cubic meters, and the oil cracking gas accounted for about 50% (Figure 12d).
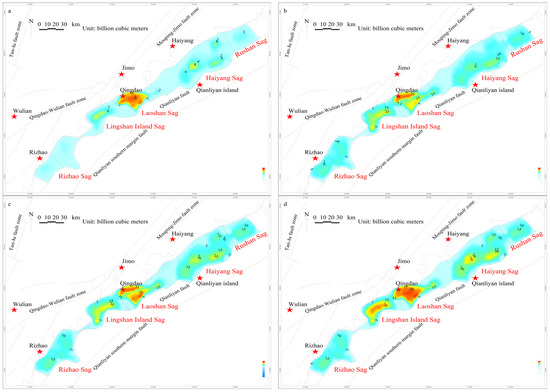
Figure 12.
Gas generation volume of Ri-Qing-Wei Basin in different periods ((a) gas volume at the end of Laiyang period; (b) gas volume at the end of Qingshan period; (c) gas volume at the end of Wangshi period; (d) current gas volume).
4.5. Resource Assessment
Oil and gas migration and accumulation coefficient is a key parameter for calculating oil and gas resources in the genetic method of oil and gas resource evaluation which referred to the ratio of oil and natural gas accumulation to hydrocarbon generation in a certain geological unit, usually expressed as a percentage [52]. It is mainly used to characterize the migration and preservation conditions of a geological unit, which can directly reflect the resource potential [53]. At present, the most widely used method for calculating oil and gas resources at home and abroad is the product of hydrocarbon generation and migration-accumulation coefficient [54]. Objectively evaluating the oil and gas migration and accumulation coefficient and determining its reasonable value standard and range are crucial to the evaluation of oil and gas resources [55]. The migration and accumulation coefficient of natural gas is generally between 5‰ and 2%. This time, the migration and accumulation coefficient of the volcanically active area from the Paleocene to the Quaternary period is set to be 5‰, and the migration and accumulation coefficient of the non-volcanic activity area is set to 2.5%. The natural gas migration and accumulation coefficient generated in the Wangshi, Qingshan and Laiyang periods gradually halved (Table 2).
Table 2.
Migration-accumulation coefficient, gas generation volume and resource contribution in different periods of the Ri-Qing-Wei Basin.
The total resources of the five sags in the Ri-Qing-Wei Basin were about 476 billion cubic meters, the resources of the Rizhao Sag were about 70.5 billion cubic meters, the resources of the Lingshan Island sag were about 81.1 billion cubic meters, the resources of the Laoshan Sag were about 92.9 billion cubic meters, the resources of the Haiyang Sag were about 201.3 billion cubic meters, and the resources of the Rushan Sag were about 30.3 billion cubic meters. From the perspective of resources, the Haiyang Sag, the Laoshan Sag, and the Lingshan Island Sag had the largest resources (Figure 13). The research area was mainly contributed by the Qingshan period and the Paleocene ~ Quaternary period (Table 2).
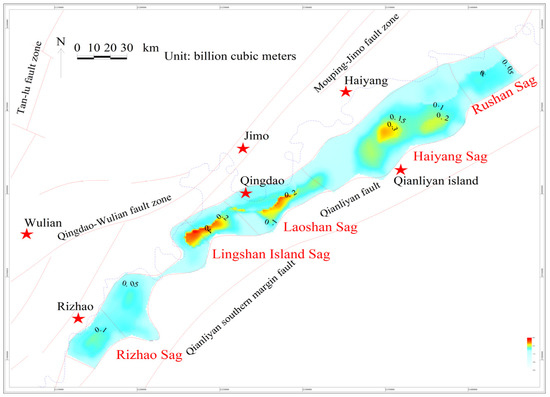
Figure 13.
Contour map of total resources in Ri-Qing-Wei Basin.
The total area of the five sags in the Ri-Qing-Wei Basin is about 5790 km2, and the average resource intensity is about 82.2 million cubic meters/km2. The resource intensity of the Rizhao Sag is 57.7 million cubic meters/km2, the resource intensity of the Lingshan Island Sag is 112.6 million cubic meters/km2, the resource intensity of the Laoshan Sag is 98.8 million cubic meters/km2, the resource intensity of the Haiyang Sag is 89.9 million cubic meters/km2, and the resource intensity of the Rushan Sag is 45.2 million cubic meters/km2. The Haiyang Sag has high total resources, but due to its large area, the resource intensity is not high, while the Lingshan Island and Laoshan sags have high average resource intensity and are “small and fertile”, which can be used as favorable exploration prospect areas.
5. Conclusions
In this study, the source rocks of the Laiyang Formation in the Ri-Qing-Wei Basin were taken as the research object, and the qualitative evaluation (source rocks distribution, organic matter abundance, type, maturity) and quantitative evaluation of the source rocks of the Laiyang Formation in the study area were present. The results show that the source rocks of the Laiyang Formation in the Ri-Qing-Wei Basin as a whole have a large thickness, generally more than 400 m, and the maximum thickness is 800 m. TOC is generally greater than 1%, with a maximum of 2.34%, the organic matter types belong to the mixed type of humic type and sapropel type, most of the source rocks are in the high-over-mature stage, and gas is the main source. Rock-Eval, PY-GC, and gold tube experiments were carried out based on the low- maturity samples from Well Laikong 2 to calibrate the chemical kinetic parameters of oil generation, gas generation, and oil cracking gas of type II1 kerogen and type II2 kerogen and establish hydrocarbon-forming conversion profiles of different kerogen types. Finally, we used the chemical kinetics method for quantitative evaluation. The total resources in the study area are about 476 billion cubic meters, and the average resource intensity is about 82.2 million cubic meters/km2, of which the resource intensity of the Lingshan Island Sag is 112.6 million cubic meters/km2, and the resource intensity of the Laoshan Sag is 98.9 million cubic meters/km2. Comprehensive analysis shows that the source rocks of the Laiyang Formation in the study area are dominated by gas and have certain shale gas resource prospects. The Lingshan Island and Laoshan sags are “small and fertile” and can be used as favorable exploration prospect areas.
Author Contributions
Investigation, K.W. and Y.C.; methodology, H.X.; software, W.H.; supervision, F.L. and Y.Z.; writing—original draft, F.L. and C.Z.; writing—review and editing, F.L., C.Z. and H.X. All authors have read and agreed to the published version of the manuscript.
Funding
This study is financially supported by the National Natural Science Foundation of China (Grants Nos. 42072130 and 41872152) and the Project of Department of Science and Technology of Sinopec (No. P20028).
Conflicts of Interest
The authors declare that they have no known competing financial interests or personal relationships that could have appeared to influence the work reported in this paper.
References
- Bouchaala, F.; Ali, M.Y.; Matsushima, J. Detailed study of seismic wave attenuation from four oilfields in Abu Dhabi, United Arab Emirates. J. Geophys. Eng. 2018, 15, 106–120. [Google Scholar] [CrossRef]
- Bouchaala, F.; Guennou, C. Estimation of viscoelastic attenuation of real seismic data by use of ray tracing software: Application to the detection of gas hydrates and free gas. Comptes Rendus Géoscience 2012, 344, 57–66. [Google Scholar] [CrossRef]
- Zhang, Z.K. The Tectono-Magmatic Evolution and Lithospheric Dynamics of Ri-Qing-Wei Basin. Ph.D. Thesis, China University of Petroleum (East China), Qingdao, China, 2017. [Google Scholar]
- Zhou, Y.Q.; Zhang, Z.K.; Liang, W.D.; Li, S.; Yue, H.W. Late Mesozoic tectono-magmatic activities and prototype basin restoration in Eastern Shangdong Province, China. Geosci. Front. 2015, 22, 137–156. [Google Scholar]
- Liu, Y. Organic Geochemical Characteristics of Lower Cretaceous Sedimentary in the Offshore Area of Shandong. Master’s Thesis, China University of Petroleum (East China), Qingdao, China, 2014. [Google Scholar]
- Li, J.; Jin, A.W.; Hou, G.T. Timing and implications for the late Mesozoic geodynamic settings of eastern North China Craton: Evidences from K-Ar dating age and sedimentary-structural characteristics records of Lingshan Island, Shandong Province. Indian Acad. Sci. 2017, 126, 117. [Google Scholar] [CrossRef]
- Gu, Y.J. Geochemical Characteristics of Source Rocks of the Laiyang Group in Ri-Qing-Wei Basin. Master’s Thesis, China University of Petroleum (East China), Qingdao, China, 2019. [Google Scholar]
- Zhou, Y.Q.; Gu, Y.J.; Zhou, T.F.; Yue, H.W.; Li, M.J.; Yin, X.C.; Liang, Z.; Cao, M.C.; Dong, S.H. Sedimentary strata and organic matter features of the Cretaceous Laiyang Group in eastern Shandong Province. Pet. Nat. Gas Geol. 2019, 40, 109–122. [Google Scholar]
- Sun, S.N. Study on Diagenesis of Sandstones from the Lower Cretaceous in the Qingdao area, Riqingwei Basin. Master’s Thesis, Shandong University of Science and Technology, Qingdao, China, 2020. [Google Scholar] [CrossRef]
- Zhou, T.F.; Zhou, Y.Q.; Zhao, H.J.; Li, M.J.; Mu, H.Y. Depositional Setting and Enrichment Mechanism of Organic Matter of Lower Cretaceous Shale in Ri-Qing-Wei Basin in the Central Sulu Orogenic Belt. Front. Earth Sci. 2022, 9, 808916. [Google Scholar] [CrossRef]
- Liu, H.; Li, L.; Wu, Z.P. Distribution and organic geochemical characteristics of hydrocarbon source rocks in the Jiaolai Basin. Pet. Exp. Geol. 2006, 28, 574. [Google Scholar]
- Liu, H.Y.; Liu, D.H.; Wang, F.; Zeng, Q.H.; Xiao, X.M.; Gan, H.J.; Tian, H. Petroleum inclusions in and organic geochemical characteristics of source rocks in Leiyang Depression. Geochimica 2008, 37, 87–96. [Google Scholar]
- Zhang, Y.; Zhou, T.F.; Chen, Y.; Li, S.Y.; Shang, Y.H.; Mu, H.Y.; Bai, B.Y.; Gao, H.; Jing, A.y.; Gao, Y.; et al. Comparative Study of Tectonic Evolution and Oil–Gas Accumulation in the Ri-Qing-Wei Basin and the Jiaolai Basin. Energies 2022, 15, 5322. [Google Scholar] [CrossRef]
- Xie, K. Analysis of the Accumulation Conditions of Shale Gas in Jiaolai Basin. Master’s Thesis, China University of Mining and Technology, Xuzhou, China, 2015. [Google Scholar]
- Mahdi, A.Q.; Abdel-Fattah, M.I.; Hamdan, H.A. An integrated geochemical analysis, basin modeling, and palynofacies analysis for characterizing mixed organic-rich carbonate and shale rocks in Mesopotamian Basin, Iraq: Insights for multisource rocks evaluation. J. Pet. Sci. Eng. 2022, 216, 110832. [Google Scholar] [CrossRef]
- Jiang, G.H.; Hu, R.Z.; Fang, W.X. Research progress of vitrinite reflectance (Ro) estimation of paleogeothermal. Geol. Geochem. 2001, 1, 40–45. [Google Scholar]
- Lu, S.F. The Kinetic Theory of Organic Hydrocarbon Generation And its Application; Petroleum Industry Press: Beijing, China, 1996; pp. 54–121. [Google Scholar]
- Chen, J.F.; Lu, J.C.; Shi, Z.Y.; Tang, Y.J. Development characteristics and hydrocarbon generating potential evaluation of Permian-Carboniferous source rocks in Ejina Banner basin and its adjacent area, western Inner Mongolia, China. Geol. Bull. 2010, 29, 346–350. [Google Scholar]
- Wang, W.T. Evaluation of paleogene hydrocarbon source rock in Qingdong sag, Bohaiwan Basin. J. Xi’an Univ. Sci. Technol. 2015, 35, 83–88. [Google Scholar]
- Zhou, Z.K. Characteristics of the Upper Triassic Source Rocks in the Qiangtang Basin, Qinghai-Tibet Plateau. Master’s Thesis, China University of Geosciences, Beijing, China, 2018. [Google Scholar]
- Li, W.; Alves, T.M.; Wu, S.G.; Voelker, D.; Zhao, F.; Mi, L.; Kopf, A. Recurrent slope failure and submarine channel incision as key factors controlling reservoir potential in the South China Sea (Qiongdongnan Basin, South Hainan Island). Mar. Pet. Geol. 2015, 64, 17–30. [Google Scholar] [CrossRef]
- Huang, D.F.; Li, J.C.; Zhou, Z.H.; Zhang, D. Evolution of Continental Organic Matter and Mechanism of Hydrocarbon Generation; Petroleum Industry Press: Beijing, China, 1984. [Google Scholar]
- Zhang, W.; Li, H.G.; Li, M.J. The characteristic of deep structure and natural gas accumulation in Changling fault depression, southern Songliao Basin. Mod. Geol. 2008, 22, 592. [Google Scholar]
- Zhang, H.F.; Fang, C.L.; Gao, X.Z. Petroleum Geology; Petroleum Industry Press: Beijing, China, 2008. [Google Scholar]
- Liu, G.D.; Gao, X.Z.; Huang, Z.L. Petroleum Geology; Petroleum Industry Press: Beijing, China, 2009; pp. 157–158. [Google Scholar]
- Wang, Y.Q. Organic Geochemistry Characteristics of Hydrocarbon Source Rocks in Wanshoushan Formation in Northeast Yunnan and Adjacent Areas. Master’s Thesis, Chengdu University of Technology, Chengdu, China, 2018. [Google Scholar]
- Wang, Q.J.; Chen, J.Y. Oil and Gas Geochemistry; China University of Geosciences Press: Wuhan, China, 1988. [Google Scholar]
- Cheng, K.M.; Wang, T.G.; Zhong, N.N. Geochemistry of Source Rocks; Science Press: Beijing, China, 1995. [Google Scholar]
- Hao, S.S.; Wang, F.Y.; Gao, G.; Gang, W.Z. Characteristics and evaluation of over-mature source rocks in the Lower Paleozoic. Prospector 1996, 1, 25–32. [Google Scholar]
- Li, Q.Q.; Li, B.; Liu, Y.L.; Hao, Y.Q.; Zheng, J.C. Paleozoic source-rock properties and hydrocarbon generation potential in Northwest Sichuan. Spec. Oil Gas Reserv. 2018, 25, 44–49. [Google Scholar]
- Xue, H.T. Study of Carbonate Source Rocks Evaluation Criterion; Daqing Petroleum Institute: Daqing, China, 2004. [Google Scholar]
- Liang, S.Y.; Li, F.L.; Fu, J.; Zhou, Y.S. Evaluation of Meso-cenozoic hydrocarbon source rocks in North Yellow Sea Basin. Pet. Exp. Geol. 2009, 31, 249–252. [Google Scholar]
- Rahman, M.; Kinghorn, R.R.F. A practical classification of kerogens relations to hydrocarbon generation. J. Pet. Geol. 2010, 18, 91–102. [Google Scholar] [CrossRef]
- Li, G.L. Analysis of Carboniferous Igneous Hydrocarbon Accumulation Characteristics and Controlling Factors in Hashan Area. Master’s Thesis, China University of Petroleum (East China), Qingdao, China, 2013. [Google Scholar]
- Zhang, C.C.; Peng, W.Q.; Hu, C.P.; Li, Z.; Gao, B.Y.; Li, Z.M.; Zhang, W.; Wang, Y.P.; Gao, H.L.; Zhang, G.L.; et al. Characteristics and resource potential of main shale gas reservoirs in Shandong Province. Chin. J. Geol. 2020, 94, 15. [Google Scholar]
- Wang, D.L.; Zhang, Y.; Lu, S.F.; Guo, J.Y.; Li, Z.S.; Mo, W.L.; Wang, M.; Wang, Y.F. The simulation experiment on gas-generating potential of over mature source rocks. Chin. J. Sedimentol. 2012, 30, 1172–1179. [Google Scholar] [CrossRef]
- Liu, F.F.; Zhou, Y.Q.; Zhang, Z.K.; Li, M.J.; Gu, Y.J.; Shan, J.Q.; Zhou, T.F. Sedimentary characteristics of late Mesozoic strata in the Ri-Qing-Wei Basin in the offshore area of eastern Shandong. Front. Mar. Geol. 2021, 37, 11. [Google Scholar]
- Lu, S.F.; Zhang, M. Oil and Gas Geochemistry; Petroleum Industry Press: Beijing, China, 2008. [Google Scholar]
- Tian, C.Z.; Lu, S.F.; Li, Q.M.; Fu, X.T.; Xue, H.T. The chemical kinetic model of oil cracking to gas under high pressure in Tarim Basin and its significance. Acta Sedimentol. Sin. 2002, 20, 488–492. [Google Scholar]
- Huang, W.B. The Evaluation of Deep Source Rocks and Prediction of Favorable Areas in the Mid-West Fault Depression, Songliao Southern Basin. Ph.D. Thesis, Northeast Petroleum University, Daqing, China, 2010. [Google Scholar]
- Lu, R.J. The Evaluation of Deep Source Rocks in Changling Fault Depression of Songliao Southern Basin. Master’s Thesis, Northeast Petroleum University, Daqing, China, 2011. [Google Scholar]
- Bai, Z.H.; Shi, B.H.; Zuo, X.M. Study on Shale Gas and its Aggregation Mechanism. Nat. Gas Pet. 2011, 29, 54–57. [Google Scholar]
- Li, X.Q.; Zhao, P.; Sun, J.; Fu, T.Y.; Lai, S.N.; Tian, X.W.; Ma, S.M.; Wang, F.Y. Study on the accumulation conditions of shale gas from the Lower Paleozoic in the south region of Sichuan Basin. J. Coal Sci. 2013, 38, 146–151. [Google Scholar]
- Lu, S.F.; Chen, X.; Fu, X.T. Hydrocarbon generation kinetic model of organic matter in coal in Taibei Sag and its preliminary application. Acta Sedimatology 1997, 15, 126–129. [Google Scholar]
- Lu, S.F.; Fu, X.T.; Chen, X.; Qu, J.Y.; Xue, S.Y. Chemical kinetic model and calibration of gas formation from crude oil groups. Chin. J. Geol. 1997, 4, 367–373. [Google Scholar]
- Lu, S.F.; Fu, X.T.; Liu, X.Y.; Qu, J.Y. Dynamic model of oil-to-gas and its calibration. Nat. Gas Ind. 1996, 6, 6–8. [Google Scholar]
- Mi, J.; Zhang, S.; He, K. Experimental investigations about the effect of pressure on gas generation from coal. Org. Geochem. 2014, 74, 116–122. [Google Scholar] [CrossRef]
- Tissot, B.P.; Pelet, R.; Ungerer, P. Thermal history of sedimentary basins, maturation indices, and kinetics of oil and gas generation. AAPG Bull. 1987, 71, 1445–1466. [Google Scholar]
- Ungerer, P.; Behar, F.; Villalba, M.; Heum, O.R.; Audibert, A. Kinetic modelling of oil cracking. Org. Geochem. 1988, 13, 857–868. [Google Scholar] [CrossRef]
- Ungerer, P. State of the art of research in kinetic modeling of oil formation and expulsion. Org. Geochem. 1990, 16, 1–25. [Google Scholar] [CrossRef]
- Lu, S.F.; Li, Z.D.; Li, J.J.; Liu, S.J.; Huang, Z.K.; Shen, J.N.; Xue, H.T. Chemical kinetic method of evaluating low-mature gas and its application in Tuha Basin. Geochemistry 2009, 38, 68–74. [Google Scholar] [CrossRef]
- Liu, G.D.; Zhao, W.Z.; Hu, S.Y.; Zhang, Z.Y. Prediction models of migration and accumulation coefficient for petroleum migration and accumulation unit. Pet. Explor. Dev. 2003, 30, 53–55. [Google Scholar]
- Zhou, H.Y.; Pang, X.Q.; Jiang, Z.X.; Zhou, J. Key factors controlling migration and accumulation efficiency of oil and gas and their quantitative evaluation. Pet. Explor. Dev. 2002, 29, 14–18. [Google Scholar]
- Pang, X.Q.; Jin, Z.J.; Jiang, Z.X.; Zuo, S.J. Evaluation of hydrocarbon resources of superimposed basin and its significance. Pet. Explor. Dev. 2002, 29, 9–13. [Google Scholar]
- Song, Z.X.; Lu, J.L.; Zhou, Z.M.; Wang, B.H.; Yang, H. Research progress and future development of assessment methods for conventional hydrocarbon resources. China Pet. Explor. 2017, 22, 21–31. [Google Scholar]


Publisher’s Note: MDPI stays neutral with regard to jurisdictional claims in published maps and institutional affiliations. |
© 2022 by the authors. Licensee MDPI, Basel, Switzerland. This article is an open access article distributed under the terms and conditions of the Creative Commons Attribution (CC BY) license (https://creativecommons.org/licenses/by/4.0/).