
GHG Emissions by (Petro)Chemical Processes and Decarbonization Priorities—A Review


Abstract
:1. Introduction
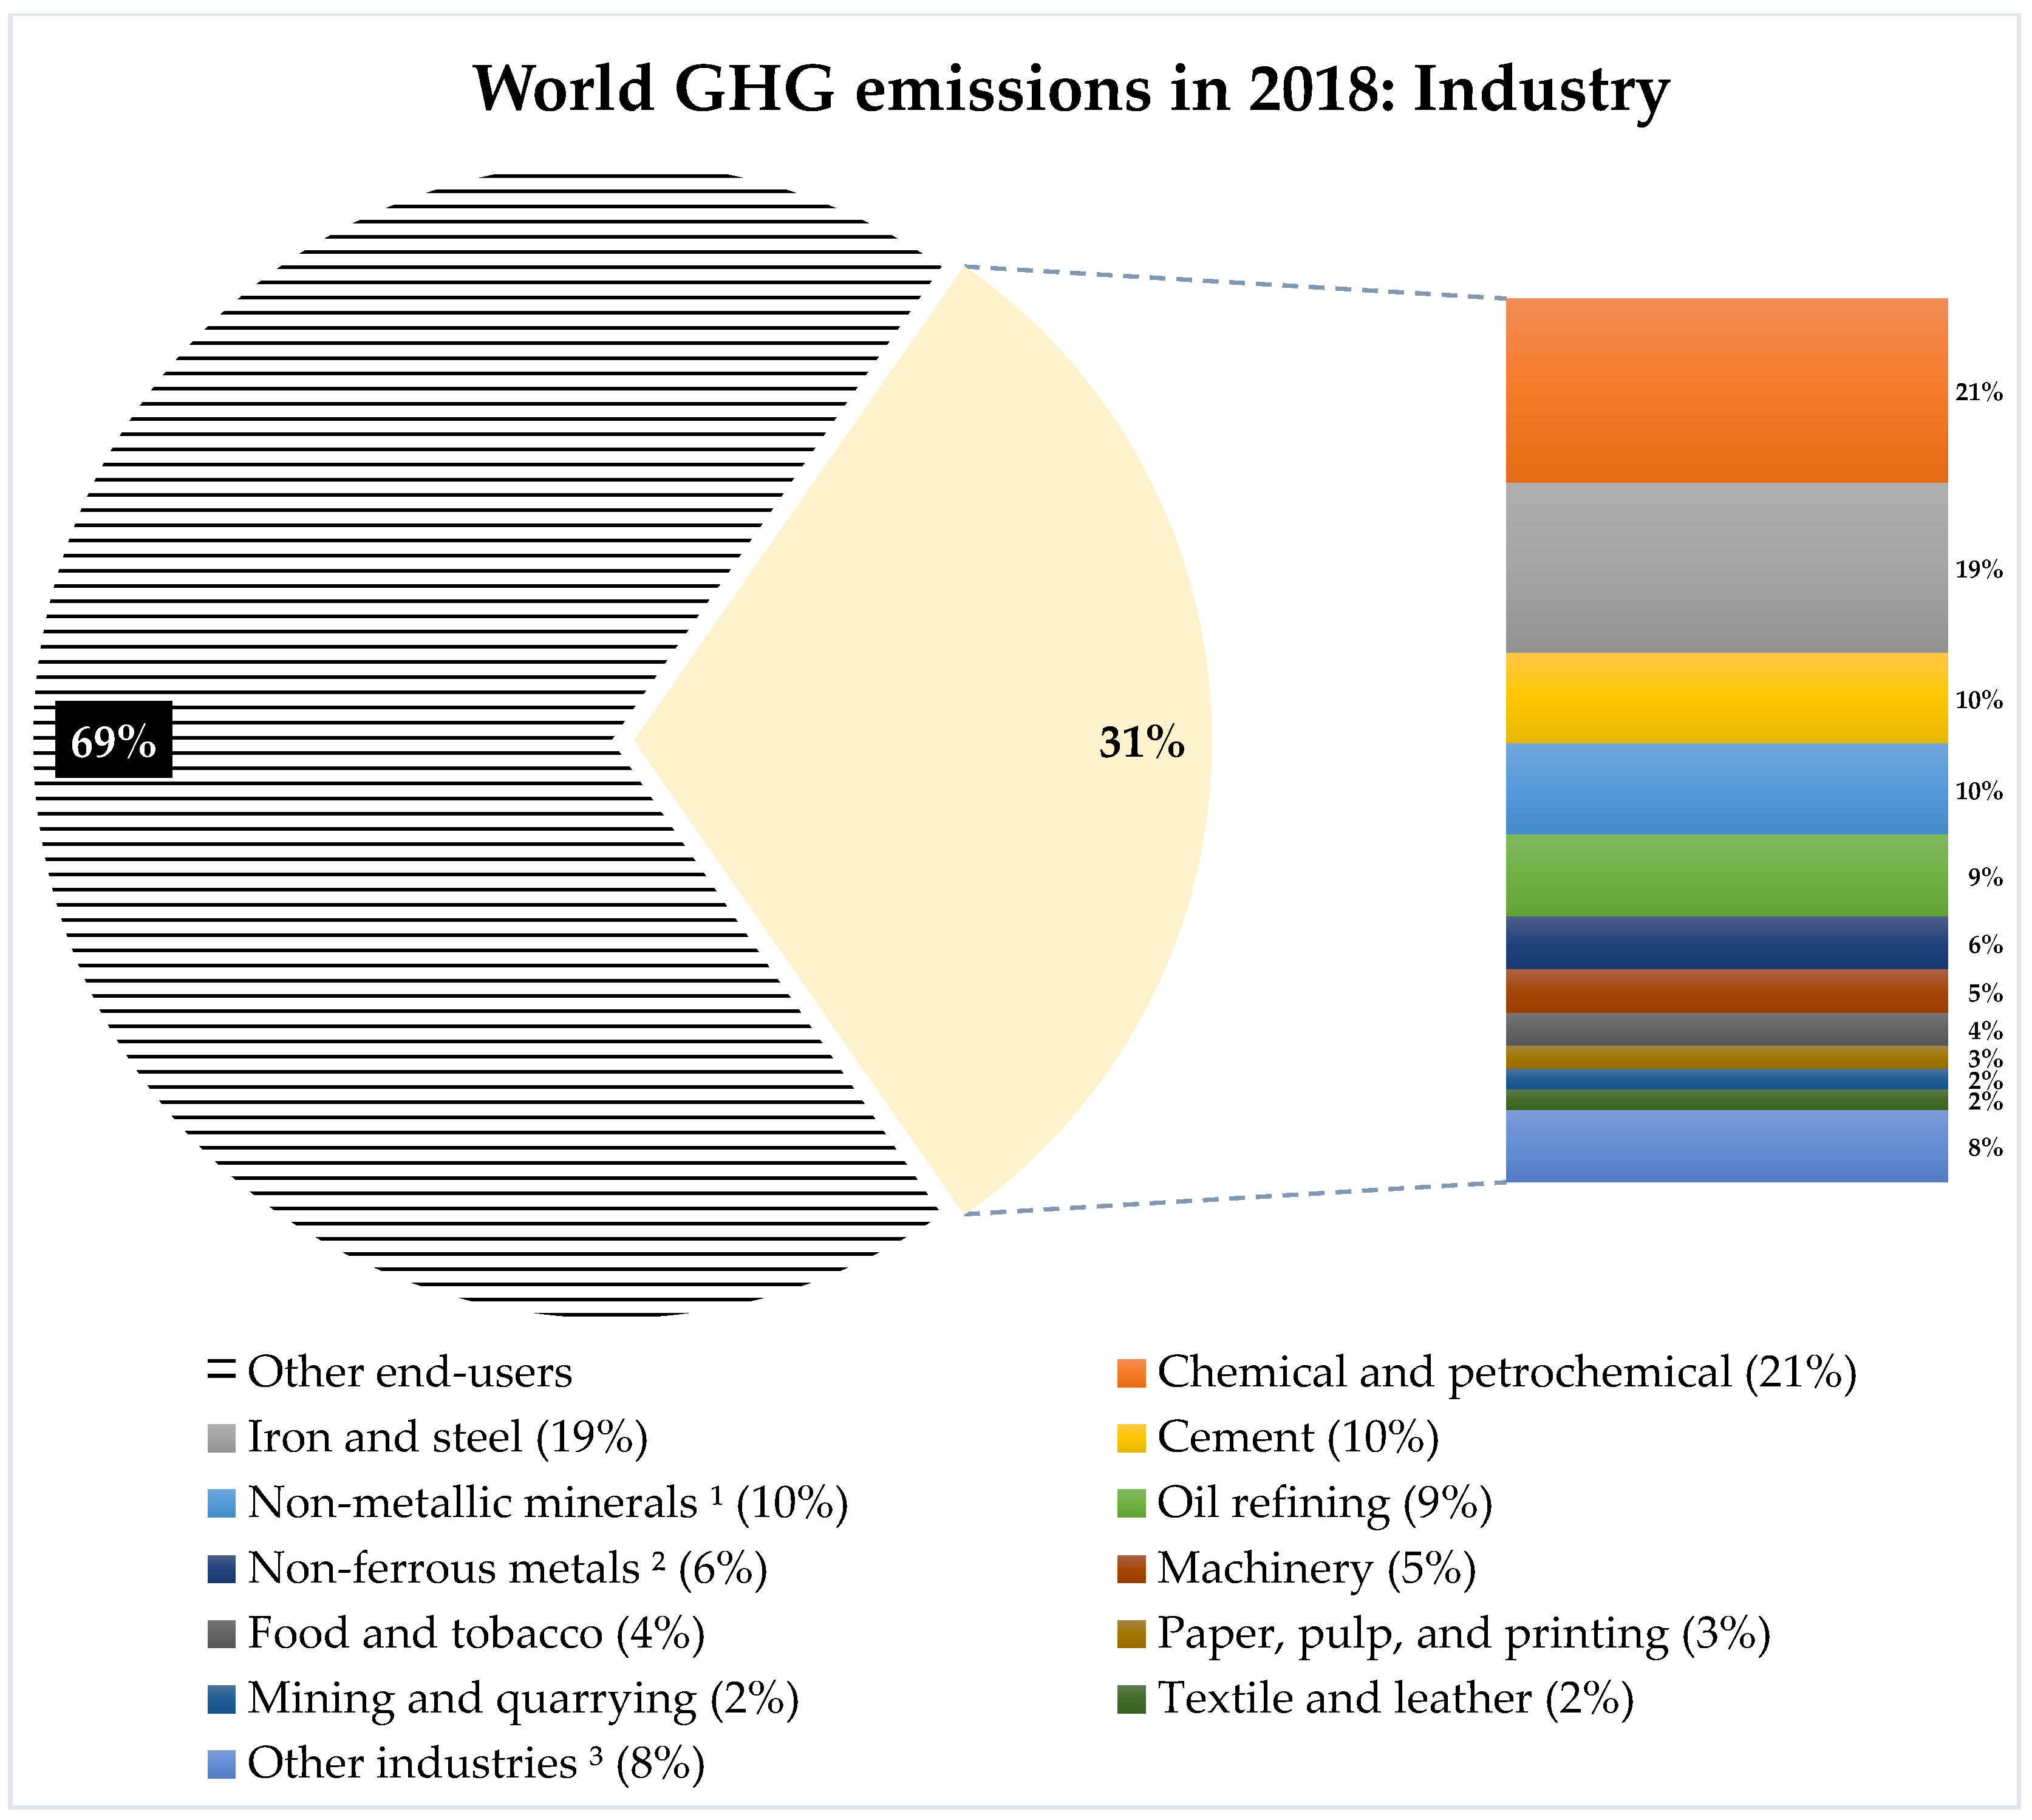
2. Industry
3. Chemicals and Petrochemicals (Plus Oil Refining)


4. Conclusions
Author Contributions
Funding
Data Availability Statement
Acknowledgments
Conflicts of Interest
Nomenclature
| BTEX | benzene, toluene, ethylbenzene, and xylenes |
| CHP | combined heat and power |
| CO2,eq | carbon dioxide equivalent |
| EDC | ethylene dichloride |
| GHG | greenhouse gas (es) |
| HDPE | high-density polyethylene |
| KA | ketone-alcohol |
| LCA | life cycle assessment |
| LDPE | low-density polyethylene |
| LLDPE | linear low-density polyethylene |
| LPG | liquefied petroleum gas |
| M/H | dual pressure plant, at medium and high pressures |
| M/M | single pressure plant, at medium pressure |
| PE | polyethylene |
| PET | polyethylene terephthalate |
| PP | polypropylene |
| PVC | polyvinyl chloride |
| TPA | terephthalic acid |
| VCM | vinyl chloride monomer |
| VGO | vacuum gas oil |
| WRI | World Resources Institute |
References
- European Commission. Paris Agreement. Available online: https://ec.europa.eu/clima/eu-action/international-action-climate-change/climate-negotiations/paris-agreement_en (accessed on 8 June 2022).
- UNFCCC. The Paris Agreement. Available online: https://unfccc.int/process-and-meetings/the-paris-agreement/the-paris-agreement (accessed on 8 June 2022).
- Climate Watch. Historical GHG Emissions. Available online: https://www.climatewatchdata.org/ghg-emissions?breakBy=sector&chartType=area&end_year=2019§ors=total-including-lucf&start_year=1990 (accessed on 8 June 2022).
- Our World in Data. Total Greenhouse Gas Emissions. Available online: https://ourworldindata.org/explorers/co2?facet=none&country=~OWID_WRL&Gas=All+GHGs+%28CO%E2%82%82eq%29&Accounting=Production-based&Fuel=Total&Count=Per+country&Relative+to+world+total=false (accessed on 8 June 2022).
- Rivera, A.; Movalia, S.; Pitt, H.; Larsen, K. Preliminary 2020 Global Greenhouse Gas Emissions Estimates. Available online: https://rhg.com/research/preliminary-2020-global-greenhouse-gas-emissions-estimates/ (accessed on 8 June 2022).
- United Nations. World Population Prospects 2019. Available online: https://population.un.org/wpp/ (accessed on 8 June 2022).
- World Resources Institute (WRI). World Greenhouse Gas Emissions: 2018. Available online: https://www.wri.org/data/world-greenhouse-gas-emissions-2018 (accessed on 9 June 2022).
- Herzog, T.; Pershing, J.; Baumert, K.A. Navigating the Numbers: Greenhouse Gas Data and International Climate Policy; World Resources Institute (WRI): Washington, DC, USA, 2005. [Google Scholar]
- IEA. Electricity Information: Overview. Available online: https://www.iea.org/reports/electricity-information-overview (accessed on 22 June 2022).
- Kern, C.; Jess, A. Reducing Global Greenhouse Gas Emissions to Meet Climate Targets—A Comprehensive Quantification and Reasonable Options. Energies 2021, 14, 5260. [Google Scholar] [CrossRef]
- IPCC. 2006 IPCC Guidelines for National Greenhouse Gas Inventories; IPCC: Geneva, Switzerland, 2006. [Google Scholar]
- Congressional Budget Office. Effects of a Carbon Tax on the Economy and the Environment; Congressional Budget Office: Washington, DC, USA, 2013. [Google Scholar]
- BP. Statistical Review of World Energy; BP: London, UK, 2021. [Google Scholar]
- Jing, L.; El-Houjeiri, H.M.; Monfort, J.-C.; Brandt, A.R.; Masnadi, M.S.; Gordon, D.; Bergerson, J.A. Carbon intensity of global crude oil refining and mitigation potential. Nat. Clim. Chang. 2020, 10, 526–532. [Google Scholar] [CrossRef]
- Beroe. LDPE (Low Density Polyethylene) Market Intelligence. Available online: https://www.beroeinc.com/category-intelligence/ldpe-market/ (accessed on 11 May 2022).
- Beroe. LLDPE (Linear low-density polyethylene) Market Intelligence. Available online: https://www.beroeinc.com/category-intelligence/lldpe-market/ (accessed on 11 May 2022).
- Beroe. Phenol Market Intelligence. Available online: https://www.beroeinc.com/category-intelligence/phenol-market/ (accessed on 11 May 2022).
- BlueWeave Consulting. Global High-Density Polyethylene (HDPE) Market to Boost in Coming Years—Projected to Reach 78.0 Million Tons by 2028 | BlueWeave Consulting. Available online: https://www.globenewswire.com/en/news-release/2022/03/24/2409624/0/en/Global-High-Density-Polyethylene-HDPE-Market-to-Boost-in-Coming-Years-Projected-to-Reach-78-0-Million-Tons-by-2028-BlueWeave-Consulting.html (accessed on 11 May 2022).
- BlueWeave Consulting. Global Polyethylene Terephthalate (PET) Resin Market to Boost in Coming Years—Projected to Reach Worth 114.7 Million Tons in 2028 | BlueWeave Consulting. Available online: https://www.globenewswire.com/en/news-release/2022/04/04/2415938/0/en/Global-Polyethylene-Terephthalate-PET-Resin-Market-to-Boost-in-Coming-Years-Projected-to-Reach-Worth-114-7-Million-Tons-in-2028-BlueWeave-Consulting.html (accessed on 11 May 2022).
- ChemAnalyst. Mono Ethylene Glycol (MEG) Market Analysis: Plant Capacity, Production, Operating Efficiency, Technology, Demand & Supply, Application, Distribution Channel, Regional Demand, 2015–2030. Available online: https://www.chemanalyst.com/industry-report/mono-ethylene-glycol-meg-market-646 (accessed on 24 June 2022).
- ECHEMI. Propylene Oxide: From a Gap of 467,000 Tons to Self-Sufficiency Is Just around the Corner. Available online: https://www.echemi.com/cms/257860.html (accessed on 24 June 2022).
- IFA. Nitrogen Products: Ammonia. Available online: https://www.ifastat.org/supply/Nitrogen%20Products/Ammonia (accessed on 23 June 2022).
- IFA. Nitrogen Products: Urea. Available online: https://www.ifastat.org/supply/Nitrogen%20Products/Urea (accessed on 23 June 2022).
- IFA. Processed Phosphates. Available online: https://www.ifastat.org/supply/Phosphate%20Products/Processed%20Phosphates (accessed on 23 June 2022).
- IHS Markit. Ethylene Market Outlook Considering the Impact of COVID-19. Available online: https://ihsmarkit.com/research-analysis/ethylene-market-outlook-considering-the-impact-of-covid19.html (accessed on 4 May 2022).
- IHS Markit. Chemical Economics Handbook: Ethylbenzene. Available online: https://ihsmarkit.com/products/ethylbenzene-chemical-economics-handbook.html (accessed on 4 May 2022).
- IHS Markit. Chemical Economics Handbook: Vinyl Chloride Monomer (VCM). Available online: https://ihsmarkit.com/products/vinyl-chloride-monomer-chemical-economics-handbook.html (accessed on 4 May 2022).
- IHS Markit. Chemical Economics Handbook: Para-Xylene. Available online: https://ihsmarkit.com/products/paraxylene-chemical-economics-handbook.html (accessed on 4 May 2022).
- Invest Saudi. Nitric Acid (HNO3): Investment Opportunity Scorecard. Available online: https://investsaudi.sa/medias/Nitric-Acid-HNO3-.pdf?context=bWFzdGVyfHBvcnRhbC1tZWRpYXw1MDczNDV8YXBwbGljYXRpb24vcGRmfHBvcnRhbC1tZWRpYS9oMDgvaDllLzg5MDk1OTM5MzU5MDIucGRmfDkxZTlkYmUyYzU1ODMwMjU3NWNkMWY1ZjdhM2I5NDdkNTk1NjE2YTRkYzRmNTkzYjE0NDQxN2IwOWFmNTIzOTI (accessed on 27 May 2022).
- Invest Saudi. Adipic Acid: Investment Opportunity Scorecard. Available online: https://investsaudi.sa/medias/Adipic-Acid.pdf?context=bWFzdGVyfHBvcnRhbC1tZWRpYXwzNjY3MjN8YXBwbGljYXRpb24vcGRmfHBvcnRhbC1tZWRpYS9oNDgvaGZmLzg5MDk1OTI5NTI4NjIucGRmfGMzMjkxMTk1MTNhYzZhNTllZGFmNjA4OWE2OWQyNzczNzkwZjdjYWUyNTI5OWFlZDg4ODEwN2I1ODg3N2Q2YTU (accessed on 27 May 2022).
- Krungsri Research. Petrochemical Industry. Available online: https://www.krungsri.com/bank/getmedia/ab0bcb7e-f3ba-42f5-929f-47ce1ce12bb4/IO_Petrochemicals_190626_EN_EX.aspx (accessed on 24 June 2022).
- Merchant Research and Consulting Ltd. Ethylene Dichloride (EDC): 2022 World Market Outlook and Forecast up to 2031. Available online: https://mcgroup.co.uk/researches/ethylene-dichloride-edc (accessed on 24 June 2022).
- MMSA. MMSA Global Methanol Supply and Demand Balance. Available online: https://www.methanol.org/methanol-price-supply-demand/ (accessed on 24 June 2022).
- Mordor Intelligence. Chlorine Market—Growth, Trends, COVID-19 Impact, And Forecasts (2022–2027). Available online: https://www.mordorintelligence.com/industry-reports/chlorine-market (accessed on 27 May 2022).
- Mordor Intelligence. Cumene Market—Growth, Trends, COVID-19 Impact, And Forecasts (2022–2027). Available online: https://www.mordorintelligence.com/industry-reports/cumene-market (accessed on 27 May 2022).
- NexantECA. Global Styrene Market Snapshot. Available online: https://www.nexanteca.com/blog/202009/global-styrene-market-snapshot (accessed on 24 June 2022).
- ReportLinker. Global Acrylonitrile Industry. Available online: https://www.reportlinker.com/p05817756/Global-Acrylonitrile-Industry.html?utm_source=GNW (accessed on 24 June 2022).
- Statista. Xylene Demand and Production Capacity Worldwide from 2015 to 2022. Available online: https://www.statista.com/statistics/1246700/xylene-demand-capacity-forecast-worldwide/ (accessed on 23 June 2022).
- Statista. Market Volume of Toluene Worldwide from 2015 to 2021, with a Forecast for 2022 to 2029. Available online: https://www.statista.com/statistics/1245224/toluene-market-volume-worldwide (accessed on 23 June 2022).
- Statista. Market Volume of Ethylene Oxide Worldwide from 2015 to 2021, with a Forecast for 2022 to 2029. Available online: https://www.statista.com/statistics/1245260/ethylene-oxide-market-volume-worldwide/ (accessed on 23 June 2022).
- Statista. Propylene Demand and Capacity Worldwide from 2015 to 2022. Available online: https://www.statista.com/statistics/1246689/propylene-demand-capacity-forecast-worldwide/ (accessed on 23 June 2022).
- Statista. Market Volume of Purified Terephthalic Acid Worldwide from 2015 to 2021, with a Forecast for 2022 to 2029. Available online: https://www.statista.com/statistics/1245249/purified-terephthalic-acid-market-volume-worldwide/ (accessed on 23 June 2022).
- Statista. Market Volume of Polypropylene Worldwide from 2015 to 2021, with a Forecast for 2022 to 2029. Available online: https://www.statista.com/statistics/1245169/polypropylene-market-volume-worldwide/ (accessed on 23 June 2022).
- Statista. Market Volume of Soda Ash Worldwide from 2015 to 2021, with a Forecast for 2022 to 2029. Available online: https://www.statista.com/statistics/1245254/soda-ash-market-volume-worldwide/ (accessed on 23 June 2022).
- Statista. Market Volume of Benzene Worldwide from 2015 to 2021, with a Forecast for 2022 to 2029. Available online: https://www.statista.com/statistics/1245172/benzene-market-volume-worldwide/ (accessed on 23 June 2022).
- Klöpffer, W. Life Cycle Assessment in the Mirror of Int J LCA: Past, Present, Future. Int. J. Life Cycle Assess. 2005, 10, 379–380. [Google Scholar] [CrossRef]
- Klöpffer, W.; Grahl, B. Life Cycle Impact Assessment. Life Cycle Assess. (LCA) 2014, 21, 181–328. [Google Scholar] [CrossRef] [Green Version]
- Althaus, H.-J.; Chudacoff, M.; Hischier, R.; Jungbluth, N.; Osses, M.; Primas, A. Life Cycle Inventories of Chemicals. Final Report Ecoinvent Data V2.0 No. 8; Swiss Centre for Life Cycle Inventories: Duebendorf, Switzerland, 2007. [Google Scholar]
- Bach, P.W.; Haije, W.G.; Neelis, M.L.; Patel, M.K. Analysis of Energy Use and Carbon Losses in the Chemical and Refinery Industries; ECN: Petten, The Netherlands, 2005. [Google Scholar]
- Corona, A.; Biddy, M.J.; Vardon, D.R.; Birkved, M.; Hauschild, M.Z.; Beckham, G.T. Life cycle assessment of adipic acid production from lignin. Green Chem. 2018, 20, 3857–3866. [Google Scholar] [CrossRef] [Green Version]
- Euro Chlor. The European Chlor-Alkali Industry: An Electricity Intensive Sector Exposed to Carbon Leakage; Euro Chlor: Brussels, Belgium, 2010. [Google Scholar]
- European Commission; Joint Research Centre; Boulamanti, A.; Moya, J. Energy Efficiency and GHG Emissions: Prospective Scenarios for the Chemical and Petrochemical Industry; Publications Office: Luxembourg, 2017. [Google Scholar] [CrossRef]
- IEA; ICCA; DECHEMA. Technology Roadmap—Energy and GHG Reductions in the Chemical Industry via Catalytic Processes; IEA: Paris, France, 2013. [Google Scholar]
- United States Senate: Committee on Finance. Statement of ANSAC on the U.S.–China Trade Relationship: Finding a New Path Forward; United States Senate Committee on Finance: Washington, DC, USA, 2010. [Google Scholar]
- Bicer, Y.; Dincer, I.; Zamfirescu, C.; Vezina, G.; Raso, F. Comparative life cycle assessment of various ammonia production methods. J. Clean. Prod. 2016, 135, 1379–1395. [Google Scholar] [CrossRef]
- Akah, A.; Al-Ghrami, M. Maximizing propylene production via FCC technology. Appl. Petrochem. Res. 2015, 5, 377–392. [Google Scholar] [CrossRef] [Green Version]
- Allied Market Research. Toluene Market. Available online: https://www.alliedmarketresearch.com/toluene-market (accessed on 29 June 2022).
- Azmi, A.; Aziz, N. Comparison Study of Model Based Industrial Low-Density Polyethylene Production in Tubular Reactor. Chem. Eng. Trans. 2017, 56, 751–756. [Google Scholar] [CrossRef]
- Belis, D.; Marcu, A.; Stoefs, W.; Tuokko, K. Sectoral Case Study—Soda Ash: Climate for Sustainable Growth; CEPS Centre for European Policy Studies: Brussels, Belgium, 2015. [Google Scholar]
- ChemIntel360. Global Benzene Market—Trends, COVID-19 Impact and Growth Forecasts to 2026. Available online: https://www.chemintel360.com/reportdetails/Global-Benzene-Market/24 (accessed on 29 June 2022).
- Fischer, I.; Schmitt, W.F.; Porth, H.-C.; Allsopp, M.W.; Vianello, G. Poly(Vinyl Chloride). In Ullmann’s Encyclopedia of Industrial Chemistry; Wiley: Hoboken, NJ, USA, 2014; pp. 1–30. [Google Scholar] [CrossRef]
- IHS Markit. Ethylene—Global. Available online: https://cdn.ihs.com/www/pdf/Steve-Lewandowski-Big-Changes-Ahead-for-Ethylene-Implications-for-Asia.pdf (accessed on 29 June 2022).
- IRENA; Methanol Institute. Innovation Outlook: Renewable Methanol; IRENA: Abu Dhabi, United Arab Emirates, 2021. [Google Scholar]
- LyondellBasell. Optimized Ziegler-Natta Catalysts for Gas Phase PP Processes; LyondellBasell: Rotterdam, The Netherlands, 2015. [Google Scholar]
- Methanol Institute. Methanol as a Vessel Fuel & Energy Carrier. Available online: https://www.methanol.org/wp-content/uploads/2019/09/Methanol-as-a-vessel-fuel-and-energy-carrier.pdf (accessed on 29 June 2022).
- Nexant. Propylene Oxide; Nexant: San Francisco, CA, USA, 2009. [Google Scholar]
- Syed, F.H.; Vernon, W.D. Status of Low Pressure PE Process Licensing; Chemical Market Resources, Inc.: Katy, TX, USA, 2002; Volume 7, pp. 18–27. [Google Scholar]
- IEA. Tracking Industrial Energy Efficiency and CO2 Emissions; IEA: Paris, France, 2007. [Google Scholar]
- Meessen, J.H. Urea. In Ullmann’s Encyclopedia of Industrial Chemistry; Wiley: Hoboken, NJ, USA, 2010. [Google Scholar] [CrossRef]
- The Royal Society. Ammonia: Zero-Carbon Fertiliser, Fuel and Energy Store; The Royal Society: London, UK, 2020. [Google Scholar]


| Sector | GHG Emissions [Mt-CO2,eq/y] | Mass Share [-] |
|---|---|---|
| Electricity and Heat 1 | 15,875 | 32.2% |
| Transportation | 8418 | 17.1% |
| Manufacturing and Construction 2 | 6223 | 12.6% |
| Agriculture 3 | 5803 | 11.8% |
| Fugitive Emissions 4 | 3354 | 6.8% |
| Buildings 5 | 3106 | 6.3% |
| Industrial Processes | 2967 | 6.0% |
| Waste 6 | 1607 | 3.3% |
| Land-Use Change and Forestry | 1388 | 2.8% |
| Other Fuel Combustion 7 | 627 | 1.3% |
| Total | 49,368 | 100% |
| End-User | GHG Emissions [Mt-CO2,eq/y] | Mass Share [-] |
|---|---|---|
| Industry | 15,163 | 30.7% |
| Buildings | 9325 | 18.9% |
| Transportation | 8617 | 17.5% |
| Agriculture | 6489 | 13.1% |
| Unallocated Fuel Combustion 1 | 3425 | 6.9% |
| Fugitive Emissions | 3354 | 6.8% |
| Waste | 1607 | 3.3% |
| Land-Use Change and Forestry | 1388 | 2.8% |
| Total | 49,368 | 100% |
Publisher’s Note: MDPI stays neutral with regard to jurisdictional claims in published maps and institutional affiliations. |
© 2022 by the authors. Licensee MDPI, Basel, Switzerland. This article is an open access article distributed under the terms and conditions of the Creative Commons Attribution (CC BY) license (https://creativecommons.org/licenses/by/4.0/).
Share and Cite
Isella, A.; Manca, D. GHG Emissions by (Petro)Chemical Processes and Decarbonization Priorities—A Review. Energies 2022, 15, 7560. https://doi.org/10.3390/en15207560
Isella A, Manca D. GHG Emissions by (Petro)Chemical Processes and Decarbonization Priorities—A Review. Energies. 2022; 15(20):7560. https://doi.org/10.3390/en15207560
Chicago/Turabian StyleIsella, Andrea, and Davide Manca. 2022. "GHG Emissions by (Petro)Chemical Processes and Decarbonization Priorities—A Review" Energies 15, no. 20: 7560. https://doi.org/10.3390/en15207560
APA StyleIsella, A., & Manca, D. (2022). GHG Emissions by (Petro)Chemical Processes and Decarbonization Priorities—A Review. Energies, 15(20), 7560. https://doi.org/10.3390/en15207560