
A Novel Model for Wind Turbines on Trains †

1
FedEx Services, Collierville, TN 38017, USA
2
Department of EECE, The University of Memphis, Memphis, TN 38152, USA
*
Author to whom correspondence should be addressed.
†
This paper is an extended version of our conference paper published in the Proceedings of the IEEE PES Innovative Smart Grid Technologies Conference, Paper ID: 2019ISGT0216, Washington, DC, USA, 17–20 February 2019.
Energies 2022, 15(20), 7629; https://doi.org/10.3390/en15207629
Submission received: 2 September 2022
/
Revised: 24 September 2022
/
Accepted: 30 September 2022
/
Published: 15 October 2022
(This article belongs to the Special Issue Cost-Effective and Intelligent Controller Based Design for Wind and Photovoltaic Power Generation Systems)
Abstract
:Wind turbines that are consistently exposed to the air displaced by moving trains have a high potential for energy generation. Researchers have developed mathematical models to simulate wind energy generation from turbines on moving trains but there are significant gaps in the developed model theory. Most models do not consider the negative effects that additional aerodynamic drag, increased weight, and modified dimensions can have on the train’s operation. To overcome the drawbacks of existing models, this work proposes a novel approach of modeling the wind turbines on trains by considering wind turbine exposure only when the train is decelerating or stationary. There are no models that consider all of these realistic physical effects as a function of time. Real-time analysis and power-system simulations showed that the proposed model could produce over 3 MJ of net energy for favorable train trips. The simulated load profile met the demand of a 1 KW generator connected to onboard electrical components. Some recommendations on possible future research on wind turbines on trains are explained.
1. Introduction
The transportation industry is one of the largest consumers of energy in the United States, second only to electric power generation. Still, approximately 80% of the energy used for transportation is wasted [1] due to the heavy reliance on petroleum products. With further examination of the physical effects manifested by the transportation industry, more scenarios that constitute energy waste can be observed. One such physical effect is the forced dispersion of air caused by moving vehicles, and in particular trains.
Studies have shown that trains at high velocity produce large wind drafts of increased air velocity [2,3]. The forced air velocity in these environments far exceeds the natural air velocity. Trains also operate at relatively fixed speeds so that high air velocity input can be maintained for longer periods of time as compared to the naturally fluctuating air velocity in ambient conditions. Wind turbines mounted on trains would be exposed to consistent high-velocity wind speeds and thus capable of a higher electrical output. Trains are large, robust vehicles that are built to transport large masses so the additional weight of the wind turbine apparatus can be easily accommodated. These inherent characteristics make train systems suitable candidates for the integration of vehicle-based wind energy generation systems.
The patented approach to harnessing wind energy from a turbine attached to a moving vehicle is very similar to that of a stationary turbine [4,5]. The turbines are used to convert the wind energy to mechanical energy and then a generation device is used to convert that mechanical energy to electric energy. The major difference between the moving and stationary turbines is in the way that the air is captured and routed to the blades. In a stationary system, the turbines typically require some yaw and pitch mechanisms to adjust for varying wind speed and direction. In the case of the moving vehicle turbine system, the turbines are assumed to be constantly facing the principal direction of airflow. Since there is no need to adjust the blades to find the optimum angle of attack, there is an inherent mechanical advantage.
After the generation device converts the mechanical energy to electric energy, that energy can then be stored, supplied to the train’s electrical system, or supplied to a grid point once the train is stationary. Using the patented model as a baseline, much research has been aimed at designing wind turbine models that maximize the output potential of the system [6,7,8,9,10,11]. However, there are significant limitations associated with the models developed in that research. A preliminary study on improved modeling of wind turbine on trains was conducted and reported in [12]. As a continuation, this work aimed to develop a more inclusive model of the phenomenon that included the inherent drawbacks of the system as well as some potential solutions. The novelty of this work and the gaps in the current knowledge that have been filled; i.e., the improvement in modeling presented in this work, was centered around the following principles:
- The power generated by the wind turbines must be calculated as a function of time for each second of wind turbine exposure and be subject to real-time analysis. The power () carried by the wind of density (), which moves at a velocity () in relation to the surface area () covered by the wind turbine blades, is:
- Attaching wind turbines to the exterior of trains negatively alters the train’s aerodynamics. The increased surface area will cause increased drag on the train. The train will be continuously slowed and its performance will be degraded.
- To operate at normal speeds with an attached wind turbine, a train would have to consume more energy to overcome the drag. While the train is decelerating, however, the additional drag serves as a merit to the train’s stoppage.
- There is potential to generate energy when the train has come to a complete stop because there may be residual turbine rotation [13]. If the ambient wind speeds meet the operational speed required by the turbines, then energy can be generated for the duration of the stop.
The combination of the aforementioned principles was critical to adding a degree of accuracy and novelty to this model that was not present in any previous research. Furthermore, in this work, extensive simulations were performed to explore the influence of wind turbines in terms of air drag on a moving train and to estimate the power-generation capabilities of a permanent magnet synchronous generator (PMSG)-based wind turbine system. The performance of the proposed new turbine model was compared with that of an existing model.
1.1. Literature Review
India has emerged as a prominent case study for the integration of wind turbines in train systems. There are over 12,000 trains running daily [14] in India; information about each train is readily available from online sources, including the Indian Rail Info dataset [15]. The large sample size of train trips with varying numbers of stops, stop lengths, and average speeds present a rich dataset for simulating electrical energy generation using trains. The work in [16] aimed to produce electricity by utilizing the opposing wind forces created by the motion of the train. The mechanism of the wind turbine model was simulated using MATLAB Simulink. The study in [17] dealt with energy generation to harness power from wind energy caused by high-speed locomotives using the Savonius type of vertical-axis wind turbine system. Computational studies were carried out using ANSYS in a wind speed range of 2.0–6.0 m/s. The wind turbine experimental setup was fabricated based on numerical results and experiments were conducted. The results revealed that a single high-torque, low-speed turbine could generate 4–21 W. The research in [18] presented a way to generate electrical energy by utilizing a strong wind pressure from light rail trains that channeled the induced wind toward the turbine. The main aim was to establish a method and system for producing energy utilizing winds that could be conveniently available in the operation of trains. Vertical-axis wind turbines were selected due to their advantages in the application under consideration. SOLIDWORKS and MATLAB simulation software were used for the design of the Train Roof-Top Wind Energy Conversion System (TRT-WECS). A mathematical model comprising mechanical and electric components was developed by using MATLAB. Finally, the study determined that this special TRT-WECS design installed in each train provided an annual energy output of 4.9 MWh.
Similarly, there is a large variation in the setups of the wind turbine apparatus modeled in current research. For example, horizontal-axis wind turbines (HAWTs) can be attached to the train itself to harness power [19,20]. On the other hand, simulations have shown that vertical-axis wind turbines (VAWTs) can be set up to achieve a similar effect [21,22].
In some cases, models have been developed to incorporate as many as 27 wind turbines on the roof of each train cart [19]. While the high number of turbines indicates a high amount of energy output, it is important to note that each added turbine has the potential to increase the total drag on the train. Additionally, the placement of the turbines becomes a challenge because they must be at some minimum distance away from each other to prevent the distortion of airflow to the turbines that follow.
Mounted turbines are also subject to significant amounts of air pressure, which can cause damage. Attempts have been made to reduce the air pressure affecting the turbines by installing a ventilated casing around them [23]. In this case, the turbine was mounted to the roof of the train, where it received maximum exposure to the air pressure. The casing, which involved a valve to control the wind flow, was supplemented with mechanical reinforcements to deter wind damage. The generated electricity was supplied to the various loads attached to the train’s cabin and the rated power output was determined to be 1.5 kW. While this showed clear signs of promise, it is important to note that the addition of the mounted apparatus as described would prevent the train from being able to enter narrow tunnels, which would be a significant and unwanted hindrance for normal operation of the train.
One way to facilitate the train and mounted turbines passing through narrow tunnels is to allow the turbines to move in and out of the train body. Ultrasonic sensors can be used to detect oncoming objects such as passing trains or tunnel walls and prompt the turbines to retract into the train body to avoid collisions [24]. It was also proposed that cone-shaped metals should be placed in front of the turbines to nullify the air pressure on the turbine itself. Figure 1 shows the expected airflow around the turbines with the inclusion of the cone-shaped metals. It was later stated that the inclusion of the cone-shaped metals prevented the turbines from affecting the speed of the train, but there were some flaws associated with that assumption.
No consideration was given to the drag that would be incurred along the surface of the cones. Even if the cones are assumed to have a low drag coefficient, there would still be some magnitude of additional drag, which would ultimately affect the speed of the train. Even if it was assumed that the airflow was exactly as depicted in Figure 1, there would still be drag incurred along the surface of the turbine blades. The cones would only serve to reduce air pressure on the nacelle of the wind turbine.
Lastly, no consideration was given to the adjustments to the train that would be required to allow the turbines to retract completely into its body. If each train cart was assumed to be able to fit turbines on either side when they were fully retracted, then the space on the inside of the train would be very limited. It was also suggested that servomotors could be used to control the retraction, but there was also no consideration given to the energy it would take to power those motors.
Another attempt to minimize the effects associated with placing the turbines on the outside of the train was made via the use of channeling columns. These columns could be truncated cone- or pyramid-shaped housings that converge toward the blades of the wind turbine [14]. The wind turbines themselves would be located within the body of the train to eliminate exposure. The disadvantage of this system was that the internal contents of the train cart would be primarily occupied by the wind turbine apparatus. That would decrease the room available for passengers and other cargo. Housing a wind turbine that is a high-speed rotational device inside close quarters could also present a safety hazard. Only one wind-energy-harnessing model has been developed and aimed specifically at counteracting the effect of additional drag force on the train. The model, which was developed by Joshi et al. [25], attempted to limit the amount to which the aerodynamic change affected normal operation by only exposing the turbine to wind pressure during deceleration of the train. Instead of a generic wind turbine, a Savonius wind turbine was proposed for the simulation of this mathematical model. The Savonius wind turbine was utilized because the curved turbine blades experience less drag when moving against the principal direction of airflow [26] and the small blade size easily meets the clearance criteria for objects on the top of the train [27]. Furthermore, the works [28,29,30,31,32,33] applied the Savonius type of wind turbine to harvest wind energy from trains moving in tunnels.
It should be noted here that the minimum clearance requirements for overhead structures ranges from 2.5–11 m based on railway construction. This range implies that there are trains for which the additional vertical height of 0.5 m for the turbine will still meet the criteria. Therefore, placing reasonably sized wind turbines on trains will not be an issue and the train station may not require a redesign. The wind turbine apparatus also consists of a split symmetrical airfoil that is meant to minimize the added drag on the train due to the presence of the wind turbine. Figure 2 shows a simplified diagram of the proposed airfoil mechanisms in relation to the Savonius wind turbine.
By opening or closing the airfoil flaps, the mechanism can either divert wind away from the turbine blades or direct it toward the turbine blades. The decision to divert or direct the wind pressure will depend on the train’s mode of operation; while the airfoil flaps are closed, the wind energy generation system will be offline. When the train begins to accelerate or move at constant speed, the airfoil flaps will be closed to divert the air around the turbine apparatus. Once the train starts to decelerate or it becomes stationary, the flaps will open to channel wind pressure to the turbine.
The decrease in speed is of concern during normal operation but is less critical during the deceleration of the train. In other words, the increase in surface area should cause the train to slow down at a faster rate, and this phenomenon will positively influence the braking process. While the inclusion of the airfoil mechanism and its method of operation provide a theoretical solution to the long-standing issues surrounding the drag force, more testing must be done to validate the concept.
The split symmetrical airfoil is based on the National Advisory Committee for Aeronautics (NACA) 0015 airfoil, which has been proven to have a drag coefficient as low as 0.01 [34]. It was noted that splitting the NACA 0015 airfoil and removing the tip to acquire the geometry shown in Figure 2 made it more appropriate to refer to the structure as an air deflector. The air deflector was assumed to have a drag coefficient of no more than 0.05 in [25], so that value was used in the mathematical model simulation. After making the assumptions about the drag force, a cumulative approach was used to simulate the generation of wind power. The net energy generated by the train was calculated per trip based on the number of stops, train carts, and the degree of the drag forces acting on the system:
The objective of this approach was to first approximate the total energy available from constant wind pressure for the trip duration and then subtract the energy lost due to: carrying the additional weight of the turbine apparatus , drag forces , and mechanism operation . That output was then multiplied by the number of turbines mounted on the train and the number of stops the train made during the journey . These terms are discussed in more detail in the mathematical model. The model provided a good platform to approximate the energy output, but there is room for improvement because there are methods that could be used to increase the accuracy of the simulations. There is also an additional area of potential energy gain that was not considered.
1.2. Hypothesis
Mathematical models that focus primarily on maximizing the energy output from wind turbines on trains will omit critical physical constraints. To increase the accuracy of the model as compared to the real phenomenon, parameters such as the location-specific wind speeds, train velocity, apparatus dimensions, turbine weight, and aerodynamic drag must be included. Furthermore, the energy equations must be modeled as functions of time to properly assess the electrical power quality of the system. Decisions on whether to use battery storage, power onboard loads, or transfer energy to grid connected systems are directly dependent on the output load profile. If the constrained mathematical model shows a positive net energy generation, then the energy profile should be used to model a wind turbine in the power simulation. If the power simulation produces load profiles that can meet the demand of an electrical system, then it further justifies the need for physical experimentation. Since the adverse effects of the additional drag force are more detrimental to the existing models, the net energy produced from the proposed model may not always be positive, but it will almost always be more than the net energy produced by the existing models.
2. Materials and Methods
A targeted set of software tools was used to create and simulate a realistic model for wind energy generation from moving trains. A baseline for the wind turbine setup was selected based on the prominent features from the literature review. Computational fluid dynamic simulations were conducted to validate the actual efficiency of the system. A mathematical model was created to model the energy loss and energy gain as a function of time throughout a train trip. A program was developed to replicated the calculations from the mathematical model. Favorable and unfavorable train trips were selected from the information available from the Indian Rail Info dataset [15] and simulated using the program. The resulting energy generation data points were then exported to power-simulation software and used as input to an electrical system.
2.1. Drag Force Simulation
The approach outlined by Joshi et al. [25] serves as a good method that considers realistic phenomenon and repeatable simulations. However, the approach is very reliant on the assumptions made regarding the drag coefficient of the air deflector placed in front of the wind turbine. Before finalizing the approach as a baseline existing model, the assumed drag coefficient of 0.05 after the alterations to the NACA 0015 Airfoil had to be validated. To verify this claim, COMSOL simulation software was used to recreate the desired geometry in Figure 2. The geometry was placed in a velocity magnitude simulation with a circular geometry to map the area swept by the Savonius wind turbine. Figure 3 shows the simulation at 0.1 s. The resulting arrow surface indicated that the velocity vectors traveled over the surface of the air deflector and those vectors converged at a specific distance behind the air deflector. It should be noted that the Savonius wind turbine blades were well within the low-wind-velocity region following the air deflector and the velocity vectors did not converge until after the turbine blades.
Using the velocity magnitude plot, the drag force along the surface of the air deflector was calculated using built-in COMSOL functions. We verified that the highest value for the drag coefficient for the surface was on the order of 0.05, so the assumption made in [25] held.
2.2. Mathematical Model
The goal of this novel mathematical model was to simulate the amount of energy generated per turbine at each point in time and to model the wind turbine’s characteristics based on real wind-speed data. The developed model only included one turbine per train cart. This method allowed for the real-time analysis of varying characteristics such as wind speed and drag forces on the system. The model proposed in this work included a top mounted, low-drag-coefficient airfoil to direct/divert air pressure to/from the wind turbine depending on the mode of operation of the train. Train stops of varying lengths were scheduled at various locations along the train’s route. The location of each stop was partially randomized such that there were varying distances between each train stop. Since the simulation considered every second over the entire journey including stoppages, it was an ideal approach for identification of peak and off-peak points for energy generation. The modifications made to the components of that model [24] based on the mentioned goals were as follows:
E(t) is the energy that can be produced from the wind at a point in time (), which is given by the power () carried by the wind from Equation (1) and the operational efficiency of the wind turbine:
where η is the efficiency of the wind turbine, which must be less than 59% as stipulated by the Betz correlation of maximum efficiency [35]. For the purposes of this study, the efficiency of the Savonius wind turbine was assumed to be 25%.
E1(t) is the energy required to carry extra weight of the wind turbine apparatus (20 kg). E1(t) will serve as a source of energy loss because the train will require more energy to carry the turbines, as expected. The energy taken to accelerate and decelerate the additional weight (m) is taken to be equivalent and thus is the energy taken to change the velocity (v) of the weight:
E2(t) is the energy required to overcome drag force added by the surface area of the wind turbine apparatus. The energy that will be required to overcome that drag force based on the air deflector drag coefficient () is:
E3(t) is energy required to actuate the air deflector and open or close the airfoil flaps. The value was taken to be 500 J. For the purposes of this simulation, the energy contribution () was active upon every acceleration and deceleration of the train.
E4(t) is the additional energy that can be gained while the train is stationary. This energy can be modeled similarly to the total energy that can be produced using Equation (4) where the wind speed () is the minimum wind speed for the geographical area. The wind speed measurements were taken from live wind speed surveys [36]. During normal train motion, the wind speed was taken as the equivalent of the train’s velocity. During deceleration, the wind speed was taken as the equivalent of the train’s velocity up until the point where the train’s velocity was less than the minimum wind speed for the geographical area. The wind speed was then held constant at the ambient wind speed for the stop duration.
In a realistic scenario, the direction of the airflow in a geographical area may not always be facing the turbine. However, constant input to the wind turbines for the stop duration was applied because the turbines could be assumed to rotate with at least 50% of the wind speed input from when the train was moving. This assumption should be valid for short periods of time [13]; since the duration of each stop was taken to be two minutes, it held.
Enet(t) is the net energy produced at a point in time () on the trip. This is the sum of all the energy lost and gained due to all the components mentioned thus far:
where is the number of turbines on the train body. It is noteworthy that the improved mathematical model, which stipulated the active periods for each of train’s energy components, could also be modeled by a piecewise function of time relative to the train’s motion:
and were active during the acceleration and deceleration of the train. is the maximum possible energy that can produced during deceleration without considering the loss factors. was active for the entirety of the simulation of the trip and was active when the train stopped at any point during the trip.
Equation (7) is directly related to the physical phenomenon of the train’s motion and the design of the wind turbine apparatus. The energy required to move the extra weight of the apparatus (E1) was considered in the acceleration and deceleration. The energy required to overcome the additional drag force on the train while the airfoil was closed (E2) was considered in the acceleration and at constant speed. The energy required to open the airfoil (E3) was considered at the moment of deceleration. The energy generated once the airfoil was opened and allowed airflow to the wind turbine (E) was considered in the deceleration. The energy gained while the airfoil was opened and the train was stopped (E4) was also considered.
The piecewise function from Equation (7) was modeled using JAVA code that consisted of nested loops, arrays for each energy component (E, E1–4, and Enet), and a sequence of calculations for each second of the train trip. Due to the variability in the train trip parameters; there was a very wide range of potential net output values. The higher the number of stops and turbines on the train schedule, the higher the net energy generated.
2.3. Dataset Sample
Table 1 shows a sample of the Indian Rail Info Dataset, which was used to test the mathematical model. The dataset contains information about each train including the total travel time, number of stops, average velocity, and number of carts. The train trip information was vital for calculating the energy components from the mathematical model. The actual data consisted of over 20 routine train trips, but only a select few were included in the table for analysis. Wind speed data that corresponded with the geographical locations of the train routes were also incorporated into the dataset.
2.4. Power Simulation
To explore the case of directly supplying output to the train’s electrical system, an approximation of the power consumption of each train cart was required. For this work, the target was for each generator to be able to power two 120 V/32 W tube lights and the three 120 V/65 W fans on the train cart. This comprised a total load of 259 W that had to be met at all times during the train’s operation. There was also potential to provide additional power for outlets or charging stations if the generator was able to consistently supply above that load demand.
The generators were assumed to be offline during the acceleration and constant speed portions of the train trip because the system would only attempt to generate energy during the deceleration and stopped stages. Therefore, the simulation only needed to be considered from the time the train began to stop through the moment it stopped.
While most wind energy generation systems use a wind turbine and induction generator, the generator selected for this simulation was a permanent magnet synchronous generator (PMSG). The induction generator is more commonly used due to its simplistic design, but it will usually need to draw reactive power from the grid for excitation. With the PMSG, that excitation comes from the shaft-mounted permanent magnets. This operation is ideal for a train-mounted turbine system because there is no requirement to connect to the grid for excitation.
The use of permanent magnets also makes the PMSG one of the most efficient types of generators because it consumes no extra electrical power to complement its small, light, and rugged structure. Subsequently, a variable-speed wind turbine was connected to a three-phase, 1 KW, 165 V, 50 Hz, 3000 rpm salient pole PMSG according to the specifications given in [37,38]. Resistive loads were also connected to the generator terminal in order to simulate the demand from the lights and fans on the train cart.
2.5. Improved Modeling Process
Figure 4 shows a flow chart of the improved modeling process, which included the verification of assumptions made in [25] as well as the incorporation of current wind speed data and power system integration. It is important to note here that the simulation process followed a structured outline with various databases for the verification of parameters and therefore was an effective way to produce simulations on a large scale. Various geometries can be created and tested in COMSOL for low drag coefficients, which could be directly supplied in the modeling Equation (6). The data from the Indian Rail Info dataset could be used to specify trip details for any train and then the wind speed profile could be directly supplied in MATLAB for a detailed breakdown of the electricity generation process. The final step, which provided a greater accuracy, is a more widely accepted electrical engineering practice than simply approximating the energy that can be generated.
In summary, the simulation process consisted of the following:
- Verification of the drag coefficient assumptions made about the airfoil and wind turbine using CFD software (COMSOL).
- Incorporation of real wind speed data for the geographical area of the case study.
- Incorporation of real train dimensions, speeds, stop durations, stop frequencies, and travel distance.
- Programmatic mathematical modeling of the energy output over time.
- MATLAB simulation of the energy output connected to a real power system to assess power quality.
3. Results and Discussion
The results of the proposed mathematical model are presented in the form of a direct comparison of net output as compared the existing model as well as a breakdown of all the energy components. The power simulation results are presented as an RMS graph of the power output from the electrical system that the mathematical model simulated.
3.1. Mathematical Model Results
Table 2 shows some net output calculations for the existing and proposed models. The most significant detail in this set of results was that the net output for the existing model was almost always negative, except in the case of the train that originated in Gaya.
Table 3 shows a breakdown of the energy components for four train trips, including two that were simulated in [25]. These trains were selected for direct comparison using the proposed model.
Note that in all cases, the energy gained while the train was stopped (E4) was higher than the energy lost by carrying the additional weight of the turbine apparatus (E1). The new model thereby created an opportunity to reduce the major loss factors to adjust the drag force and air deflector actuation.
Another interesting detail was that the train that originated from Delhi traveled at a relatively low speed with a high number of stops over a short period of time. As such, the system was able to produce a net positive output even though it had half the number of turbines of any other train. Based on the assumptions made thus far and the results of the simulation, it was clear that some trains were inherently more suitable for this energy generation system while others were not.
3.2. Power Simulation Results
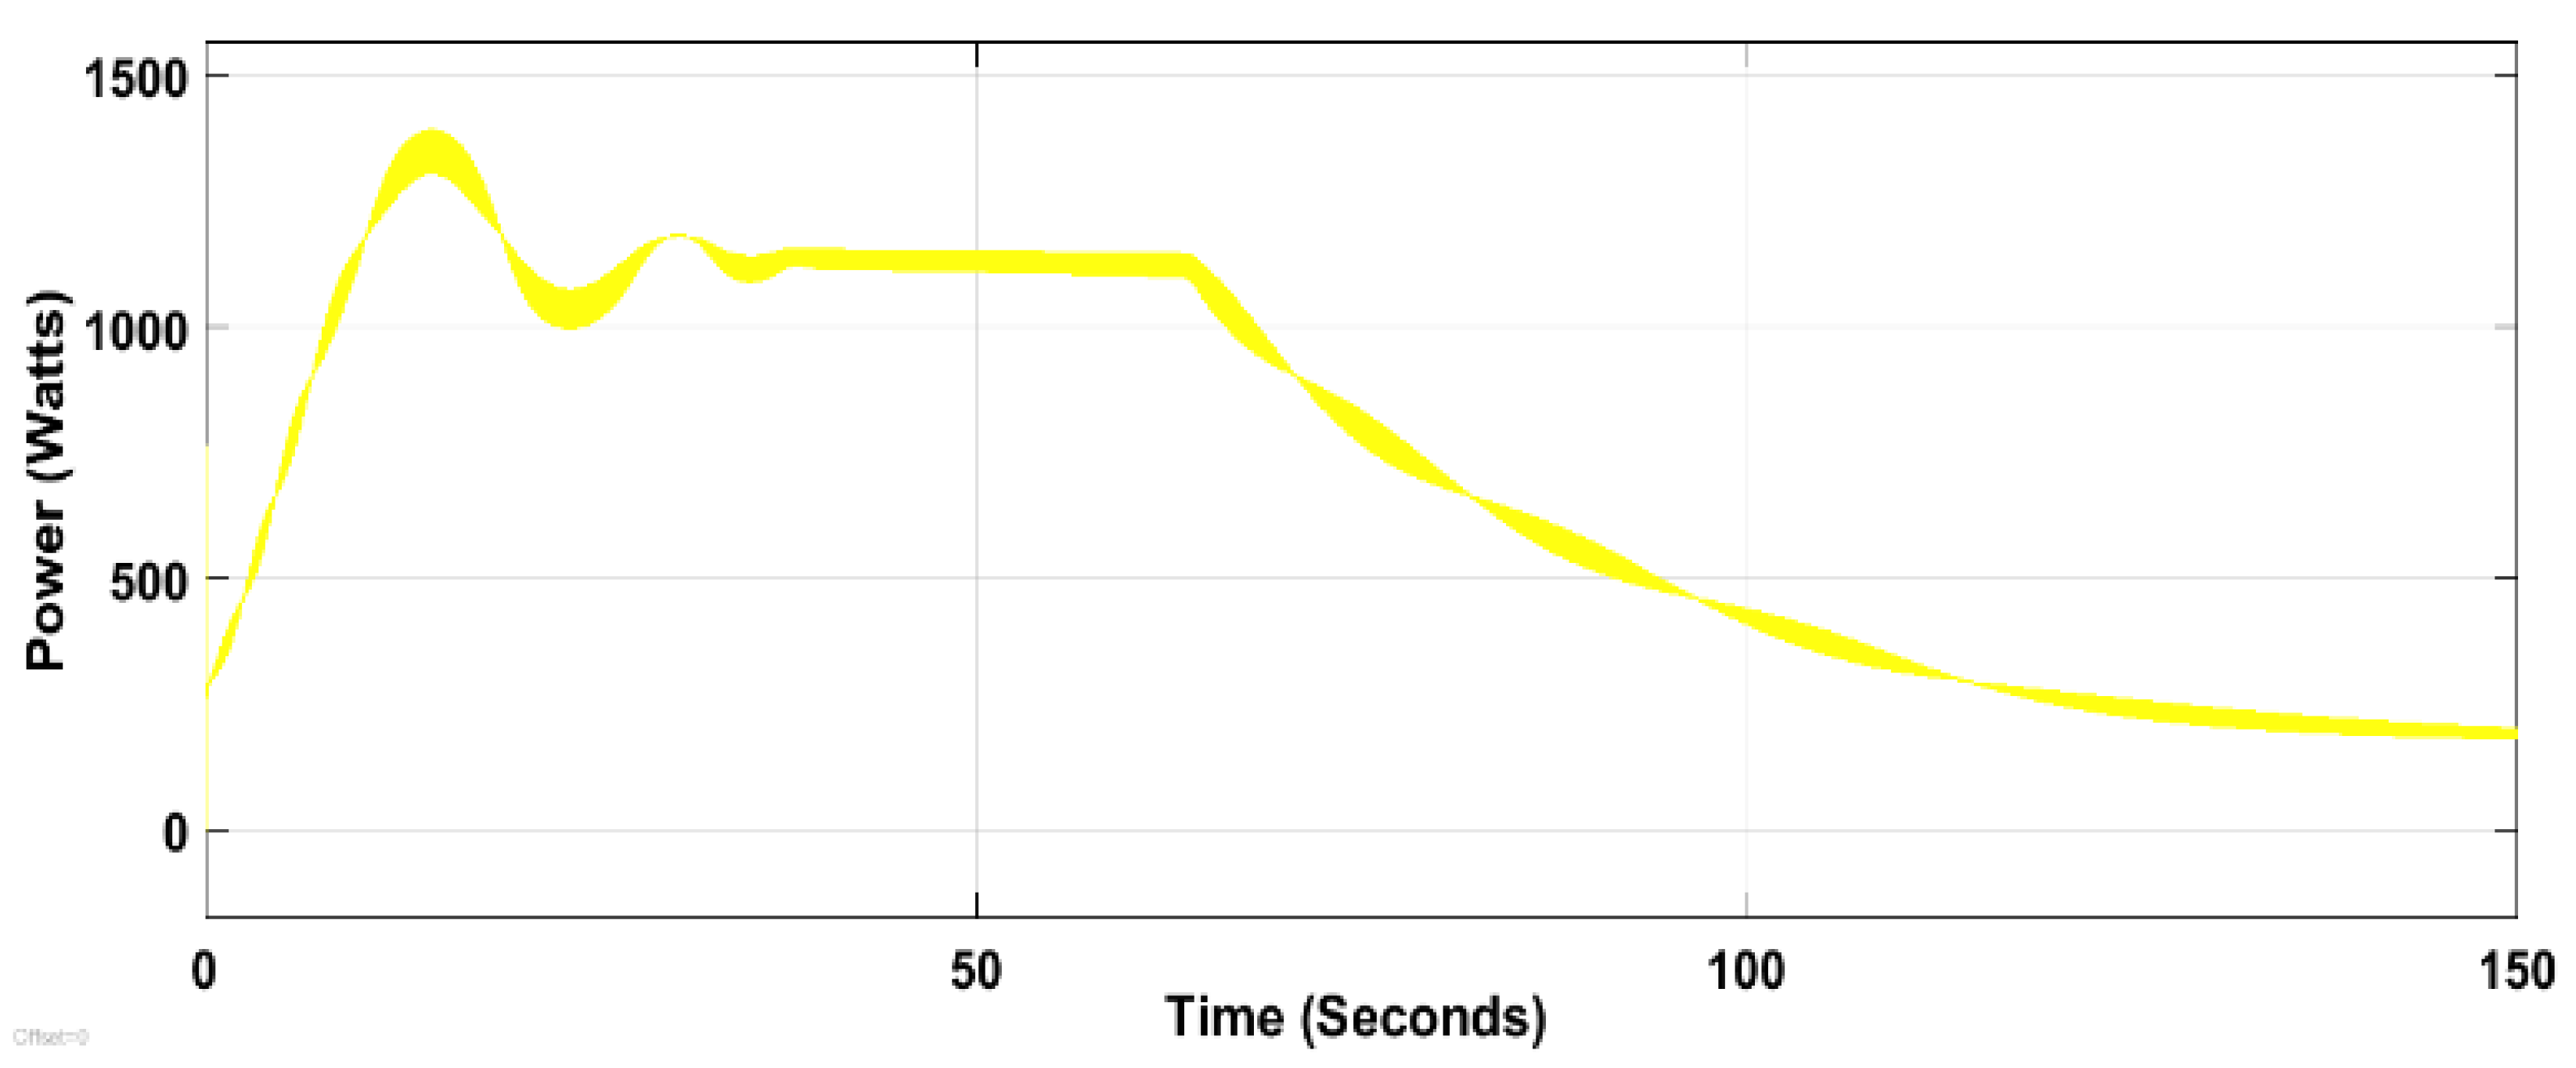
Figure 5 shows the RMS value of the three-phase power output profile for the 1 KW PMSG for the deceleration where the average speed before the stop was 12 m/s and the final speed is 4 m/s, which was the ambient wind speed for the geographical area. The output consistently met the target of a 259 W load demand. We also noted that the generator output was overrated (over 1000 W) for the initial stage of the deceleration because the wind-speed input exceeded the rated wind-speed value for the wind turbine.
During the time the train took to decelerate from 12 m/s to 7 m/s, the generator was overrated. There was a short period of time at about 40 s during which the wind-speed input approached the base wind speed, so it was able to hold the rated value. Once the wind speed fell below the base value at 60 s, the power output became far less than the rated value. The behavior of the power curve became asymptotic toward the end of the simulation after 100 s. That asymptotic trait was a welcome inclusion for the power output profile because it ensured that the output remained above the load demand of 259 W.
3.3. Discussion
With reference to the results of the mathematical model, there were a number of cases in which the net output of the mathematical output was negative. It was discussed in [25] that this is to be expected depending on the specific details of the train trip. For example, trips with long distances to cover and minimal stops will often result in a negative net output. The most extreme case of a negative net output resulted when considering the New Delhi train line. Table 1 shows that this particular train traveled at more than twice the speed of most other trains but only had six stops from which energy could be gained. Secondly, the trip duration was over a period of 15 h and 50 min and constant exposure to winds moving at 24.3 m/s to the air deflector resulted in a high demand for energy to overcome drag. This was consistent with the hypothesis because the existing model was subject to a more negative impact from constant exposure to high wind speeds.
As a countermeasure to the high drag force that could be introduced for each additional turbine, the simulations only considered one turbine per cart. That tactic minimized the magnitude of the energy losses E1–3. Another reason for considering only one turbine per cart was to reduce dependency on the organization of the turbines to prevent distortion of the airflow vectors [19].
When the proposed model was considered, the energy generated during the train’s deceleration and stationary stages was almost always greater than energy lost in the acceleration and constant speed stages. Thus, the net energy produced by the simulation was positive. In most cases, the net output was on the order of thousands of kilojoules.
The results of the power simulation showcased the degree of fluctuating output produced by this system and that there was a clear indication of a need for energy storage. While the output consistently met the demand during the deceleration stage, there was a significant amount of surplus power for the first 100 s. That excess power could be supplied to an energy-storage device and then extracted during the last 50 s when the supply just barely met the demand of the train cart load. Energy storage could be used to smooth the output power of the train cart so that an uninterrupted power supply could be maintained.
The asymptotic behavior in the last 50 s of the simulation can be attributed to the principles in the hypothesis. Once the train speed fell below the ambient wind speed, the program held the wind speed at the ambient wind speed. In this case, after 100 s the wind speed was held constant at 4 m/s. Since the base wind speed, which controlled the efficiency of the turbine, was set to 7 m/s, the efficiency degraded while the ambient wind speed was held. Nevertheless, there was still some degree of efficiency maintained by the turbine since there was a constant input and the output never reached zero.
3.4. Recommendations for Future Research
Without significantly altering the approach outlined in this work, there are a number of analysis concepts that could be explored. The comparisons between the existing and proposed mathematical model can be fine-tuned to provide a holistic measurement of the standard deviation of the net outputs. A reasonable measurement of this sort would help to invalidate train trips that are outliers. The existing results could also be enriched with the approximations of energy generated per year according to the number of train trips. The approximations could factor in the expected characteristics for fluctuations in wind turbine efficiency, wind speed, and route availability during various seasons.
As shown in Table 3, the energy required to overcome the drag force in normal operation of the train was the most significant source of energy loss. The degree of drag force acting on the system with the inclusion of the turbine apparatus must be reduced for better results. The proposed air deflector formed from the NACA 0015 airfoil did a reasonable job of reducing the drag force, but there are other geometries that might provide better air deflection for the turbine apparatus [38]. If a structure with an even lower drag coefficient can be utilized, then the system can overcome the energy lost due to drag relatively easily. Alternatively, if the air deflector flaps can be slightly opened during the normal speeds such that only a low degree of drag is introduced while input is provided to the turbine, the system can generate energy for longer periods of time.
There is a need to consider more variations in stop length for each train. The Indian Rail Info dataset provides detailed breakdowns of each stop and how long the train took to start moving again. For this work, the average stop time was taken to be two minutes for every train, but there were cases in which the train stopped for an entire hour before resuming the trip [15]. That extended period can be seen as an opportunity to generate additional energy if the turbines are stationary and outdoor. Another opportunity to generate energy can be seen when the train comes to its final stop. If it is assumed that the trains are outdoor, then turbines can be exposed to more than 8 h of ambient wind speed input during the afterhours of the train system. If energy storage is successfully implemented, the stored energy can be fed to the cart load for the initial acceleration of the trip for which the proposed model would typically have negative net output.
As a stretch goal, a real-time comparison of the energy saved in the train’s braking capabilities while considering the added drag force of the wind turbine apparatus could yield promising results. As discussed, the peak time for energy generation from wind turbines is in the deceleration, during which the increased drag assists in slowing the train down. The energy savings could be compared over time to those observed when regenerative braking systems are used.
4. Conclusions
This work proposed a novel approach to modeling wind turbines on moving trains. An improved mathematical model was presented for real-time analysis. By simulating the energy-generation potential at each second of a train’s trip, the peak times for harnessing wind energy from the trains were identified; the highest net output was over 3 megajoules (MJ). The ability to identify peak generation intervals will boost the potential for application of an energy-storage system. The model encompassed a number of new energy constraints that served to improve the accuracy of the simulated output. As such, the net energy output from the simulation tended to be positive. The performance of the proposed new turbine model was shown to be better than that of the existing model.
A wind turbine connected to a PMSG model was successfully implemented in a MATLAB/Simulink environment to show the potential for implementation in a power system with a 1 KW generator. An analysis of the output from the power system revealed the need for energy-storage devices to satiate the demand for the approximated train cart load.
The prospect of harnessing wind energy from fast-moving vehicles gives recognition to a potential source of energy that already exists as a byproduct of the transportation industry. The motivation for improved modeling of this work was to prove the worthiness for further investment and experimentation. This case study added realistic constraints to a hypothesis and urged for physical verification. The idea is bold, but increasing the accuracy of the modeling techniques is a worthwhile effort to ultimately prove the theory. In our future work, we will evaluate the presented model with experiments.
Author Contributions
Conceptualization, M.H.A. and M.H.; methodology, M.H.; software, M.H.; validation, M.H.; formal analysis, M.H. and M.H.A.; investigation, M.H.; resources, M.H.; data curation, M.H.; writing—original draft preparation, M.H.; writing—review and editing, M.H.A.; visualization, M.H.; supervision, M.H.A.; project administration, M.H.A.; funding acquisition, M.H.A. All authors have read and agreed to the published version of the manuscript.
Funding
This research received no external funding.
Acknowledgments
The authors are pleased to acknowledge the partial financial support from the Department of Electrical and Computer Engineering at the University of Memphis, Memphis, TN, USA, to complete this work.
Conflicts of Interest
The authors declare that they have no conflict of interest.
References
- Prentiss, M. Energy Revolution; The Belknapp Press of Harvard University Press: Cmbridge, MA, USA; London, UK, 2015; pp. 1–20. [Google Scholar]
- Li, Y.; Qiang, S.; Liao, H.; Xu, Y.L. Wind tunnel test with moving vehicle model for aerodynamic forces of vehicle-bridge systems under cross wind. Presented at the Seventh Asia-Pacific Conference on Wind Engineering, Taipei, Taiwan, 8–12 November 2009. [Google Scholar]
- Cheli, F.; Rocchi, D.; Schito, P.; Tomasini, G. Steady and moving high-speed train crosswind simulations. Comparison with wind-tunnel tests. Presented at the World Congress on Railway Research, Lille, France, 22–26 May 2011; pp. 1–12. [Google Scholar]
- Rekhi, B.S. A Method for Generating Electricity by Capturing wind Induced by Moving Vehicles and a System Therefor. July 2009. Available online: https://patents.google.com/patent/WO2009093265A2/en (accessed on 2 September 2022).
- Prakash, B.; Rahul, A.; Abhijit, D.; Vikrant, D.; Sachin, P.V. Review on Wind Power Generation Through Running Trains. Int. Eng. Res. J. 2016, 2, 519–523. [Google Scholar]
- Aditya, K.V.; Sharma, K. Generation of Electricity through air pressure of running trains. Presented at the 55th IRF International Conference, Pune, India, 22 May 2016. [Google Scholar]
- Bharathi, S.; Balaji, G.; Saravanan, V.A.; Suresh, S. A Method for Generating Electricity by Fast Moving Vehicles. In Applied Mechanics and Materials; Trans Tech Publications Ltd.: Stafa-Zurich, Switzerland, 2012; pp. 2177–2182. [Google Scholar]
- Joshi, S.; Mathur, A.; Jain, A.; Gupta, S.; Jani, N.; Chhabra, B. Generation of Electricity using Wind Energy Produced due to the Motion of Trains. J. Energy Technol. Policy 2012, 2, 19–20. [Google Scholar]
- Chaitanya, P.B.; Gowtham, G. Electricity through Train. J. Electr. Electron. Eng. 2015, 10, 1–6. [Google Scholar]
- Asif, H.; Asrar, H. Parametric Study of Turbine Mounted on Train for Electricity Generation. Int. Res. J. Eng. Technol. 2018, 5, 1783–1786. [Google Scholar]
- Reddy, K.K.; Praveenkumar, K.; Mark, M.P.D. Generating Electricity Through Fast Moving Vehicles; Mahatma Gandhi Institute of Technology: Telangana, India, 2016. [Google Scholar]
- Hyman, M.; Ali, M.H. Improved Modelling for Wind Turbines on Trains,” Paper ID: 2019ISGT0216. In Proceedings of the IEEE PES Innovative Smart Grid Technologies Conference, Washington, DC, USA, 17–20 February 2019. [Google Scholar]
- Chen, A. Metro Explores New Green Energy Options: Placing a Wind Turbine in a Subway Tunnel. 2014. Available online: http://thesource.metro.net/2014/03/31/metro-explores-new-green-energy/ (accessed on 2 September 2022).
- Tupe, S.M.; Chavan, D.P.; Avhad, C.P.; Pathak, A.K. Power Generation Through Wind Created by Moving Train. J. Adv. Res. Innov. Ideas Educ. 2016, 2, 852–855. [Google Scholar]
- Indian Rail Info: A Busy Junction for Travellers and Rail Enthusiasts. Available online: https://indiarailinfo.com (accessed on 2 September 2022).
- Abbas, M.A.; Anwar, M.; Rana, M.R. Electricity Generation by Fast Moving Vehicles using Wind Turbine (Metro Rail). In Proceedings of the 2021 1st International Conference on Power Electronics and Energy (ICPEE), Bhubaneswar, India, 2–3 January 2021; pp. 1–4. [Google Scholar] [CrossRef]
- Sekhar, Y.R.; Natarajan, M.; Chiranjeevi, C.; Sukanta, R.; Yugandhar, P. Experimental Study on Vertical Axis Wind Turbine to Harness Wind Power from Rapidly Moving Railway Locomotives. In Theoretical, Computational, and Experimental Solutions to Thermo-Fluid Systems; Springer: Singapore, 2021; p. 445. [Google Scholar]
- Kebede, A.B.; Worku, G.B.; Maru, A.T. A Novel Train Roof-Top Wind Energy Conversion System. Int. J. Eng. Res. Afr. 2022, 61, 165–194. [Google Scholar] [CrossRef]
- Dwivedi, R.; Upadhyay, K.; Kumar, A.K.; Kumar, S.A. Proposed Model for the Wind Energy Harnessing System in Trains. Int. J. Appl. Eng. Technol. 2011, 1, 119–126. [Google Scholar]
- Wankhede, V.; Khedkar, D.A.; Limaje, T.A.; Khedkar, D.S.; Mahajan, V.D. A Model for Electricity Generation by Fast Moving Vehicle. Int. J. Science Adv. Res. Technol. 2016, 2, 25–29. [Google Scholar]
- Sindhuja, B. A proposal for implementation of wind energy harvesting system in trains. In Proceedings of the 2014 International Conference on Control, Instrumentation, Energy and Communication (CIEC), Calcutta, India, 31 January–2 February 2014; pp. 696–702. [Google Scholar]
- Chilugodu, N.; Yoon, Y.J.; Chua, K.S.; Datta, D.; Baek, J.D.; Park, T.; Park, W.T. Simulation of train induced forced wind draft for generating electrical power from Vertical Axis Wind Turbine (VAWT). Int. J. Precis. Eng. Manuf. 2012, 13, 1177–1181. [Google Scholar] [CrossRef]
- Kumar, N.; Sharma, V.K. Production of electricity by using turbine mounted on train. Int. J. Concept. Electr. Electron. Eng. 2013, 1, 32–35. [Google Scholar]
- Mahendran, I.; Krishnaprasanth, B.; Gandhimathi, R.; Elakiya, S. A Novel Method to Generate Electricity Using Fast Moving Vehicles Train. Int. J. Res. Appl. Sci. Eng. Technol. 2016, 4, 292–296. [Google Scholar]
- Joshi, A.Y.; Channiwala, S.A. Efficient Generation of Wind Power from Fast-Moving Heavy Vehicles during Deceleration. Int. J. Eng. Res. Technol. (IJERT) 2016, 5, 135–140. [Google Scholar]
- Aymane, D.N.S.E.; Darhmaoui, H. Savonius Vertical Wind Turbine: Design, Simulation, and Physical Testing; School of Science and Engineering: Ifran, Morocco, May 2017. [Google Scholar]
- No. 2011/CEDO/SD/17/O; Standard Schedule of Dimensions. Government of India, Ministry of Railways: New Delhi, India, 21 January 2013.
- Nimvari, M.E.; Fatahian, H.; Fatahian, E. Performance improvement of a Savonius vertical axis wind turbine using a porous deflector. Energy Convers. Manag. 2020, 220, 113062. [Google Scholar] [CrossRef]
- Mauro, S.; Brusca, S.; Lanzafame, R.; Messina, M. CFD modeling of a ducted Savonius wind turbine for the evaluation of the blockage effects on rotor performance. Renew. Energy 2019, 141, 28–39. [Google Scholar] [CrossRef]
- Bethi, R.V.; Laws, P.; Kumar, P.; Mitra, S. Modified Savonius wind turbine for harvesting wind energy from trains moving in tunnels. Renew. Energy 2019, 135, 1056–1063. [Google Scholar] [CrossRef]
- Tjahjana, D.D.; Hadi, S.; Wicaksono, Y.A.; Kurniawati, D.M.; Fahrudin, F.; Utomo, I.S.; Cahyono, S.I.; Prasetyo, A. Study on performance improvement of the Savonius wind turbine for Urban Power System with Omni-Directional Guide Vane (ODGV). J. Adv. Res. Fluid Mech. Therm. Sci. 2019, 55, 126–135. [Google Scholar]
- Bai, H.L.; Chan, C.M.; Zhu, X.M.; Li, K.M. A numerical study on the performance of a Savonius-type vertical-axis wind turbine in a confined long channel. Renew. Energy 2019, 139, 102–109. [Google Scholar] [CrossRef]
- Chan, C.M.; Bai, H.L.; He, D.Q. Blade shape optimization of the Savonius wind turbine using a genetic algorithm. Appl. Energy 2018, 213, 148–157. [Google Scholar] [CrossRef]
- Ahmed, M.; Sharma, S. An investigation on the aerodynamics of a symmetrical airfoil in ground effect. Exp. Therm. Fluid Sci. 2005, 29, 633–647. [Google Scholar] [CrossRef]
- Ali, M.H. Wind Energy Systems: Solutions for Power Quality and Stabilization; Taylor & Francis Group, CRC Press: Boca Raton, FL, USA, 2012; ISBN 978-1-4398-5614-7. [Google Scholar]
- Wind Finder–Wind, Waves and Weather. Available online: https://www.windfinder.com/#9/29.9679/77.5452 (accessed on 1 September 2022).
- Hansen, A.D.; Michalke, G. Modelling and control of variable-speed multi-pole permanent magnet synchronous generator wind turbine. Wind. Energy Int. J. Prog. Appl. Wind. Power Convers. Technol. 2008, 11, 537–554. [Google Scholar] [CrossRef]
- Wong, K.H.; Chong, W.T.; Poh, S.C.; Shiah, Y.-C.; Sukiman, N.L.; Wang, C.-T. 3D CFD simulation and parametric study of a flat plate deflector for vertical axis wind turbine. Renew. Energy 2018, 129, 32–55. [Google Scholar] [CrossRef]
Figure 1.
Proposed wind flow around the turbine blades due to the cone-shaped metal [24].
Figure 1.
Proposed wind flow around the turbine blades due to the cone-shaped metal [24].

Figure 2.
Airfoil mechanism and Savonius wind turbine placed on train roof [21].
Figure 2.
Airfoil mechanism and Savonius wind turbine placed on train roof [21].
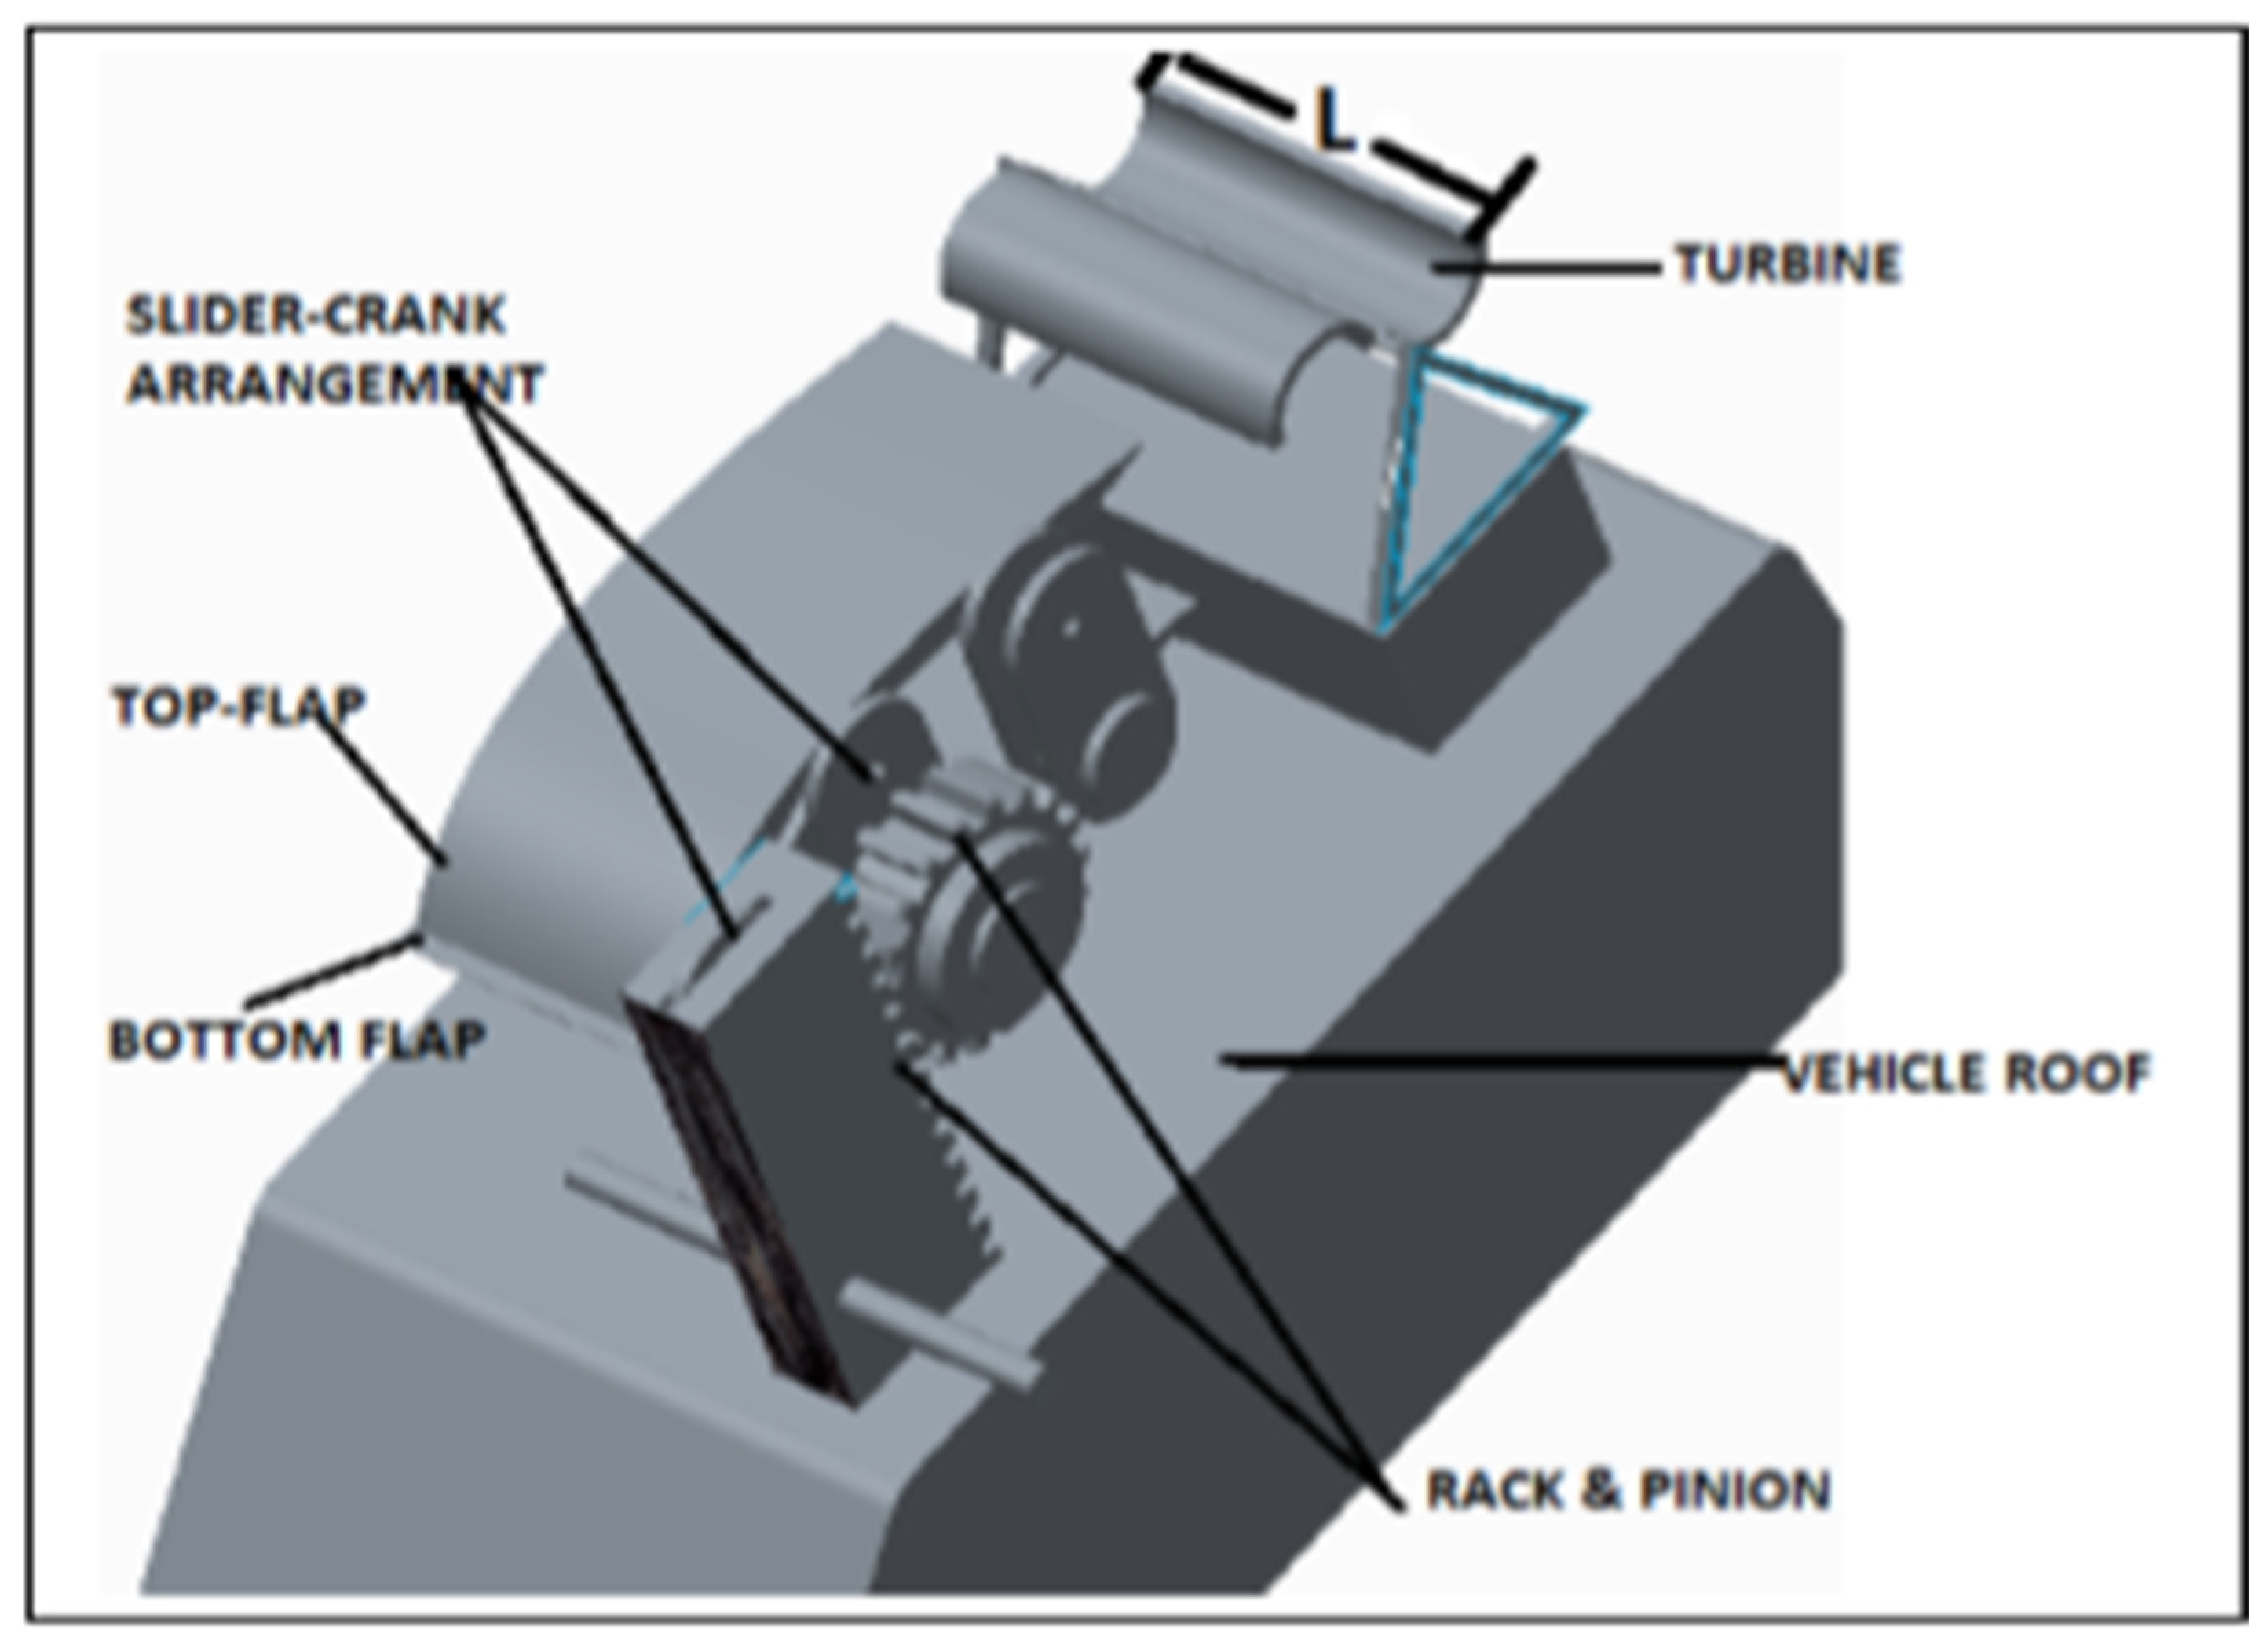
Figure 3.
Velocity magnitude plot of the air deflector and area swept by the Savonius turbine. The arrow surface indicates the direction of the wind velocity at each point and the color bar indicates the velocity magnitude at each point.
Figure 3.
Velocity magnitude plot of the air deflector and area swept by the Savonius turbine. The arrow surface indicates the direction of the wind velocity at each point and the color bar indicates the velocity magnitude at each point.
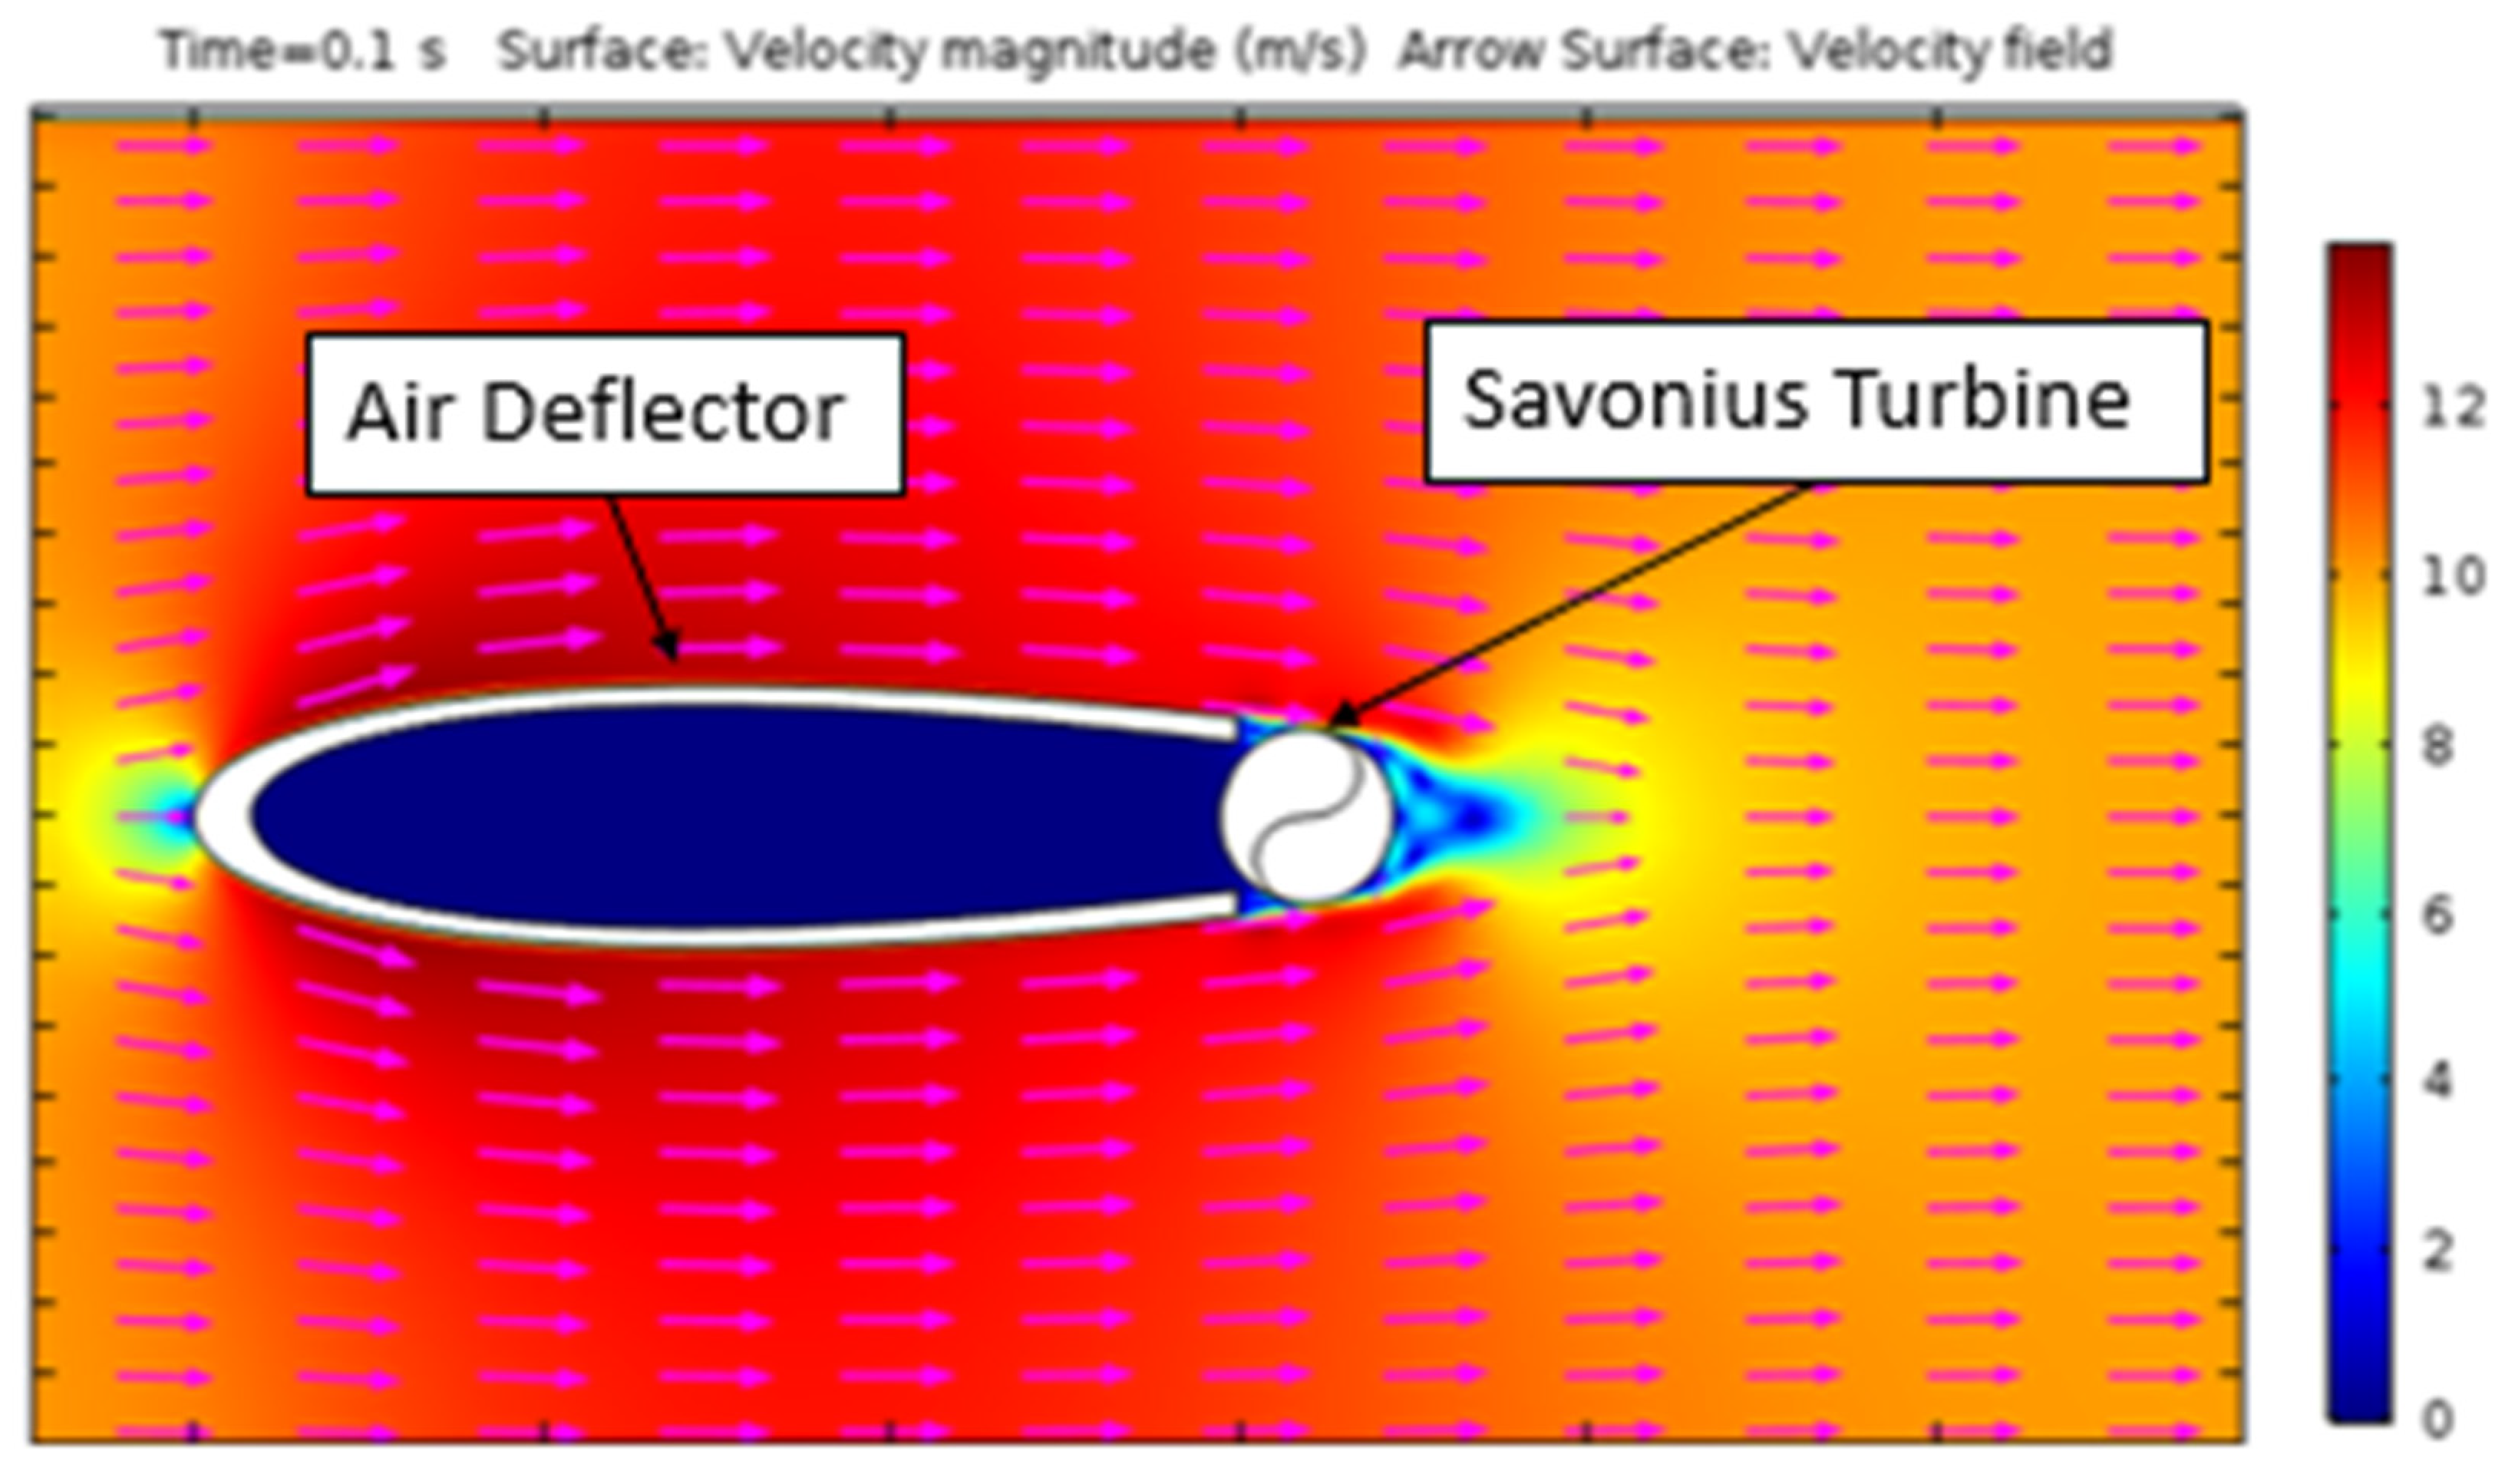
Figure 4.
Improved modeling process for wind turbines on trains.
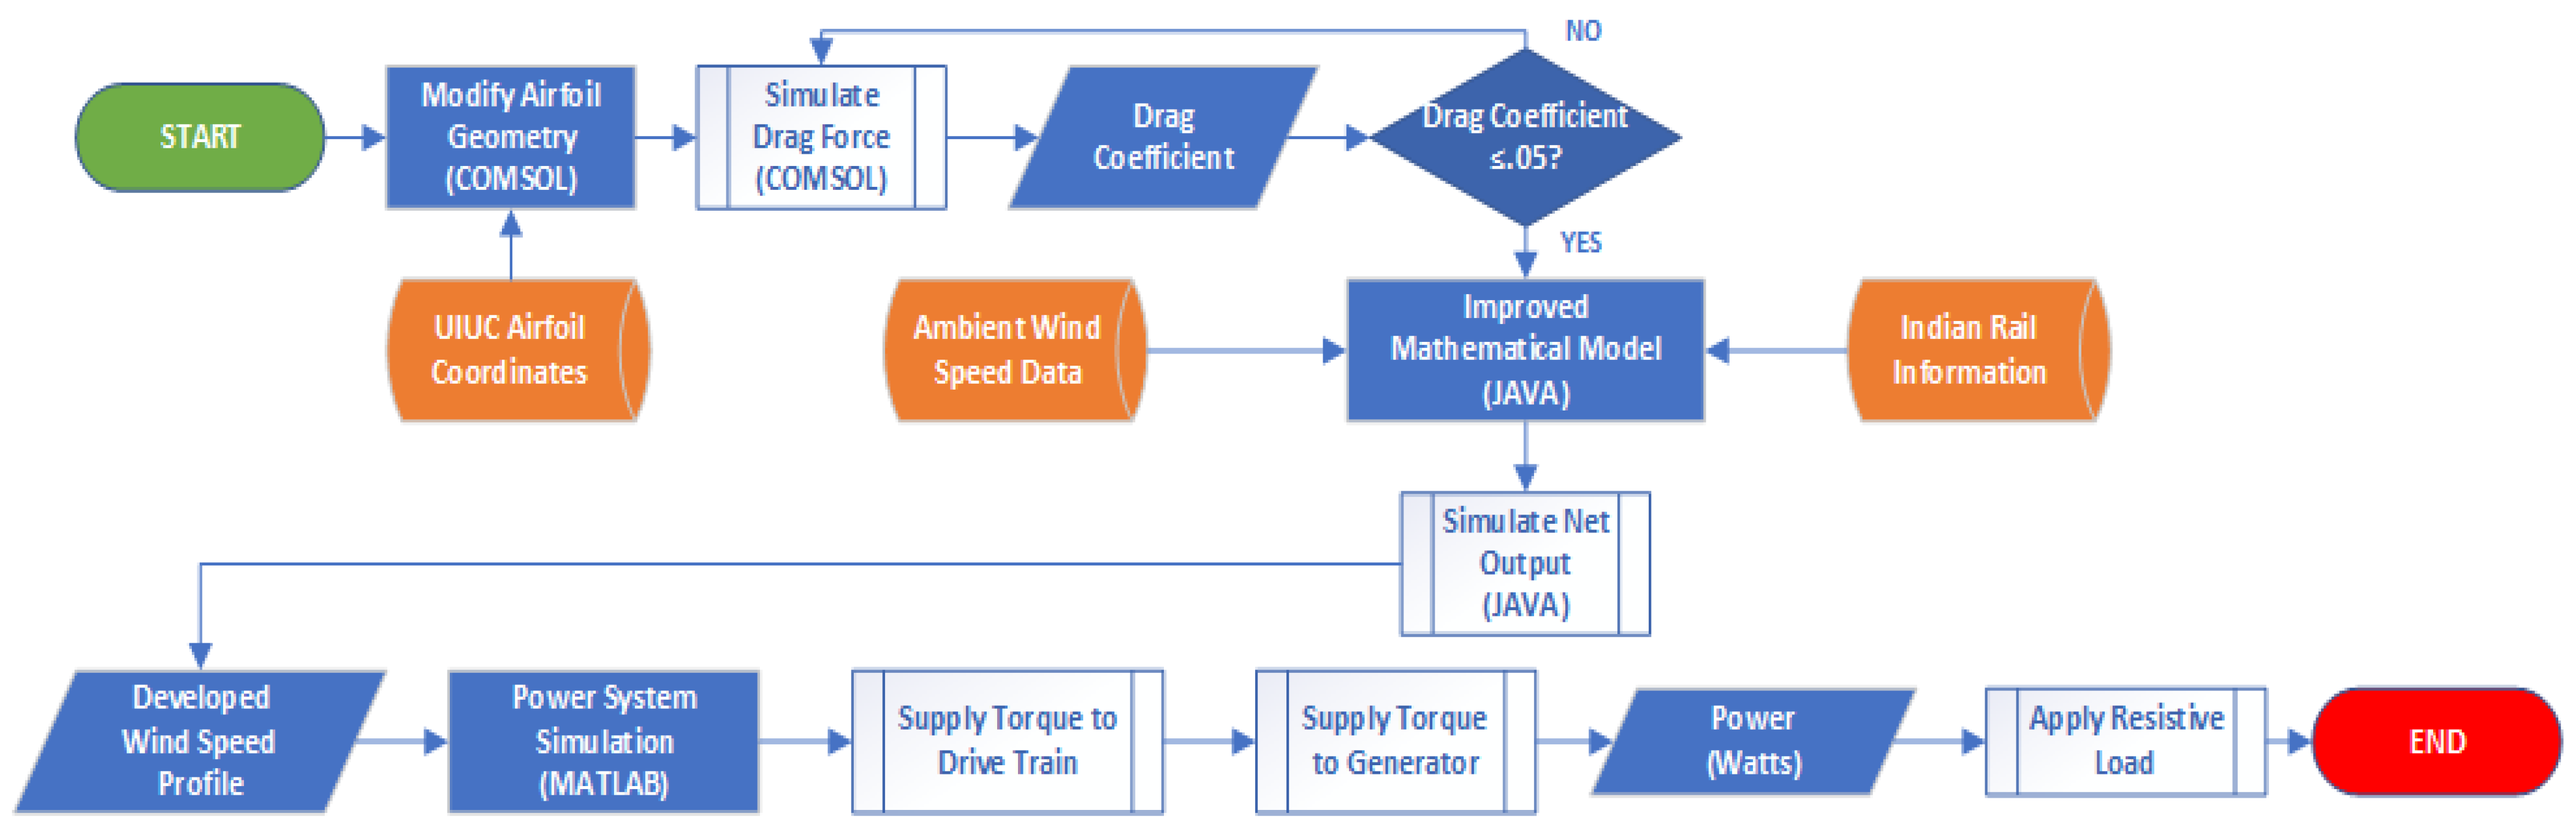
Figure 5.
Electric Power Output of the 1 KW PMSG.

Table 1.
Sample of Indian Rail Info Dataset.
| Origin City | Train # | Time (s) | Stops | Average Velocity (m/s) | Carts |
|---|---|---|---|---|---|
| Ahmedabad | 54,805 | 84,000 | 87 | 7.50 | 12 |
| Bareilly | 14,236 | 56,700 | 42 | 9.70 | 15 |
| Beas | 4,918 | 24,000 | 6 | 12.0 | 20 |
| Dindigul | 56,822 | 21,600 | 20 | 10.0 | 15 |
| Gaya | 53,215 | 10,800 | 27 | 8.60 | 14 |
| Nagpur | 51,286 | 36,300 | 45 | 10.8 | 14 |
| New Delhi | 12,952 | 57,000 | 6 | 24.3 | 18 |
| Rewari | 54,784 | 41,100 | 58 | 10.3 | 10 |
| Visakhapatnam | 57,255 | 38,100 | 54 | 9.20 | 13 |
Table 2.
Net Output Comparison for Mathematical Model.
| Origin City | Net Output (KJ) | |
|---|---|---|
| Existing Model | Proposed Model | |
| Ahmedabad | −485 | 1562 |
| Bareilly | −850 | 1945 |
| Beas | −1015 | −544 |
| Dindigul | −255 | 1306 |
| Gaya | 120 | 893 |
| Nagpur | -371 | 3311 |
| New Delhi | −23,882 | −13,097 |
| Rewari | −520 | 2073 |
| Visakhapatnam | −142 | 3374 |
Table 3.
Comparison of Energy Components.
| Parameters | Train Name (Number) | |||
|---|---|---|---|---|
| Gujarat (19033) | Delhi (54033) | New Delhi (12952) | Jabalpur (01704) | |
| Average Velocity (m/s) | 13.07 | 8.90 | 24.3 | 14.0 |
| Time (s) | 22,800 | 18,000 | 57,000 | 82,800 |
| Stops | 25 | 27 | 6 | 19 |
| Turbines | 19 | 9 | 18 | 19 |
| E (kJ) | 296 | 129 | 278 | 244 |
| E1 (kJ) | 3.3 | 5.5 | 0.8 | 1.7 |
| E2 (kJ) | 77 | 22 | 1001 | 460 |
| E3 (kJ) | 25 | 27 | 6 | 19 |
| E4 (kJ) | 3.4 | 12 | 2.9 | 2.6 |
| Enet (kJ) | 194 | 87 | −727 | −233 |
Publisher’s Note: MDPI stays neutral with regard to jurisdictional claims in published maps and institutional affiliations. |
© 2022 by the authors. Licensee MDPI, Basel, Switzerland. This article is an open access article distributed under the terms and conditions of the Creative Commons Attribution (CC BY) license (https://creativecommons.org/licenses/by/4.0/).
Share and Cite
MDPI and ACS Style
Hyman, M.; Ali, M.H. A Novel Model for Wind Turbines on Trains. Energies 2022, 15, 7629. https://doi.org/10.3390/en15207629
AMA Style
Hyman M, Ali MH. A Novel Model for Wind Turbines on Trains. Energies. 2022; 15(20):7629. https://doi.org/10.3390/en15207629
Chicago/Turabian StyleHyman, Mario, and Mohd Hasan Ali. 2022. "A Novel Model for Wind Turbines on Trains" Energies 15, no. 20: 7629. https://doi.org/10.3390/en15207629
Note that from the first issue of 2016, this journal uses article numbers instead of page numbers. See further details here.