Abstract
Redox flow batteries (RFBs) are a promising candidate that are capable of meeting the energy storage applications to fulfill the needs of renewable resources. Herein, we prepare an electrochemical device that holds higher energy density. In this work, a reusable glucose kit used as a flow cell which in turn helps to minimize the cost and also balance the pump losses in electrochemical systems. For fabricating RFB, ZnO, from the metal organic framework (Zn-MOF/ZnO), uses an electrode material: ZnCl2 in aqueous KOH used as both anolyte and catholyte solution. Upon the new cell fabricating in this investigation, we demonstrated the voltage efficiency of 92% at 5 mA cm−2, which reduces the cost of the cell upon being implemented in the flow battery application.
1. Introduction
Energy crisis is one of the global issues that act as a barrier to the industries, science and technologies, and other energy needs in our day-to-day life. To resolve this, it is necessary to insist on the energy grid that will balance this peak demand without producing an excess amount of energy. Moreover, non-sustainable extraction causes the cost of fuels to grow continuously due to environmental and economic factors. However, the solar, thermal, and geothermal methods, etc., are being developed to continuously crack the energy emergency [1]. Intermittent energy sources such as these needs to be balanced by energy storage devices such as batteries and supercapacitors. Batteries are very versatile and provide improved performance. Some of the main issues recently faced on the conventional Li-ion battery are that the Li-S battery is of high cost, hazardous and self-discharge [2]. So, there is a definite need for finding an alternative that leads to the emergence of the redox flow battery (RFB).
The RFB shares the same fundamental mechanisms and equations as a conventional battery, to attain high efficiency, long life, and chiefly without affecting the environment in comparison to conventional batteries. RFBs have some distinct designs, including independent power and energy (scalability), recyclability of the electro-active material, flexibility, depth of discharge, and mobility. With these entrancing properties, it makes a safe, superior device for storing excess energy with the required efficiency. However, the grid storage application of RFBs is still hampering the low energy density (vanadium redox flow battery (VRFB), <25 Wh L−1). All-vanadium [3], chromium-iron [4], zinc-nickel [5], and zinc-polyiodide [6] have been widely investigated. In general, electrode materials derived from carbonaceous materials that promote good electrical conductivity, and convenient operating windows, have been extensively used. Despite the excellent electrochemical performance of precious metal-based materials, the high cost of noble metal catalysts and tedious synthesis procedures severely limit their commercial applications. Vanadium redox flow battery (VRFB) technology has already been proven in megawatt-scale (MW) systems for many years. However, a major constraint is the cost of the membrane, mainly related to the expensive vanadium salts and the low power density [7]. In RFBs, electrolytes play a pivotal part and are circulated for the flow cell by two separate electrolyte tanks, such as the anolyte and catholyte, which are responsible for the energy storage. However, using a single flow battery system is doable and has also those introductory merits of traditional redox flow batteries such as all-VRFB. Likewise, the application of the same electrolytes permits the use of affordable available accoutrements and can resolve the problem fluently regarding the corrosion resistance of the electrode materials. Remarkably, the single unit rotation will help to exclude the cross-contamination of electrolytes to the electrodes results such as the battery system [8]. Cheng et al. [9] investigated the single-flow battery and discovered that it had an average coulombic efficiency of 96% and an energy efficiency of 86% up to 1000 cycles using zinc oxide (ZnO) as electrolytes and potassium hydroxide (KOH) as supporting electrolytes for both electrodes. Li et al. [10] demonstrated a membrane-free Zn-MnO2 flow battery where the cathode solid-state redox reaction of MnO2/MnOOH with limited reversibility and good cycling stability over 1000 cycles in the range 0.5 to 2 mAh cm−2. The main drawback of this battery is its low volumetric energy density when compared to the theoretical value (46.4 Wh L−1). However, Zhang et al. [11] studied a manganese species in methane-sulfonic acid as a solvent for this zinc-manganese redox flow battery. For the first ten cycles, this cell showed coulombic and energy efficiencies of 74.0% and 92.2%, respectively. Additionally, Xie et al. [12] investigated a Zn/Ce redox flow battery on the chemically reduced graphene oxide paper (RGOC) as a positive electrode. In this, an external soluble aqueous redox mediator (CH3SO3H) was used as a supporting electrolyte and circulated to the flow cell during the chemical reaction. However, this cell exhibits better efficiency when they were compared to the GO paper electrode.
Despite the many existing RFBs, zinc-based flow batteries have been sparking interest far more due to their uniqueness, good reversibility, long cycle life, appreciable voltage window, and potentially lower cost. In this work, ZnO deduced from the metal-organic framework (MOF) has been used as an electrode material owing to its pervious nature that has drawn much interest, because of its large specific surface area, high pore volume, and simple synthesis procedure, etc. An intention of this work is to minimize the troubles related to a high-cost membrane and also the layout of the cell stack is remarkably simplified. In this investigation, the flow cell has been constructed by using the commonly available Glucose kit in the market, which is completely distant from the sophisticated technology. The complete analyses of the material prepared alongside the application in RFB are discussed in detail.
2. Materials and Methods
2.1. Synthesis of Zn-MOF/ZnO
During this synthesis process, 6 mM zinc nitrate hexahydrate (Zn(NO3)2.6H2O) was dissolved in 30 mL N, N-dimethylformamide (DMF), and 2 mM terephthalic acid (C8H6O4) was dissolved in 30 mL of DMF which was stirred separately. Then, the mixtures were added drop-wise to the dissolved Zn (NO3)2.6H2O mixture until it gets a clear solution. To make a Zn-MOF, the solution was poured into an autoclave and heated at 150 °C for 19 h. Thereafter, the samples were washed numerous times with DMF and ethanol separately. The washed sample was initially dried in a vacuum oven at 80 °C and subsequently, the Zn-MOF precursor was calcined at 600 °C for 2 h for obtaining the ZnO particle. The calcination is expected to get rid of the organic solvents from the precursor.
2.2. Preparation of Working Electrode
Nickel foam (NF) pre-treatment: The NF is first chopped into small pieces of 2 cm × 1 cm × 0.001 mm, and then soaked into hydrochloric acid for 10-15 min. Immediately, it was immersed in distilled water, and lastly dried in order to remove any impurities in the nickel foam. Furthermore, 80 wt% of active material, 10 wt% of poly (vinylidene fluoride) (PVdF), and 10 wt% of activated carbon is mixed using N-methyl-N-pyrrolidone (NMP) solvent to make a homogenous slurry. The attained homogenous slurry was coated onto the pre-treated nickel foam, whose size was 1 × 1 cm2, and dried in an oven at 80 °C overnight before use for investigation.
2.3. Preparation of Electrolyte
Metal chloride precursors were used to make electrolytes, which were then enhanced with potassium hydroxide (KOH) as a supporting electrolyte. The zinc chloride (ZnCl2) was used as an active precursor for both an anolyte and catholyte. Zinc chloride (ZnCl2, SRL) and potassium hydroxide (KOH, SRL) were used. ZnCl2 (0.5 M) and KOH (6 M) were dissolved in 80 mL distilled water and used for the flow cell studies.
2.4. Characterization Techniques
SIINT 6300, Japan was used to perform thermogravimetric (TG) and differential thermal analysis (DTA) from room temperature to 800 °C at a heat rate of 10 °C min−1. An X-ray diffraction pattern (XRD) was examined using the X’pertpro-PANAlytical with CuKλ radiation (λ = 1.5406) in the range 2Ө = 10–90° at a scanning rate of 5° min−1. Rietveld refinement of the XRD pattern was fitted by MATCH! 3 software. The crystallographic and molecular structure of the material was captured by DIAMOND. Thermo Nicolet 380 FT-IR spectrophotometer was used to perform Fourier Transform Infrared (FT-IR) spectroscopy via KBr pellets. The morphology of the material was analyzed by field emission scanning electron microscopic analysis (FE-SEM) EV018 (CARL ZEISS). Nitrogen adsorption/desorption isotherms were performed by Quantachrome at (Nova Station A) 77K. The specific surface area and pore size was determined using Brunauer–Emmett–Teller (BET) and Barrett-Joyner-Halenda theory, respectively. X-ray photoelectron spectroscopy (XPS) was executed using ESCALAB 250xi spectrometer (Thermo Scientific) through XR6 Micro-focused Monochromator (Al Kα X-ray source).
2.5. Electrochemical Characterizations
Cyclic voltammetry (CV) was performed to analyze the redox reaction of the anolyte and catholyte at a suitable potential window in a three-electrode system by Origalys EC workstation (France). The flow test is then performed at room temperature with a Biologic (BCS 815, France) battery tester at a voltage range 0 to 2 V. Thus, the newly designed flow cell’s galvanostatic charge-discharge (GCD) curve was acquired at various current densities ranging from 5 to 20 mA cm−2. Subsequently, electrochemical impedance spectroscopy (EIS) was performed in the frequency range 10 kHz-10 mHz.
2.6. Describing Materials
Intravenous (IV) infusion set and empty glucose bottle bought from a medical shop.
IV infusion set descriptions, Length = 150 cm
Drop rate = 20 drops/mL.
Efficient roller controlled for accurate and uninterrupted flow. IV set consists of flexible drip chamber with disc filter. Empty glucose bottle and IV set is rinsed with distilled water and ethanol, and then dried at room temperature for 1 h before it is employed in electrochemical studies.
2.7. Engineering Aspects and Working of the Redox Flow Battery Using Glucose Kit as a Flow Cell
A redox flow battery achieves nearly an entire fuel usage and excessive cell potential using a flow cell with peristaltic pumps to flow the electrolyte to the electrode. However, the cost of the cell and pump may be very expensive and the use of pumps results in mechanical losses and decreases the efficiency. Hence, the device presented here relies on the forces due to the presence of the mechanical flow controller (dial-in-flow), which expands a consistent flow of reactants through the nickel foam pair without any external pumps. Here, the mechanical flow controller is used to regulate the electrolytes to the electrode along with the gravity infusion. Then, we set the flow rate with the help of a rotating dial. The simple medical technology is used for science and technology without altering the dimension of equipment such as standard tubing with a set of needle adapters, solution connectors, and filters in line. An actual description of the infusion bag set can be situated on the packaging of the tubing. There are two types of standard tubing, such as macro and micro tubing sets. In this study, a macro set (with 6.4 mm internal diameter (ID) and 116 cm long) was used [13].
The flow rate for this kit was estimated as 80 mL/h without stopping the speed of the electrolyte flow. This is due to the electrolyte bottles being along the gravity and therefore the flow was not changed by the lower atmospheric pressure. When the electrolyte flows out to the tubing clamp, some space is created inside the bottle that slows down the flow of the liquid. However, we pierce the bottle with a needle and pave a path for the air to go inside, and then the pressure inside will rise to the same level as air pressure. For this kit, flow is initiated as air-filled atmospheric pressure. Furthermore, the pressure of the infusion bag is concerned as varied from gravity to 600 mm Hg, which is generated by compressing the solution and was reported by Mateer et al. [14]. It can also be predicted from Hagen–Poiseuille’s formula for a tube of constant cross-section, and the laminar flow will follow the equation:
where η represents the viscosity of the fluid, l denotes the length of the tubing, ∆p signifies the pressure gradient, r and Q indicate the radius of the tubing, and the flow rate of the fluid, respectively [15].
Moreover, it is a low-cost and disposable plastic used battery that is functioned as a redox flow cell. The device’s main structure consists of two glucose bottles (electrolyte tanks), which act as an anolyte and a catholyte. These are connected to a working area consisting of an anode, cathode (coated NF), and separator. Then, the operation has been started by filling up the electrolyte solutions of electro-active species in the glucose bottles with the help of an oral syringe. Further, the fluids in the bottles establish a convective flow of reactants by the flow controller. A needle is positioned simply above the lined vicinity of the electrode’s internal surface without touching the lined surface and it lets in the electrolyte to attain the working area. The electrode is separated by a microporous separator. Thus, the device keeps functioning until the electrolyte solutions are consumed. Depending on the electrolyte volume, the concentration of the electrolyte and running time of the battery can increase from few seconds to several hours. In addition, the battery can effortlessly be recharged by refilling the electrolyte with additional electro-active species. Here, the flow controller is used to bring the solution to the lined surface and meanwhile manages the flow rate, which constitutes the battery salt bridge. The schematic representation of the setup is shown in Figure 1. In this case, Zn-MOF/ZnO-coated nickel foam acts as a symmetric electrode and a solution of 0.5 M ZnCl2 in 6 M of KOH (80 mL) as an electrolyte for both the catholyte and anolyte. Further, the battery performance was tested using CV and GCD.
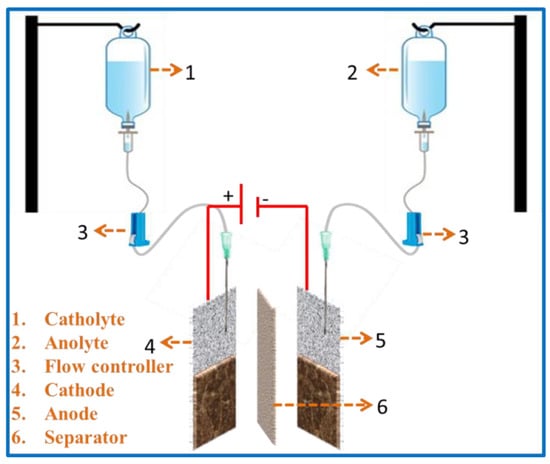
Figure 1.
Schematic representations of the flow cell using glucose kit.
3. Results
3.1. TG/DTA Analysis
The thermal history of Zn-MOF was characterized through TG/DTA as shown in Figure 2a. The weight losses of Zn-MOF could be observed in two stages. The first weight loss (about 4.36%) from 330 to 390 °C corresponds to the release of organic solvent from the precursor. The second weight loss of 26.45% that occurred in the range of 420-536 °C is due to the structural decomposition of Zn-MOF. There was no further weight loss that could be observed above 550 °C, which shows that Zn-MOF had been decomposed completely and formation of ZnO is ensued. The weight of the final residue was 57%, which showed an excess content of 16% when compared to the calculated final weight of ZnO (42%). This additional content implies that there were other components in the final residue, such as carbon, nitrogen residue, etc. [16]. The appearance of two endothermic peaks in DTA, at 374 and 477 °C, is in accordance with the two weight losses that occurred in the TG curves.
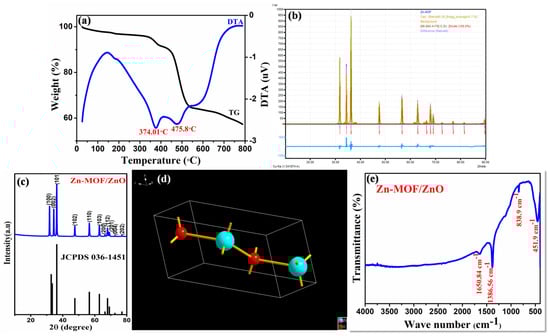
Figure 2.
(a) TG-DTA; (b) XRD; (c,d) Rietveld refinement and its crystallographic structure; and (e) FT-IR of the prepared Zn-MOF/ZnO.
3.2. XRD Analysis
The structural and phase behavior of MOF-derived ZnO (Zn-MOF/ZnO) were elucidated by X-ray diffraction analysis (XRD) and the diffraction patterns are shown in Figure 2c. Rietveld refinement and crystallographic structure of the as-prepared material are shown in Figure 2b, d. respectively. The refined calculated structural parameters such as unit cell parameter, the ionic position of ZnO in crystal, and other corresponding parameters are displayed in Table 1, for the Zn-MOF/ZnO. A sharp diffraction peak at 2= 36.21° corresponds to the characteristic plane (101), which confirms the well-ordered standard hexagonal structure of ZnO. The presence of prominent, sharp intense peaks at 2 = 31.72, 34.38, 36.21, 47.50, 56.55, 62.82, 66.34, 67.91, 69.05, 72.53 and 76.92°are corresponding with their lattice planes (100), (002), (101), (102), (110), (103), (200), (112), (201), (004), and (202), respectively of ZnO. No other diffraction peaks could be observed in the diffraction pattern which suggests that there is no additional impurity. Thus, the ensuing diffraction pattern was confirmed by the JCPDS 36-1451. This result suggests that the carbon had consolidated into the crystal lattice of ZnO. The average crystalline size was detected to be 39.81 nm using Scherrer formula [17].

Table 1.
Crystallographic parameters of Zn-MOF/ZnO refined by the Rietveld method.
3.3. FT-IR Analysis
FT-IR spectra of the Zn-MOF/ZnO are shown in Figure 2e. FT-IR evaluation in the wavelength range 4000–400 cm−1 revealed the presence of vibrational modes in the as-prepared material. The absorption peak observed at 838.9 cm−1 corresponds to the formation of tetrahedral coordination of Zn. The peak at 451.99 cm−1 is attributed to the stretching vibrations of ZnO. The peak positioned at 1386.5 and 1650.8 cm−1 is attributed to the stretching vibration of Zn-N bond and carboxylate groups, respectively. Thus, the sample calcined above 550 °C exhibited strong absorption peaks below 600 cm−1, which implies the characteristic absorption of the Zn-O bond in zinc oxide [18,19].
3.4. FE-SEM Analysis
The surface morphology of the synthesized ZnO particle derived from Zn-MOF was revealed by FE-SEM analysis as shown in Figure 3a–c. The SEM images were recorded at 5, 20, and 50 k (Figure 3a-c) magnifications, and they seemed to be aggregated as a two-dimensional hexagonal plate-like structure with uniform morphology, smooth surface and an average particle size ranging from 40 to 100 μm. As a result of its smooth surface and size, the ions are expected to move during the charge/discharge analysis [20]. The composition of the material is determined by using energy-dispersive X-ray spectroscopy (EDX) analysis and it is presented in Figure 3d. EDX analysis of the prepared material showed the presence of (carbon/nitrogen/oxygen/zinc) the elements in the prepared material. The composition obtained from EDX was in good agreement with the composition taken for preparing the material. It is also appreciable that all the existing elements are situated in the K series, which also confirms the compounds are owing to small element categories [21,22].
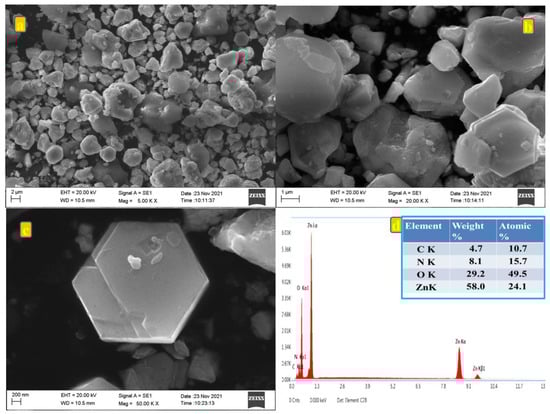
Figure 3.
(a–c) SEM images at various magnifications at 5, 20, and 50 k; (d) EDX spectrum of prepared Zn-MOF/ZnO.
3.5. Brunauer-Emmett-Teller Analysis
From the BET analysis, the surface area, pore volume and pore diameter of the Zn-MOF/ZnO were calculated from the nitrogen adsorption/desorption isotherms, and the pore size distribution are also shown in Figure 4a, b. Figure 4a shows the nitrogen adsorption–desorption isotherm of Zn-MOF/ZnO is of type IV, based on the IPUAC classification holds H3 type hysteresis loop, which indicates that the prepared material has a characteristic mesoporous structure. Based on the material nature, the BET surface area of the as-prepared sample is estimated as 10.81 m²/g, which is higher than that of the Zn-MOF (1.10 m2/g) [23] and the pure ZnO (2.35 m2/g) [20]. The prepared material shows the largest specific surface area and pore volume (0.015 cc/g), when compared to the Zn-MOF (0.007 cc/g). Hu et al. [23] reported that the collapse of the framework of Zn-MOF and its formation of ZnO exhibits a higher surface area and pore volume. Furthermore, as the calcination temperature increases, the collapse rate will be increased, which results in forming the pure ZnO. ZnO derived from Zn-MOF has the pore diameter of 2.858 nm, which reveals the mesoporous nature. The ionic radius of Zn = 1.32 Å, which is very much capable of penetrating into the prepared material (pore diameter = 2.85 nm). The existence of hysteresis loop in BET shows an obvious capillary condensation step, indicating the presence of mesoporous. By increasing the surface area and improving the pore size, Zn-MOF/ZnO increases the contact area and improves the electrolyte diffusion [24].
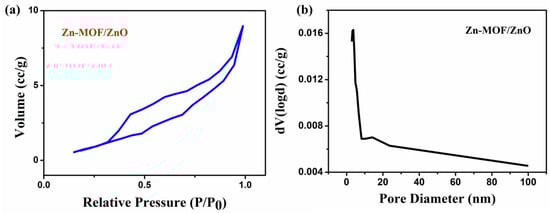
Figure 4.
(a) Nitrogen adsorption/desorption isotherms; (b) Pore size distribution of the Zn-MOF/ZnO.
3.6. XPS Analysis
The elemental composition and oxidation states of the as-prepared material were observed by X-ray photoelectron spectroscopy (XPS) analysis. Figure 5a shows the survey spectrum of the prepared Zn-MOF/ZnO. The XPS spectra showed the Zn 2p, O 1s, C 1s and additional weak N 1s at their corresponding binding energies, revealed for the Zn-MOF/ZnO. The binding energy arises at 1043.1 eV, and 1020 eV indicate the Zn 2p3/2 and Zn 2p1/2, respectively (Figure 5b). By observing the distance of Zn 2p3/2 and Zn 2p1/2 as ~23.1 eV, it confirms the valence state of Zn2+ ions. The O 1s spectra deconvoluted into two peaks at 529.03 eV and 530.7 eV that are corresponding to the Zn-O bond and Zn-O-C/-OH bond. The binding energy at 529.03 eV is the high intense peak when compared to the 530.7 eV (Figure 5c), which represents the O2- ion in Zn-O. The precursor of Zn-MOF is calcined at 600 °C which indicates the presence of carbon consolidated into the ZnO. It reveals that (Figure 5d) Zn-O-C and Zn-C bond at the binding energy values 286.2 eV and 283.4 eV are attributed to the oxidation state of C 1s. Finally, the weak peaks of N 1s arise because of nitrogen that is fused into the ZnO. The deconvoluted peak of the N 1s is centered at 398.5 eV and 396.2 eV, which indicates the N-Zn-O and Zn-N bond (Figure 5e), respectively [25].
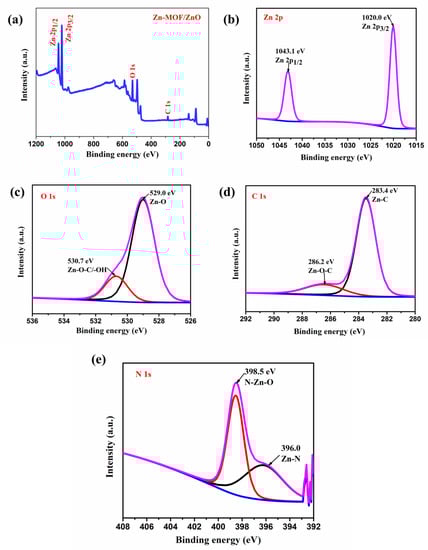
Figure 5.
(a) XPS spectrum of the prepared Zn-MOF/ZnO survey spectrum; high resolution spectra of (b) Zn 2p state; (c) O 1s state; (d) C 1s; (e) N 1s.  Satellite peak, Remaining lines are related to Convoluted peaks.
Satellite peak, Remaining lines are related to Convoluted peaks.
4. Discussions
4.1. Electrochemical Studies
The redox behavior of the as-prepared electrode material with all-zinc electrolyte is investigated via a three-electrode system. Using cyclic voltammetry (CV), the redox reaction of the prepared Zn-MOF/ZnO electrodes 0.5 M ZnCl2 + 6 M KOH as both an anolyte and catholyte redox couple is evaluated. Zn-MOF/ZnO, platinum, and Ag/AgCl with a salt bridge serve as the working, counter, and reference electrodes, respectively. Figure 6 indicates the comparison of CV profile for the bare Ni-foam at 10 mV s−1 and Zn-MOF/ZnO as the working electrode with ZnCl2 + KOH as the electrolyte in a potential range of -1 to 0.6 V at a sweep rate varies from 10-100 mV s−1. A modified electrode has a small peak potential separation (V = 0.13) when contrasted with the bare Ni-foam (V = 0.17), which dictates the diffusion of the anolyte to the electrode. Moreover, the peak current ratio for the prepared electrode and electrolyte exhibits nearly 1 mA and it shows high reversibility [26,27]. Using ZnCl2 + KOH results in double displacement, the reactions are shown below:
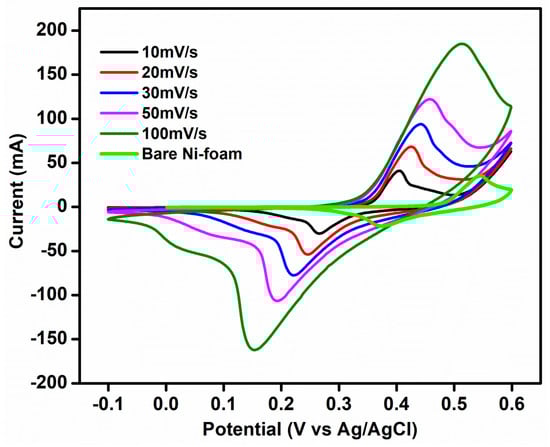
Figure 6.
Comparison of three electrode cyclic voltammetry of bare Ni-Foam at 10 mV s−1 and Zn-MOF/ZnO as working electrode at 10-100 mV s−1.
From this, ZnCl2 and KOH are soluble easily. The zinc and potassium are acting as cations, and the chlorine and hydroxide are acting as anions according to the double displacement. Then, the product KCl is soluble but Zn (OH)2 is insoluble. Figure 6 shows the oxidation peak at ~0.4 V vs. Zn/Zn2+ and the reduction peak at ~0.26 V vs. Zn2+/Zn, whereas a weak peak appeared at ~0.04 V indicates the undissolved Zn (OH)2 [28]. The negative electrode reaction is as follows:
Zn2+ + 2 OH− + 2e− → Zn (OH)2 E0 = −0.76 V vs. SHE
The positive electrode reaction is as follows:
Zn (OH)2 + → Zn2+ + 2e− + 2OH− E0 = 2.87 V vs. SHE
The overall chemical reaction for this cell is as follows:
Here, through the charging process, the Zn2+ ions get reduced to Zn (OH)2 and get deposited on the surface of the electrode in the anode; whereas, at the cathode, Zn (OH)2 is oxidized to form Zn2+. The reverse reaction is taking place in the discharge process, and vice versa.
4.2. Flow Test
Then, in a newly constructed flow cell, 0.5 M ZnCl2 in an aqueous 6 M KOH solution was used as both anolyte and catholyte solution with Zn-MOF/ZnO as a symmetric electrode. CV has been performed for the prepared material, via a newly developed glucose kit as a flow cell from 0 to +1.8 V at the scan rates ranging from 10 to 100 mV s–1. This potential range implies the redox peaks and indicates the occurrence of the deposition of ZnCl2 and dissolution of the electrolytes as shown in Figure 7a. An anodic peak and cathodic peak corresponding to zinc ion oxidation and reduction occurred at ~1.47 V and ~1.07 V, respectively. The anodic and cathodic peak currents shifted positively and negatively as the sweep rate increased. However, the peak potential separation progressively increased from 335 @10 mVs−1 to 461 mV as the scan rate went up to 100 mV s–1 due to the higher concentration of active sites [29]. The peak current ratio (Ipa/Ipc) dropped considerably from 1.402 mA to 1.197 mA. This (around 1 mA) indicates the improved redox reversibility. When analogous to other redox flow battery systems such as VRFB, the energy density for this cell is expected to be higher, based on the obtained CV curve reaching high potential [30].
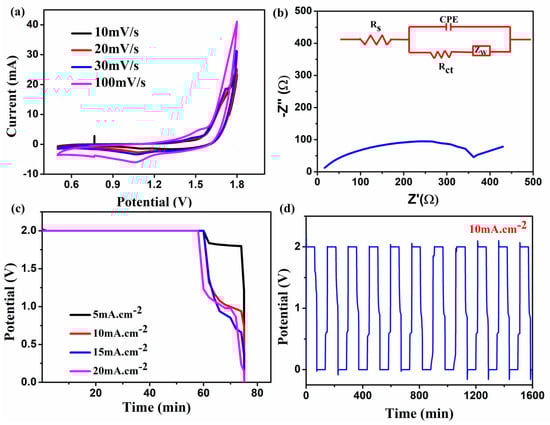
Figure 7.
(a) CV; (b) EIS; (c) GCD plateau (second cycle) at 5-20 mA.cm−2; (d) initial 10 charge-discharge cycles of the prepared material in the newly designed flow cell.
Impedance analysis was performed in the frequency range of 10 kHz-10 mHz and the results exhibit the clarity of the diffusion-controlled process of the cell as shown in Figure 7b. The obtained curve for the ZnCl2 + KOH electrolyte, the prepared Zn-MOF/ZnO electrode shows a solution resistance (Rs) of 16.5 Ω and charge transfer resistance (Rct) nearly about 346 Ω. The inclined line in the lower frequency region corresponds to Warburg impedance (Zw) that exists in the cell. Finally, the appearance of a semicircle in the plot shows that the electrode materials are undergoing an electron transfer reaction [31]. Consequently, the corresponding equivalent circuit can be fitted in the EIS as shown in Figure 7b.
The cell execution of the all-zinc RFB was fabricated using the prepared electrolyte, electrodes, and the GCD analysis was performed at various current densities from 5 to 20 mA cm−2. Moreover, the GCD curves for the second cycle of each current density are recorded and depicted in Figure 7c. As shown in Figure 7d, the first ten charge/discharge cycles were performed at a constant current density of 10 mA cm−2. As it is similar to Wylie et al. [32], the energy efficiency of the prepared electrode with this newly developed cell shows 17% in the first cycle; after ten cycles, it exhibits 7%. As a result, the GCD plateau shows an excellent performance in terms of voltage efficiency (VE), which is around 92.4% at 5 mA cm−2. As reported by Li et al. [33], the voltage drop increased linearly as the current density rises due to polarization on the electrode lined surface, which is a typical feature in any electrochemical system. As a consequence, the voltage drop is increased from 150 mV (5 mA cm−2) to 880 mV at 20 mA cm−2 in the present study. The cell performance was also calculated using energy (EE), voltage (VE), and coulombic efficiency (CE) using the relations [34] as given hereunder.
Thus, the efficiency at various current densities is indicated in Table S1 in Supplementary Materials (supporting information). In addition, the average charging voltage plateau is 1.99, 1.99, 1.998 and 1.992 V for various current densities; whereas, the peaks of the average discharge voltage are 1.84, 1.331, 1.229 and 1.107 V. Bar graph of the calculated efficiency of this flow cell were enclosed in Figures S1–S3 (supporting information). Additionally, it results in the higher discharge potential near 1.84 V and the decrease in the lower discharge potential plateau near 0.12 V depicts the energy efficiency of this newly constructed flow cell as 22% [32]. It is comparable to the report of Chakrabarti et al. [35] that revealed an energy efficiency of 20% for a symmetric Ruthenium-based cell. It is interesting to note that the all-zinc flow cell has a higher cell voltage (1.99 V) than other flow cells such as Zn-Br2 (1.84 V) [36], Zn/V (1.02 V) [37], and all-VRFB (1.2 V) [38]. Then, the volumetric energy density principally relies upon the active species’ concentration, the cell voltage, and the number of electrons engaged in the redox reactions. The following equation was used to calculate the theoretical volumetric energy density:
Here, n denotes the number of electrons transferred in the reaction, C implies the redox species concentration, F the Faraday’s constant (26.8 Ah/mol), and V is the cell potential. This cell exhibits high energy density when compared to all-vanadium (10-25 Wh L−1), and Zn/MnO2 (1.6 V/45-370 Wh L−1) [10]. Hence, this new cell shows a discharge potential of 1.84 V at 6.5 M concentration of aqueous electrolyte. In the present case, the practical volumetric energy density has been obtained nearly 599.62 Wh.L−1 (theoretical energy density is 731.6 Wh.L−1) for the newly developed zinc redox flow cells.
5. Conclusions
In summary, the newly developed flow cell with a prepared Zn-MOF/ZnO electrode has been effectively used for all-zinc RFB. The as-prepared ZnO derived from Zn-MOF shows the hexagonal structure and enhanced surface area when compared to the pure ZnO. Therefore, carbon-consolidated ZnO plays a vital role in the charge–discharge process. Significantly, the oxidation/reduction couple of zinc at a pair of electrodes shows improved reversibility. As a first endeavor, this new flow cell displays better energy efficiency (22%) at a current density of 5 mA cm−2 in the RFB system than the standard flow cell. The discharge potential of this flow battery is quite impressive at 1.84 V. Altogether, the newly designed flow cell is a promising candidate for simple energy storage technology employed in the RFB system when compared to the literature (Table 2). In addition, this work will be assumed as an essential part of developing the next-generation low-cost and safe energy storage system for the modernized storage application.
Table 2.
Comparison of CE, VE, and EE of the previous reported data with our newly prepared material and flow cell efficiency.
Supplementary Materials
The following supporting information can be downloaded at: https://www.mdpi.com/article/10.3390/en15207635/s1, Figure S1: Voltage efficiency for this newly developed cell at current densities 5-20mA.cm−2; Figure S2: Coulombic efficiency at current densities 5-20 mA.cm−2; Figure S3: Energy efficiency at current densities 5-20 mA.cm−2 for glucose kit as cell for redox flow battery; Table S1: coulombic, voltage, and energy efficiency of current densities ranging from 5-20 mA.cm−2 and corresponding average charge discharge voltage.
Author Contributions
Conceptualization, S.M. and S.R.; methodology, P.L., S.M. and S.R.; software, P.L.; validation, P.L., S.R., S.M. and S.V.; formal analysis, P.L. and S.M.; investigation, P.L., S.M. and S.R. resources, P.L., S.R., S.M. and S.V.; data curation, P.L. and S.M.; writing—original draft preparation, P.L., S.R. and S.M.; writing—review and editing, P.L., S.R., S.M. and S.V.; visualization, P.L., S.M. and S.R.; supervision, S.R., S.M. and S.V.; project administration, S.M. and S.R.; funding acquisition, S.M. and S.R. All authors have read and agreed to the published version of the manuscript.
Funding
All the authors from Alagappa University acknowledge the financial support by DST SERB, New Delhi, India under the Physical sciences, grant sanctioned vide EMR/2016/006302 and Ministry of Human Resource Development RUSA- Phase 2.0 grant sanctioned vide Lt.No.F-24-51/2014 U Policy (TNMulti Gen), Dept. of Education, Govt. of India.
Data Availability Statement
Not applicable.
Conflicts of Interest
All the authors declare that there are no competing interests in any aspects. I assure that this manuscript was not previously submitted to any journal for publication. I assure that the manuscript or its contents in some other form, have not been published previously by any of the authors and/or is not under consideration for publication in another journal at the time of submission.
References
- Muruganantham, R.; Sivakumar, M.; Subadevi, R. Synthesis and electrochemical characterization of olivine-type lithium iron phosphate cathode materials via different techniques. Ionics 2016, 22, 1557–1565. Available online: https://link.springer.com/article/10.1007/s11581-016-1676-3 (accessed on 22 May 2022). [CrossRef]
- Rajkumar, P.; Diwakar, K.; Subadevi, R.; Gnanamuthu, R.M.; Sivakumar, M. Sulfur cloaked with different carbonaceous materials for high performance lithium sulfur batteries. Curr. Appl. Phys. 2019, 19, 902–909. [Google Scholar] [CrossRef]
- Li, L.; Kim, S.; Wang, W.; Vijayakumar, M.; Nie, Z.; Chen, B.; Zhang, J.; Xia, G.; Hu, J.; Graff, G.; et al. A stable vanadium redox-flow battery with high energy density for large-scale energy storage. Adv. Energy Mater. 2011, 1, 394–400. [Google Scholar] [CrossRef]
- Deng, Q.; Huang, P.; Zhou, W.X.; Ma, Q.; Zhou, N.; Xie, H.; Ling, W.; Zhou, C.J.; Yin, Y.X.; Wu, X.W.; et al. A High-Performance Composite Electrode for Vanadium Redox Flow Batteries. Adv. Energy Mater. 2017, 7, 1700461. [Google Scholar] [CrossRef]
- Zeng, Y.K.; Zhou, X.L.; An, L.; Wei, L.; Zhao, T.S. A high-performance flow-field structured iron-chromium redox flow battery. J. Power Sources 2016, 324, 738–744. [Google Scholar] [CrossRef]
- Sun, X.; Yao, S.; Zhao, Q.; Zhao, Y.; Cheng, J. Simulation Modeling and Charge–Discharge Characteristics of a Zinc–Nickel Single-Flow Battery Stack. Int. J. Electrochem. Sci. 2020, 15, 651–665. [Google Scholar] [CrossRef]
- Li, B.; Liu, J.; Nie, Z.; Wang, W.; Reed, D.; Liu, J.; Mc Grail, P.; Sprenkle, V. Metal–organic frameworks as highly active electrocatalysts for high-energy density, aqueous zinc-polyiodide redox flow batteries. Nano Lett. 2016, 16, 4335–4340. [Google Scholar] [CrossRef]
- Amini, K.; Gostick, J.; Pritzker, M.D. Metal and metal oxide electrocatalysts for redox flow batteries. Adv. Funct. Mater. 2020, 30, 1910564. [Google Scholar] [CrossRef]
- Cheng, J.; Zhang, L.; Yang, Y.S.; Wen, Y.H.; Cao, G.P.; Wang, X.D. Preliminary study of single flow zinc–nickel battery. Electrochem. Commun. 2007, 9, 2639–2642. [Google Scholar] [CrossRef]
- Li, G.; Chen, W.; Zhang, H.; Gong, Y.; Shi, F.; Wang, J.; Zhang, R.; Chen, G.; Jin, Y.; Wu, T.; et al. Membrane-Free Zn/MnO2 Flow Battery for Large-Scale Energy Storage. Adv. Energy Mater. 2020, 10, 1902085. [Google Scholar] [CrossRef]
- Zhang, Z.; Zhou, D.; Xie, Z.; Bao, X.; Wu, B.; Liu, Z.; Huang, B. Manganese species in methane sulfonic acid as the solvent for zinc-manganese redox battery. Mater. Chem. Phys. 2019, 228, 75–79. [Google Scholar] [CrossRef]
- Xie, Z.; Liu, B.; Xie, C.; Yang, B.; Jiao, Y.; Cai, D.; Yang, L.; Shu, Q.; Shi, A. Chemically reduced graphene oxide paper as positive electrode for advanced Zn/Ce redox flow battery. Mater. Chem. Phys. 2018, 220, 208–215. [Google Scholar] [CrossRef]
- Riyadh, K.H.; Ayad, A.S. New Formula (22/17) for Calculation of the Total Amount of Intravenous Fluids Given for Pediatric & Neonatal Surgical Operations Weighing up to 20 Kg or 5 Years Age. J. Anesth. Crit. Care 2016, 4, 00161. [Google Scholar] [CrossRef][Green Version]
- Mateer, J.R.; Thompson, B.M.; Tucker, J.; Aprahamian, C.; Darin, J.C. Effects of high infusion pressure and large-bore tubing on intravenous flow rates. Am. J. Emerg. Med. 1985, 3, 187–189. [Google Scholar] [CrossRef]
- Cross, G.D. Evaluation of 3-mm diameter intravenous tubing for the rapid infusion of fluids. Emerg. Med. J. 1987, 4, 173–177. [Google Scholar] [CrossRef]
- Zhang, Y.; Zhou, J.; Chen, X.; Feng, Q.; Cai, W. MOF-derived C-doped ZnO composites for enhanced photocatalytic performance under visible light. J. Alloys Compd. 2019, 777, 109–118. [Google Scholar] [CrossRef]
- Bokuniaeva, A.O.; Vorokh, A.S. Estimation of particle size using the Debye equation and the Scherrer formula for polyphasic TiO2 powder. J. Phys. Conf. Ser. 2019, 1410, 012057. [Google Scholar] [CrossRef]
- Akbarzadeh, F.; Motaghi, M.; Chauhan, N.P.S.; Sargazi, G. A novel synthesis of new antibacterial nanostructures based on Zn-MOF compound: Design, characterization and a high performance application. Heliyon 2020, 6, e03231. [Google Scholar] [CrossRef]
- Gupta, N.K.; Bae, J.; Kim, S.; Kim, K.S. Fabrication of Zn-MOF/ZnO nanocomposites for room temperature H2S removal: Adsorption, regeneration, and mechanism. Chemosphere 2021, 274, 129789. [Google Scholar] [CrossRef]
- Khurshid, F.; Jeyavelan, M.; Hudson, M.S.L.; Nagarajan, S. Ag-doped ZnO nanorods embedded reduced graphene oxide nanocomposite for photo-electrochemical applications. R. Soc. Open Sci. 2019, 6, 181764. [Google Scholar] [CrossRef]
- Pradeepa, S.S.; Rajkumar, P.; Diwakar, K.; Sutharthani, K.; Subadevi, R.; Sivakumar, M. A Facile One-Pot Hydrothermal Synthesis of Zn, Mn Co-Doped NiCo2O4 as an Efficient Electrode for Supercapacitor Applications. Chem. Sel. 2021, 6, 6851–6862. [Google Scholar] [CrossRef]
- Krishnaveni, K.; Subadevi, R.; Raja, M.; PremKumar, T.; Sivakumar, M. Sulfur/PAN/acetylene black composite prepared by a solution processing technique for lithium–sulfur batteries. J. Appl. Polym. Sci. 2018, 135, 46598. [Google Scholar] [CrossRef]
- Hu, C.; Hu, X.; Li, R.; Xing, Y. MOF derived ZnO/C nanocomposite with enhanced adsorption capacity and photocatalytic performance under sunlight. J. Hazard. Mater. 2020, 385, 121599. [Google Scholar] [CrossRef]
- Basaleh, A.S.; El-Sheikh, S.M. Zn (II) Metal-organic Framework Nanoparticles: Synthesis, Characterization and Application as Optical Biosensor for Prostate-Specific Antigen. 2021. Preprint. Available online: https://www.researchsquare.com/article/rs-373949/v1 (accessed on 23 September 2022). [CrossRef]
- Das, J.; Pradhan, S.K.; Sahu, D.R.; Mishra, D.K.; Sarangi, S.N.; Nayak, B.B.; Verma, S.; Roul, B.K. Micro-Raman and XPS studies of pure ZnO ceramics. Phys. B Condens. Matter 2010, 405, 2492–2497. [Google Scholar] [CrossRef]
- Abbas, S.; Mehboob, S.; Shin, H.J.; Han, O.H.; Ha, H.Y. Highly functionalized nano porous thin carbon paper electrodes for high energy density of zero-gap vanadium redox flow battery. Chem. Eng. J. 2019, 378, 122190. [Google Scholar] [CrossRef]
- Lee, K.; Lee, J.; Kwon, K.W.; Park, M.S.; Hwang, J.H.; Kim, K.J. 3D graphene–Ni foam as an advanced electrode for high-performance nonaqueous redox flow batteries. ACS Appl. Mater. Interfaces 2017, 9, 22502–22508. [Google Scholar] [CrossRef]
- Hou, T.; Tang, G.; Sun, X.; Cai, S.; Zheng, C.; Hu, W. Perchlorate ion doped poly pyrrole coated ZnS sphere composites as a sodium-ion battery anode with superior rate capability enhanced by pseudocapacitance. RSC Adv. 2017, 7, 43636–43641. [Google Scholar] [CrossRef]
- Kundu, D.; Adams, B.D.; Duffort, V.; Vajargah, S.H.; Nazar, L.F. A high-capacity and long-life aqueous rechargeable zinc battery using a metal oxide intercalation cathode. Nat. Energy 2016, 1, 16132. [Google Scholar] [CrossRef]
- Suresh, S.; Ulaganathan, M.; Swarthy, R.; Ragupathy, P. Enhancement of bromine reversibility using chemically modified electrodes and their applications in zinc bromine hybrid redox flow batteries. ChemElectroChem 2018, 5, 3411–3418. [Google Scholar] [CrossRef]
- Mathiyalagan, K.; Ponnaiah, A.; Karuppiah, K.; Rengapillai, S.; Marimuthu, S. Enhanced performance on layered O3-Na 0.95 CrO2 cathode material for emerging sodium-ion batteries. Ionics 2020, 26, 3929–3936. [Google Scholar] [CrossRef]
- Wylie, L.; Blesch, T.; Freeman, R.; Hatakeyama-Sato, K.; Oyaizu, K.; Yoshizawa-Fujita, M.; Izgorodina, E.I. Reversible Reduction of the TEMPO Radical: One Step Closer to an All-Organic Redox Flow Battery. ACS Sustain. Chem. Eng. 2020, 8, 17988–17996. [Google Scholar] [CrossRef]
- Li, W.; Fu, H.C.; Li, L.; Cabán-Acevedo, M.; He, J.H.; Jin, S. Integrated Photo electrochemical Solar Energy Conversion and Redox Flow Battery Devices. ECS Meet. 2017, 42, 1887. [Google Scholar] [CrossRef]
- Chen, R.; Kim, S.; Chang, Z. Redox flow batteries: Fundamentals and applications. In Redox: Principles and Advance Applications; Intech Open: London, UK, 2017; pp. 103–118. [Google Scholar] [CrossRef]
- Chakrabarti, M.H.; Roberts, E.P.L.; Saleem, M. Charge/discharge performance of a novel undivided redox flow battery for renewable energy storage. Int. J. Green Energy 2010, 7, 445–460. [Google Scholar] [CrossRef]
- Ulaganathan, M.; Aravindan, V.; Yan, Q.; Madhavi, S.; SkyllasKazacos, M.; Lim, T.M. Recent Advancements in All-Vanadium Redox Flow Batteries. Adv. Mater. Interfaces 2016, 3, 1500309. [Google Scholar] [CrossRef]
- Ulaganathan, M.; Suresh, S.; Mariyappan, K.; Periasamy, P.; Pitchai, R. New zinc–vanadium (Zn–V) hybrid redox flow battery: High-voltage and energy-efficient advanced energy storage system. ACS Sustain. Chem. Eng. 2019, 7, 6053–6060. [Google Scholar] [CrossRef]
- Roe, S.; Menictas, C.; Skyllas-Kazacos, M. A High Energy Density Vanadium Redox Flow Battery with 3 M Vanadium Electrolyte. J. Electrochem. Soc. 2016, 163, A5023. [Google Scholar] [CrossRef]


Publisher’s Note: MDPI stays neutral with regard to jurisdictional claims in published maps and institutional affiliations. |
© 2022 by the authors. Licensee MDPI, Basel, Switzerland. This article is an open access article distributed under the terms and conditions of the Creative Commons Attribution (CC BY) license (https://creativecommons.org/licenses/by/4.0/).