Review

Review on Active Distribution Networks with Fault Current Limiters and Renewable Energy Resources

by
Adel A. Abou El-Ela
1,
Ragab A. El-Sehiemy
2,*,
Abdullah M. Shaheen
3 and
Aya R. Ellien
1
1
Electrical Engineering Department, Faculty of Engineering, Menoufiya University, Shebin El-Kom 33516, Egypt
2
Department of Electrical Engineering, Faculty of Engineering, Kafrelsheikh University, Kafrelsheikh 33516, Egypt
3
Department of Electrical Engineering, Faculty of Engineering, Suez University, Suez 43533, Egypt
*
Author to whom correspondence should be addressed.
Energies 2022, 15(20), 7648; https://doi.org/10.3390/en15207648
Submission received: 1 September 2022 / Revised: 24 September 2022 / Accepted: 13 October 2022 / Published: 17 October 2022

Abstract

:
To cope with the increasing energy demand, power systems, especially distribution networks, face many challenges. Recently, these networks have become complex and large, and their stability and reliability are not easy to be handled. The integration of renewable energy resources and at the same time limiting their accompanied high fault currents is one of the approvable suggestions. Many solutions have appeared to restrict the fault currents, but fault current limiters (FCLs) arise as an efficient and promising solution to whether to interrupt or limit the fault currents to allowable limits. This paper presents a literature review of the integration of renewable energy resources as distributed generation units (DGs) and FCLs in distribution networks. The DGs can be categorized based on their size and ability to deliver active or reactive power in addition to their fuel. All of solar, wind, water, biomass, geothermal, and fuel cell are utilized as the main engine for these units. Additionally, a survey about FCLs is provided, including their diverse types and applications in either medium- or low-voltage networks. FCLs are divided into reactor, pyrotechnic, non-superconducting (solid state), and the last-developed ones, superconducting FCLs. In addition, the implemented optimization techniques are summarized to correctly employ both FCLs and DGs. These techniques vary between classical and modern, whereas more methods are developed to suit the renewable energy intermittence and uncertainty and the power system operators’ aspirations. Moreover, in this paper, the optimal allocation of diverse types of DGs correlated with FCLs is presented and applied to the real Egyptian distribution network of the East Delta Network (EDN). The results show the avails obtained where the power losses are significantly reduced, with respect to the total load, from 3.59% in the initial case to 0.296%. In addition, the fault current returns to its initial value, removing the percentage of increase of 20.93%.

1. Introduction

Electricity has become a necessity—no longer a luxury—where life almost stops without electricity. Among power system networks (generation, transmission, and distribution), the last networks form the most critical ones as they greatly affect the whole system reliability and the quality of the service. In addition, the operation of the distribution networks can determine 90% of the reliability of the system introduced to the customers whilst both generation and transmission can determine the rest [1]. In order to meet the high demand for electrical power and accelerating loads, power system operators seek to supply more electrical power by the integration of distributed generation (DG) units [2]. These units are connected beside the loads without any need for power plant and transmission network construction. There are many types of DGs that can be classified in terms of size, the type of energy they are based on, and their capability to deliver real and reactive power.
In order to avoid the problems associated with badly allocated DGs, their location, sizing, type, and number should be optimally determined. The optimal allocation of DGs has been widely introduced in the research area, achieving several objective functions, whilst analytical methods and different optimization techniques have been employed to realize this allocation.
As shown in [3], the optimal placements and sizes of DG units were identified in a 33-node system using a circuit-based branch-oriented method in order to reduce power losses. Instead of this method, the identification of susceptible nodes has been assigned to determine the position of DGs in order to reduce actual and reactive losses [4]. The mixed nonlinear programming (MINLP) method was adopted for the classical category to determine the optimal placement of wind-based DGs in distribution systems with minimal power losses [5]. In particular, in [6], a dynamic programming method was employed to investigate the advantages of reduced power losses, improved overall reliability, and grid voltages. This approach, however, does not ensure obtaining a global optimum.
Based on metaheuristic optimization techniques, an improved grey wolf optimizer (GWO) has been implemented to determine the optimal placement and sizing of DGs for different considerations varying between economic, environmental, and technical [7], while the genetic algorithm (GA) has been adapted to select the optimal penetration, location, and sizing of DGs. This approach aims for minimizing power losses in radial distribution systems as the size ranges from 6.25 to 100% of the maximum unit size with a step of 6.25% [8]. In addition, the optimal location and size of the DGs have been selected depending on particle swarm optimization (PSO) [9]. This has been proposed to convert the radial distribution system into a loop regarding the reduction in the voltage difference between the endpoints of the longest feeder. As well, a PSO has been introduced to allocate the DGs for only minimizing the active power losses [10]. Looking at the voltage enhancement, the research in [11] harnesses a Heap-based optimizer (HO) for optimally allocated DGs. For working on reducing computational time, discrete PSO has been employed for handling the optimal allocation of the DGs of different power factors. This allocation is obtained for power loss minimization and voltage profile improvement [12]. Other than PSO, a global harmony search algorithm has been applied to obtain the optimal placement and sizing of DGs in radial distribution systems [13]. Added to that, reference [14] has a hybridized multiverse optimizer with a space transformation search method and chaotic mapping to optimally integrate the DGs into distribution networks. Considering the economical side, optimal operating capacity, and electricity prices besides the optimal payback investment time, the mixed integer nonlinear programming has been utilized to maintain the optimal DG allocation [15].
Although DG integration in distribution networks has many avails, it is not without some obstacles. These obstacles greatly appear in the malfunction in the protective devices’ operation, as DGs can increase the fault currents to higher values exceeding the predefined limits. Moreover, the higher fault currents accompanied by DGs can override the thermal limits of power system components, leading to the deterioration of these components developing to the expulsion of some. Many solutions have been found to return these higher currents to their initial value, among which fault current limiters (FCLs) have arisen as an economical and reliable solution. The integration of FCLs can be considered as a vital tool to reduce the fault currents to affordable values, which can safely flow through the components and at the same time keep the required coordination between the protective devices. According to this, there is no need to upgrade the protective devices, and this gives the ability to sustain the existing ones [16]. During normal operation, FCLs form a low impedance, so they pose insignificant power losses. On the other side, FCLs introduce a high impedance, as it is required to be apparent only in the fault condition in order to reduce fault currents [17]. According to this, the enhancement of the overall distribution networks’ performance, whether in a steady state or a fault condition, can be handled through both DGs and FCLs.
The more DGs and FCLs are optimally located, the more benefits are obtained. Therefore, many studies have been performed using different methods in order to determine the optimal allocation of DGs and FCLs as to whether this allocation is determined separately or simultaneously.
This paper provides some contributions which can be summarized as:
(1)
It introduces a broad view of DGs and FCLs, their definitions, and their different types.
(2)
It clarifies different aspects from which the optimal allocation of FCLs is determined.
(3)
It presents different optimization techniques harnessed for determining the optimal allocation of both DGs and FCLs.
(4)
This is followed by a practical application, where the test system is a real one; EDN.
(5)
A significant technical profit is obtained through power loss reduction.
This review is modulated as follows; Section 2 provides an overview of DGs including their definition and types; surveys about FCLs and different optimization techniques used for determining the optimal allocation of both DGs and FCLs are presented in Section 3 and Section 4, respectively; Section 5 extends the literature about FCLs’ optimal allocation; finally, Section 6 protrudes the major conclusion of the review besides the proposed future work.

2. Distributed Generation (DG) Units

Distributed generation, or decentralized generation, as it is known in some areas, is an electric source of limited capacity connected to the customer side [2] as presented in Figure 1. According to the energy power association (EPA), it is defined as a small, modular, decentralized, grid-connected or disconnected energy system located in or near the place where the energy is used. In recent years, DGs have been widely used due to their reliability and endurance in addition to their efficiency and economy. Moreover, they are considered as an effective component that clarifies the penetration of renewable energy resources in the network [18]. DGs can be categorized in different terms according to their size and the type of energy on which they operate besides their capability to deliver real and reactive power.
In accordance with their size, DGs have the ability to supply different loads with different sizes; therefore, their capabilities range from tens of VAs to hundreds of MVAs. In general, there are four categories based on DG size; micro DGs (1 W to 5 kW), small DGs (5 kW to 5 MW), medium (5 MW to 50 MW), and large ones (50 MW to 300 MW) [19]. In accordance with the type of energy, there are different kinds based on which DGs can operate. These types can be divided into renewable and nonrenewable energy resources. As renewable energy resources are available forever and are friendly to the environment, most modern DGs are based on renewable energy resources like solar, wind, water, geothermal, biomass, and fuel cell. Recently, more than 90 countries have utilized at least 1 GW generated from renewable energy, whilst 30 countries have consumed 30 GW [20]. In general, the total capacity generated from renewable energy resources has reached 1454 GW in 2016, increasing to 2378 in 2018 (55% PV, 28% wind, and 11% hydropower), which represents 33% of the total world capacity. Moreover, it is expected to grow more and more in the future.
Since the 1970s, the Egyptian government has started testing and evaluating renewable energy applications [21]. In 2016, Egypt could generate 3687 MW from renewables with a percentage of 9.49% of the total energy produced. Down to 2018, it has installed amounts of 3.7 GW of renewable energy resources, including 2.8 GW of hydro and around 0.9 GW of solar and wind power [21]. Moreover, as specified in the integrated sustainable energy strategy (ISES), by 2030 Egypt, aims to produce 20% of its total capacity through renewable energy resources, reaching 42% by 2050.

2.1. Solar Energy

Generally, the amount of sunlight hitting the earth in one hour equals the total annual primary energy used by the world [22]. Through photovoltaic cells (PVs) and concentrating solar power (CSP), electricity can be generated from the sun whether via its light or its heat, respectively. Egypt is considered one of the most suitable regions for generating solar energy besides thermal heating. The total energy generated by PV was 6 MW in 2013, whilst 30 MW of off-grid was implemented at the end of 2016 [21].
For the PVs, the basic unit is the PV cell, which was discovered by Edmond Becquerel. It became available after the development of the processing of semiconductor silicon in the 1960s [22]. Furthermore, solar PV has become more applicable where there has been a significant growth rate of power during the last years [20]. When a photon penetrates the silicon PV, it gives the sufficient electron energy to become a free one, leaving the hole. Numerous photons help in creating more electron-hole pairs where voltage is developed between the two different charges as shown in Figure 2. Each cell can be presented in an equivalent circuit as shown in Figure 3.
Each cell can provide 2.4 A with an output voltage from 0.5 to 0.6 V according to its size. The basic unit in the PV system is the PV cell, whereas the combination of cells (series and parallel) forms modules; combining these modules results in PV panels, whilst some panels can create the PV array.
Considering the environmental effects, each cell can be presented in an equivalent circuit, as shown in Figure 3 [23]. Rs is the series resistance of the small value which presents the contact between the metal and the internal resistance of the semiconductor, while Rsh is the parallel one that has a large value and indicates the losses accompanied by the leakage current of the parallel path where [23]:
I = I P V I d 1 I s h
I = I p h I s [ exp ( V + I R s n V T ) 1 ) ] [ V + I R s R s h ]
As PV is affected by environmental conditions like solar radiation besides the temperature, and the PV current is represented by:
I p h = [ I s c r + K 1 ( T c T r e f ) ] G G r e f
One of the most important characteristics of the solar panel is the form factor (FF), which indicates the voltage/current characteristics of the solar panel and is given by:
F F = P max V o c I s c
The common value of this factor is between 0.4 and 0.8 whilst its value in ideal PV panels is 1.
For the CSP, the mechanism is different as it depends on the radiation of the sun. The sun’s radiation is focused on concave mirrors. These mirrors can collect the heat accompanied by this radiation at a certain point, which in turn boils water until it reaches steam, turning a turbine. This type can perform better in areas with a high direct normal component of solar radiation. Whether PV cells or CSP, this type of energy is suitable for peak loads [2]. This type of energy has become applicable as the total capacity generated reached 16.6 GW in 2018, where USA and Spain are considered leading countries. In Egypt, the first solar thermal power plant integrated with a combined cycle one was established in Kuraymat with a capacity of 140 MW [21].

2.2. Wind Energy

This type of energy is not new but it has been used for decades. The IEA has regarded wind as the most competitive type of renewable energy among the rest of the renewable energy resources [24]. Wind power provided a capacity of 591 GW in 2018 with the additional power of around 50 GW added to the year 2017 [20]. According to Egypt’s wind Atlas (wind Atlas for Egypt measurement and modeling 1991–2005), Egypt is overgrown with wind energy, especially in the area of the Gulf of Suez [21]. Moreover, this place is one of the best locations for wind power generation in the world. This is because it has a high stable wind speed of 8 to 10 m/s at the height of 100 m. The first wind farm was constructed in Hurghada in 1993 with a capacity of 5.2 MW. Passing to 2015, the capacity increased to 750 MW through constructing new power plants like Zaafarana (545 MW) and the Gulf of El-Zayt (200 MW) [21].
The wind turbine generator (WTG) can be classified according to the orientation of the shaft, as there is a vertical axis wind turbine (VAWD) and a horizontal wind turbine (HAWD) [25]. For VAWD, its shaft is parallel to the ground, while the shaft of HAWD is normal to the ground. HAWD is preferable to VAWD as HAWD operates at lower heights with lower wind speeds as compared to VAWD. In addition, WTG can be categorized with respect to the number of blades and the type of generators used. Looking at the number of blades, most WTGs consist of three blades, as four blades mean additional costs, while WTGs with two blades need to increase both the chords by 50% and the rotational speed by 22.5% in order to match the performance of three blades. Additionally, according to the location of wind turbines, there are two types: offshore, where there are located in the sea, and onshore, where they are sited directly along the shore. Whatever the wind turbines are, there should be a distance between each one in order not to disturb the air between each other, whereas the wind power in the air stream is given as [26]:
P w i n d = 1 2 ρ A r v w i n d 3
P m e c h = 1 2 c P ρ A r v w i n d 3
P e l e c = V I p l v
V is presented (through considering the grid as an infinite bus) as follows:
( V 2 ) 2 [ 2 ( P e l e c R + Q g e n X ) + ( R 2 + X 2 ) ( P e l e c 2 + Q g e n 2 ) = 0

2.3. Water Energy

As 71% of our planet’s surface is full of water, this type of energy can be widely used through different mechanisms. These mechanisms vary between hydropower, marine, and hydrokinetic, but all of them are effective to generate power from water. Hydropower is the most common one, through which water is harnessed to generate power, using which, China produced a considerable amount of energy of more than 300 GW in 2018 [20]. This type of energy depends on the existence of a sufficient height of water (more than 40 m), which should be adequate to create potential energy. Unlike most renewable energy resources, hydropower is not intermittent, so it is suitable for a base load.
Marine and hydrokinetic energy is a new form of energy that enables generating power from water without the need of constructing dams. This energy starts to be applicable as the energy extracted reached 2 MW in 2018 [24]. There are two mechanisms through which energy can be obtained from the ocean: thermal energy from the sun and mechanical energy from the motion of both waves and tides [24]. Thermal energy from the sun is defined as ocean thermal energy conversion (OTEC) where the power is generated from the temperature difference between the surface and the deep ocean. On the other side, energy is extracted whether from the surface wave or from the fluctuations below the surface. As well, the motion of spring and neap tides is used to produce electricity, where there are different types of generating systems like oscillating water columns as shown in Figure 4. This figure illustrates an oscillating water column system, which counts on the motion of water whether incoming or outgoing. The incoming waves compel the top air column to turn the turbine whilst the outgoing waves pull the air column down to turn the turbine.

2.4. Geothermal Energy

It is the only renewable energy resource created by the earth itself [27]. This type of energy source can be used for both heating and generating electricity; the first large municipal district heating service started in Iceland in 1930 [22]. It has become one of the leading countries in geothermal energy as it produced around 750 MW in 2018. This is a non-pollutant source of energy which helps in reducing CO2 by 96% when relying on it instead of coal [28]. This type of energy fits with the base load as enhanced geothermal systems are expected to provide the power of 100 GW of cost-competitive electricity in the USA by 2050 [28]. There are different geothermal energy sources like hot water, natural steam, and geo-pressured reservoirs. Geothermal energy is extracted from about 6400 km below the Earth’s surface, where the temperature reaches 5000 °C. Therefore, there are few places considered as suitable geothermal resources, although this type is available and easy to exploit. The average geothermal gradient in France is 4 °C/100 m, while it reaches 30 °C/100 m in Iceland and volcanic regions [24].

2.5. Biomass (Bioenergy)

The term biomass, or bioenergy, is defined as a renewable energy resource derived from living or recently living organisms. This type of energy has many applications as it is burned directly to produce heat or power, and it can be converted into liquid biofuels. There are three main types of biomass [29]:
(1)
Solid biofuels and renewable waste.
(2)
Biogas (landfill gas).
(3)
Liquid biofuels like biogasoline and biodiesel.
Figure 5 shows anaerobic digestion, which refers to flow temperature biological conversion with a resulting product (biogas). It is typically 60% methane and 40% CO2 [27]. Anaerobic digestion indicates that organic material can easily start a cycle of many applications, instead of being useless. Added to that, it forms a cycle of zero net emissions. Through bioenergy, the world has consumed as much as 581 TWh, developing into 20% of the electricity used by 2030, as the department of energy (DOE) expects [27].

2.6. Fuel Cell (FC)

Fuel Cells are basically batteries in which electrical power is generated, with thermal power and water as co-generation through an electrochemical process. FCs are well known from the early 1960s as they were implemented in the modulated states’ space program in addition to many automobile industry companies [2]. Its output ranges from kW to MW as it is used for both mobile and stationary applications. Additionally, it can operate at different pressure levels. There are different types of FCs, such as Proton Exchange Membrane (PEMFC), Alkaline (AFC), Phosphoric Acid (PAFC), Melton Carbonate (MCFC), Direct Methanol (DMFC), and Solid Oxid (SOFC) [30]. The challenge that faces the operation of FCs is the existence of hydrogen sources, as FC, unlike batteries, which are limited by stored chemicals, can work until there is a source of hydrogen [31]. Accordingly, both MCFC and SOFC have high operation temperatures, which are directed at turning hydrocarbon products into hydrogen. This means that the cell can operate self-independently. Looking at the charger carrier, it differs in MCFC and SOFC. For MCFC, carbonate CO3−2 represents the charger carrier, while it is the oxide O2− in SOFC [30]. For control purposes and converting the DC component accompanied by some of these DG units, all of them are integrated into the distribution network through a voltage source converter (VSC). As with any component, the converter losses may be considered using a generalized losses model, with the conversion losses varying with the quadratic function with the passed current (IVSC), as shown below [32]:
P l o s s _ V S C = A V + B V I V S C + C V I V S C 2
The injected current on the AC side of the corresponding converter can be calculated as:
I V S C = P V S C 2 + Q V S C 2 / V V S C
According to the DGs’ capability to deliver real and reactive power, four types can be summarized as [33] follows:
  • Type 1: this type represents DGs that are capable of injecting both active and reactive powers. This type involves hydro-geothermal and combined cycles. This type has two modes of operation, constant power factor, and constant terminal voltage.
  • Type 2: represents DGs that are capable of injecting only active power. Photovoltaic, micro-turbines, and fuel cells, which need converters to be connected to the grid, are laid under this type. They operate at the unity power factor.
  • Type 3: represents DGs that are capable of injecting only reactive power. This type can be formed in a synchronous compensator.
  • Type 4: represents DGs that are capable of injecting active power but consuming reactive power, such as fixed speed squirrel cage induction generators when operating in super synchronous mode. The generator in this mode can inject active power but demands reactive power. In this type, the consumed reactive power can be calculated as [19]:
Q D G , i = ( 0.05 + 0.04 P D G . i 2 )

3. Fault Current Limiters (FCLs)

Nowadays, modern grids depend on DGs as they promote the distribution network operation, except they cause more excessive currents at the fault condition as in [34]. In this condition, the current can reach 20 times the nominal one [35]. In the case of higher fault currents, extreme power can flow through the components of the system, causing the melting of the conductors and the deterioration of insulators, which may be developed as an explosion in the equipment containing oil and, moreover, a loss of synchronization. To ease fault current effects, protection devices mainly depend on two devices which are fuses and circuit breakers (CBs). A fuse is a small-size and reliable device that can handle fault currents until 200 kA; however, once it is used, it must be replaced. The second cornerstone, CBs, can interrupt remote fault currents, but for high interruption capabilities, they are bulky and expensive. In addition, they allow a few cycles of fault current to pass before they operate. Besides, they need calibration and maintenance. Generally, both fuses and CBs interrupt normal power flow, causing poor voltage regulation and power quality problems [36]. To limit the fault currents, some solutions have been created as [37]:
(1)
The upgrading and replacement of the system components, but it is costly to cope with the raising of the currents.
(2)
Sequential switching, but there are safety risks that fail to prevent CBs to open before the fault current reduces to a sufficient magnitude.
(3)
Network splitting and reconfiguration, which are valid for high-cost smart grid infrastructure.
(4)
Using a power electronic converter interface for DG units, but they can be regarded as a source of harmonics.
(5)
Using an air core transformer, but it is connected at all times, causing high power losses.
(6)
Increasing the impedance of the system such as FCLs.

3.1. FCLs Applications and Conditions

FCLs, devices that reduce prospective fault currents to a lower, manageable level [38], are regarded as applicable and effective tools. They depend on inserting impedance into the grid, limiting high fault currents. With FCLs integrated into power systems, the procedures have the opportunity to avoid equipment replacement and damage and use a lower fault-rated one [36]. Moreover, FCLs form a low impedance at normal operation where the power flow is unobstructed. They have several applications as they can be applied in transmission [39,40] and distribution networks [41,42]. Additionally, they can be utilized in both alternating and direct current systems [39,43]. To enhance the system stability [44] and fault through capability [45], FCLs are used as well. However, there are certain conditions in which FCLs are vital in these applications, such as [36,37]:
(1)
Sufficient low impedance at normal operation whilst possessing large values during fault conditions.
(2)
Quick appearance when the fault occurs, as they should work within the first cycles of the fault current, and also, at the same time, they should return rapidly to their initial values after fault elimination.
(3)
Reliable current limitation.
(4)
Can withstand any current magnitude or any kind of fault.
(5)
Do not affect the coordination of protective devices.
(6)
Small size, low cost (operational and maintenance), and long lifetime.

3.2. Development of FCLs

Work on enhancing the properties of FCLs is continued, but there are three major technologies which in turn help in ameliorating the quality of FCLs. They can be clarified as follows [38]:
(1)
The purification of Yttrium Barium Copper Oxide (YBCO) superconductors for coated conductors with a reasonable cost.
(2)
Advancement in the development of Magnesium Diboride (MgB2) superconductor wire designed specifically with FCL properties.
(3)
The development of a Silicon Carbide (SIC)-powered electronic device.

3.3. Types of FCLs

Work on the modification of FCLs’ performance has attracted a lot of researchers. This helps in finding new enhanced types that match with the applications of higher ratings. Generally, FCLs can be classified as:

3.3.1. Fault Current Limiting Reactor

It is the simplest one that consists of a limiting coil, as seen in Figure 6 [43]. This coil has large inductive reactance and low ohmic resistance [38]. Such FCLs can be divided into two types: air core and iron core, where the limiting impedance depends on the magnitude of the fault current. Unlike the iron core, the air core does not suffer from saturation, so its impedance is independent [38].

3.3.2. Pyrotechin Fault Current Limiter (Is-Limiter)

The Is-Limiter, which was created in 1995, consists of an ultrafast-acting switch and a contactor connected in parallel to a high interrupting fuse [38]. At a fault condition, a high external trigger provides the main path for the fault current to transfer to the fuse. This fuse can limit the fault current to 0.5 ms and then interrupt it in the next zero-voltage moment [46]. Finally, the Is-limiter is disconnected after operation by the service. This operation needs an electronic measurement device as an additional circuit to determine if the passing current needs to be interrupted or not. This limiter can let the existing devices run as they are not replaced but it is not non-resettable [38].

3.3.3. Superconducting Fault Current Limiters (SCFCLs)

Superconducting materials are those that can carry electrons from one atom to another without any resistance [46]. These materials have two states, the normal and superconducting states, where the transition from one state to another mainly depends on the current, magnetic field, and temperature. Below the critical current, as shown in Figure 7 [47], the material has no resistance (superconducting state), while, when the current increases until it reaches its critical value, the quench operation occurs, and the material transfers to its normal state. In this state, there is a great resistance besides high temperature, so a cooling system must be created. According to the temperature generated, superconductors can be categorized as low-temperature superconductors (LTSC) and high-temperature superconductors (HTSC) [48,49]. For LTSC, the transition temperature is below 25 Ko, and the cooling system, which is liquid helium, reduces the temperature to 4.2 Ko. The new version of superconductors, HTSC, can be cooled by liquid nitrogen and can operate at 77 ko [38].
The nature of the superconducting materials has been harnessed to be implemented in FCLs where the first SCFCL is 12–100 FCL. It can operate at 12 kV and 100 A. This has been fabricated by Nexans superconductors (NSC) GmbH and installed in Bamber Bridge, UK as a busbar coupler. The second one has been developed to work in 12 kV and 800 A systems. It is the first HTS device to work in a thermal power plant. Both SCFCLs have been used since the last quarter of 2009 [50]. According to the structure and operation, SCFCLs can be divided into inductive and non-inductive-type SCFCLs. Non-inductive-type SCFCLs consist of two superconducting coils, which can be formulated as a current-limiting coil and a trigger coil. The two coils are connected antiparallelly and magnetically coupled, as presented in Figure 8 [17]. There are many configurations, such as coaxial coil and bifilar winding, which are superior as they have a high impedance ratio. On the other hand, the inductive type consists of primary and secondary coaxial coils with a magnetic core [51]. The primary coil is made of copper, while the secondary one is made of HTS.

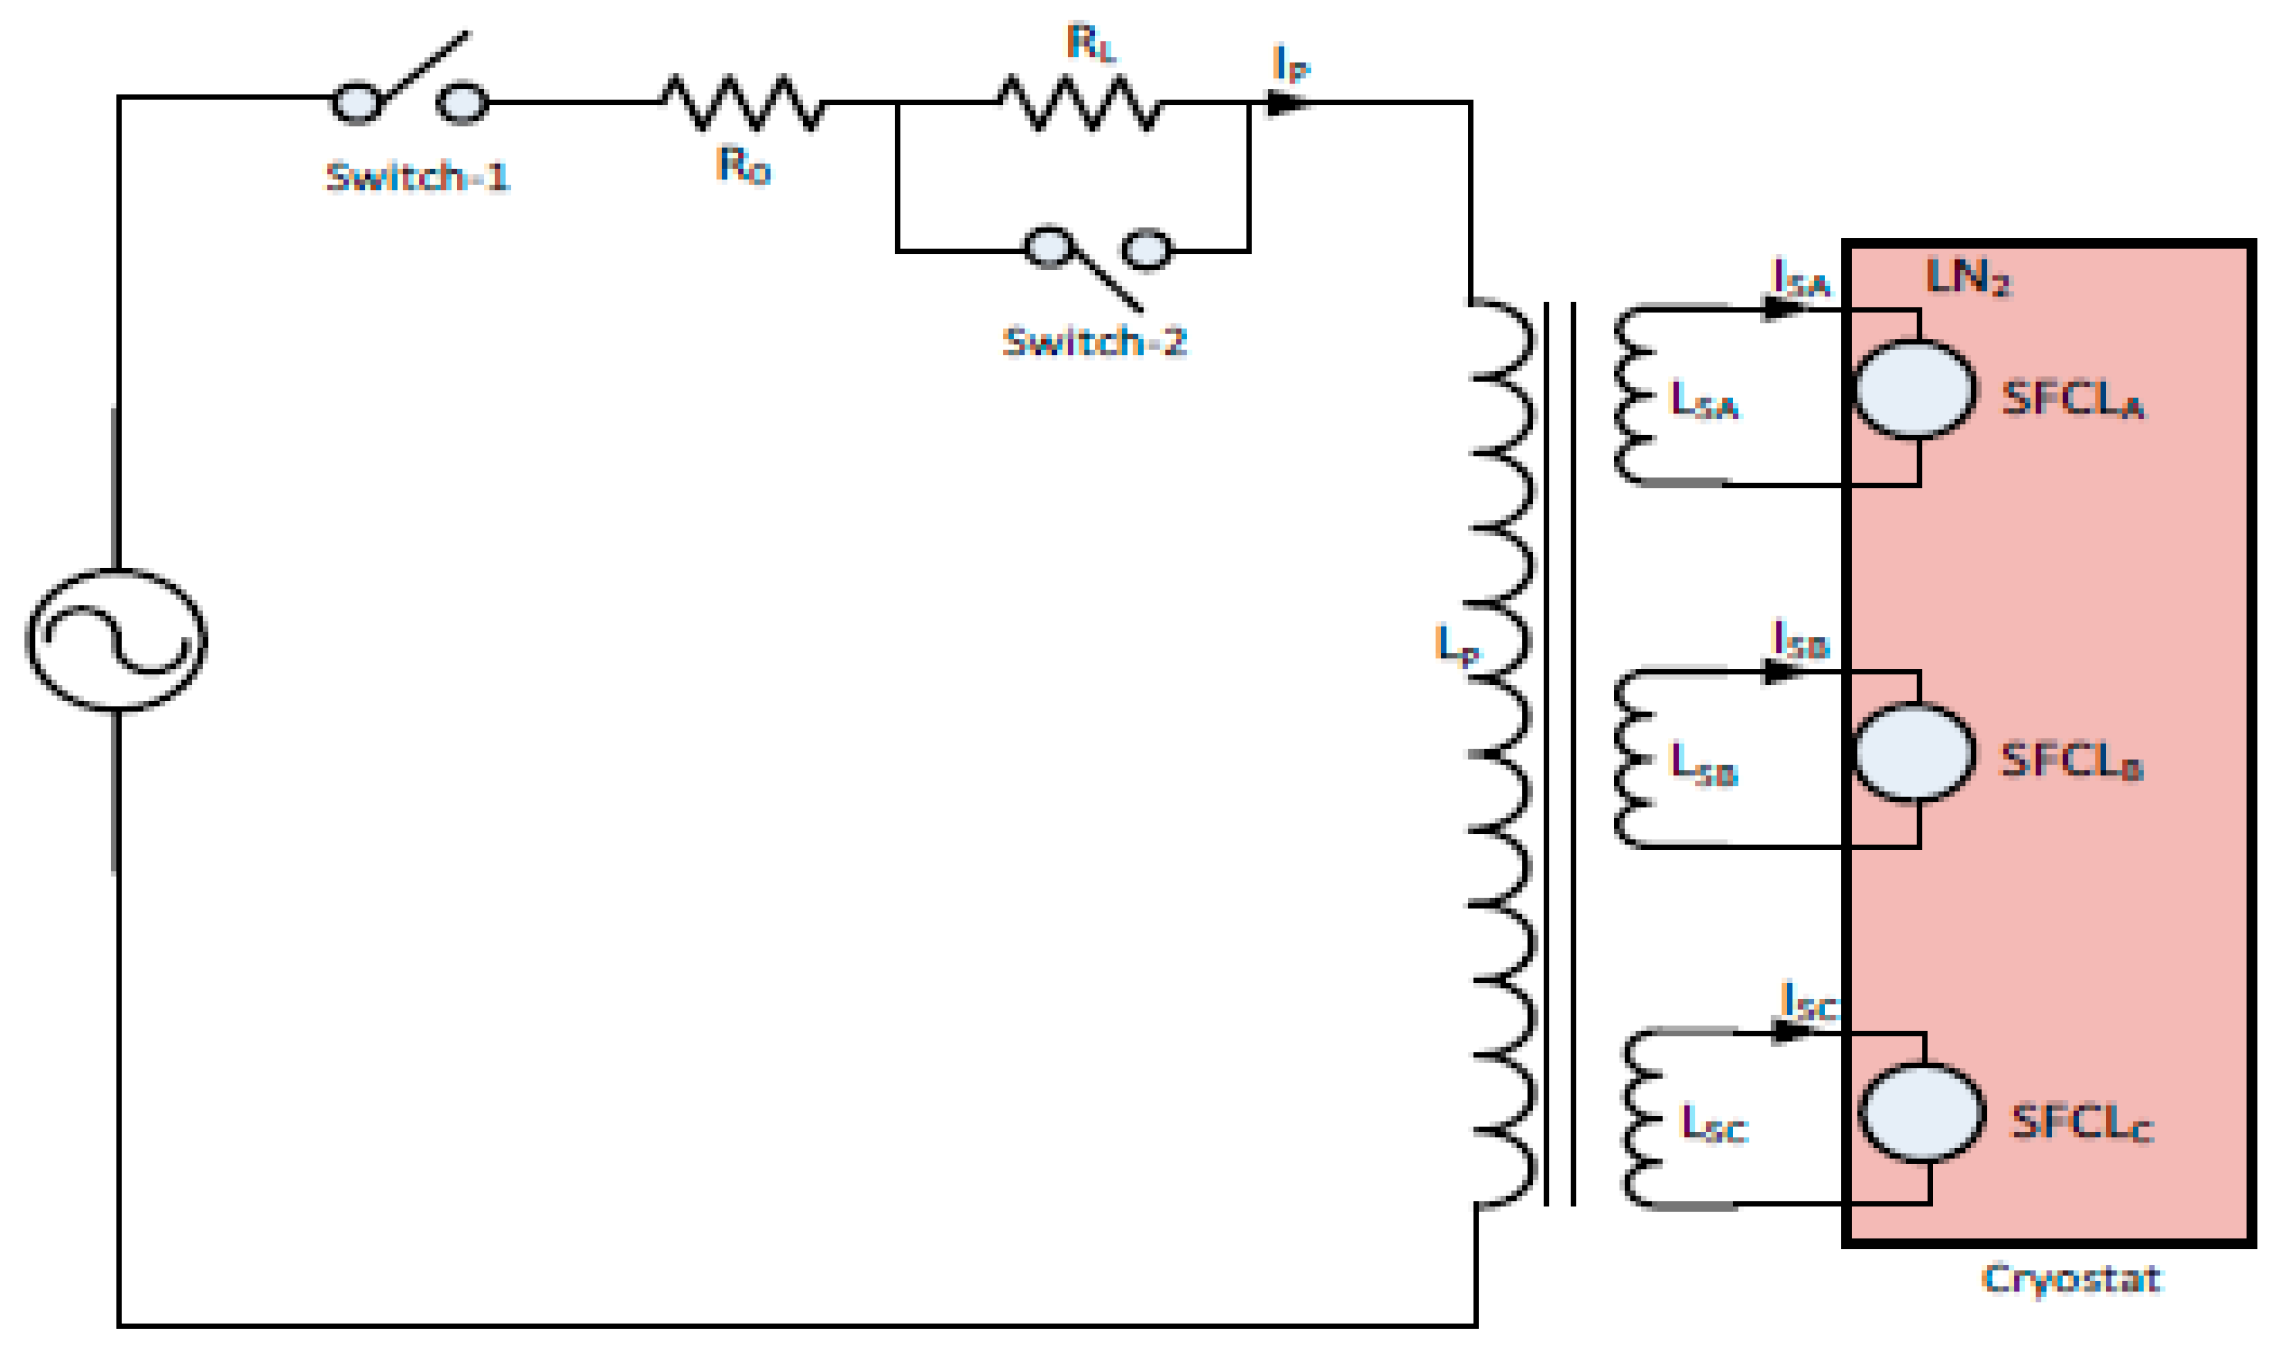
Inductive Shield SCFCL

As shown in Figure 9, it is about the secondary side, which is the superconducting coil (SC coil) and the bypass winding lapped around the iron core, and the primary side as the power line [38]. During the normal operation, where the material appears in its superconducting state, the secondary coil shields the iron core from the primary coil. This means that the magnetic flux generated by the primary is not able to penetrate the iron core, so the impedance transferring to the primary is very low. On the other side, the superconducting coil losses its superconductivity at the fault condition so the magnetic field can pass through the iron core, forming a high impedance at the primary side. In this state, bypass winding can provide a path for the flowing current. This in turn reduces the energy produced in the SC coil and produces a counter-induction, reducing the current in the primary coil. Generally, the idea of this device depends on the full diamagnetism of the superconducting materials, which was first discovered by Meibner and Oshsenfeld [38].

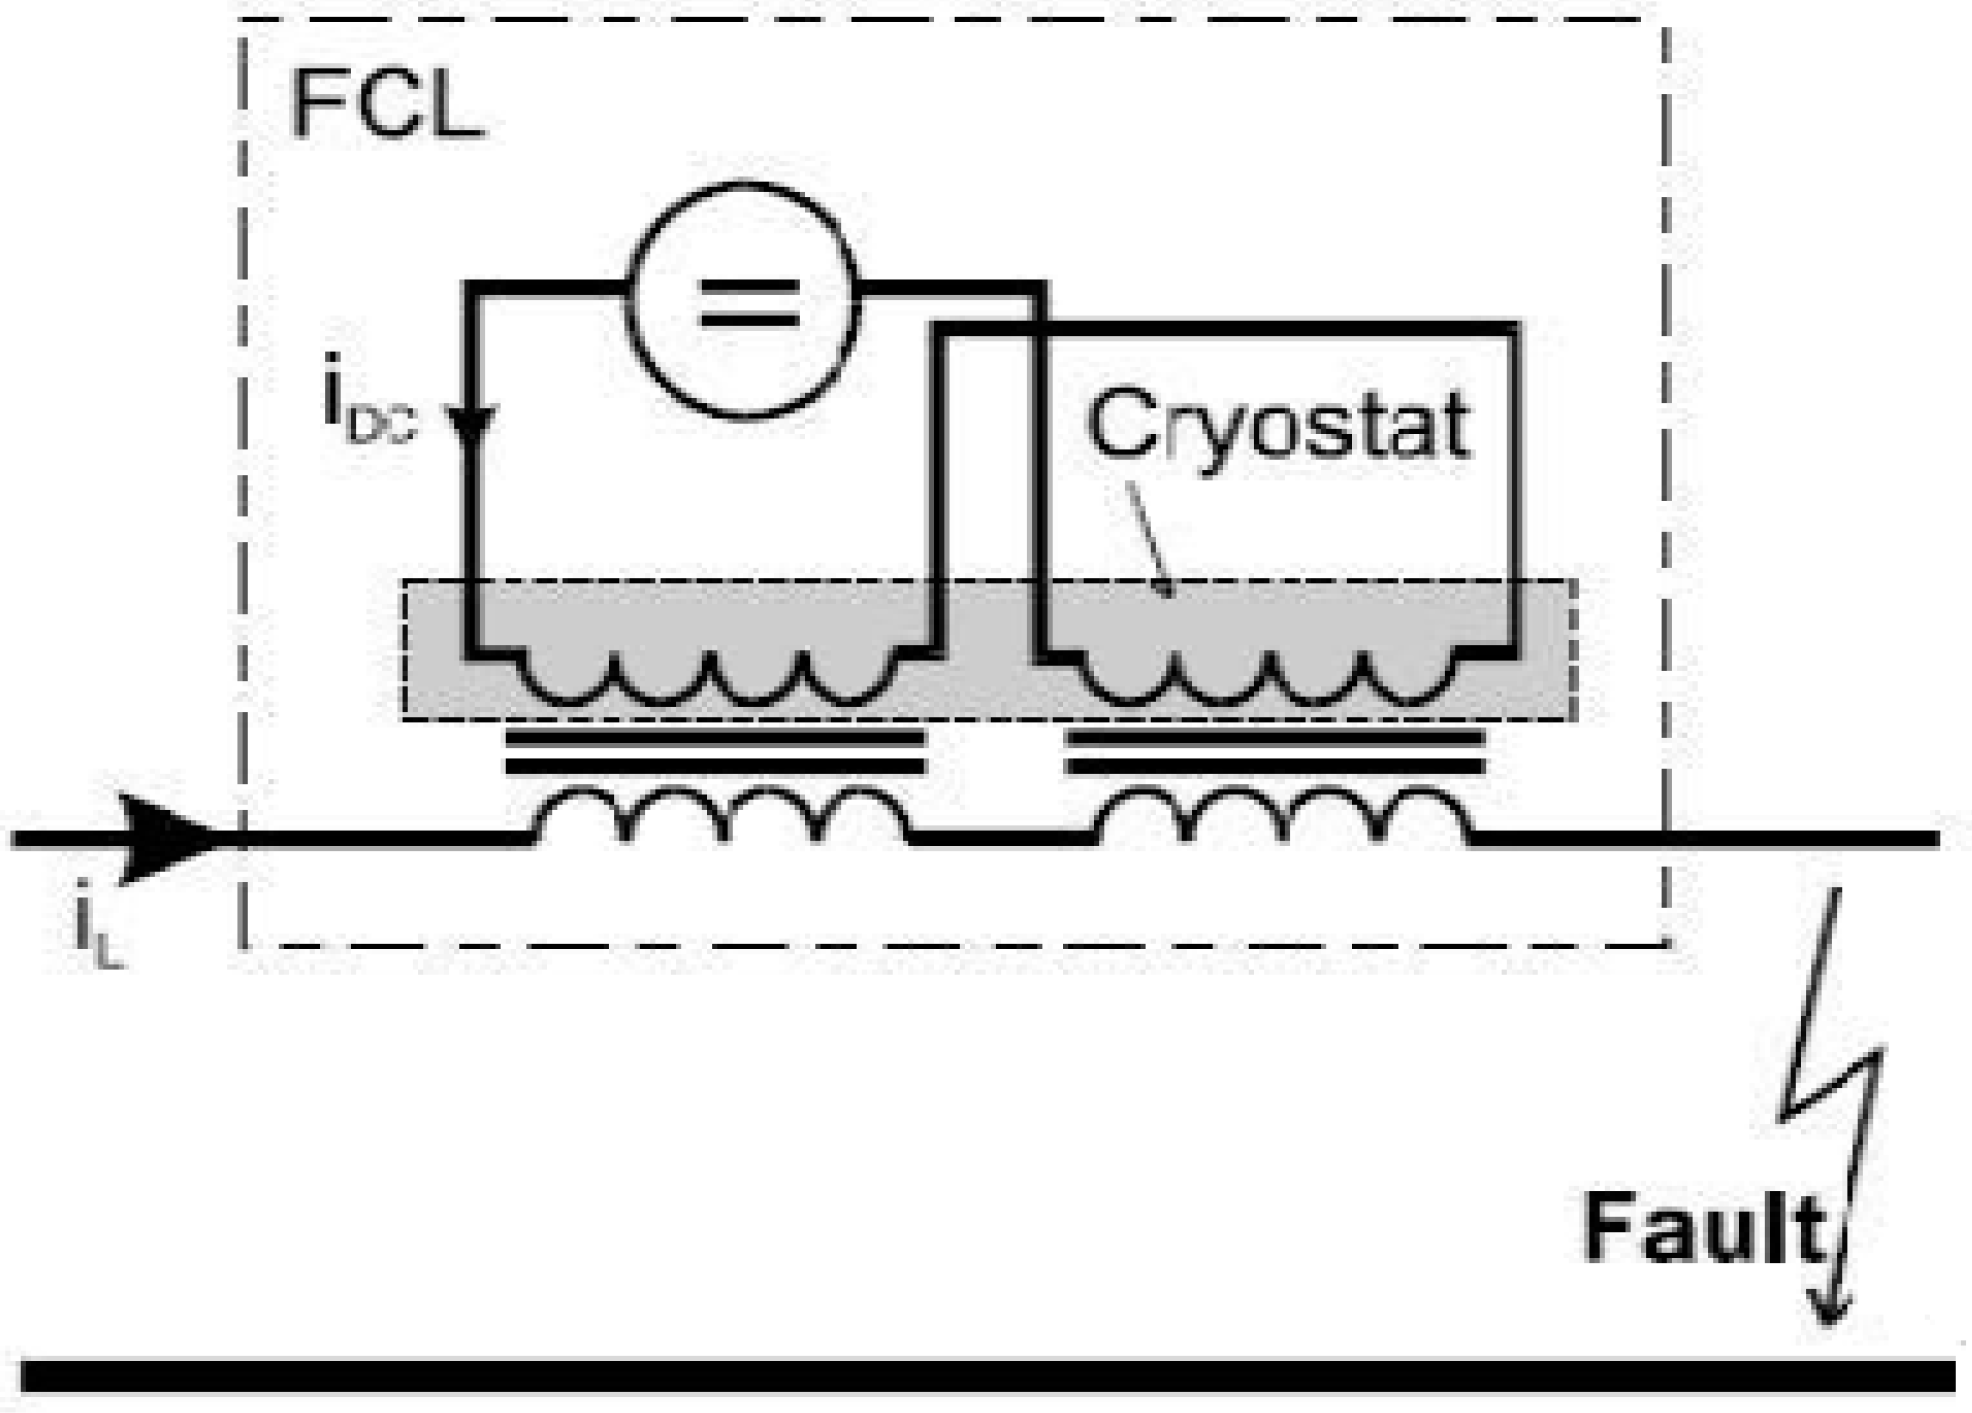
Saturated Iron Core-Type SCFCL

It is composed of two iron cores (each for a half cycle), AC windings, superconducting DC winding wrapped around each core, DC power, and a control circuit [38]. During normal operation, the DC source can feed the superconducting winding which in turn produces DC magnetic field. This field saturates the two iron cores; therefore, there is no impedance, whereas when a disturbance occurs, the control circuit plays its role as it can disconnect the DC magnetizing coil just after the fault happens. This fault current produces a large inductive electromagnetic force in the two AC coils, which in turn limits the current. This type has superiority, as the superconducting material does not have to transfer to its normal state. Figure 10 presents this type.

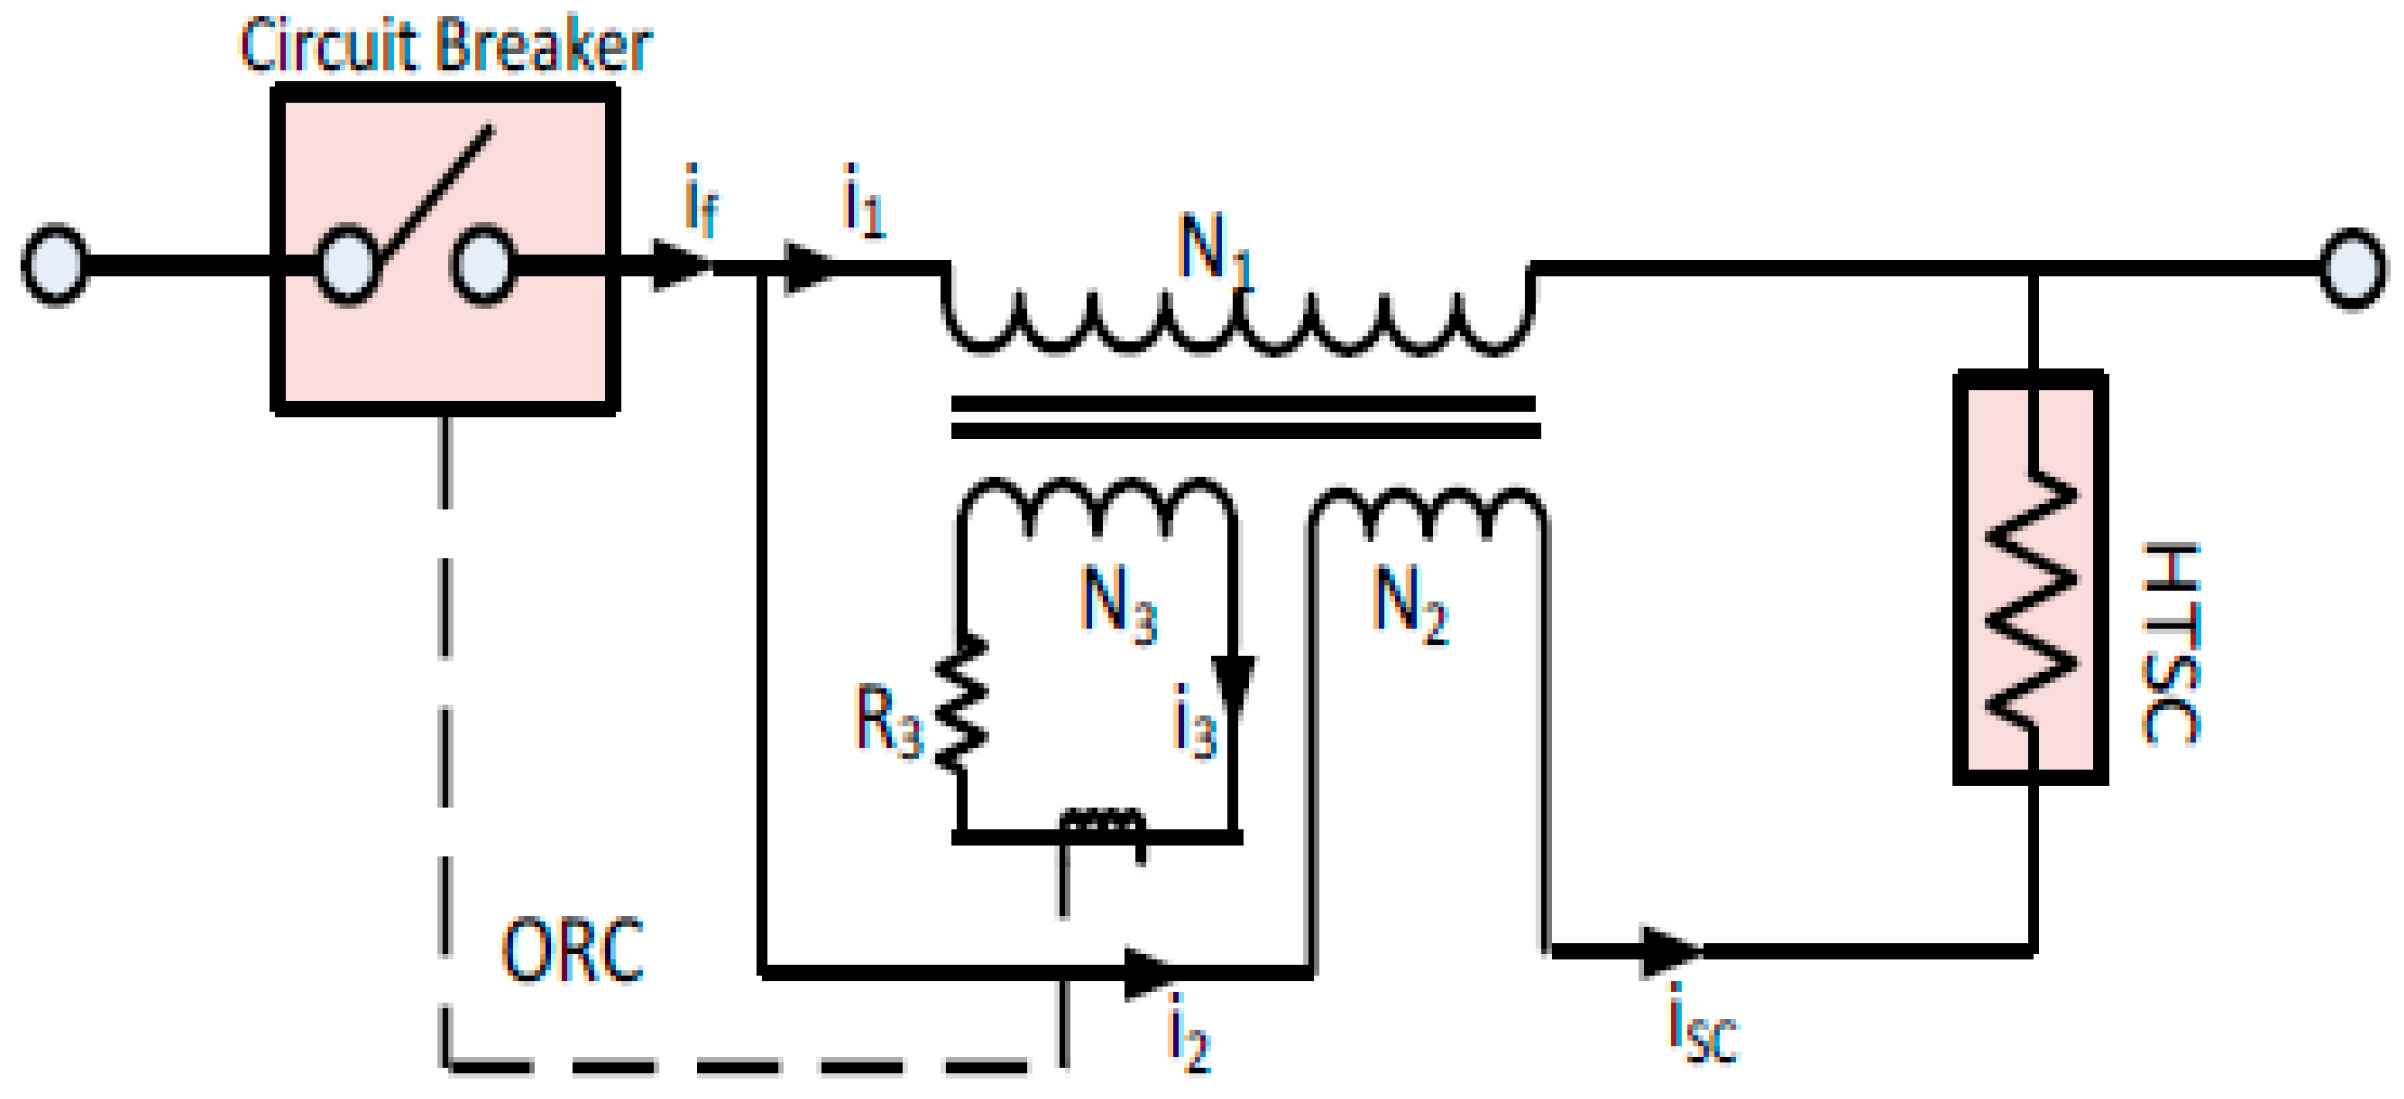
Transformer-Type SCFCL

The primary side of the transformer is connected in series with the load, while the secondary one is connected in series with superconductors as shown in Figure 11 [46]. The transformer is connected to a vacuum interrupter as a switch, where L1 and L2 are the self-inductance of the primary and secondary, respectively, and M is the mutual inductance between the two coils. During normal operation, the material can exist in its superconductivity so there is no impedance. However, at the fault condition, quench operation occurs, and the current is limited in the secondary side, so it is limited dependably in the primary one. This type is implemented to enhance both the system stability and reliability, as in [52]. The transformer type has some advantages as it provides isolation between the power line, and the current-limiting part beside it has a flexible design [53].

Resistive-Type SCFCL

Such a type is used to enhance the transient stability of the system as it suppresses the fault current in a quick and efficient manner [54]. It consists of two resistances which are known, according to their function, as stabilizing and superconducting resistances beside a series-connected coil, as shown in Figure 12 [17]. During normal operation, the resistance keeps its superconductivity, so it does not pose losses where the coil has a small value as well that forms small AC losses. However, the resistance is quenched and limits the fault current in the faulty condition. This type has a high length of superconductor which makes it uneconomical.

Hybrid SCFCL

This type can be used to improve the dynamic performance of the system [55] besides solving the difference of the critical currents among the units, which can be observed in the resistive and inductive types. This type, as presented in Figure 13 [55], is composed of the primary winding and several secondary windings which are connected in series with superconductor resistance. This resistance is obtained through normal operation, so its value is zero while it is transformed to its normal state to limit the fault current during the fault condition.

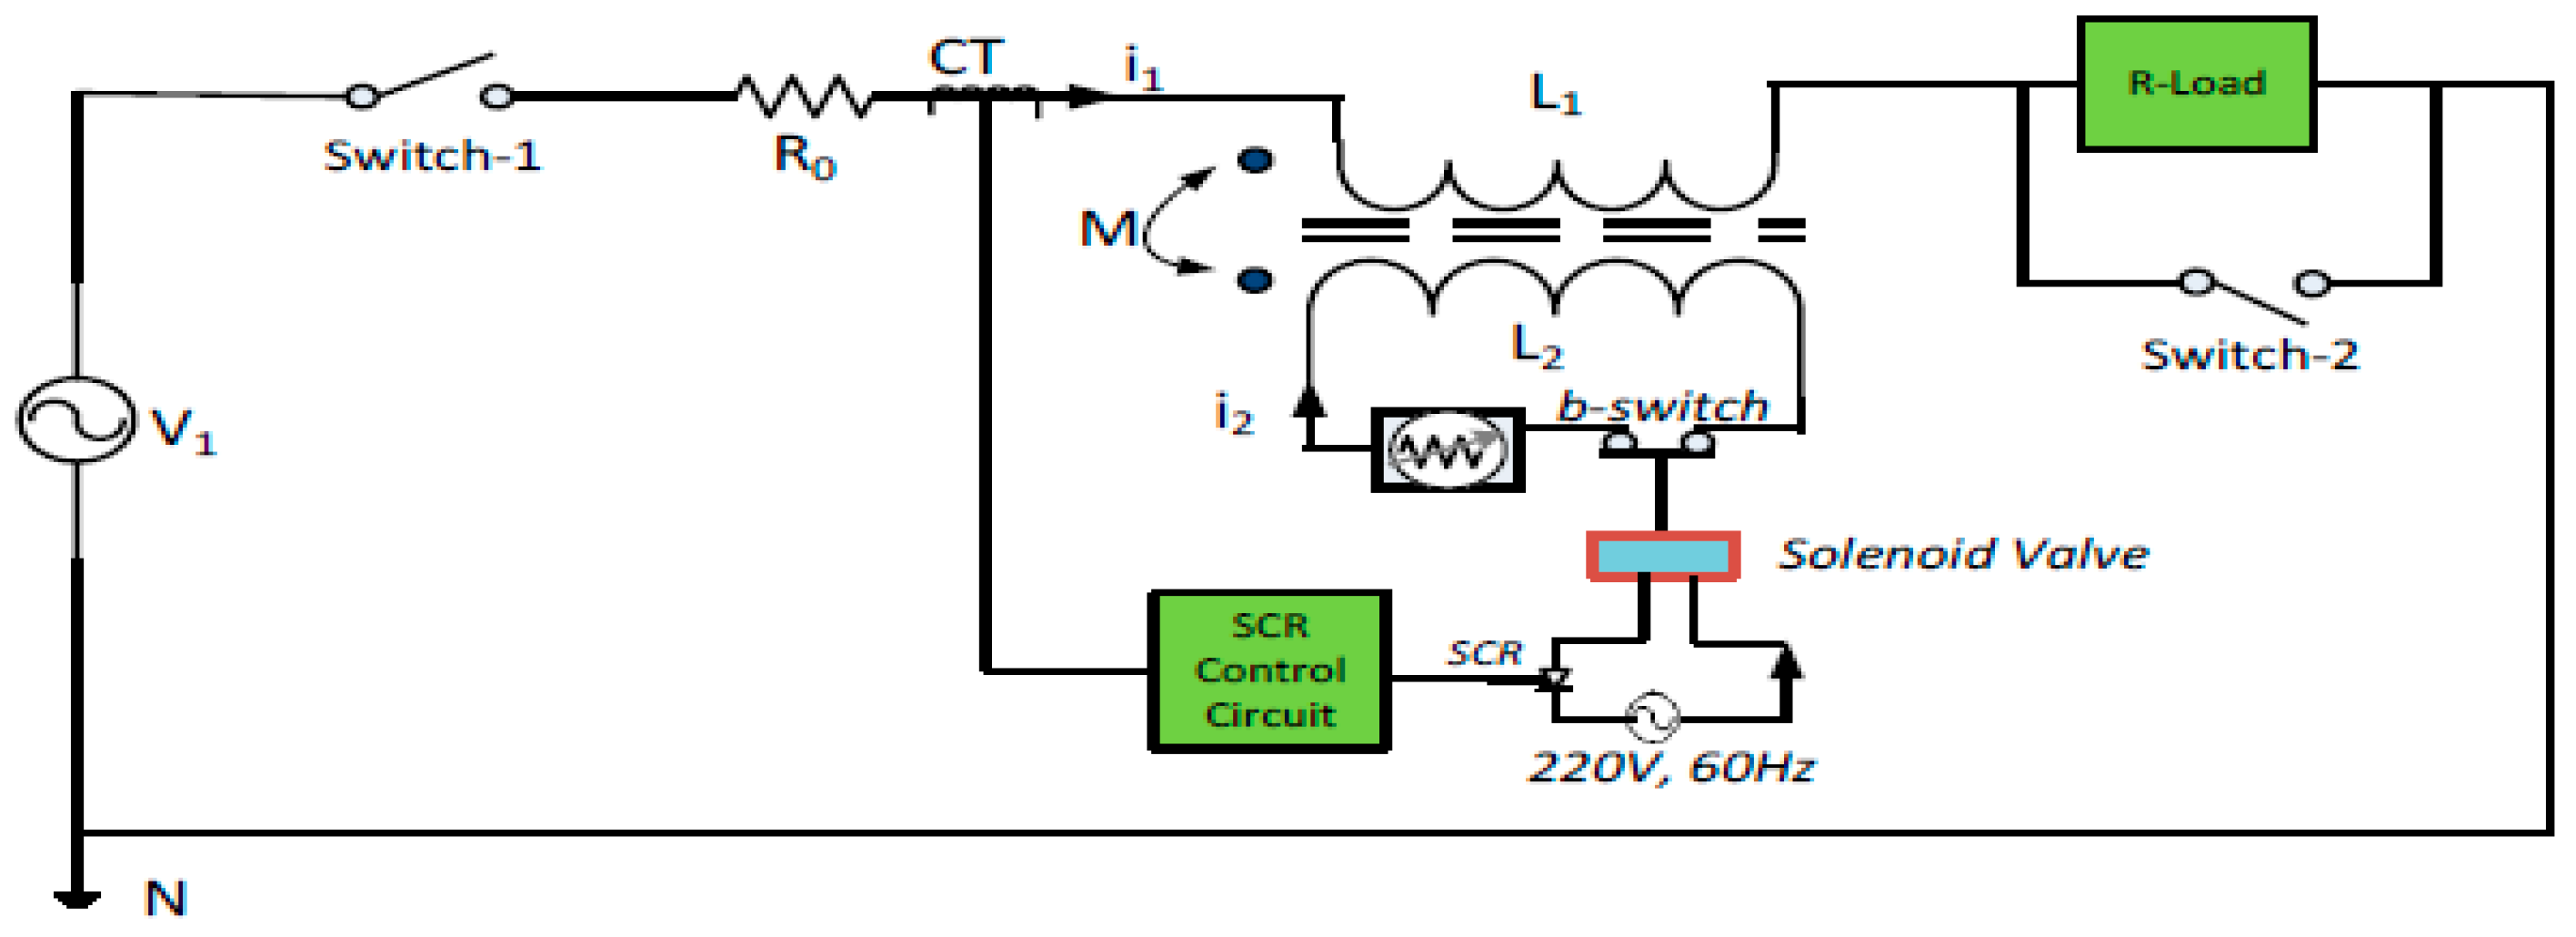
Flux Lock-Type SCFCL

Flux lock SCFCL, as shown in Figure 14 [17], consists of two parts: a current-limiting part and a current-interrupting part. The first part has two parallel connecting coils with one connected with HTSC, whilst the current-interrupting part is composed of an over-current relay, which takes its signal from one coil, in addition to a circuit breaker. During normal operation, zero voltage is deduced across the coils whilst the current is limited during the fault condition throughout the voltage deduced across the two coils. Flux lock SCFCL has less power burden compared between the other SCFCLs.

Magnetic Shield-Type SCFCL

This type consists of a primary coil (copper coil) and a secondary coil (HTSC tube), which are wound around a magnetic iron core, as represented in Figure 15 [56]. At the steady state condition, the flux does not penetrate the iron magnetic core, as the HTSC tube is sited between the copper coil and the magnetic core, so there are no losses at this state, while in the fault condition, the HTS tube is quenched, transforming into its normal operation, so its resistance increases, and consequently, the resistance of the primary coil increases the limiting of the fault current.

3.3.4. Non-Superconducting Fault Current Limiters (Solid)

Unlike SCFCLs, FCLs can be implemented with passive nonlinear elements as inductors and switches. Such FCLs are known as non-superconducting fault current limiters (non-SCFCLs). The revolution of semiconducting switches helps in developing non-SCFCLSs with minimal cost as compared to superconducting ones. Within the distribution current level, non-SCFCLs are exposed to high thermal stress, so they should be cooled using either forced air or liquid cooling. Additionally, the voltage, during switching, rises sharply in a short time; therefore, properly tamed snubbers are used beside the bypass and clear switches to take FCLs out from service for maintenance or fixing [35]. There are different types of solid-state FCLs, such as:

Series Switch-Type FCL

It is composed of a bidirectionally controlled semi-conductor switch (Sss) and bypass network, as presented in Figure 16 [35]. This network consists of a normal bypass (Sbp), fault current resistance (Zf), overvoltage protection (Zno), and a snubber circuit. The normal bypass is about a low resistance path for decreasing both switching losses and waveform distortion, while (Zf) is used to limit the fault current. Zno is important to provide an alternative current path to limit the voltage across switching as well as absorb some of the energy stored in the inductance, while the snubber circuit function is to keep with allowable limits [35].

Series Dynamic Braking-Type FCL (SDBRFCL)

It is used in fault rides through the capability enhancement of the wind system [57]. During normal operation, an insulated gate bipolar transistor (IGBT) is tuned on (Vpcc is the voltage of the point of common coupling, and Vref is the minimum voltage on which is the IGBT), and the resistor is bypassed. On the other side, at fault conditions, IGBT is turned off, and the resistor is connected in a series system, as shown in Figure 17 [51].

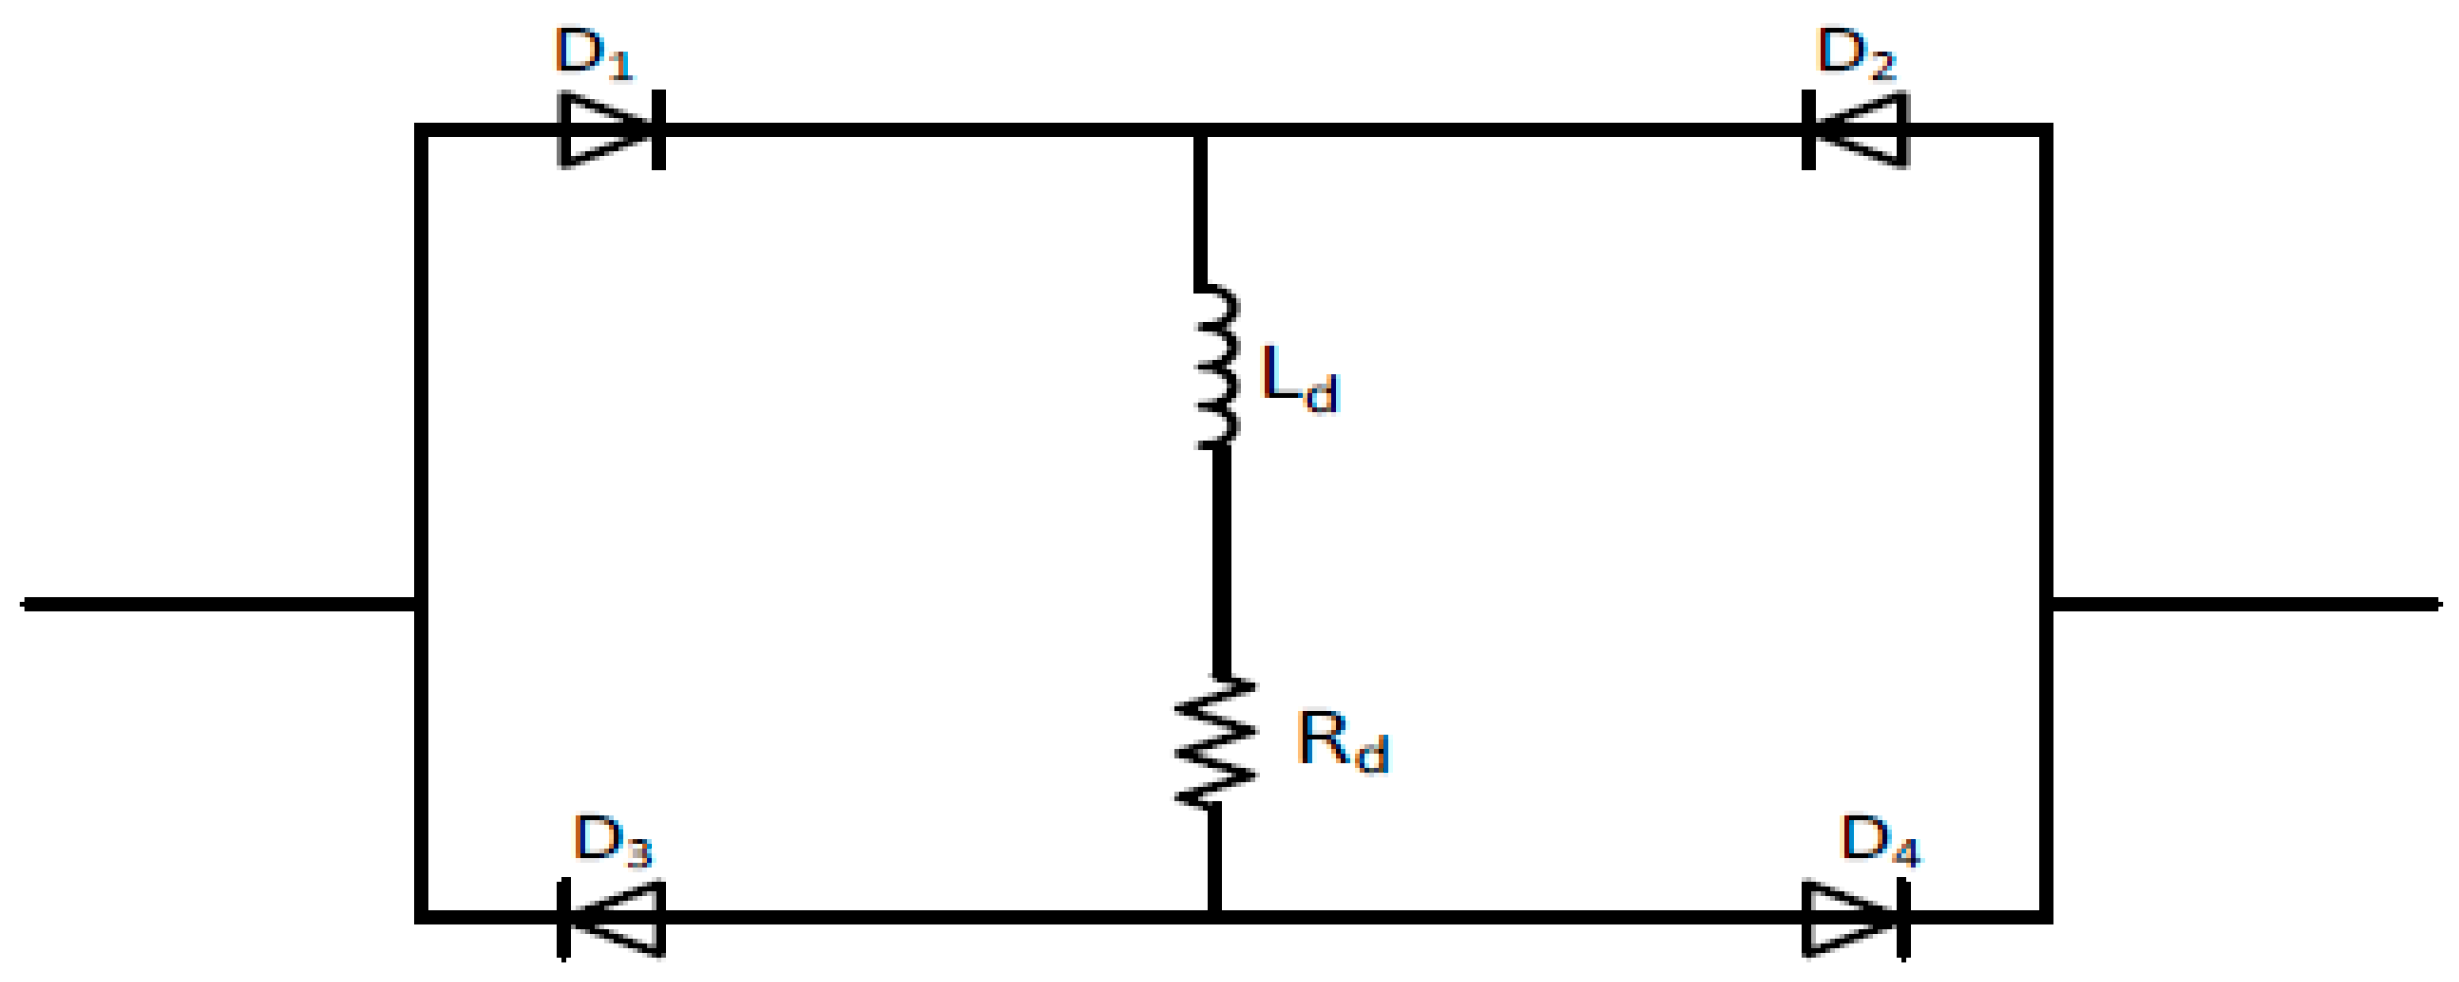
Bridge-Type FCL (BFCL)

This type is composed of two parts: the bridge part and the shunt branch part, as clarified in Figure 18 [17]. During normal operation, the IGBT is turned on, and the current has two paths. In a positive half-cycle, the current flows through the LDC, RDC, and D4. However, the path of D2, LDC, RDC, and D3 is considered its path during a negative half-cycle. Additionally, an LDC of a small value acts like a short circuit; therefore, there is a negligible voltage drop, whereas, through the fault condition, the IGBT is turned off, so the bridge is out, and the current is limited by the shunt branch (Rsh + Lsh). Ds, which is the freewheeling diode, can discharge the current through the LDC so it protects IGBT from high voltages.

Modified Bridge-Type FCL (MBFCL)
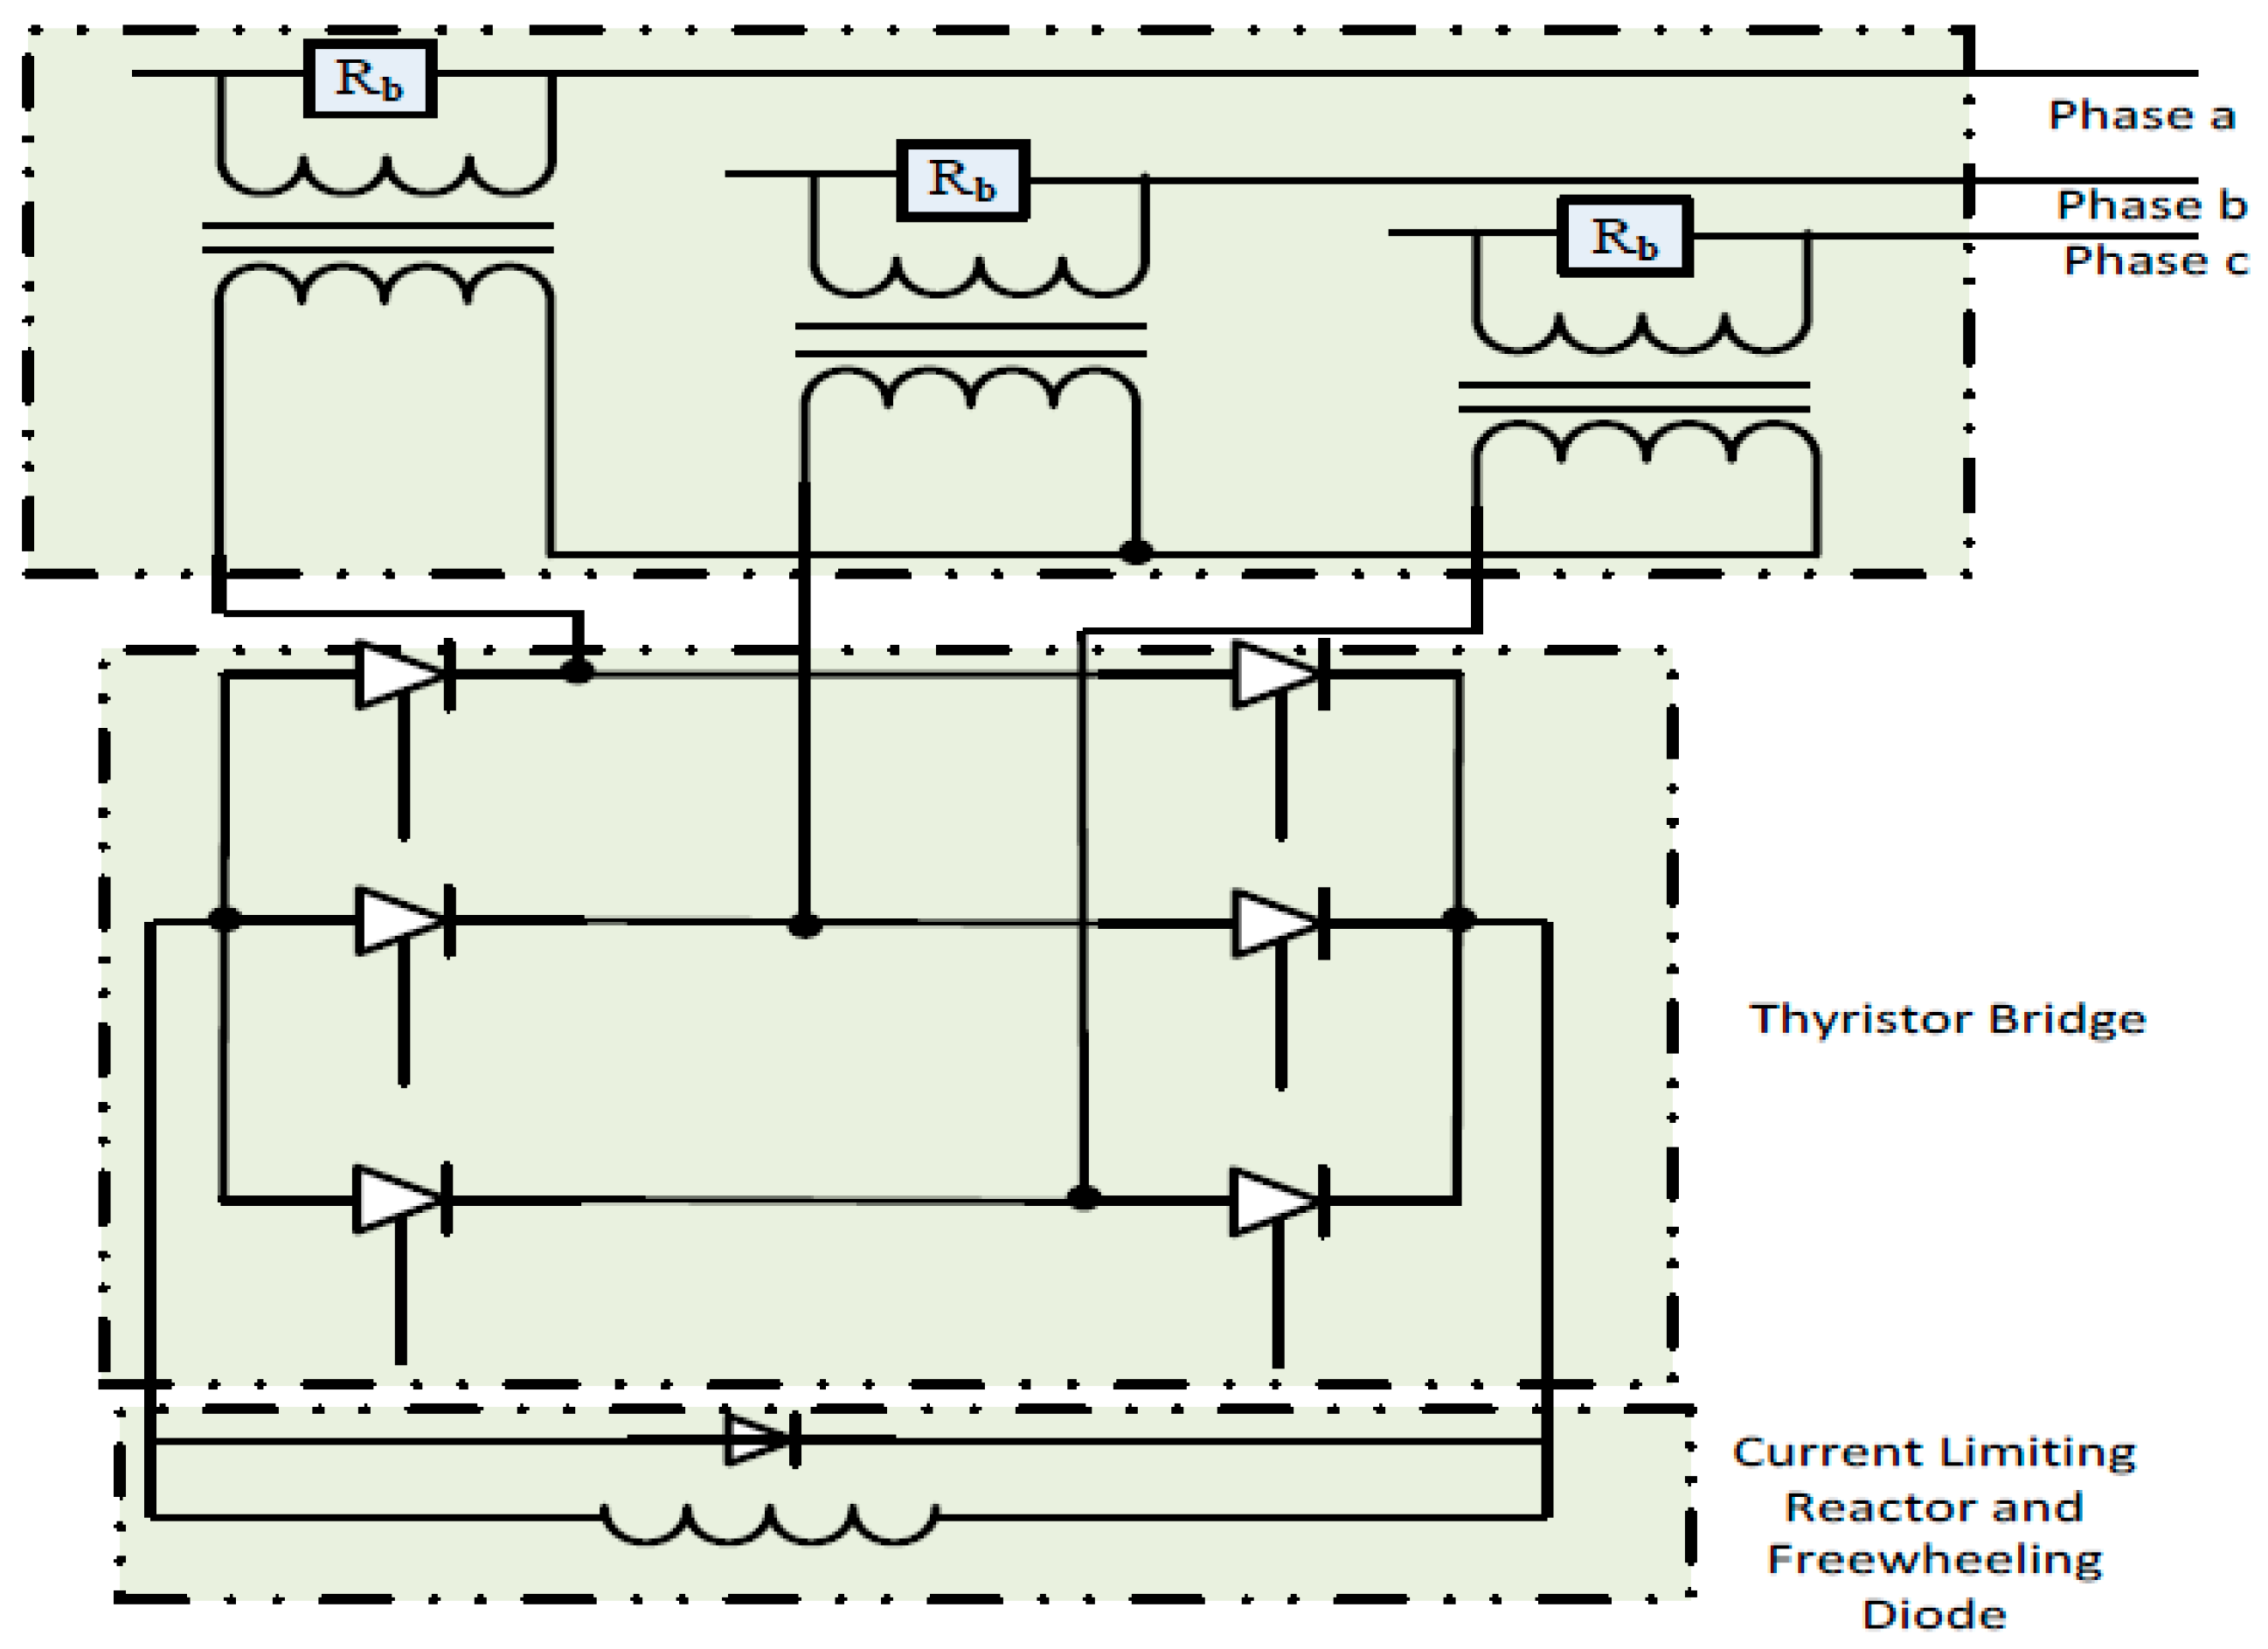
In MBFCL, the shunt branch in the BFCL is modified as the shunt-inductance LDC is omitted [58]. The LDC discharges when the shunt inductance is disconnected during normal operation. On the other side, the resistance of the shunt branch can limit the fault current when the IGBT is turned off. This type is used in fixed- and variable-speed wind farms to enhance their low-voltage ride [59].

DC Link FCL (DLFCL)

This type is implemented in fault rides through the capability enhancement of an inverter-based DG system [60]. It contains a diode bridge type and a limiting branch of inductance Ld and a small-resistance Rd, as shown in Figure 19 [17]. During normal operation, the limiting branch is negligible while it can limit fault current and suppress high voltages during fault operation.

Transformer-Coupled BFCL

A transformer-coupled BFCL is used for low voltage rides through the capability enhancement of a doubly fed induction generator (DFIG), as in [61], and Figure 20 [17] presents this type. During the steady state condition, all the thyristors are turned off, making the reactors bypassed, but they are inserted into the system during the fault condition. This is achieved by turning on the thyristors via a control circuit. Rb is a bypass resistor which absorbs most of the harmonics generated during operation, and it can reduce voltage spikes.

Resonant-Type FCL

Instead of using heterogeneous circuits either for the normal state or fault state, resonant FCL, as shown in Figure 21, has switches, which in turn reconfigure the circuit to suit both states, normal and fault [35]. During the normal state, the series resonant tank is tuned to the line frequency, forming zero resistance, whilst this resistance turns to a large value to limit the fault current in the fault condition as the resonance is lost. Despite its simplicity, the resonant-type FCL may cause harmonics [35].

3.3.5. Electromechanical Dynamic FCL

Its nomenclature, dynamic, refers to the fact that its impedance varies with the current magnitude [38]. The electromechanical dynamic FCL adjusts automatically and instantaneously its own resistance depending on the current magnitude. The more the current increases, the more the limiting action exists. That is why it creates a low impedance at normal operation and, therefore, low voltage regulation. Such a type can thermally afford high currents for a definite time. On the other side, it is complex and reconciles high-power capacitive systems [38].

3.3.6. Hybrid FCL

This type is a combination of mechanical switches, solid-state FCLs, superconducting materials, and other technologies to limit the fault currents, as presented in Figure 22 [62]. It consists of inductance (L) and capacitance (C), which are approximately zero at the nominal power frequency in addition to ZnO that protects both the switch SW2 and TVS (triggered vacuum switch) from high voltage. In normal operation, the TVS and SW2 are off, whilst in fault one, a signal is sent to the TVS, and the contactor turns on the bypass capacitor C1. This makes the reactor L limit the fault current, and both C2 and SW1 form a series compensation [62].

4. Optimization Solvers for Handling DGs and FCLs Integration

There are different types of optimization techniques, as some techniques are suitable for certain optimization problems and at the same time are not suitable for other problems. In general, there are different types of optimization algorithms, which can be divided into two types according to the behavior of the algorithm itself.

4.1. Deterministic Algorithms

This type of algorithm follows an austere procedure in addition to its path, and the values of both the control variables and the functions are reiterated. These algorithms have good performance for solving single-objective functions, whilst they can stack in solving multi-objective functions.

4.2. Stochastic Algorithms

Looking at this type, oppositely to the deterministic one, it follows some randomness, as, if the algorithm is used to obtain results more than one time, the results will differ each time. Stochastic algorithms are subdivided into heuristic and metaheuristic, but there is little difference between them.
Heuristic means finding the solution through trial and error. This operation can take a long time and there is no guarantee to reach the optimal solution in the end. This method looks good if you do not focus on reaching the optimal solution rather than having a set of good solutions.
A further development is in the metaheuristic algorithms, where the word “meta” means “higher level”. Therefore, metaheuristic algorithms have better performance over the heuristic ones. These algorithms follow a path of randomness and the local search area. Most of these algorithms are inspired and developed from nature simulations, as nature abounds in many means whose simulations can solve many optimization problems, like PSO by James Kennedy in 1995 [63], the ant colony optimization (ACO) algorithm [64], the cat swarm optimization (CSO) algorithm [65], the artificial bee colony (ABC) [66], the equilibrium optimization algorithm (EOA) [67], the GWO [68], the crow search algorithm (CSA) [69], the slap swarm algorithm (SSA) [70], and the coyote optimization algorithm (COA) [71]. These algorithms imitate the best features in nature, especially determining the fittest in the biological system that was enhanced by nature for millions of years [72].
Intensification and diversification are considered as important characteristics of the metaheuristic algorithms. Intensification focuses on local searches; it is also called exploitation, as it exploits the current best solution to receive better ones, whilst diversification ensures that the algorithm search for the global optimum; therefore, it is called exploration. Diversifications explore new solutions depending on randomization. To receive an outperformed algorithm, balance should be created between these two components. Too much exploitation besides too little exploration can make the algorithm struggle to find the global optimum. However, too much exploration with too little exploitation can lead to slow convergence. Therefore, achieving balance between both exploitation and exploration is the main target of designing new algorithms [72].
Moreover, besides exploration and exploitation, a mechanism for selecting the best solutions should be created. The most common one is called survival of the fittest, which helps in updating the current solutions and also ensures that these solutions are not lost in order to be used in next the generations [72].
To most exploit FCLs, their optimal location, size and number have been investigated in several test systems, varying between standard and practical, as shown in Table 1. The benefits attained are formulated in both technical and economical dimensions. For the technical point, the optimal allocation of FCLs helps in enhancing all of system stability, security, reliability, and fault ride-through capability. Additionally, this optimal allocation helps in reducing the fault current as well as increasing the hosting capacity of the power system to accommodate more renewable energy resources. Looking at the economical point, this relieves the costs burden, as the installation and maintenance of FCLs are more expensive than protective devices. The optimal allocation of FCLs has been obtained using different optimization techniques whether for single or multi-objective functions [34,73,74,75,76,77,78,79,80,81,82,83,84,85,86,87].
Multi-objective PSO has been adapted for achieving optimal allocated FCLs in both radial and meshed networks with the existence of DGs [73]. This is obtained in order to maintain the existing protective devices. Another algorithm, GA, has been proposed for selecting the optimal location and number of solid-state FCLs in a real distribution network in order to achieve the minimum protection cost [74]. For improving the system reliability, both the optimal location and the number of FCLs have been obtained using the loaded weight reliability index (LWRI) in [75].
On the other side, the researchers in [76] depended on the sensitivity index to determine the optimal location of superconducting FCLs by applying different fault types. For handling considerable fault current reduction and optimized protection costs, optimally allocated FCLs are maintained, taking into consideration both the centralized and dispersed access of DGs. This approach selected multi-objective PSO (MOPSO) and multi-objective artificial bee colony (MOABC) as the optimization tools where they have been adapted to obtain the Pareto optimal solution [77]. Rather than optimization methods, iterative mixed nonlinear programming has been proposed, as the optimal allocation of FCLs has been determined iteratively by multi-fault buses [78].
Besides location and sizing, the optimal number of solid-state-based FCLs in the distribution networks has been obtained using GA where both the location and size of the DGs are considered fixed [79]. Seeking to enhance the stability of power systems, the researchers in [80] determined the optimal allocation of resistive SCFCLs. Not only concerning the optimal size of FCLs but DGs have also been allocated using a non-dominated sorting GA (NSGAII) [81]. Via this survey, it is shown that there are few attempts concerned with the simultaneous optimal allocation of both DGs and FCLs. Hamidi et al. [81] can be expected as the optimal location of FCLs and DGs is investigated, while optimally allocated FCLs have been assumed directly in a series with the optimal DGs. Looking at the fault current reduction, this approach has an insignificant impact. Using the same optimization tool, the optimal configuration of FCLs is determined, while this algorithm is designed with a Pareto operator [82]. Moreover, in [83], a multi-objective improved Bat Algorithm has been proposed for attaining the optimal allocation of FCLs in a distribution network. This aims to handle several objective functions, including a reduction in both the FCL costs and the effects of the fault current besides preserving the highest index of the load reliability index. On the other side, another procedure dependent on another algorithm, the multi-objective evolutionary optimization algorithm, has been followed in order to select the optimal allocation of FCLs. This allocation is obtained for realizing reduced fault currents and improving the system reliability [75]. Added to that, the allocation of FCLs is determined for sustaining proper coordination between directional overcurrent relays under various operating conditions [84].
According to the literature, it is illustrated that there is significant importance for attaining both optimally allocated DGs and FCLs. As depicted in [34], the optimal allocation of DGs is not without bringing excessive fault currents, while FCLs can relieve this effect. The researchers in [85] enlarged this approach to achieve more objective functions varying between economical and technical, and the results fulfilled the reliable operation at both the steady and faulty states.

5. Optimal Allocation of DGs and FCLs

The grey wolf optimizer, as a new metaheuristic algorithm, is adapted for handling the optimal allocation of DGs. This algorithm simulates the hunting process of grey wolves and recently, it shows great efficiency when applied to different implementations [89,90,91,92,93].

5.1. Problem Formulation

The problem of DGs and FCLs allocation can be combined as regards the most significant objective function of DGs allocation: minimum power losses [94]:
f 1 = min i = 1 n l R i × I i 2
The second objective, which is concerned with FCLs, is keeping the fault current minimum after DGs integration as:
f 2 = min ( I f a u l t )
Taking into consideration the worst condition. For the economical side, the third objective function aims to minimize FCLs size where possible [95]:
f 3 = min k = 1 n Z F C L k
These objectives are limited by some technical constraints, which guarantee the stable operation of the distribution system. These constraints can be summarized as:
  • Power balance:
P G g r i d + i = 1 N G P G i b r a n c h = 1 N b P l o s s b r a n c h = j = 1 n b u s P d j
Q G g r i d + i = 1 N G Q G i b r a n c h = 1 N b Q l o s s b r a n c h = j = 1 n b u s Q d j
  • For each node, the power balance constraints are expressed as:
P G i P d i V i j = 1 N b V j ( G i j cos θ i j + B i j sin θ i j ) = 0
Q G i Q d i + Q C i V i j = 1 N b V j ( G i j sin θ i j B i j cos θ i j ) = 0
  • For the inequality constraint, each DG unit has a limited capacity which lies between the maximum and minimum values, as illustrated:
P G i min P G i P G i max
Q G i min Q G Q G i max
  • Similarly, their power factors as [96]:
p f min < p f < p f max
  • To ensure satisfied operation, the nodes voltage in the distribution system should locate between their defined limits with the range [0.95–1.05] as [97]:
V m i min V i V i max ,                 i = 1 , 2 , 3 , ..... n b u s
  • As well, thermal limits should be taken into account as:
I b r a n c h I b r a n c h max ,     i = 1 , 2 , 3 , ..... N b
  • Furthermore, FCL size has permissible boundaries as:
Z F C L min Z F C L Z F C L max

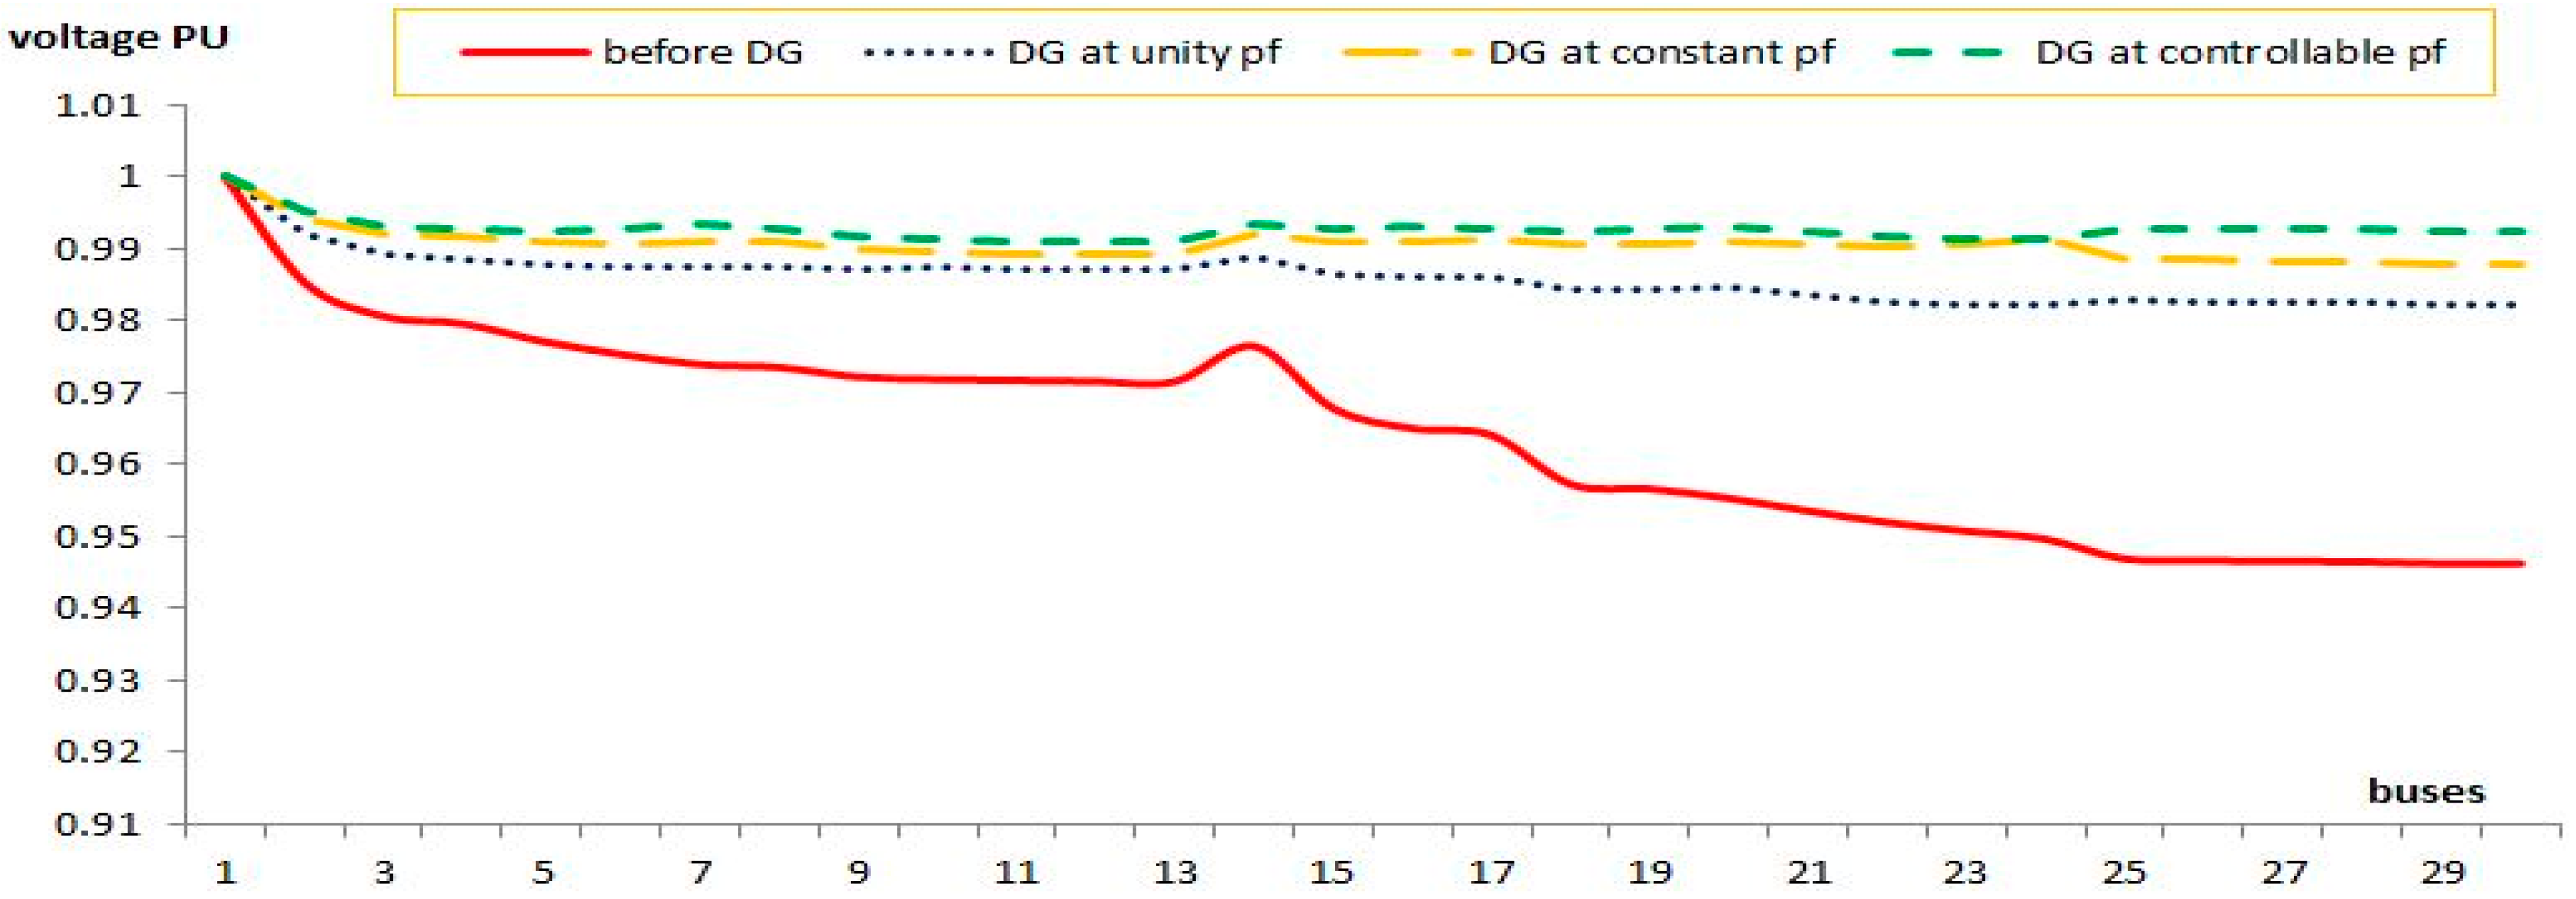
5.2. Simulation Results Based on GWO

The tested system is a real one: the East Delta Network (EDN) whose initial power loses 805.73 kW and feeds 29 loads of 22.5003 MW [7,98]. There are three cases studied, as follows:
  • Case 1: DGs operating at a unity power factor, type 2.
  • Case 2: DGs operating at a constant power factor, type 1.
  • Case 3: DGs operating at a controllable power factor ranging from 0.7 to unity with variable apparent power.
Firstly, GWO is applied to obtain the optimal allocation of the different types of DGs varying between operating at unity, constant, and controllable pf (Cases 1–3) where the results are shown in Table 2. In this system, the maximum DG limit equals 8 MW. For case 1, the GWO selects the optimal location of the DGs at buses 7, 10, 17, 20, and 25, and their acquired sizes are 1.833, 1.392, 3.857, 4.696, and 1.719 MW, respectively. These sizes and locations achieve a great reduction in power losses from 805.73 kW to 277.25 kW with a reduction of 65.59%, while a greater reduction in power losses with a percentage of 89.79% is obtained in case 2. This value is achieved when DGs of size 0.7124, 2.815, 3.651, 3.82, and 2.499 MW are located at buses 4, 8, 17, 20, and 24, respectively. In Case 3, the power losses are reduced to 66.64 kW with the percentages of reductions of 91.73% and 75.96% compared to the initial and the final cases, respectively. Additionally, the lowest voltage level increases to 0.991 p.u. The lowest power losses and voltage levels are obtained when the DGs are located at buses 6, 7, 16, 20, and 26 with sizes of 0.1869, 3.149, 3.7, 1.808, and 1.656 MW, respectively. Figure 23 illustrates the voltage profile for the cases studied.
Secondly, the optimal allocation of FCL is determined iteratively. The locations and sizes of the DGs (case 3) are illustrated in Table 2, and they are implemented in ETAP, whereas the network is shown in Figure 24. The worst type of fault, a three-phase fault, is applied at each bus, while bus 2 records the highest value as the main bus. For determining the optimal location of the FCL, eight locations are suggested, while the FCL size is kept constant. These locations vary between series with the main bus whether between buses 1 and 2, buses 2 and 3, or between buses 2 and 14. Additionally, these locations included in series with the five DGs are presented in [34].
At every location, the fault current is simulated and recorded as in Table 3. The optimal location is selected as the one that records the highest reduction in the fault current; therefore, it is obtained between buses 1 and 2. For the optimal size, the FCL is increased with step 8.26 × 10⁻⁶ p.u. The optimal size is obtained at 1.074 × 10⁻⁴ per unit, as the fault current returns to the value of 24.276 kA, which is close to its initial value of 24.4 kA (before DG integration). Figure 25 presents the values of all bus’ fault currents, showing the effect of DG integration besides the FCL impact on their values.

6. Conclusions and Future Work

This paper presented a widened survey about enhancing the operation of the distribution networks. This enhancement is handled through both DG and FCL integration. Accordingly, this paper reviews all the types and applications of DGs and FCLs. For DGs, they can be divided with respect to their fuel, their type of energy, their active and reactive capability, and their size. On the other side, FCLs are classified as pyrotechnic, reactor, superconducting, non-superconducting, hybrid, and electromechanical. Additionally, the FCL conditions are illustrated. Moreover, this paper shows different optimization tools which have been adapted to obtain the maximum benefits of these components while achieving various objective functions. These tools vary between deterministic and heuristic ones, whereas they differ in their procedure. Additionally, in this paper, the optimal allocation of different types of DGs correlated with FCL has been presented and applied for a real Egyptian distribution network of the East Delta Network (EDN). GWO has been implemented for determining the optimal allocation of different types of DGs, achieving a considerable reduction in power losses with reductions up to 65–90% compared with the initial power losses that were achieved in the third case. On the other side, initial fault currents have been obtained through an iterative method applied to the ETAP program. It is clear that a great improvement of the voltage profile in all the cases studied through adding DGs to the distribution system is achieved. Despite the plentiful research in this regard, there are gaps and several important considerations that have not been considered. Therefore, research is still being offered to try to include these considerations, presenting better solutions for power system operators and improving the performance of distribution networks more and more. Consequently, several future items are recommended in the next section. Working to improve the performance of distribution networks creates new challenges. These challenges can be assimilated into the integration of new components while studying their impact on the already existing devices. The future of this study covers different points, which are summarized as follows:
  • Developing the superconducting and non-superconducting FCLs is a critical point which requires further research that gathers the economical steady state and technical dynamic benefits.
  • The grid interfaces of the voltage source converters and their impacts involving harmonics, losses, and high fault levels should be taken into consideration.
  • The optimal allocation of DGs and FCLs in DC or meshed AC/DC networks becomes a new trend with the increasing direction towards microgrids.
  • DGs based on renewable energy resources and their dependence on the environmental condition (uncertainty) are recommended to be included with fast and effective handling techniques.
  • Developing new optimization solvers with efficient capabilities to treat multi-objective models is suggested, which can fulfill the objectives and give the availability to choose more than one optimal solution.

Author Contributions

Data curation, A.A.A.E.-E., R.A.E.-S., A.M.S. and A.R.E.; Formal analysis, R.A.E.-S., A.M.S. and A.R.E.; Funding acquisition, R.A.E.-S.; Methodology, A.M.S. and A.R.E.; Resources, R.A.E.-S. and A.M.S.; Supervision, A.A.A.E.-E.; Writing—original draft, A.M.S. and A.R.E.; Writing—review and editing, A.A.A.E.-E. and R.A.E.-S. All authors have read and agreed to the published version of the manuscript.

Funding

This research received no external funding.

Conflicts of Interest

The authors declare no conflict of interest.

Nomenclature

Id1Diode current
IshShunt current
IscShunt current
K1Temperature coefficient of the current
TcTemperature at which the cell operates
TrefReference temperature of the cell.
GInsolation of the cell (W/m2)
GrefReference insolation of the cell (W/m2)
FFFill factor
PmaxMaximum power point
VocOpen circuit voltage of the cell
PwindPower extracted from the wind stream
pAir density
vwindWind speed (m/s)
ArCross-section area of wind blades (m2)
PmechMechanical power extracted from WTG (p.u.)
cpBetz limit which equals 0.59
PelecActive power delivered to the grid (p.u.)
IplvActive current in the generator (p.u.)
VTerminal voltage between the converter connected to the generator and grid (p.u.)
RGrid resistance (p.u)
XGrid reactance (p.u.)
QgenReactive power delivered to the grid (p.u.).
AV, BV, and CVLoss components of the converter
IVSCInjected current on the AC side of the corresponding converter
PVSCReal power at the VSC bus
QVSCReactive power at the VSC bus
VVSCVoltage at the VSC bus
QDGConsumed reactive power of DG
RiResistance of the distribution line
IiLine current of the distribution line
nlTotal number of the distribution lines.
IfaultThree-phase short circuit current
ZFCLFault current limiter size
PGgridReal power generated from the main grid
QGgridReactive power generated from the main grid
PGReal power generated from integrated DGs
QGReactive power generated from integrated DGs
PlossReal power losses in all branches
QlossReactive power losses in all branches
PdReal demand power
QdReactive demand power
NGNumber of units
NbNumber of branches in the network
nbusNumber of nodes in the network
GijMutual conductance between nodes i and j
BijMutual susceptance between nodes i and j
QcCapacitive or inductive power pumped through a VAR source installed at node i
ViVoltage magnitude of node i
VjVoltage magnitude of node j
θijImpedance angle of line connected between the nodes i and j

References

  1. Short, T.A. Electric Power Distribution Handbook; CRC Press: Boca Raton, FL, USA, 2014. [Google Scholar]
  2. El-Khattam, W.; Salama, M.M.A. Distributed generation technologies, definitions and benefit. Electr. Power Syst. Res. 2004, 71, 119–128. [Google Scholar] [CrossRef]
  3. Jagtap, K.M.; Khatod, D.K. Novel approach for loss allocation of distribution networks with DGs. Electr. Power Syst. Res. 2017, 143, 303–311. [Google Scholar] [CrossRef]
  4. Zhao, Y.; An, Y.; Ai, Q. Research on size and location of distributed generation with vulnerable node identification in the active distribution network. IET Gener. Transm. Distrib. 2014, 8, 1801–1809. [Google Scholar] [CrossRef]
  5. Atwa, Y.M.; El-Saadany, E.F. Probabilistic approach for optimal placement of wind-based distributed generation in distribution systems. IET Renew. Power Gener. 2011, 5, 79–88. [Google Scholar] [CrossRef]
  6. Khalesi, N.; Rezaei, N.; Haghifam, M.R. DG placement with application of dynamic programming for loss reduction and reliability improvement. Int. J. Elect. Power Energy Syst. 2011, 33, 288–295. [Google Scholar] [CrossRef]
  7. Shaheen, A.M.; El-Sehiemy, R.A. Optimal co-ordinated allocation of distributed generation units/capacitor banks/voltage regulators by EGWA. IEEE Syst. J. 2020, 15, 257–264. [Google Scholar] [CrossRef]
  8. Talaat, H.E.A.; Al-Ammar, E. Optimal allocation and sizing of Distributed Generation in distribution networks using Genetic Algorithms. In Proceedings of the 11th International Conference on Electrical Power Quality and Utilisation, Lisbon, Portugal, 17–19 October 2011; pp. 1–6. [Google Scholar]
  9. Ahmed, A.H.; Hasan, S. Optimal allocation of distributed generation units for converting conventional radial distribution system to loop using particle swarm optimization. Energy Procedia 2020, 153, 118–124. [Google Scholar] [CrossRef]
  10. Da Rosa, W.M.; Gerez, C.; Belati, E.A. Optimal Distributed Generation Allocating Using Particle Swarm Optimization and Linearized AC Load Flow. IEEE Lat. Am. Trans. 2018, 16, 2665–2670. [Google Scholar] [CrossRef]
  11. Shaheen, A.; Elsayed, A.; Ginidi, A.; El-Sehiemy, R.; Elattar, E. A heap-based algorithm with deeper exploitative feature for optimal allocations of distributed generations with feeder reconfiguration in power distribution networks. Knowl.-Based Syst. 2022, 241, 108269. [Google Scholar] [CrossRef]
  12. Musa, I.; Gadoue, S.; Zahawi, B. Integration of Distributed Generation in Power Networks Considering Constraints on Discrete Size of Distributed Generation Units. Electr. Power Compon. Syst. 2014, 42, 984–994. [Google Scholar] [CrossRef]
  13. Babu, K.; Maheswarapu, S. New hybrid multiverse optimisation approach for optimal accommodation of DGs in power distribution networks. IET Gener. Transm. Distrib. 2019, 13, 2673–2685. [Google Scholar] [CrossRef]
  14. Balci, M.E.; Aleem, S.H.E.A.; Zobaa, A.F.; Sakar, S. An algorithm for optimal sizing of the capacitor banks under nonsinusoidal and unbalanced conditions. Recent Adv. Electr. Electron. Eng. 2014, 7, 116–122. [Google Scholar] [CrossRef] [Green Version]
  15. Porkar, S.; Poure, P.; Abbaspour-Tehrani-fard, A.; Saadate, S. Optimal allocation of distributed generation using a two-stage multi-objective mixed-integer-nonlinear programming. Eur. Trans. Elect. Power 2011, 21, 1072–1087. [Google Scholar] [CrossRef]
  16. Tang, G.; Iravani, M.R. Application of fault current limiter to minimize distributed generation impact on coordinated relay protection. In Proceedings of the International Conference on Power Systems Transients, Montreal, QC, Canada, 19–23 June 2005; pp. 19–23. [Google Scholar]
  17. Alam, M.S.; Abido, M.A.Y.; El-Amin, I. Fault Current Limiters in Power Systems: A Comprehensive Review. Energies 2018, 11, 1025. [Google Scholar] [CrossRef] [Green Version]
  18. Abbas, A.S.; El-Sehiemy, R.A.; El-Ela, A.A.; Ali, E.S.; Mahmoud, K.; Lehtonen, M.; Darwish, M.M.F. Optimal Harmonic Mitigation in Distribution Systems with Inverter Based Distributed Generation. Appl. Sci. 2021, 11, 774. [Google Scholar] [CrossRef]
  19. El-Fergany, A. Multi-objective placement of multi-type distributed generators along distribution networks using backtracking search algorithm and fuzzy expert rules. Elect. Power Compon. Syst. 2016, 44, 252–267. [Google Scholar] [CrossRef]
  20. Murdock, H.E.; Gibb, D.; Andre, T.; Sawin, J.L.; Brown, A.; Ranalder, L.; Andre, T.; Brown, A.; Collier, U.; Dent, C.; et al. Renewables 2019 Global Status Report; National Technical University of Athens: Athens, Greece, 2019. [Google Scholar]
  21. Available online: https://www.irena.org/publications/2018/Oct/Renewable-Energy-Outlook-Egypt (accessed on 1 January 2021).
  22. Turkenburg, W.C. Renewable energy. In Global Energy Assessment—Toward a Sustainable Future; Cambridge University Press: Cambridge, UK, 2012; pp. 761–900. [Google Scholar]
  23. Ginidi, A.; Ghoneim, S.M.; Elsayed, A.; El-Sehiemy, R.; Shaheen, A.; El-Fergany, A. Gorilla Troops Optimizer for Electrically Based Single and Double-Diode Models of Solar Photovoltaic Systems. Sustainability 2021, 13, 9459. [Google Scholar] [CrossRef]
  24. Abolhosseini, S.; Heshmati, A.; Altmann, J. A Review of Renewable Energy Supply and Energy Efficiency Technologies. SSRN Electron. J. 2021, 8145. [Google Scholar] [CrossRef]
  25. Eisa, S.A. Mathematical Modeling and Analysis of Wind Turbines Dynamics; New Mexico Institute of Mining and Technology: Socorro, NM, USA, 2017. [Google Scholar]
  26. Nelson, C.V. Introduction to Renewable Energy; CRC Press: Boca Raton, FL, USA, 2011. [Google Scholar]
  27. Gorjian, S. An Introduction to the Renewable Energy Resources; Tarbiat Modares University: Tehran, Iran, 2017. [Google Scholar]
  28. Hassan, A.A.; el Habrouk, M.; Deghedie, S. Renewable Energy for Robots and Robots for Renewable Energy–A Review. Robotica 2020, 38, 1576–1604. [Google Scholar] [CrossRef]
  29. IRENA. Renewable Energy Statistics Training. Available online: https://www.irena.org/-/media/Files/IRENA/Agency/Data-Statistics/2-Overview-of-renewable-energy.pdf?la=en&hash=6B78D45E6E3D67409D05F7FAB38D638A4F9ACB55 (accessed on 1 January 2021).
  30. Masters, G.M. Renewable and Efficient Electric Power Systems; John Wiley & Sons, Inc.: Hoboken, NJ, USA, 2013. [Google Scholar]
  31. Gross, R.; Leach, M.; Bauen, A. Progress in renewable energy. Environ. Int. 2003, 29, 105–122. [Google Scholar] [CrossRef]
  32. El-Ela, A.A.A.; El-Seheimy, R.A.; Shaheen, A.M.; Wahbi, W.A.; Mouwafi, M.T. PV and battery energy storage integration in distribution networks using equilibrium algorithm. J. Energy Storage 2021, 42, 103041. [Google Scholar] [CrossRef]
  33. Mehta, P.; Bhatt, P.; Pandya, V. Optimal selection of distributed generating units and its placement for voltage stability enhancement and energy loss minimization. Ain Shams Eng. J. 2018, 9, 187–201. [Google Scholar] [CrossRef]
  34. El-Ela, A.A.A.; El-Sehiemy, R.A.; Shaheen, A.M.; Ellien, A.R. Optimal Placement of Distributed Generation Units Correlated with Fault Current Limiter Sites in Distribution Systems. IEEE Syst. J. 2020, 15, 2148–2155. [Google Scholar] [CrossRef]
  35. Abramovitz, A.; Smedley, M. Survey of solid-state fault current limiters. IEEE Trans. Power Electron. 2012, 27, 2770–2782. [Google Scholar] [CrossRef]
  36. Ganev, G.; Hinov, K.; Karadjov, N.K. Fault current limiters–principles and application. SIELA 2012, 2012. [Google Scholar]
  37. Hagh, M.T.; Abapour, M. Non-superconducting fault current limiter with controlling the magnitudes of fault currents. IEEE Trans. Power Electron. 2009, 24, 613–619. [Google Scholar] [CrossRef]
  38. Yadav, S.; Choudhary, G.K.; Mandal, R.K. Review on fault current limiters. Int. J. Eng. 2014, 3, 1595–1603. [Google Scholar]
  39. Li, B.; Li, Q.; Liu, H.; Han, M.; Huang, Z.; Wang, J. The overvoltage of interrupting off-load transmission line with series-resonant type fault current limiter. In Proceedings of the 7th Asia-Pacific International Symposium on Electromagnetic Compatibility, Shenzhen, China, 17–21 May 2016; pp. 84–87. [Google Scholar]
  40. Refaat, M.M.; Aleem, S.H.A.; Atia, Y.; Ali, Z.M.; El-Shahat, A.; Sayed, M.M. A mathematical approach to simultaneously plan generation and transmission expansion based on fault current limiters and reliability constraints. Mathematics 2021, 9, 2771. [Google Scholar] [CrossRef]
  41. Xue, S.; Gao, F.; Sun, W.; Li, B. Protection Principle for a DC Distribution System with a Resistive Superconductive Fault Current Limiter. Energies 2015, 8, 4839–4852. [Google Scholar] [CrossRef] [Green Version]
  42. Radmanesh, H. Distribution Network Protection Using Smart Dual Functional Series Resonance-Based Fault Current and Ferroresonance Overvoltage Limiter. IEEE Trans. Smart Grid 2016, 9, 3070–3078. [Google Scholar] [CrossRef]
  43. Heidary, A.; Radmanesh, H.; Rouzbehi, K.; Pou, J. A DC-reactor-based solid-state fault current limiter for HVdc applications. IEEE Trans. Power Deliv. 2019, 34, 720–728. [Google Scholar] [CrossRef]
  44. Hossain, M.E. Performance analysis of diode-bridge-type non-superconducting fault current limiter in improving transient stability of DFIG based variable speed wind generator. Electr. Power Syst. Res. 2017, 143, 782–793. [Google Scholar] [CrossRef]
  45. Marei, M.I.; El-Goharey, H.S.; Toukhy, R.M. Fault ride-through enhancement of fixed speed wind turbine using bridge-type fault current limiter. J. Electr. Syst. Inf. Technol. 2016, 3, 119–126. [Google Scholar] [CrossRef] [Green Version]
  46. Asghar, R. Fault current limiters types, operations and its limitations. Int. J. Sci. Eng. Res. 2018, 9, 1020–1027. [Google Scholar]
  47. Normal, I.; Eckroad, S. Superconducting Fault Current Limiters; Electric Power Research Institute: Palo Alto, CA, USA, 2009. [Google Scholar]
  48. Chen, W.; Song, P.; Jiang, H.; Zhu, J.; Zou, S.; Qu, T. Investigations on Quench Recovery Characteristics of High-Temperature Superconducting Coated Conductors for Superconducting Fault Current Limiters. Electronics 2021, 10, 259. [Google Scholar] [CrossRef]
  49. Tsotsopoulou, E.; Dyśko, A.; Hong, Q.; Elwakeel, A.; Elshiekh, M.; Yuan, W.; Tzelepis, C.B.D. Modelling and fault current characterization of superconducting cable with high temperature superconducting windings and copper stabilizer layer. Energies 2020, 13, 6646. [Google Scholar] [CrossRef]
  50. Bock, J.; Bludau, M.; Dommerque, R.; Hobl, A.; Kraemer, S.; Rikel, M.O.; Elschner, S. HTS Fault Current Limiters—First Commercial Devices for Distribution Level Grids in Europe. IEEE Trans. Appl. Supercond. 2011, 21, 1202–1205. [Google Scholar] [CrossRef]
  51. Kozak, S.; Janowski, T.; Wojtasiewicz, G.; Kozak, J.; Kondratowicz-Kucewicz, B.; Majka, M. The 15 kV class inductive SFCL. IEEE Trans. Appl. Supercond. 2010, 20, 1203–1206. [Google Scholar] [CrossRef]
  52. Jung, B.I.; Choi, H.W.; Choi, H.S. Reduction of the power burden of a transformer-type SFCL using a vacuum interrupter. IEEE Trans. Appl. Supercond. 2015, 25, 4–7. [Google Scholar] [CrossRef]
  53. Kataoka, T.; Yamaguchi, H. Comparative study of transformer-type superconducting fault current limiters considering magnetic saturation of iron core. IEEE Trans. Magn. 2006, 42, 3386–3388. [Google Scholar] [CrossRef]
  54. Naderi, S.B.; Negnevitsky, M.; Jalilian, A.; Hagh, M.T.; Muttaqi, K.M. Low voltage ride-through enhancement of DFIG-based wind turbine using DC link switchable resistive type fault current limiter. Int. J. Electr. Power Energy Syst. 2017, 86, 104–119. [Google Scholar] [CrossRef]
  55. Choi, H.-S.; Cho, Y.-S.; Lim, S.-H. Operational Characteristics of Hybrid-Type SFCL by the Number of Secondary Windings with YBCO Films. IEEE Trans. Appl. Supercond. 2006, 16, 719–722. [Google Scholar] [CrossRef]
  56. Heydari, H.; Abrishami, A.A.; Bidgoli, M.M. Comprehensive Analysis for Magnetic Shield Superconducting Fault Current Limiters. IEEE Trans. Appl. Supercond. 2013, 23, 5604610. [Google Scholar] [CrossRef]
  57. Hussein, A.A.; Ali, M.H. Comparison among series compensators for transient stability enhancement of doubly fed induction generator based variable speed wind turbines. IET Renew. Power Gener. 2016, 10, 116–126. [Google Scholar] [CrossRef]
  58. Abdolkarimzadeh, M.; Nakari-Heris, M.; Abapour, M.; Sabhi, M. A bridge-type fault current limiter for energy management of AC/DC microgrids. IEEE Trans. Power Electron. 2017, 32, 9043–9050. [Google Scholar] [CrossRef]
  59. Rashid, G.; Ali, M.H. Nonlinear Control-Based Modified BFCL for LVRT Capacity Enhancement of DFIG-Based Wind Farm. IEEE Trans. Energy Convers. 2016, 32, 284–295. [Google Scholar] [CrossRef]
  60. Abapour, M.; Jalilian, A.; Hagh, M.T.; Muttaqi, K.M. DC-link fault current limiter-based fault ride-through scheme for inverter-based distributed generation. IET Renew. Power Gener. 2015, 9, 690–699. [Google Scholar]
  61. Guo, W.; Xiao, L.; Dai, S.; Xu, X.; Li, Y.; Wang, Y. Evaluation of the Performance of BTFCLs for Enhancing LVRT Capability of DFIG. IEEE Trans. Power Electron. 2015, 30, 3623–3637. [Google Scholar] [CrossRef]
  62. Shi, J.; Zou, J.; He, J. Triggered vacuum switch-based fault current limiter. IEEE Power Eng. Rev. 2000, 20, 51–53. [Google Scholar] [CrossRef]
  63. Eberhart, R.; Kennedy, J. Particle swarm optimization. In Proceedings of the IEEE International Conference on Neural Networks, Perth, Australia, 27 November 1995; Volume 4, pp. 1942–1948. [Google Scholar]
  64. Dorigo, M.; di Caro, G. Ant colony optimization: A new meta-heuristic. In Proceedings of the 1999 Congress on Evolutionary Computation-CEC99 (Cat. No. 99TH8406), Washington, DC, USA, 6–9 July 1999; Volume 2. [Google Scholar]
  65. Chu, S.; Tsai, P.; Pan, J. Cat swarm optimization. In Pacific Rim International Conference on Artificial Intelligence; Springer: Berlin/Heidelberg, Germany, 2006; pp. 854–858. [Google Scholar]
  66. Karaboga, D.; Basturk, B. Artificial Bee Colony (ABC) optimization algorithm for solving constrained optimization problems. In Proceedings of the 12th International Fuzzy Systems Association World Congress (IFSA 2007), Cancun, Mexico, 18–21 June 2007; Springer: Berlin/Heidelberg, Germany, 2007; pp. 789–798. [Google Scholar]
  67. El-Ela, A.A.A.; Allam, S.M.; Shaheen, A.M.; Nagem, N.A. Optimal allocation of biomass distributed generation in distribution systems using equilibrium algorithm. Int. Trans. Electr. Energy Syst. 2020, 31, e12727. [Google Scholar] [CrossRef]
  68. Mirjalili, S.; Mirjalili, S.M.; Lewis, A. Grey wolf optimizer. Adv. Eng. Softw. 2014, 69, 46–61. [Google Scholar] [CrossRef] [Green Version]
  69. Shaheen, A.M.; El-Sehiemy, R.A. Optimal allocation of capacitor devices on MV distribution networks using crow search algorithm. CIRED-Open Access Proc. J. 2017, 2017, 2453–2457. [Google Scholar] [CrossRef] [Green Version]
  70. Mirjalili, S.; Gandomi, A.H.; Mirajalili, S.Z.; Saremi, S.; Faris, H.; Mirajalili, S.M. Salp Swarm Algorithm: A bio-inspired optimizer for engineering design problems. Adv. Eng. Softw. 2017, 114, 163–191. [Google Scholar] [CrossRef]
  71. Pierezan, J.; Coelho, L.D.S. Coyote Optimization Algorithm: A New Metaheuristic for Global Optimization Problems. In Proceedings of the 2018 IEEE Congress on Evolutionary Computation (CEC), Rio de Janeiro, Brazil, 8–13 July 2018; pp. 1–8. [Google Scholar] [CrossRef]
  72. Koziel, S.; Yang, X. (Eds.) Computational Optimization, Methods and Algorithms; Springer: Berlin/Heidelberg, Germany, 2011; p. 356. [Google Scholar]
  73. Emitwally, A.; Gouda, E.; Eladawy, S. Optimal allocation of fault current limiters for sustaining overcurrent relays coordination in a power system with distributed generation. Alexendria Eng. J. 2015, 31, 1077–1089. [Google Scholar] [CrossRef] [Green Version]
  74. Shahriari, S.A.A.; Varjani, A.Y.; Haghifam, M.R. Cost reduction of distribution network protection in presence of distributed generation using optimized fault current limiter allocation. Int. J. Electr. Power Energy Syst. 2012, 43, 1453–1459. [Google Scholar] [CrossRef]
  75. Mahmoudian, A.; Niasati, M.; Khanesar, M.A. Multi objective optimal allocation of fault current limiters in power system. Int. J. Electr. Power Energy Syst. 2017, 85, 1–11. [Google Scholar] [CrossRef]
  76. Didier, G.; Lévêque, J. Influence of fault type on the optimal location of superconducting fault current limiter in electrical power grid. Int. J. Electr. Power Energy Syst. 2014, 56, 279–285. [Google Scholar] [CrossRef]
  77. Chen, L.; Zhang, X.; Chen, H.; Li, G.; Yang, J.; Tian, X.; Xu, Y.; Ren, L.; Tang, Y. Pareto optimal allocation of resistive-type fault current limiters in active distribution networks with inverter-interfaced and synchronous distributed generators. Energy Sci. Eng. 2019, 7, 2554–2571. [Google Scholar] [CrossRef]
  78. Yu, P.; Venkatesh, B.; Yazdani, A.; Singh, B.N. Optimal Location and Sizing of Fault Current Limiters in Mesh Networks Using Iterative Mixed Integer Nonlinear Programming. IEEE Trans. Power Syst. 2016, 31, 4776–4783. [Google Scholar] [CrossRef]
  79. Shahriari, S.A.A.; Yazdin, A.; Haghifam, M.R. Fault current limiter placement and sizing in distribution system in presence of distributed generation. In Proceedings of the IEEE Power & Energy Society General Meeting, Calgary, AB, Canada, 26–30 July 2009; pp. 1–6. [Google Scholar]
  80. Didier, G.; Leveque, J.; Rezzoug, A. A novel approach to determine the optimal location of SFCL in electric power grid to improve power system stability. IEEE Trans. Power Syst. 2012, 28, 978–984. [Google Scholar] [CrossRef]
  81. Hamidi, M.; Chabanloo, R. Optimal placement of distributed generation with optimal sizing of fault current limiter to reduce the impact on distribution networks using NSGA-II. IEEE Syst. J. 2018, 13, 1714–1724. [Google Scholar]
  82. Yang, H.-T.; Tang, W.-J.; Lubicki, P.R. Placement of Fault Current Limiters in a Power System Through a Two-Stage Optimization Approach. IEEE Trans. Power Syst. 2017, 33, 131–140. [Google Scholar] [CrossRef]
  83. Shu, Z.; Chen, Y.; Deng, C.; Zheng, F.; Zhong, H. Pareto Optimal Allocation of Flexible Fault Current Limiter Based on Multi-Objective Improved Bat Algorithm. IEEE Access 2021, 9, 12762–12778. [Google Scholar] [CrossRef]
  84. Elmitwally, A.; Kandil, M.S.; Gouda, E.; Amer, A. Mitigation of DGs Impact on Variable-Topology Meshed Network Protection System by Optimal Fault Current Limiters Considering Overcurrent Relay Coordination. Electr. Power Syst. Res. 2020, 186, 106417. [Google Scholar] [CrossRef]
  85. El-Ela, A.A.A.; El-Sehiemy, R.A.; Shaheen, A.M.; Ellien, A.R. Multiobjective coyote optimization algorithm for techno-economic simultaneous placement of DGs and FCLs in distribution networks. Int. Trans. Electr. Energy Syst. 2021, 31, e13050. [Google Scholar]
  86. Yang, Q.; Le Blond, S.; Liang, F.; Yuan, W.; Zhang, M.; Li, J. Design and Application of Superconducting Fault Current Limiter in a Multiterminal HVDC System. IEEE Trans. Appl. Supercond. 2017, 27, 1–5. [Google Scholar] [CrossRef] [Green Version]
  87. Jo, H.-C.; Joo, S.-K.; Lee, K. Optimal Placement of Superconducting Fault Current Limiters (SFCLs) for Protection of an Electric Power System with Distributed Generations (DGs). IEEE Trans. Appl. Supercond. 2012, 23, 5600304. [Google Scholar] [CrossRef]
  88. Alghamdi, H. Optimum Placement of Distribution Generation Units in Power System with Fault Current Limiters Using Improved Coyote Optimization Algorithm. Entropy 2021, 23, 655. [Google Scholar] [CrossRef]
  89. Sanjay, R.; Jayabarathi, T.; Raghunathan, T.; Ramesh, V.; Mithulananthan, N. Optimal Allocation of Distributed Generation Using Hybrid Grey Wolf Optimizer. IEEE Access 2017, 5, 14807–14818. [Google Scholar] [CrossRef]
  90. Ansari, M.M.; Guo, C.; Shaikh, M.S.; Chopra, N.; Haq, I.; Shen, L. Planning for Distribution System with Grey Wolf Optimization Method. J. Electr. Eng. Technol. 2020, 15, 1485–1499. [Google Scholar] [CrossRef]
  91. Zhang, J.; Wang, X.; Ma, L. An Optimal Power Allocation Scheme of Microgrid Using Grey Wolf Optimizer. IEEE Access 2019, 7, 137608–137619. [Google Scholar] [CrossRef]
  92. Negi, G.; Kumar, A.; Pant, S.; Ram, M. Optimization of Complex System Reliability using Hybrid Grey Wolf Optimizer. Decis. Mak. Appl. Manag. Eng. 2021, 4, 241–256. [Google Scholar] [CrossRef]
  93. Lakum, A.; Mahajan, V. Optimal placement and sizing of multiple active power filters in radial distribution system using grey wolf optimizer in presence of nonlinear distributed generation. Electr. Power Syst. Res. 2019, 173, 281–290. [Google Scholar] [CrossRef]
  94. Shaheen, A.M.; Elattar, E.E.; El-Sehiemy, R.A.; Elsayed, A.M. An Improved Sunflower Optimization Algorithm-Based Monte Carlo Simulation for Efficiency Improvement of Radial Distribution Systems Considering Wind Power Uncertainty. IEEE Access 2020, 9, 2332–2344. [Google Scholar] [CrossRef]
  95. El-Ela, A.A.A.; El-Sehiemy, R.A.; Allam, S.M.; Shaheen, A.M.; Nagem, N.A.; Sharaf, A.M. Renewable Energy Micro-Grid Interfacing: Economic and Environmental Issues. Electronics 2022, 11, 815. [Google Scholar] [CrossRef]
  96. Nasef, A.; Shaheen, A.; Khattab, H. Local and remote control of automatic voltage regulators in distribution networks with different variations and uncertainties: Practical cases study. Electr. Power Syst. Res. 2022, 205, 107773. [Google Scholar] [CrossRef]
  97. Shaheen, A.; Elsayed, A.; Ginidi, A.; El-Sehiemy, R.; Elattar, E. Reconfiguration of electrical distribution network-based DG and capacitors allocations using artificial ecosystem optimizer: Practical case study. Alex. Eng. J. 2022, 61, 6105–6118. [Google Scholar] [CrossRef]
  98. El-Ela, A.A.A.; El-Sehiemy, R.A.; Shaheen, A.M.; Eissa, I.A. Optimal coordination of static VAR compensators, fixed capacitors, and distributed energy resources in Egyptian distribution networks. Int. Trans. Electr. Energy Syst. 2020, 30, e12609. [Google Scholar] [CrossRef]
Figure 1. Function of distributed generation units.
Energies 15 07648 g001
Figure 2. Schematic cross-section of a solar cell.
Energies 15 07648 g002
Figure 3. Equivalent circuit of PV cell.
Energies 15 07648 g003
Figure 4. Oscillating water column system.
Energies 15 07648 g004
Figure 5. Schematic diagram of Anaerobic Digestion.
Energies 15 07648 g005
Figure 6. Configuration of reactor type FCL.
Energies 15 07648 g006
Figure 7. Electrical characteristics of superconductor of resistance.
Energies 15 07648 g007
Figure 8. Non-inductive SCFCL in an electrical circuit.
Energies 15 07648 g008
Figure 9. Configuration of inductive shield SCFCL.
Energies 15 07648 g009
Figure 10. Diagram of saturated iron core type SCFCL.
Energies 15 07648 g010
Figure 11. Diagram of transformer type SCFCL in single line circuit.
Energies 15 07648 g011
Figure 12. Resistive type SCFCL.
Energies 15 07648 g012
Figure 13. Configuration of hybrid SCFCL.
Energies 15 07648 g013
Figure 14. Structure of flux lock type SCFCL.
Energies 15 07648 g014
Figure 15. Magnetic Shield SFCL (a) Full structural view (b) Cross-sectional view.
Energies 15 07648 g015
Figure 16. Series switch-type FCL.
Energies 15 07648 g016
Figure 17. Structure of series dynamic braking type.
Energies 15 07648 g017
Figure 18. Bridge-type FCL.
Energies 15 07648 g018
Figure 19. Structure of direct current link FCL.
Energies 15 07648 g019
Figure 20. Basic diagram of transformer-coupled bridge FCL.
Energies 15 07648 g020
Figure 21. Simple structure of resonant-type FCL.
Energies 15 07648 g021
Figure 22. Configuration of hybrid FCL.
Energies 15 07648 g022
Figure 23. Voltage profile of EDN.
Energies 15 07648 g023
Figure 24. Tested distribution system simulated on ETAP with five DGs.
Energies 15 07648 g024
Figure 25. Fault currents at buses with and without FCL.
Energies 15 07648 g025
Table 1. Different techniques for FCLs optimal allocation.
Ref.Objective FunctionProposed ToolTest System
PracticalStandard
[73]Minimum coordination index and FCL sizeMOPSO IEEE 33-bus and Part of IEEE 30-bus
[74]Minimum protection costGA13-bus distribution system
[75]Reliability of power system, economic impact. Increase the power network reliability and fault current short circuit current reductionNSGAII, MOPSO, and multiobjective evolutionary algorithm IEEE 39 and IEEE 57 bus systems
[76]Maximize transient stabilityangular separation of the rotors of synchronous machines IEEE benchmarked four-machine two-area system
[77]Minimum cost of the resistive FCLs and the fault currentsA MOPSO and a multiobjective artificial bee colony (MOABC) IEEE 33-node and 69-node distribution systems
[78]Minimum costs and fault currents to levels within breakers’ limitsiterative mixed integer nonlinearNorth American 395-bus transmission IEEE 9-bus, IEEE 30-bus system
[79]Minimum fault currentGA13-bus distribution system
[80]Minimum losses and the sizes of fault current limitersnondominated sorting GA (NSGA-II) IEEE 33-bus system
[82]Minimization of the number of FCLs to be installed in the systemhierarchical fuzzy logic decision with Hashing integrated GA and PSOA system of a manufacturing factory in TaiwanIEEE 30-bus system
[83]Minimum Cost, fault current mitigation, and maximum load reliability indexmulti-objective bat algorithm with Manto Carlo simulation IEEE 33-bus and IEEE 30-bus systems
[84]Maximizing the mitigation effect of FCLs and minimizing the FCLs costHybrid PSO-gravitational search algorithm IEEE 33 kV meshed distribution system
[34]Minimizing power losses, fault current, and FCL sizecoyote optimization algorithm (COA) with fuzzy-based multiobjective (FBMO)Part of East Delta Network (EDN)IEEE 33 and IEEE 69-bus systems
[85]Minimizing power losses, fault currents, FCL size, voltage deviation, and voltage stability indexA multi-objective coyote optimization algorithm (MOCOA) 85-bus Egyptian system of the East Delta Network (EDN)IEEE 33, 69, and 37-bus systems
[86]Limiting the high current by a resistive type of superconducting FCL Simulation by means of PSCAD/EMTDC software Three-terminal HVdc system
[87]Minimizing the number of FCLs, fault current reduction, and the total operating time of the relaysa scenario optimization-based approach 17-bus small test system
[88]Minimizing fault current and power losses Electrical TransientAnalyzer Program (ETAP) and a fuzzy-based multiobjective mechanism IEEE 21-bus and 28-bus distribution system
Table 2. Optimal allocation of DGs using GWO.
Case StudiedLosses (kW)DG Size (MW)/SiteDGs Power FactorMin. Voltage (Bus)
Initial805.73--0.909 (65)
Case 1277.251.833 (7), 1.392 (10), 3.857 (17), 4.696 (20), 1.719 (25)1, 1, 1, 1, 10.9822 (30)
Case 282.210.7124 (4), 2.815 (8), 3.651 (17), 3.82 (20), 2.499 (24) 0.85, 0.85, 0.85, 0.85, 0.850.988 (30)
Case 366.640.1869 (6), 3.149 (7), 3.7 (16), 1.808 (20), 1.656 (26), 0.7, 0.7067, 0.8044, 0.8414, 0.8450.991 (13)
Table 3. Fault current at different locations (8.26 × 10⁶ per unit FCL).
LocationIfault (kA)Reduction in Ifault (%)LocationIfault (kA)Reduction in Ifault (%)
1–2281.34%with DG228.2960.299%
2–328.3640.059%with DG328.3780.011%
2–1428.2690.39%with DG428.3780.011%
with DG128.3810%with DG528.380.00352%
Publisher’s Note: MDPI stays neutral with regard to jurisdictional claims in published maps and institutional affiliations.

