Abstract
One of the main elements that shape the production process in an underground mining plant is, in the broadest sense of the word, transport. Currently, a large amount of rolling stock from cable cars or suspended railways is maintained in mining plants, along with extensive infrastructure used for transporting crew and materials. The development of conveyor belt transport systems, as well as system process management, is increasing efficiency levels. Mining transport is a complex process, requiring large amounts of energy, which incurs significant production costs. We conduct a comparative analysis of the human transport system using a suspended railway with belt transport at Lubelski Węgiel “Bogdanka” Spółka Akcyjna (the largest hard coal mine in Poland), in terms of energy efficiency levels. We found that the process of transporting the crew in an underground mining plant to the production site using a conveyor belt system was less energy-intensive, and therefore created less emissions than the currently used model based on suspended queues. The analyses for the above project were conducted according to a model that was based on the study and analysis phase of the project through to its implementation and transfer to operational activities. The analysis was carried out based on the created simulation model, taking into account all elements of the crew transport process to and from the mining area. The implementation of the technical solution allowed for nearly a threefold reduction in the level of energy consumption and emissivity. In the analyzed model, the energy consumption in the first phase of production was 3.04 kWh per employee using the diesel rails system and 1.13 per employee using the belt conveyor system.
1. Introduction
An underground hard coal mining plant is a complex system of excavations. Its functions, apart from making the deposit available, include ventilation, supply of utilities, and transportation of people or things essential to the mining process, such as excavation equipment, materials, or crew. The exploitation of mining deposits that are located increasingly far from each other makes it necessary to develop new means of transport. The transport systems currently used to convey crew to workplaces, using rolling stock from suspended railways [Figure 1] and cable car railways, are much more energy-consuming than the alternative use of conveyor belts [Figure 2].
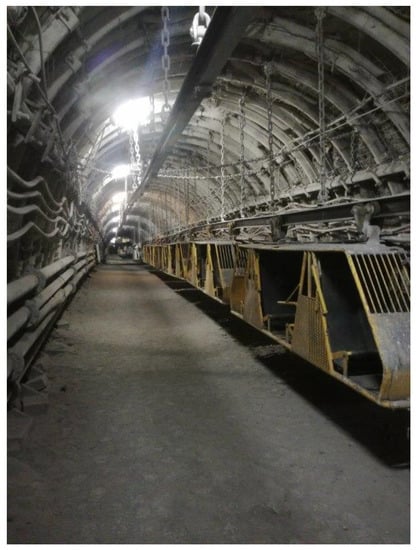
Figure 1.
Crew transport system using a suspended railway (Dawid Osowski, Lubelski Węgiel “Bogdanka” S.A.).
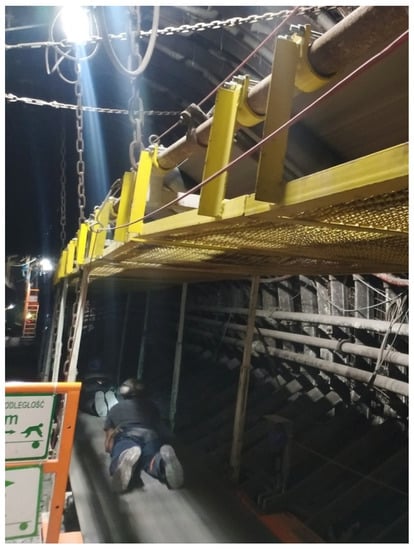
Figure 2.
Crew transport system using conveyor belts (Łukasz Cieślik, Lubelski Węgiel “Bogdanka” S.A.).
The energy efficiency of conveyor belts has been the subject of numerous scientific studies and publications in recent years. Widely used energy models and parameter identification methods were intended for conveyor belts with a motor and speed sensor. Chunyu Yang and Jinhao Liu, for the first time, described an energy model for a drive unit with two electric motors without speed sensors [1]. The energy model studied and described by Tebello Mathaba and Xiaohua Xia made it possible to predict electricity consumption and achieved better results than those previously described in the literature [2]. Measures to reduce the energy consumption of conveyor belts focus on the correct selection of drive systems, couplings, gearboxes, conveyor belt, belt tensioning systems, etc. [3]. Studies of conveyor belts (standard, energy-saving, and regenerated conveyor belts) have shown how the energy intensity of conveyor belts can be reduced by the correct choice of conveyor belts. As studies show, the energy intensity of a conveyor belt in practice also depends on the type and condition of the conveyor belt, as well as the ambient temperature [4]. An important element is the reduction of traffic resistance to achieve relatively low electricity consumption [5]. In underground mines, transport is carried out under changing environmental conditions. Suggestions for systems to assist the operator in performing inspection tasks of underground transport systems are described in the literature [6,7,8]. Activities in the field of conveyor belt diagnostics also include the measurement of the dynamic loads of the conveyor belt in different operating states [9], or its faults using artificial intelligence methods to construct neural networks for proper fault detection [10]. The main component of a conveyor belt is the belt, which is crucial for efficient and reliable operation. The tape is the most expensive and least durable element. Conveyor belts operate in a closed circuit, the parameters of which depend, inter alia, on the length and type of conveyor belt used [11].
The issue of transporting crew to workplaces is particularly visible during the operation of walls and mining excavations at a significant distance. In the current model, the concept of using conveyor belts was adapted to the passage of people that coincided with the launch of a mining wall operated by combine technology at Lubelski Węgiel “Bogdanka” S.A., with the longest walkway in the world (7100 m long). The technical problems encountered during the initial wall operation when transporting the crew by suspended railway prompted the operator to take action to optimize the process of transporting the crew to locations 8750 m away from the material and downhill shaft.
Before this wall came into operation, thorough market research was carried out for alternative means of crew transport. It was decided that there were other solutions that had not been used in underground transport at Lubelski Węgiel “Bogdanka” S.A., due to technical, organizational, and economic barriers, or failure to meet safety standards. In recent years, research and development work have been carried out in the mining industry aimed at the development of individual means of horizontal transport. These include a bicycle driven by muscle power, suspended to the running track of an overhead railway (with patent protection) and a bicycle moving along the bottom of the excavation area. Even though it was possible to create prototype systems and carry out operational tests, neither of these solutions received recognition from the users or the mining supervisory authorities and were therefore never implemented. Currently, the problem faced by teams of engineers designing crew transport routes to mining areas is the constantly increasing distance to deposits, which, in turn, extends the crew’s journey time to workplaces. Another problem is the increase in the ambient temperature, which makes it necessary to reduce the total working time to six hours (Appendix No. 3 of the Regulation of the Minister of Energy of 23 November 2016 on specific requirements for the operation of underground mining plants p.4.3.3: “Where the working hours of endangered workplaces exceed 2 h, the persons performing the work shall be employed in reduced working hours on a six-hour working shift calculated together with the time of departure and exit”) [12]. Improvements to crew working conditions, as well as machinery and equipment, can be made using energy-consuming cooling systems. Reduced working time makes it necessary to provide additional transport to the crew as they leave the workplace, using additional rolling stock at the expense of transport to other areas of the mine. The operation of rolling stock over an unprecedented distance has encountered several technical and organizational barriers. These barriers include the need for the crew to wait before leaving the passenger station, due to the limited capacity of the material and downhill shaft and the need to introduce additional production changes to increase the effective working time of machines and devices. The introduction of conveyor belts, compared with suspended rail transport, has produced many potential advantages. The introduction of fluid movement between the excavation areas of the mining plant resulted in shorter journey times to the workplace, and also ensured the fluidity of transport in and around mining areas. Transport by suspended rail generated additional operational delays resulting from arranging underground transport and devising safety rules. The organizational and technical characteristics of the relevant type of transport affect the length of effective working time in the wall. After further analysis of the effects of the development of new crew transport systems to workplaces, it was possible to use longwall equipment more effectively by transferring the shift directly to the workplace with a minimum number of production changes. This also affected the total energy consumption of the mining process. The introduction of conveyor belt transportation made it possible to increase the use of suspended railway rolling stock for transporting machinery, equipment, and materials. Other benefits of the project included an improvement to the microclimate by withdrawing combustion kits previously used for transporting the crew in and around mining areas, reducing the number of devices generating heat and reducing exhaust emissions to fresh air current, dust, noise, etc.
The process of transporting crew horizontally in coal mines in Poland currently requires the use of rolling stock from lower-rise and suspended railways. Locomotives are propelled by diesel internal combustion engines or battery-powered electric motors. Most of the mining locomotive fleet is equipped with diesel engines, and their power varies from 80 to 142 kW [13,14]. The standard crew transport system, using passenger sets from suspended railways, can accommodate up to 66 people, including two service people. The literature indicates that suspended railway transport first came into use in 1976, when the first suspended locomotive was developed in Poland. The test were carried out at the Ziemowit Coal Mine in 1979–1980 [14]. Data from 31 December 2016 show that 566 suspended machines were in operation in the Polish mining sector at the time [13]. The main aim of implementing and developing an underground transport system of suspended rail railways with trains powered by combustion engines was to ensure the effective transport of materials. “The implementation process required a change in the route design and suspension system. The basic criterion was the transmission of longitudinal force, resulting in the development of new solutions for rail connections etc.” [14]. With the progress of extraction in mining areas, the range and functionality of suspended railway networks are constantly changing. As mining operations progress, running tracks are being shortened, old passenger stations (SOPs) are being liquidated, and new ones are being created. The issue of safety in suspended rail transport has been published several times. These have included results of studies and numerical simulations that also affect transport comfort [15,16,17,18]. The problem of transport at higher speeds is particularly evident in the emergency braking of the hovering track. The introduction of innovative sequential emergency braking in the mining sector will minimize the impact on the operator and passengers and reduce the dynamic loads on the line and load-bearing elements [19]. One of the reasons for the popularity of the suspended cable cars was its high load capacity and the lack of contact between the machine and the spider, which could lead to bulges and deformations in unfavourable mining and geological conditions. The maximum permissible speed of the hovering railway during the transport of personnel may be between 1 and 3.3 m/s and depends on national legislation [20]. According to the author of the article “Development of New Mean of Individual Transport for Application in Underground Coal Mines”, the transport of crew and material in underground mining cavities to remote areas is not a problem today, as overhead railways are a safe and fast means of transport. However, the transport of individual persons or small goods over long distances is problematic. The lack of available means of transport for private transport in underground mines, the high costs, and the many restrictions imposed by the legislation are noticeable limitations for suspended railways [21]. In Lubelski Węgiel “Bogdanka” S.A., the length of active transport excavations exceeds 130 km in length; the rolling stock used on the suspended railway varies among 100 machines, whereas the length of conveyor belt routes possible to use during crew transport varies within a range of 50 km, making the crew transport system highly flexible. When using conveyor belts, it is possible to create different system configurations. The regulations also make it possible to transport the crew on excavated material at speeds not exceeding 2.5 m/s, conducting transport on both belts using two systems: tape over belt or tape next to belt. Transport lines used for the transport of the crew can be main, longwall, ancestral haulage systems, or gangue transport systems. Alternatively, they can also be built for transporting the crew along the ramp or the sidewalks of the walls. The selection of belt conveyors was carried out using QNK-TT software, to support the design of conveyor belts [22] and analyze factors such as the required power of the drives, angle of inclination when excavating, length of the conveyor, width of the belt, and many other parameters. The selection of conveyor power is a key parameter of its operation and has a significant impact on its optimal operation. The wattage of the power units varies between a dozen and several hundred kilowatts and enables the conveyors to operate. The conveyors may be up to several kilometers long. The process of controlling conveyor belt systems is carried out locally or remotely. Mining plants are increasingly choosing to introduce one-control-rooms, enabling central control, monitoring, and effective management of transport systems equipped with belt conveyors. This transport system enables a flexible flow of crew, materials, and spoil around the mining plant.
In June 2017, the Polish law introduced the Regulation of the Minister of Energy of 23 November 2016 on detailed requirements for the operation of underground mining plants [12]. The regulations have unified and simplified the rules for the use of conveyor belts adapted to the passage of people. The registration was a milestone in the implementation of projects related to the use of conveyor belts in underground mines. Companies are becoming more willing to use this means of transport in mining operations and are more often applying to mining supervisory authorities for permission to issue derogations from the applicable regulations aimed at optimizing and increasing the efficiency of transport systems based on conveyor belts [23].
In underground hard coal mines, the production process is carried out with emphasis on optimizing energy use, which has become particularly important in recent years. Many measures are being taken to reduce energy consumption, which brings economic benefits to businesses. Projects implemented in mines are aimed at optimizing the production process by reducing its energy consumption, as well as improving the reliability and utilization of machines. For this reason, we have focused on comparing the energy balance of two horizontal means of transporting crew to workplaces: using a suspended diesel railway with a conveyor belt adapted to it. Driving people on belt conveyors is considered the safest means of transport in underground mining [24,25]. We estimate the amount of energy consumed by the process of transporting the crew to the production site using a conveyor belt system, in comparison with the currently used model based on suspended lines.
2. Materials and Methods
During the analysis, an original comparative model was developed to assess the emissivity of greenhouse gases and energy intensity of the two means of crew transport. The estimation of energy intensity and emissivity of GHG was carried out on the basis of the results of calculations by Lubelski Węgiel “Bogdanka” S.A. and the conversion factors used in Poland, as presented in the report of the National Centre for Emissions Balancing and Management (KOBiZE), containing CO2, SO2, NOx, CO, and total dust benchmarks for electricity [26], as well as calorific values (WO) and CO2 emission factors (EC) in 2018 for reporting under the Emissions Trading System in 2021 [27]. The main aim of assessing energy consumption and GHG emissivity was to determine the impact of consumption and the types of energy used in the natural environment. These coefficients allowed us to determine the benefits of modernization of the machine park or assess the appropriate trends in the use of energy sources. The following conversion algorithm, presented below, was used.
When calculating energy intensity and emissivity based on the fuel oil consumed (raw material burned by the drive engines of suspended railways), the consumption of heating oil in transport was multiplied by its calorific value Wo = 43 MJ/kg (according to a document published by the National Centre for Emissions Balancing and Management (KOBIZE) entitled, “Calorific values (WO) and CO2 emission factors (EC) in 2018 for reporting under the Emissions Trading System for 2021”) [27]. The amount of energy calculated using this formula was then converted from MJ to GJ, for subsequent stages of calculation (or rather the names of the emission factors). Then, the GHG emissivity of the used oil was calculated. For this purpose, the energy consumed in GJ was multiplied by the fuel oil benchmark per unit of its energy We = 74.10 kg CO2/GJ (according to a document published by the National Center for Balancing and Emission Management (KOBIZE) entitled, “Calorific values (WO) and CO2 emission factors (EC) in 2018 for reporting under the Emissions Trading System for 2021” [27]). As the KOBIZE benchmarks only refer to CO2 itself, following the AR6 GHG Protocol document, emissions emanating from CH4 and N2O [27] related to CO2 were added to the CO2 emission result. This was done by adding the CO2 to the result, the sum of it being multiplied by 0.000443 and 28 (in relation to CH4 emissions), and its value multiplied by 0.0000258 and 265 (in relation to N2O emissions).
When calculating the emissivity of the electricity consumed (power supply for conveyor belts adapted for passenger transport), the amount of electricity consumption was multiplied by the emissivity index provided by the energy supplier for Lubelski Węgiel “Bogdanka”, amounting to We = 747 kg CO2/kWh [27]. As the benchmarks used only refer to CO2 itself, following the AR6 GHG Protocol [28], emissions from CH4 and N2O emitted with CO2 had to be added to this result. An analogous conversion algorithm was used for this, as in the case of heating oil. It was multiplied by 0.000443 and 28 (for CH4 emissions) and by 0.0000258 and 265 (for N2O emissions) and then added to the result obtained for CO2 emissions.
The simulation model for energy demand was based on production data including the number of crew on individual production shifts, the number of production shifts, crew journey times to workplaces, the number and type of rolling stock, as well as the current distance of the front of the wall to the shaft. The development of the model was possible due to previously gained experience and observations of the production process. The model estimated the energy intensity and GHG emissivity of the transport process based on the transport system used. Further considerations made it possible to determine the energy demand for individual means of transport per employee, per ton of coal extracted, or per daily production cycle. The work carried out made it possible to estimate energy consumption and GHG emissivity for the means of transport used in the model in relation to their power source. The simulation was carried out for the 250 m wall life cycles adopted at Lubelski Węgiel “Bogdanka“ S.A. For each cycle, the maximum number of crew that can be transported by the suspended railway—depending on production needs—is set at 64 people. A similar number was set for transport using belt conveyors. Depending on the progress of the operation, six, five, or four production changes were adopted for crew transport by suspended railway. This is due to the significant journey time, which is additionally explained in the next chapter. For transport using conveyor belts, the number of changes would be constant, amounting to four shifts from the beginning to the end of operations, and the transport process itself can be either synchronous (using both the lower and upper belts) or non-synchronous (using each belt separately). Ensuring optimal operation in the wall area during the mining production cycle is possible using four shifts, where one, two, and three shifts lead mining, whereas four is a maintenance change. During the fourth shift, inspections of machinery and equipment, transports, and cleaning work are carried out. In the production cycle, the first and last changes are the most numerous, which was noted in the analysis.
3. Results and Discussion
Our model was created based on actual production data. The analysis was carried out for the actual model of wall operation based on the work of six, five, and four production shifts. Their reduction depended on the progress of works. The mining model in the region was divided by so-called technological commas separated by 2500 m; overcoming these with the front of the wall made it possible to reduce subsequent production changes, so that the final end of the wall’s operation was carried out using four production changes. Table 1 lists the distances from the material and downhill shaft for individual stages of the operation of the discussed wall and its basic technical parameters, enabling further calculations and analyses.

Table 1.
Summary of distance from the material to downhill shaft and operational parameters of the mining wall.
The maximum distance at the beginning of operation was 8750; this was set to reach a distance of 1650 m from the shaft at the end of this process, which is overcome on foot in the case of crew transport using belt conveyors. For each stage of operation, two values for the distance to be covered using a specific means of transport were assigned. The first value was the length of the route via which the crew would be transported by suspended railway (8750 m). The second value was the length of the road to be covered using a conveyor belt system. The difference between the individual values was 1650 m, which meant that in this model, employees would have to reach the embarkation point of the conveyor belt on foot. Individual stages of exploitation of mining areas will involve various numbers of crew, as subsequent production changes for transport by suspended rail are eliminated. Mining parameters, i.e., the thickness of the wall seam or its length or yield, were used to analyze the energy consumption and CO2 emissivity per 1 Mg of extracted coal.
The analysis required a statement of the power of the locomotive rolling stock in accordance with the manufacturer’s technical documentation and methodological requirements [13,14]. In the analyzed case, it was possible to use one of three types of diesel locomotives. For the purposes of the analysis, a diesel tractor marked Number 1 was used. The manufacturer’s data determined the energy intensity of diesel engines in kg/kWh, which required further conversion into kWh/km to finally determine the need for a daily production cycle per ton of coal or per employee. Table 2 shows the energy intensity of the engines of the three leading manufacturers of internal combustion tractors.
Table 2.
Summary of power and energy consumption of selected engines of suspended locomotives.
Data on conveyor belts were taken from the QNK-TT program to support the design of conveyor belts, enabling the required operating parameters of belt conveyors to be set. The devices were equipped with standard drive units selected from the series, so as to cover the maximum power requirements for the conveyor belt. The case was analyzed with regard to the purpose of the belt conveyor, setting the parameters for excavation (its rise or fall), and its total length, selecting and locating the tensioning system, braking method, and belt parameters. A summary of the results of the analysis of the series of conveyors used to transport the crew in and around the mining area is presented in Table 3.
Table 3.
Basic parameters and results of conveyor verification calculations.
The graphical description of the analysis is shown in Figure 3. It as used for an accurate, graphical presentation of the results of the calculations carried out for selected conveyor operating states.
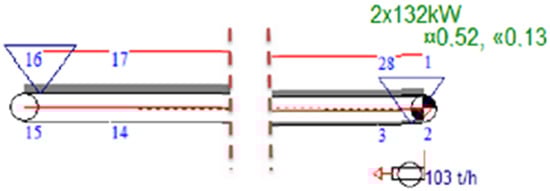
Figure 3.
Conveyor route profile.
The results of the analysis in QNK-TT are summarised in Table 4. For the analysis, a power unit equipped with two motors, with a capacity of 132 kW each, was used. The selection of the power of the unit (engine power) was dependent on the availability of engines presented in the manufacturer’s catalogue, as well as other factors, including the required engine power specified by the QNK-TT program.
Table 4.
Summary of power and energy intensity of the belt conveyor series in the analyzed model.
The required maximum power of the device is 138 kW. When driving a conveyor belt, it is possible to move at speeds of up to 2.5 m/s (9 km/h). The following summary made it possible to calculate the actual energy consumption during the transport cycle using the lower and upper belt at the same time, amounting to 7.67 kWh/km. Further considerations are based on the value of 15.33 kWh/km, due to the possibility of moving the crew either only on the upper or the lower belt.
Figure 4 and Figure 5 show the relationship between energy demand and the GHG benchmark of the crew transport process, using the respective means of underground transport analyzed, suspended rail, and conveyor belts, based on the daily production cycle from the distance of the shaft. The graphic image of the crew transport process is presented 1650 m from the shaft, due to the location where the crew board the conveyor belt. The level of energy efficiency improvement (reduction in energy consumption) for the first cycle of wall work was 7100 m, i.e., 3.5 times the difference in values for individual means of transport. The energy intensity was 1555 kWh per daily transport cycle for suspended rail transport and 435 kWh per daily transport cycle for conveyor belt transport [Figure 4], whereas the GHG emission levels were 1090 and 325 kg, respectively [Figure 5], and 1111 and 331 kg, respectively [Figure 5]. These values change linearly depending on the distance of the front of the wall from the material and downhill shaft. This can be seen in Figure 4 and Figure 5. The breaking points of the energy intensity charts and GHG benchmarks indicate a reduction in production changes from six to five shifts (from 512 employees to 448 employees after) on reaching a distance of 6250 m from the shaft and from five to four shifts (from 448 employees before to 384 employees after) on reaching a distance of 3750 m from the shaft. This is the result of reducing the number of crew transported to the mining area as the wall progresses. The level of energy consumption and GHG emissivity of the transport process depends on the length to of the crew’s transport route. In this case, the crew travels 1650 m, so they can continue to be transported using belt conveyors, which is why the ratio of energy consumption and the GHG measurement index for individual means of transport depends on the number of production changes. This is also illustrated by the graphs shown in Figure 4 and Figure 5. The angle of inclination of individual areas of the graph proportionally increases depending on the number of production changes. The course of the straight line illustrating the energy intensity and GHG emissivity index for crew transport using conveyor belts is linear and increases in proportion to the distance traveled.
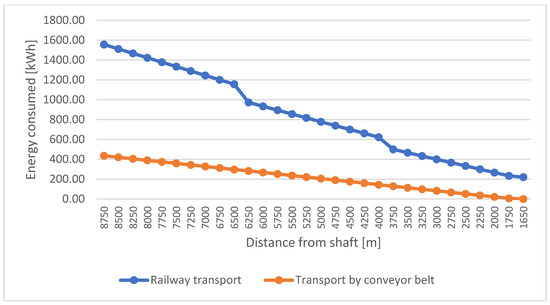
Figure 4.
Energy required for the daily crew transport cycle using belt conveyors and suspended railway rolling stock.
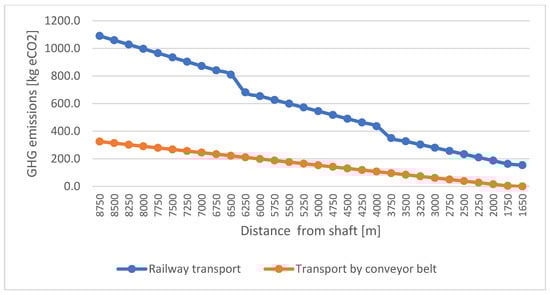
Figure 5.
GHG emission value for the daily crew transport cycle using conveyor belts and suspended rail rolling stock.
Transport speed plays a particularly important role in the analysis: for conveyor belts, it is 2.5 m/s, whereas transport by suspended rail goes at the maximum theoretical speed of 2 m/s. However, due to the organization of transport and the horizontal course of the route (ascents and descents), the speed is actually even lower. In practice, it fluctuates around 1.1 m/s.
For the analysis, a simulation model was created, taking into account all elements of the crew transportation process to and from the mining area. It assumed daily production cycles exceeding 15 m of mining wall progress. For each shift, the number of people that could be transported using the available suspended railway system was set: 64 people (8 wagons of 8 people), plus a driver and escort. The number of crew was compared to that for transport using conveyor belts. The results of the calculations are presented in Table 5, Table 6, Table 7 and Table 8.
Table 5.
Summary of work progress, crew size, and rolling stock of suspended railways.
Table 6.
Results of GHG energy intensity and emissivity calculations for the daily production cycle.
Table 7.
Results of GHG energy intensity and emissivity calculations for one ton of extracted coal.
Table 8.
Results of GHG energy intensity and emissivity calculations for one employee.
4. Conclusions
To the best of our knowledge, the problem of efficiency and energy intensity of the crew transportation process in an underground mine has not yet been the subject of any research, analysis, or scientific publications. The data summary shows the legitimacy of actions aimed at introducing belt transport devices, which are not commonly used in underground crew transport, especially at long operating distances from mining shafts. Following the analyses conducted, conveyer belt transportation can be considered much more energy-efficient and less emissive than classic solutions. In addition, it should be noted that, for the purpose of the analysis, it was assumed that the crew could only be transported along the upper or lower belt. However, it is possible to introduce simultaneous transport along the upper and lower belt, which would further reduce the amount of energy consumed and GHG (greenhouse gas protocol) emissions caused by underground crew transportation. In addition to the above indicators, maintaining the efficiency of the conveyor belt system is less laborious than for suspended lines. In the case of diesel locomotives, it is necessary to travel to the locomotive depot once a day for inspection and refueling. To sum up, there is great potential for the use of conveyer belts for crew transportation in far-reaching coal seams. This system fits into the numerous cost optimization strategies announced for the underground mining sector in Poland, bringing significant economic effects while increasing the efficiency of the production process. The use of conveyor belts also makes it possible to consolidate energy sources by using one single source of energy underground. It is possible to use RES (renewable energy sources) to power such an energy-efficient machine park. The GHG (greenhouse gas protocol) benchmark level obtained in the research was 3.5 times lower for conveyor belt transport in the initial phase of wall operation than for the suspended railway transport system, which is particularly important when operating in remote mining areas. The introduction of a crew transport system using belt conveyors also has the advantage of significantly reducing energy consumption and emissions of SO2, NOx, CO, and total dust into the atmosphere. At the same time, it reduces the amount of energy consumed by the mining process itself. The surge in energy intensity is particularly noticeable as the number of crew transported to workplaces increases, and all this is related to the need to use additional means of rail transport. Mining operations in areas located far away from shafts necessitates the introduction of additional production changes not reflected in the level of work efficiency. In the case of crew transport using conveyor belts, existing conveyor belts could be used. Only modernization would be required, and the amount of modernization required depends on what each device is used for. The scope for modernization includes installing platforms for entry and exit, as well as retrofitting automation and control systems. Current activities in underground mines are designed to raise the awareness of engineers and users in the area to select an energy-efficient and low-emission machine park.
Apart from the results of the above analyses, we believe that the development of conveyor belt infrastructure for moving people around in underground mining plants is a process that will benefit the economic condition of the entire mining sector. The process of mining in operational areas should be formulated on specific proposals for crew transport system solutions using conveyor belts, starting from design works, by selecting the appropriate machine park or raising safety standards for the benefit of the crew. The case of Lubelski Węgiel “Bogdanka” Spółka Akcyjna shows the effectiveness of the actions taken, which, in addition to reducing the energy intensity and GHG (greenhouse gas protocol) emissivity of the crew transportation process, also brings economic and organizational benefits.
Author Contributions
Pre-research data collection for this article was done by P.B., Ł.C. and D.O. P.K. was responsible for project management, obtaining funding, and reviewing the article. All authors have read and agreed to the published version of the manuscript.
Funding
This research was funded by Lubelski Węgiel BOGDANKA S.A.
Data Availability Statement
Source data on the research and its results are in the possession of the authors of this article.
Conflicts of Interest
The authors declare no conflict of interest.
References
- Yang, C.; Liu, J.; Li, H.; Zhou, L. Energy Modeling and Parameter Identification of Dual-Motor-Driven Belt Conveyors without Speed Sensors. Energies 2018, 11, 3313. [Google Scholar] [CrossRef]
- Mathaba, T.; Xia, X. A Parametric Energy Model for Energy Management of Long Belt Conveyors. Energies 2015, 8, 13590–13608. [Google Scholar] [CrossRef]
- Bajda, M.; Hardygóra, M.; Marasová, D. Energy Efficiency of Conveyor Belts in Raw Materials Industry. Energies 2022, 15, 3080. [Google Scholar] [CrossRef]
- Bajda, M.; Hardygóra, M. Analysis of the Influence of the Type of Belt on the Energy Consumption of Transport Processes in a Belt Conveyor. Energies 2021, 14, 6180. [Google Scholar] [CrossRef]
- Kawalec, W.; Suchorab, N.; Konieczna-Fuławka, M.; Król, R. Specific Energy Consumption of a Belt Conveyor System in a Continuous Surface Mine. Energies 2020, 13, 5214. [Google Scholar] [CrossRef]
- Dabek, P.; Szrek, J.; Zimroz, R.; Wodecki, J. An Automatic Procedure for Overheated Idler Detection in Belt Conveyors Using Fusion of Infrared and RGB Images Acquired during UGV Robot Inspection. Energies 2022, 15, 601. [Google Scholar] [CrossRef]
- Shiri, H.; Wodecki, J.; Ziętek, B.; Zimroz, R. Inspection Robotic UGV Platform and the Procedure for an Acoustic Signal-Based Fault Detection in Belt Conveyor Idler. Energies 2021, 15, 327. [Google Scholar] [CrossRef]
- Szrek, J.; Jakubiak, J.; Zimroz, R. A Mobile Robot-Based System for Automatic Inspection of Belt Conveyors in Mining Industry. Energies 2022, 15, 327. [Google Scholar] [CrossRef]
- Marasova, D.; Andrejiova, M.; Grincova, A. Dynamic Model of Impact Energy Absorption by a Conveyor Belt in Interaction with the Support System. Energies 2022, 15, 64. [Google Scholar] [CrossRef]
- Olchówka, D.; Rzeszowska, A.; Jurdziak, L.; Błażej, R. Statistical Analysis and Neural Network in Detecting Steel Cord Failures in Conveyor Belts. Energies 2021, 14, 3081. [Google Scholar] [CrossRef]
- Bajda, M.; Hardygóra, M. Analysis of Reasons for Reduced Strength of Multiply Conveyor Belt Splices. Energies 2021, 14, 1512. [Google Scholar] [CrossRef]
- Rozporządzenie Ministra Energii z dnia 23 listopada 2016 r. w sprawie szczegółowych wymagań dotyczących prowadzenia ruchu podziemnych zakładów górniczych (Dz.U. 2017 poz. 1118) wymagań dotyczących prowadzenia ruchu podziemnych zakładów górniczych. Available online: https://isap.sejm.gov.pl/isap.nsf/DocDetails.xsp?id=WDU2017000111 (accessed on 7 October 2022).
- Pieczora, E.; Suffner, H.; Instytut Techniki Górniczej KOMAG. Rozwój napędów dołowych kolejek podwieszonych. Maszyny Górnicze 2017, 3, 44–57. [Google Scholar]
- Pieczora, E.; Tokarczyk, J. Instytut Techniki Górniczej KOMAG. Development of mine underground transportation with use of suspended monorails. Min. Inform. Autom. Electr. Eng. 2017, 4, 96–117. [Google Scholar]
- Tokarczyk, J.; Michalak, D.; Rozmus, M.; Szwerda, K.; Żyrek, L.; Žeznik, G. Ergonomics assessment criteria as a way to improve the quality and safety of people’s transport in underground coal mines. Int. Conf. Appl. Hum. Factors Ergon. 2019, 955, 305–317. [Google Scholar]
- Herbuś, K.; Szwerda, K.; Świder, J. Virtual prototyping of the suspended monorail in the aspect of increasing the permissible ytavel speed in hard coal mines. Eksploat. Niezawodn. Maint. Reliab. 2020, 22, 610–619. [Google Scholar] [CrossRef]
- Szewerda, K. Supporting development of suspended underground monorails using virtual prototyping techniques. IOP Conf. Ser. Mater. Sci. Eng. 2019, 545, 012018. [Google Scholar] [CrossRef]
- Szewerda, K.; Tokarczyk, J.; Božek, P.; Michalak, D.; Drwięga, A. Vibrations diagnostics and analysis in operator’s and passenger cabins of a suspended monorail. Acta Montan. Slovaca 2020, 25, 150–158. [Google Scholar]
- Świder, J.; Szwerda, K.; Herbuś, K.; Jura, J. Testing the impact of breaking algorithm parameters on acceleration and breaking distance for a suspended monorail with regard to acceptable travel speed. Energies 2021, 14, 7275. [Google Scholar] [CrossRef]
- Szewerda, K.; Tokarczyk, J.; Wieczorek, A. Impact of Increased Travel Speed of a Transportation Set on the Dynamic Parameters of a Mine Suspended Monorail. Energies 2021, 14, 1528. [Google Scholar] [CrossRef]
- Kamiński, P. Development of New Mean of Individual Transport for Application in Underground Coal Mines. Energies 2021, 14, 2022. [Google Scholar] [CrossRef]
- QNK-TT Computer Program to Support the Construction of Conveyor Belts, User Manual and User Manual (Updated January 2009). Available online: http://www.entertech.com.pl/en/node/28 (accessed on 27 June 2022).
- Kamiński, W.; Orzeł, P.; Kawencki, J. Nowoczesne metody transportu załogi w kopalni węgla kamiennego—jazda ludzi przenośnikami taśmowymi w Zakładzie Górniczym Sobieski. Inżynieria Górnicza 2014, 2, 14–18. [Google Scholar]
- Jazda osób przenośnikami taśmowymi przeznaczonymi do jazdy ludzi. WUG. 2015. Available online: https://www.wug.gov.pl/bhp/jazda_osob_przenosnikami_tasmowymi_przeznaczonymi_do_jazdy_ludzi (accessed on 16 May 2022).
- Wituła, M.; Widera, P.; Carbomech, sp. z o.o. Nowe propozycje w zakresie jazdy ludzi przenośnikami taśmowymi—Jazda ludzi na urobku. Transport 2010, 1, 1–3. [Google Scholar]
- Available online: https://www.enea.pl/grupaenea/obowiazki/struktura/struktura-paliw_2020_enea-trading.pdf (accessed on 26 June 2022).
- Available online: https://www.kobize.pl/uploads/materialy/materialy_do_pobrania/wskazniki_emisyjnosci/Wskazniki_emisyjnosci_grudzien_2021.pdf (accessed on 27 June 2022).
- GHG Protocol. 2021. Available online: https://ghgprotocol.org/sites/default/files/standards/ghg-protocol-revised.pdf (accessed on 25 May 2022).


Publisher’s Note: MDPI stays neutral with regard to jurisdictional claims in published maps and institutional affiliations. |
© 2022 by the authors. Licensee MDPI, Basel, Switzerland. This article is an open access article distributed under the terms and conditions of the Creative Commons Attribution (CC BY) license (https://creativecommons.org/licenses/by/4.0/).