1. Introduction
Under the background of carbon peaking and carbon neutrality goals, the operation of the power market will inevitably change, and with the continuous deepening of power market reform, especially the release of the National Development and Reform Commission’s “Notice on further deepening the market-oriented reform of on grid electricity price for coal-fired power generation” [
1], which stipulates that all commercial and industrial companies will enter the market to purchase electricity, the number of market entities has increased drastically, the scope of market transactions has expanded, and the market environment has become increasingly complex. At the same time, external market factors such as coal shortage and dual control systems of total energy consumption and energy intensity [
2,
3] in the past two years have further increased the uncertainty of market operation and brought challenges to the analysis and control of the market situation.
It is necessary to carry out research on the operation of the power market from a macro perspective, analyze the trend of key market operation indicators under different scenarios with the changes in internal and external factors influencing the market, and provide references for relevant departments to make decisions. To the best of the authors’ knowledge, there is a lack of results in the existing literature on the simulation analysis of the medium- and long-term operation of provincial power markets using system dynamics methods, and similar studies have focused mainly on the construction of key indicators of power market operation and the analysis of historical market operation data to analyze and assess the market operation.
In terms of the construction of key indicators for power market operation, Zhao et al. [
4] established market operation indicators of interconnected power systems under multiple types and scenarios to reflect the operation and management status of the power market from multiple perspectives. In terms of the construction of specific provincial power market operation indicators in China, Wei et al. [
5] selected diversified market evaluation key indicators and analyzed the operation status of the Guangxi power market in 2018; Huang [
6] and Shi [
7] both designed different multi-level evaluation indicator systems for Guangdong power market. The analysis of the provincial power market operation situation from the perspective of index construction lacks scenario analysis, and it is difficult to analyze the trend of market changes in the medium and long-term time periods.
In terms of market historical operation data analysis, it is applied to model and evaluate the operation status of the power market through different indicator analysis methods [
8,
9,
10]. Hu [
11] combined the industrial organization theory to prefer evaluation indicators and improved the traditional spot price index, thus better reflecting the market spot operation status. The assessment of provincial power market operation status from the perspective of market historical data analysis relies on actual market operation data, and such studies are difficult to consider real-time policy changes and lack prognostic market status analysis.
System dynamics models, as a practical tool for modeling complex systems, have been used in regional power system operation analysis and power market simulation, although they have not been applied in the study of medium- and long-term operational dynamics problems in provincial power markets. For example, a regional energy supply and demand balance system dynamics model considering transmission constraints was constructed to analyze in depth the regional different energy supply and demand situations [
12]. Song Y.H. [
13] constructed a system dynamics-based electricity demand forecasting model. Song H.L. [
14] constructed a system dynamics-based model to study the simulation of cross-regional electricity resource supply and demand under multiple factors.
In summary, there is a lack of models to systematically study the medium- and long-term operation of provincial power markets from the macro level, and similar studies have been conducted mainly to analyze and assess the current operation of the market without considering real-time policies and lacking relatively advanced analysis. The existing studies generally construct market evaluation indexes first, then combine them with market operation data to analyze from multiple perspectives, and then assess the market operation situation.
Therefore, this paper combines the published policies and future trends of the power market, considers diversified internal and external market influencing factors, and constructs a system dynamics simulation-based analysis model of the power market dynamics. In the simulation part, the characteristics of the market operation indicators are explored in different scenarios, and the medium- and long-term market operation situations are studied from multiple scenarios. The results show that the changes in internal and external factors in the market will change the equilibrium of market operation, and corresponding measures need to be taken to make the market operate in a reasonable range.
2. The Key Indicators of Power Market Operation Situation
This paper describes the market operation trend from five aspects: the proportion of new energy electricity, the overall supply and demand of the market, carbon emission measurement, the income of market members, and the trend of market electricity prices. The main indicators considered in this paper include the market share of renewable energy power, the annual supply–purchase ratio of marketed electricity, the total annual carbon emissions on the generation side, the profit potential ratio of thermal power units, and the volatility of clearing price correspondingly. This paper innovatively puts forward the market operation trend index, without reference to other literature. The specific indicators are defined as follows.
2.1. The Market Share of Renewable Energy Power
The calculation formula for the marketed renewable energy power share is:
where
is the proportion of marketed renewable energy power,
are the annual marketed photovoltaic power, annual marketed wind power, and total annual power on the generation side, respectively.
The market share of renewable energy power reflects the power supply structure of the provincial power system and the composition of marketed electricity. As renewable and clean energy sources, wind power and photovoltaics will gradually replace the dominant position of traditional thermal power, so the power supply structure on the power generation side will affect the medium and long-term operation of the power market.
2.2. The Annual Supply–Purchase Ratio of Marketed Electricity
The formula for calculating the annual supply–purchase ratio of marketed electricity is:
where
denote the annual supply–purchase ratio, the total annual generation-side bidding quantity, and the total annual consumption-side purchased a quantity of marketed electricity, respectively.
Usually, the bidding power on the power generation side and the purchased power on the customer side are not exactly equal. When the annual supply and purchase ratio of marketed electricity is large (greater than 1), the supply is greater than the demand, and there is a surplus of marketed electricity; when the annual supply and purchase ratio of marketed electricity is small (less than 1), the supply is smaller than the demand, and there is a shortage of marketed electricity.
2.3. The Total Annual Carbon Emissions on the Generation Side
The total annual carbon emissions from the generation side are calculated as:
where
denote the total annual carbon emissions from the power generation side, the annual carbon emissions from coal-fired power generation, and the annual carbon emissions from gas-fired power generation, respectively.
Since the carbon emissions from wind power and photovoltaic are basically negligible in the operation stage, the carbon emissions from the generation side of the market mainly come from coal-fired and gas-fired generating units.
2.4. The Profit Potential Ratio of Thermal Power Units
The profit potential ratio of thermal power units is calculated by the formula:
where
denote the profit potential ratio of thermal power units, the average clearing price, and the average unit cost of electricity for thermal power units, respectively.
The profit potential ratio of thermal units reflects the overall profit potential of coal-fired and gas-fired generating units, and the larger the indicator, the higher the profitability.
2.5. The Volatility of Clearing Price
Define the clearing price volatility indicator, which is calculated as:
where
denote the volatility of the clearing price, the annual average clearing price, and the average clearing price of the previous year, respectively.
The volatility of clearing prices reflects the trend of clearing prices, and as a signal of great interest to market members, reflects the state of operation of the market.
3. System Dynamics Model of Power Market Operation Situation
In order to systematically analyze the key indicators of market operation under the influence of various factors in the market, this paper uses the system dynamics theory to establish the corresponding system dynamics model. The power market simulation operation system is divided into generation side block, consumption side block, and analysis block. The system dynamics model of the power market operation situation is constructed, in which the stock flow diagram of the system is shown in
Figure 1. Each sub-module contains the relationship between different factors inside and outside the market.
At the power generation side, the calculation model of generator assembly capacity, coal price and gas price, power generation cost, and thermal power unit quotation model are constructed. The power consumption side link has established the calculation model of all power consumption on the user side and different types of power metering models. The analysis link is mainly used to calculate the key indicators of the market operation situation proposed in this paper.
The division of each sub-module is shown in
Table 1.
Table 1 shows that the overall structure of the system dynamics model in this paper, which is mainly divided into three main modules: power generation side link, power consumption side link, and analysis link. The power generation side includes several sub-modules: coal price and gas price measurement module, power supply calculation module, carbon emission calculation module, and average quotation calculation module. The power consumption side link includes the user-side electricity purchase metering module and the transaction price calculation module. The analysis link includes the calculation module of market operation trend indicators. The generation side block is used to calculate the installed capacity, generation cost, bidding quantity, and carbon emission data on the power generation side; the consumption side block is used to convert the demand electricity on the consumption side into the real purchased electricity; the analysis block monitors the key indicators of the market operation.
4. Functional Relationships of the Submodules in the System Dynamics Model
The quantitative relationships between the associated variables in the system dynamics model of the power market operation situation are determined by the functional functions defined by each module in the generation side block, the consumption side block, and the analysis block. The sub-modules contained within each link are shown in
Table 1, and the connection coupling relationships between different links are shown in
Figure 1. The generation-side block transmits to the analysis block the data on the installed capacity, annual marketed electricity, generation cost, average bidding, and annual carbon emissions of different generation forms on the generation side. The electricity consumption side block transmits the data of the electricity purchased and the average clearing price for the analysis block. After receiving the values of the relevant variables, the analysis block calculates and analyzes the key indicators of market operation dynamics as the output of the simulation system.
4.1. Coal and Gas Price Measurement Module
The coal and gas price measurement module reflect the relationship between the price and supply of coal and gas. Changes in the supply of fuels will lead to changes in fuel prices, which in turn will change the generation costs of power producers and affect the bidding on the generation side, thus influencing the operating dynamics of the market. The specific functional relationships between the variables in this module are shown below:
Equation (6) is a uniform form of the coal and gas price calculation formula, where represent the rate of change in price, the rate of change in supply, and the elasticity of supply and demand coefficients for coal or gas, respectively; represent the amount of price variation and price of coal or gas, respectively; and represent the amount of supply variation and supply of coal or gas, respectively.
4.2. Power Supply Calculation Module on the Generation Side
The power supply on the generation side is calculated according to the installed capacity, annual utilization hours, market-based power ratio and power generation supply ratio of different power generation methods. Among them, wind power and photovoltaic are only quoted in the market and are prioritized for clearing according to the benchmark tariff. According to the National Development and Reform Commission
“Notice on further deepening the market-oriented reform of on grid electricity price for coal-fired power generation
” [
1], the notice requires all coal-fired power generation to enter the power market in principle, this paper considers all coal-fired and gas-fired power generation to enter the power market. Based on the relationship between the price of coal and gas and the cost of power generation, the generation supply ratio is calculated. The specific functional relationships between variables in this module are shown below:
In Equation (7), which is the uniform expression for the calculation of marketable generation capacity of different generation forms, including coal-fired, gas-fired, photovoltaic, and wind power. Where , and denote the new installed capacity, installed capacity and growth rate of new installed capacity of different generation forms, respectively. , and denote the annual market-based supply baseline, average annual utilization hours, and market share of different power generation forms, respectively.
In order to promote the priority of renewable energy consumption, the annual transaction of new energy marketed electricity is a new energy marketable electricity, while coal-fired and gas-fired generating units are related to the fuel cost of primary energy, the fluctuation of primary energy prices makes the enthusiasm of coal-fired and gas-fired power generation entities to participate in the market is somewhat uncertain. The generation supply ratio of coal-fired and gas-fired is related to the price of primary energy. The relevant equations are shown in Equations (8) and (9).
In Equation (8),
denote the annual marketed electricity and the annual marketed electricity of PV or wind power, respectively.
In Equation (9),
represent the annual marketed electricity and annual marketed electricity of coal-fired or gas-fired power generation, respectively.
is the ratio of marketable electricity to actual marketable electricity supply in coal-fired or gas-fired thermal power generation units.
In Equation (10), denote the total annual supply on the generation side and the total installed capacity of the system, respectively.
4.3. Carbon Emission Calculation Module
When the total carbon emission exceeds the carbon emission caps, the utilization hours of coal-fired and gas-fired generation units will be limited, and the growth rate of installed wind power and PV will be increased. The specific functional relationships between variables in this module are shown below.
In Equation (11),
represents the carbon emission factor of coal or gas combustion.
In Equation (12),
denotes the annual carbon emission cap on the power generation side.
In Equation (13), denotes the growth rate of new installations of wind and PV under the carbon limitation scenario.
4.4. Average Bidding Calculation Module
The total cost of electricity for the generation side is determined by accounting for the fuel costs of coal and gas, and changes in fuel prices will affect the generation supply ratio of the generators, which in turn will change the quoted quantity and price of the generation side. The specific functional relationships between the variables in this module are shown below.
In Equations (14)–(16),
denote the cost of coal-fired generation units and the cost of coal-fired unit’s electricity generation in addition to coal combustion, respectively;
denotes the conversion efficiency of coal-fired generation units;
denotes the average bidding price of the generation side, respectively. If the average clearing price is greater than the unit cost of coal-fired generation units, then the coal-fired units are not profitable at that time and therefore the transaction volume is zero.
In Equations (17)–(19),
denote the cost of electricity per MW of gas-fired thermal power and the cost of electricity per MW of gas-fired units in addition to gas, respectively;
denotes the conversion efficiency of gas-fired generation units, respectively. The values and physical meanings of the parameter
are the same as those of
.
In Equation (20), are the coal price impact factor and gas price impact factor, respectively.
4.5. Consumption-Side Electricity Purchase Metering Module
The consumption-side electricity demand is decomposed into three categories: rigid demand electricity, tariff elastic demand electricity, and energy consumption dual control demand electricity. Among them, rigid demand indicates that the demand for this part of electricity is rigid and does not change with the change in electricity price. Tariff elastic demand electricity shows the characteristics of elasticity of demand and electricity price, and tariff elastic purchase electricity is a function of tariff elastic demand electricity and electricity price. Due to the implementation of the energy consumption dual-control policy, this part of electricity belonging to energy consumption dual-control cannot meet all its electricity demand, and the electricity purchased by energy consumption dual-control is related to the electricity demanded by energy consumption dual control and the specific energy consumption dual control policy. The specific functional relationships between variables in this module are shown below.
In Equations (21)–(23),
denote customer-side demand electricity and incremental customer-side demand electricity;
and
denote the growth rate of customer-side demand electricity and the share of customer-side marketed electricity, respectively;
denotes annual customer side marketed demand electricity.
In Equations (24) and (25),
denotes the rigid demand electricity;
denotes the share of rigid demand electricity;
denotes the rigid demand electricity purchase.
In Equations (26) and (27),
denotes the elastic demand electricity;
denotes the elastic demand electricity share;
denotes the elastic demand purchase electricity;
is the electricity price demand elasticity coefficient;
is the reference electricity price.
In Equations (28) and (29),
denotes the energy consumption dual-control demand electricity;
is the proportion of energy consumption dual-control demand electricity;
denotes the energy consumption dual-control purchase electricity;
denote the supply–purchase balance control coefficient and supply-purchase imbalance control coefficient, respectively. The amount of electricity purchased for dual energy consumption control depends on the balance of supply and demand in the market, and the actual amount of electricity purchased for dual energy consumption control is restricted to simulate the dual energy consumption control policy by using the supply–purchase ratio of 1.05 as the threshold.
4.6. Average Bidding Calculation Module
In the actual operation of the market, the clearing electricity is settled according to the out clearing method of the trading system. The modeling of this process is simplified by considering the high bidding ratio and low bidding ratio to convert the average bidding on the generation side into the average clearing electricity price. The specific functional relationships between variables in this module are shown below.
In Equation (31), denote the high bidding ratio and low bidding ratio of the overall generators, respectively, and the physical meaning is the percentage of the overall generators using the high bidding strategy or low bidding strategy.
4.7. Market Operation Indicators Calculation Module
This module is used to calculate the market operating indicators to characterize the operating trend of the system. The specific functional relationships between the variables in this module are shown below.
The marketed renewable energy electricity share is shown in Equation (1), and the installed renewable energy generation share
is shown in Equation (32).
The annual supply–purchase ratio of the market is shown in Equation (2) and the rate of change in the annual supply–purchase ratio is shown in Equation (33).
The total annual carbon emissions on the generation side are calculated as shown in Equation (3). The quoted cost ratios for coal-fired units
and gas-fired units
are shown in Equations (34) and (35), respectively.
The average unit cost of thermal power on the generation side
is shown in Equation (36).
The profit potential ratio of thermal units and the volatility of clearing prices are shown in Equations (4) and (5), respectively.
5. Simulation
The system dynamics simulation software Vensim PLE, version 9.0, is used to simulate the system dynamics simulation. The model construction and functional relationships are shown in
Section 3 and
Section 4, based on which the initial conditions are set for simulation. The simulation interval is from 2021 to 2050 for a total of 30 years, the simulation time step is one year.
5.1. Basic Scene Parameters Settings
The variable coefficients in this paper were determined by reviewing relevant information and reasonable assumptions.
5.1.1. Generation-Side Parameters Setting
The relevant initial parameter settings for coal-fired and gas-fired generation units are shown in
Table 2.
In
Table 2, the supply and demand elasticity coefficients of coal-fired and gas-fired generation units and the conversion efficiency are obtained by reviewing the literature [
15,
16,
17,
18]. While the three parameters of the rate of change in supply, the initial value of fuel price, and fuel impact coefficient in the initial conditions of coal and gas combustion vary greatly in different literature and lack a uniform data range, this paper makes a reasonable setting and chooses a compromise value.
The electricity generation cost of coal-fired and gas-fired generation units in addition to fuel are set at 0.1 CNY/kWh and 0.2 CNY/kWh, respectively, with the benchmark annual utilization hours of coal-fired at 4262 h and gas-fired at 3000 h. The carbon emission allowance is set at 200 million tons, and thermoelectric units are all entered into the market, so the market share of electricity is 100%.
The initial parameters related to wind power and photovoltaic generation are set as shown in
Table 3. Because of the large and rapid growth of installed renewable energy power generation in recent years, it is difficult to keep the growth rate at the same scale in the future, so the benchmark new installed growth rate and the carbon-limited new installed growth rate in this paper are expressed by the reasonably set annual average growth rate. The annual utilization hours of wind power and photovoltaic and the market-based power share lack public statistics, so this paper borrows the reference data from the literature [
19] for setting.
5.1.2. Consumption-Side Parameters Setting
Based on the electricity consumption statistics of Jiangsu Province in 2020, the annual electricity consumption of the province in 2020 is 637.4 billion kWh, and the annual growth rate of electricity consumption is 1.75% [
20]. Referring to this 1.75% annual growth rate of electricity consumption, the parameters of electricity consumption growth on the electricity consumption side of this paper are set. The market share of electricity consumption is 80% according to the commercial and industrial electricity consumption, and the share of electricity consumption for dual control of energy consumption is about 20% [
20], which sets the share of electricity consumption for rigid demand at 70% and the share of electricity consumption for tariff elastic demand at 10%. The electricity demand elasticity coefficient in Equation (27) is set to −0.2 [
21]. For energy consumption dual control electricity, the supply–demand balance control coefficient in Equation (29) is set to 0.75, and the supply–demand imbalance control coefficient is set to 0.5.
5.2. Basic Scenario Simulation Results and Analysis
The base scenario set is the case where the input parameters are given and basically unchanged, as a comparison scenario for the subsequent sensitivity analysis, and the relevant parameters are set as described in “4.1. Basic Scene Parameters Settings”.
Plotting and analyzing the change curves of key indicators of power market operation in the base scenario.
5.2.1. Trend Analysis of Market-Based Renewable Energy Power Ratio and Annual Supply–Purchase Ratio of Market-Based Power
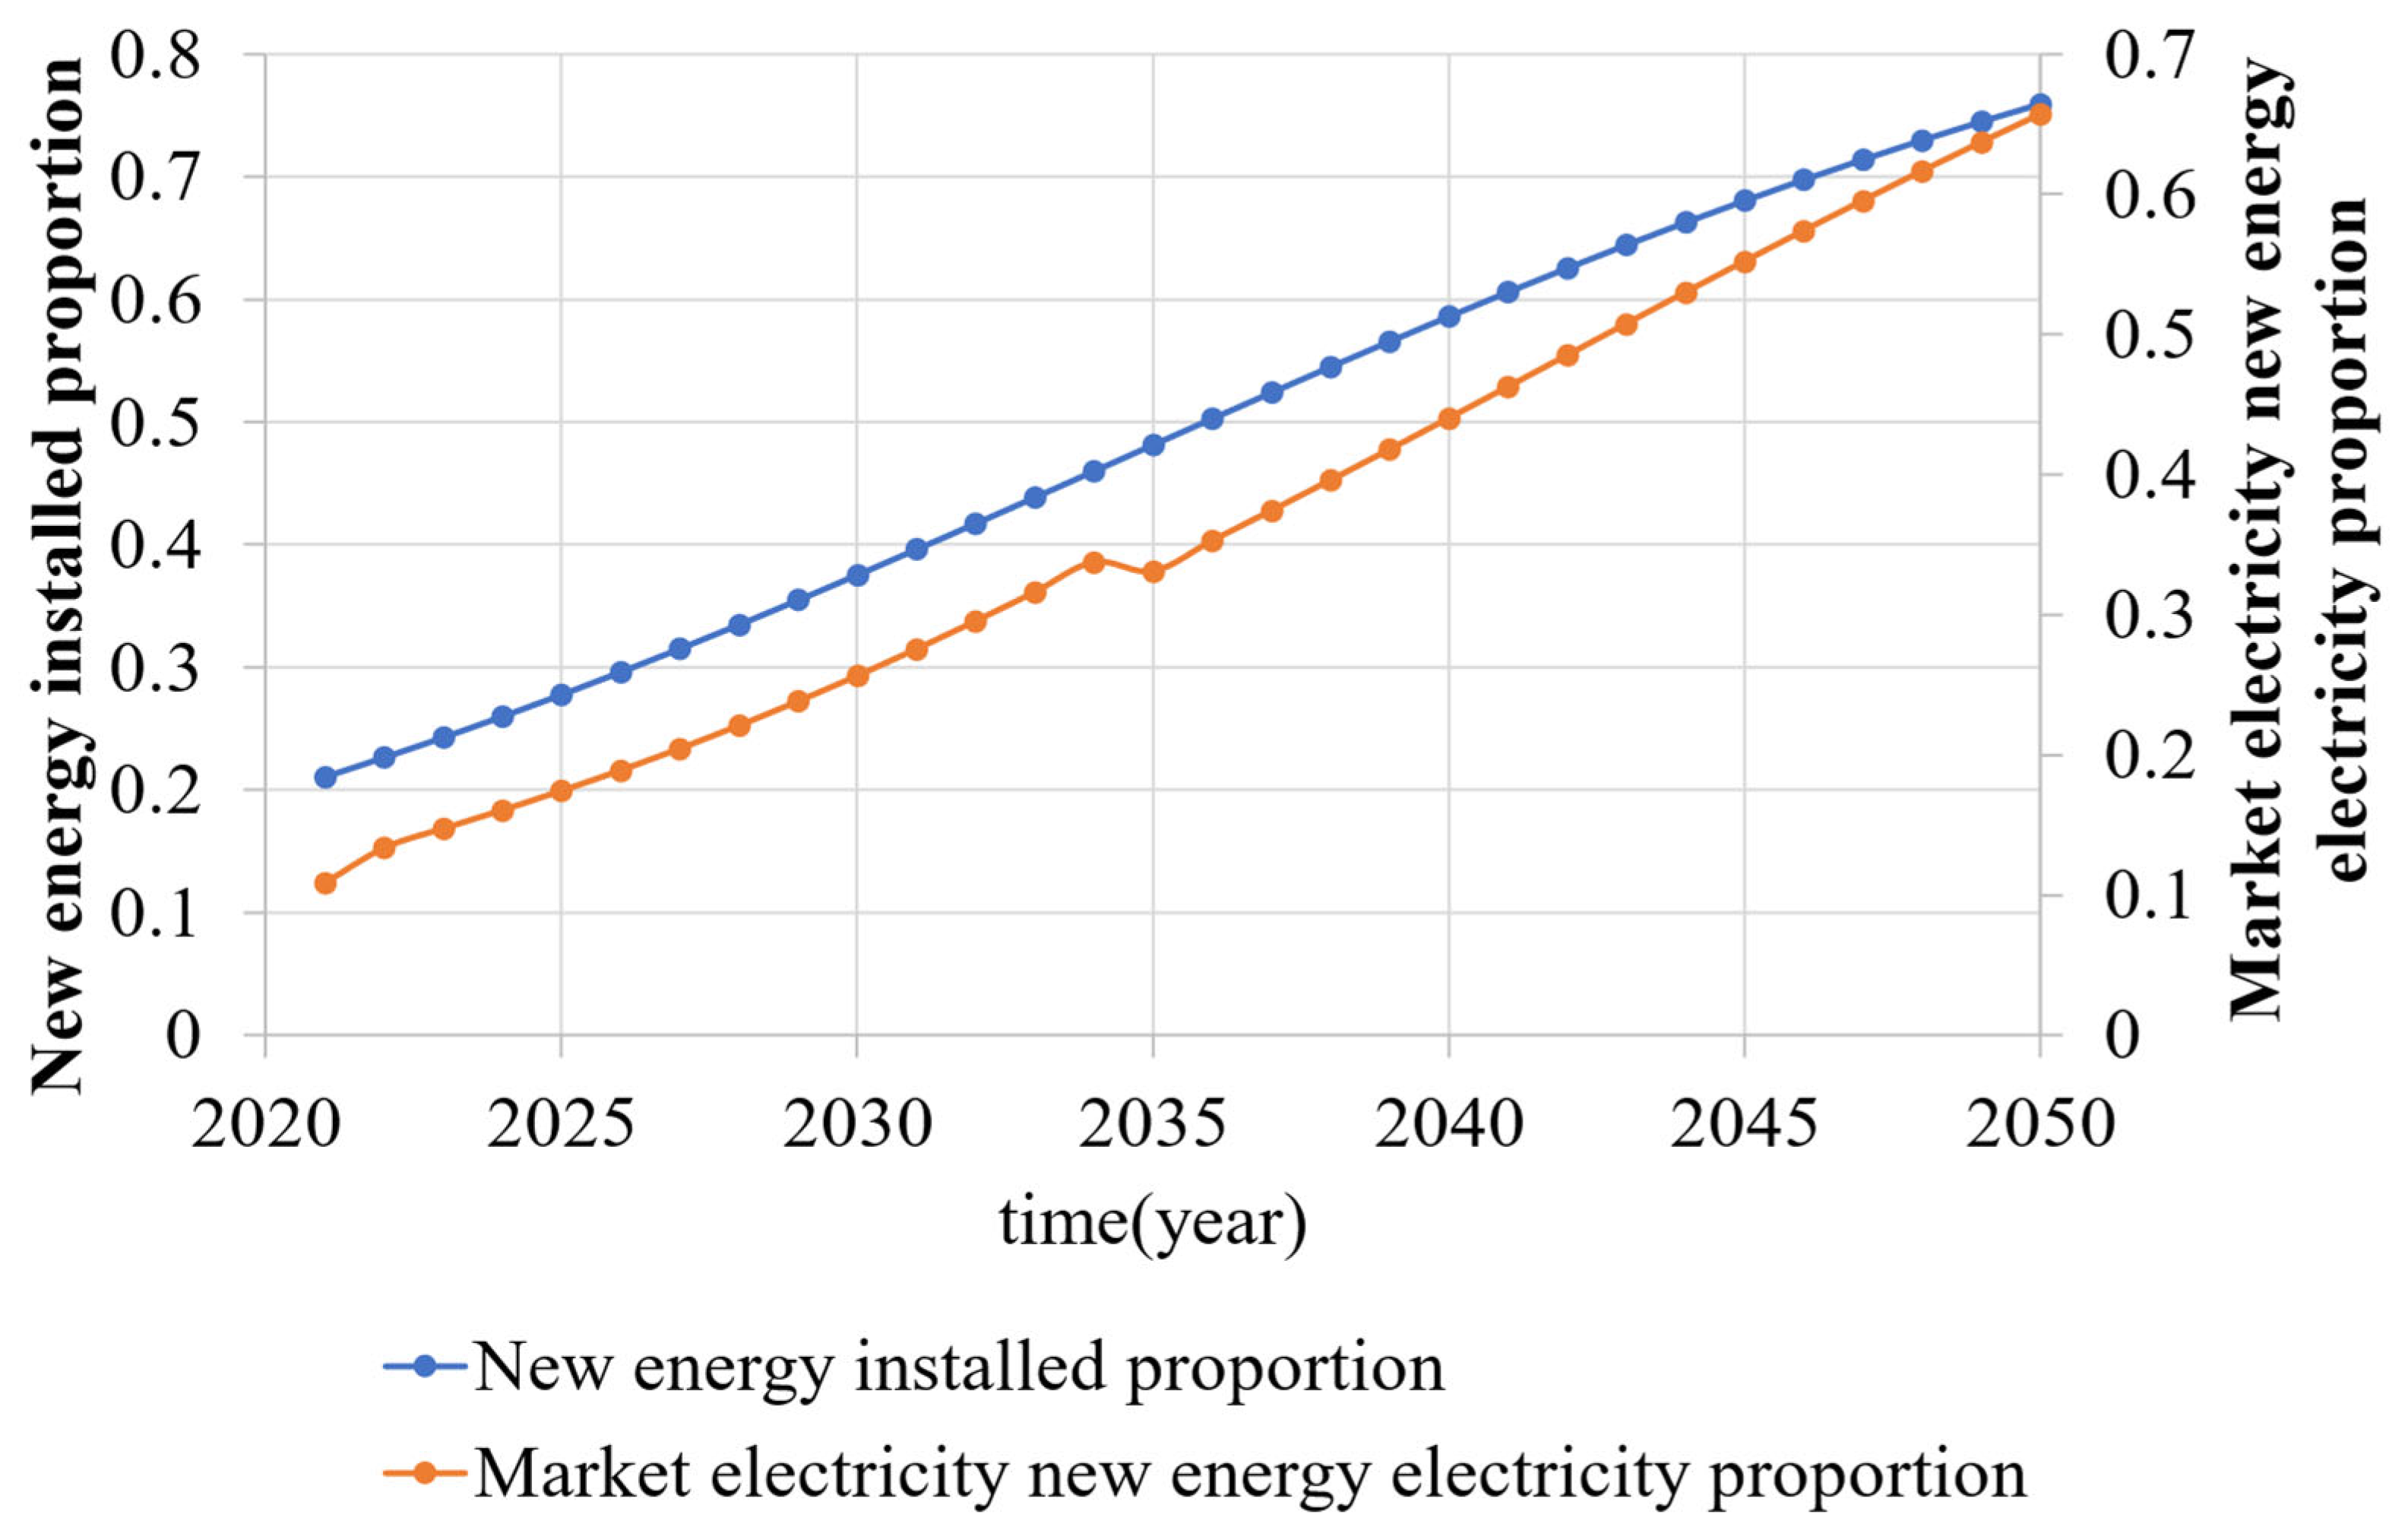
Plot the trend of the percentage of renewable energy power generation installed in the total power generation capacity of the provincial power system under the base scenario against the percentage of renewable energy power generation electricity in the marketed electricity, as shown in
Figure 2.
As shown in
Figure 3, it is plotted that the annual supply–purchase ratio and annual supply–purchase ratio change the rate of market electricity under the basic scenario.
As shown in
Figure 2, under the given parameters of the base scenario, the steady development of renewable energy power generation sources and their entry into the market will make renewable energy power generation sources gradually become the main source of power supply and meet the strategic development requirements of the country, i.e., to build a new, clean and green power system with renewable energy sources as the mainstay.
In terms of the market-based power supply and demand balance, the results in
Figure 2 show that all of the commercial and industrial power purchase into the market at one time will make the market-based supply smaller than demand, and there is a certain gap in market-based power supply, but as renewable energy power generation sources enter the market as a power supply supplement, the supply–purchase ratio will gradually be alleviated, and eventually return to a state where supply is slightly greater than demand.
5.2.2. Analysis of Annual Total Carbon Emission Trends on the Generation Side
The total annual carbon emissions from the generation side and the carbon emissions from coal-fired and gas-fired power generation, respectively, are shown in
Figure 4.
Since the carbon emission cap in the carbon emission calculation module will limit the output of coal-fired and gas-fired units, while increasing the installed capacity of renewable energy power generation, the total annual carbon emission on the generation side is strongly controlled and basically fluctuates in a small range. The installed capacity of gas-fired units is smaller than that of coal- fired units, and the carbon emissions generated are relatively smaller.
5.2.3. Profit Potential Ratio of Thermal Power Units
A comparison of the profit potential of different types of thermal power units is shown in
Figure 5.
Figure 4 reflects that thermal power still has good profitability overall in a market-based bidding environment when the weighted average bidding price of coal-fired and gas-fired thermal units is used to measure the bidding cost ratio on the generation side. However, the profitability of thermal generation units will be gradually compressed due to the lower cost of renewable energy power generation. Meanwhile, in the basic scenario, the supply of coal and gas for power generation is steadily increasing year by year, and the price of coal and gas is decreasing year by year. At this time, coal-fired units can generally achieve profitability, while gas-fired units are more difficult to achieve profitability and operate at a loss due to their own higher generation costs and smaller market volume, and competition with coal-fired units.
5.2.4. Trend Analysis of Market Clearing Price
The average market clearing price and the volatility of the clearing price are shown in
Figure 6.
In the base scenario, the increase in the number of market players makes the market environment more competitive. Along with the sufficient supply of coal and gas, reducing the cost of power generation, the average clearing price of the market will further decline, showing a trend of slow decline year by year.
5.3. Sensitivity Analysis
In order to study the impact of key factors on the system dynamic equilibrium trend in the market environment, sensitivity analysis is conducted for three macro-level factors, generation side, consumption side, and market policy, to simulate the market operation situation trend under different scenarios. The growth rate of coal supply is selected for the generation side, the growth rate of electricity demand for the consumption side, and the carbon emission limit for the market policy.
5.3.1. Sensitivity Analysis Based on Coal Supply Growth Rate
Changes in the prices of gas and coal will be transmitted to the generation side, affecting the generation costs of power producers and thus changing the market dynamics. The price changes of coal and gas depend mainly on the state of the energy supply, i.e., whether there is a shortage or surplus of primary energy supply.
Due to the small scale of gas-fired power generation, this paper mainly considers the sensitivity analysis of coal supply, i.e., changing the coal supply growth rate parameter to 2% coal supply growth rate in the base scenario and running −5%, −3%, 0, 3%, and 5% scenarios, respectively, to compare the magnitude of change in market operation status indicators, and the results are shown in
Figure 7,
Figure 8,
Figure 9,
Figure 10,
Figure 11 and
Figure 12.
The simulation results in
Figure 7,
Figure 8,
Figure 9,
Figure 10,
Figure 11 and
Figure 12 show that adequate coal supply helps improve the operating dynamics within the market. When there is a coal shortage problem, it will worsen the supply and demand status, causing certain floating fluctuations in the supply–purchase ratio change rate, generation-side carbon emissions, and clearing price volatility, which may bring the risk of economic losses in the form of general losses of market members. It will also reduce the profit potential of generating units and raise the average clearing price of electricity in the market.
5.3.2. Sensitivity Analysis Based on Carbon Emission Allowances
Carbon emission allowances will change the generation structure on the generation side, which has a large impact on the generation side, and it is necessary to study the market dynamics under different carbon emission limit scenarios. The carbon emission limit in the base scenario is 200 million tons, and the simulation results are shown in
Figure 13,
Figure 14 and
Figure 15 for running the scenarios of 100 million tons, 150 million tons, 250 million tons, 300 million tons, and 350 million tons, respectively.
The above results suggest that limiting total carbon emissions for the generation side will significantly affect the operating dynamics of the power market. When carbon emission limits are more lenient, it helps to improve the supply–purchase ratio within the market. The implementation of a tight carbon emission limit policy helps the development of renewable energy power generation and effectively reduces carbon emissions on the generation side. Therefore, the impact of carbon emission limit policy on the operation of the power market is multifaceted.
5.3.3. Sensitivity Analysis Based on Electricity Demand Growth Rate on the Consumption Side
In the past two years, with the recurrence of the epidemic and the increase in foreign trade exports, it makes the future demand power growth rate on the consumption side face great uncertainty, therefore, this section conducts sensitivity analysis for the demand power growth rate on the consumption side. Five scenarios of 1%, 1.5%, 2%, 2.5%, and 3% of electricity demand growth rate are set up, respectively, and the analysis is carried out in combination with the comparison base scenarios, and the simulation results are shown in
Figure 16 and
Figure 17.
Since the electricity consumption side is highly decoupled from the generation side in the model established in this paper, the generation-side-related dynamic indicators do not change under different demand growth rates on the electricity consumption side. When the growth rate of electricity demand increases, it will further aggravate the power shortage in the market and worsen the supply–purchase ratio in the market, and it is necessary to increase the generation hours or dispatch foreign power from the region to supplement the power shortage in the market.
6. Discussion
The results of the basic scenario simulation show that:
- (a)
When all the commercial and industrial sectors enter the market to purchase electricity and renewable energy power generation sources also enter the market, the market may have the problem of supply being smaller than demand in the short term, so it is necessary to expand the marketed electricity to meet the load demand.
- (b)
The adoption of carbon emission allowance measures on the generation side will effectively control the carbon emission values, promote the reduction of coal use and the expansion of renewable energy generation installations, and renewable energy generation will gradually replace the dominant position of traditional thermal power.
- (c)
The generation side still has a good profit margin in the competitive market environment, but gas-fired power generation is limited by its own higher costs, and it is more difficult to compete with coal-fired units.
- (d)
The expansion of market players in the short and medium term is conducive to strengthening full competition in the market, leading to a slow decline in electricity prices, but generally stable.
In the sensitivity analysis section, the trends of key market operation dynamics indicators under different scenarios on the coal supply change, carbon emission limit, and electricity demand growth are studied separately. The reduction of coal supply will make the supply and purchase tighter, and the profit potential of the generation side decreases while raising the electricity price. The carbon emission allowance policy brings diversified impacts to the operation of the power market, so the power system needs to change its traditional operation mode to reduce the impact on itself. The high growth rate of electricity demand will aggravate the imbalance between supply and purchase in the market, which will require the expansion of market-based power supply to meet the load demand. Both internal and external market influencing factors can lead to changes in market operation dynamics and even lead to market operation risks. Therefore, it is necessary to formulate relevant supporting policies and countermeasures to control the market operating indicators in a balanced state and ensure that the market operates in a reasonable range.
The literature that have studied the evaluation and assessment of power market operations often depends on the construction of indicators followed by data analysis based on historical data [
4,
5,
6,
7,
8,
9,
10,
11,
12,
13,
14]. This technical approach makes it difficult to consider real-time policies, the indicators are also generally isolated from each other, decoupled between factors influencing inside and outside the market, and more dependent on historical data. The simulation model based on system dynamics constructed in this paper quantitatively couples multiple factors and real-time policies, and the variables interact with each other to form a whole for system simulation calculation. It also reduces the dependence on data and is more suitable for the simulation of medium- and long- term operation situation of power market under multiple scenarios and complex environments.
Of course, there are still some shortcomings in this research. For example, the market bidding part is simplified, and the actual game and optimization process is ignored. This will be the next research direction.
7. Conclusions
In this paper, we study the annual medium- and long-term operation situation analysis of the power market in a complex environment and establish the system dynamics model of the power market operation situation and the functional relationship between variables, which consider the diversified market situation influencing factors, and quantitatively solve and analyze the change law of key indicators of the market operation situation under different scenarios. The results of the simulation analysis of the base scenario, combined with the sensitivity analysis comparison of three factors: coal supply growth rate, carbon emission limit, and electricity demand growth rate on the consumption side, show that the system dynamics model of the power market operation situation constructed in this paper can effectively simulate the medium- and long-term operation situation of the provincial power market under the consideration of real-time policies.


