

Last Mile Logistics Life Cycle Assessment: A Comparative Analysis from Diesel Van to E-Cargo Bike


Abstract
:
1. Introduction
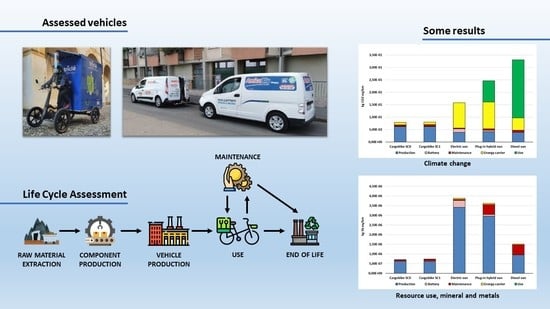
2. Life Cycle Assessment LCA
3. Goal and Scope
4. Life Cycle Inventory—LCI
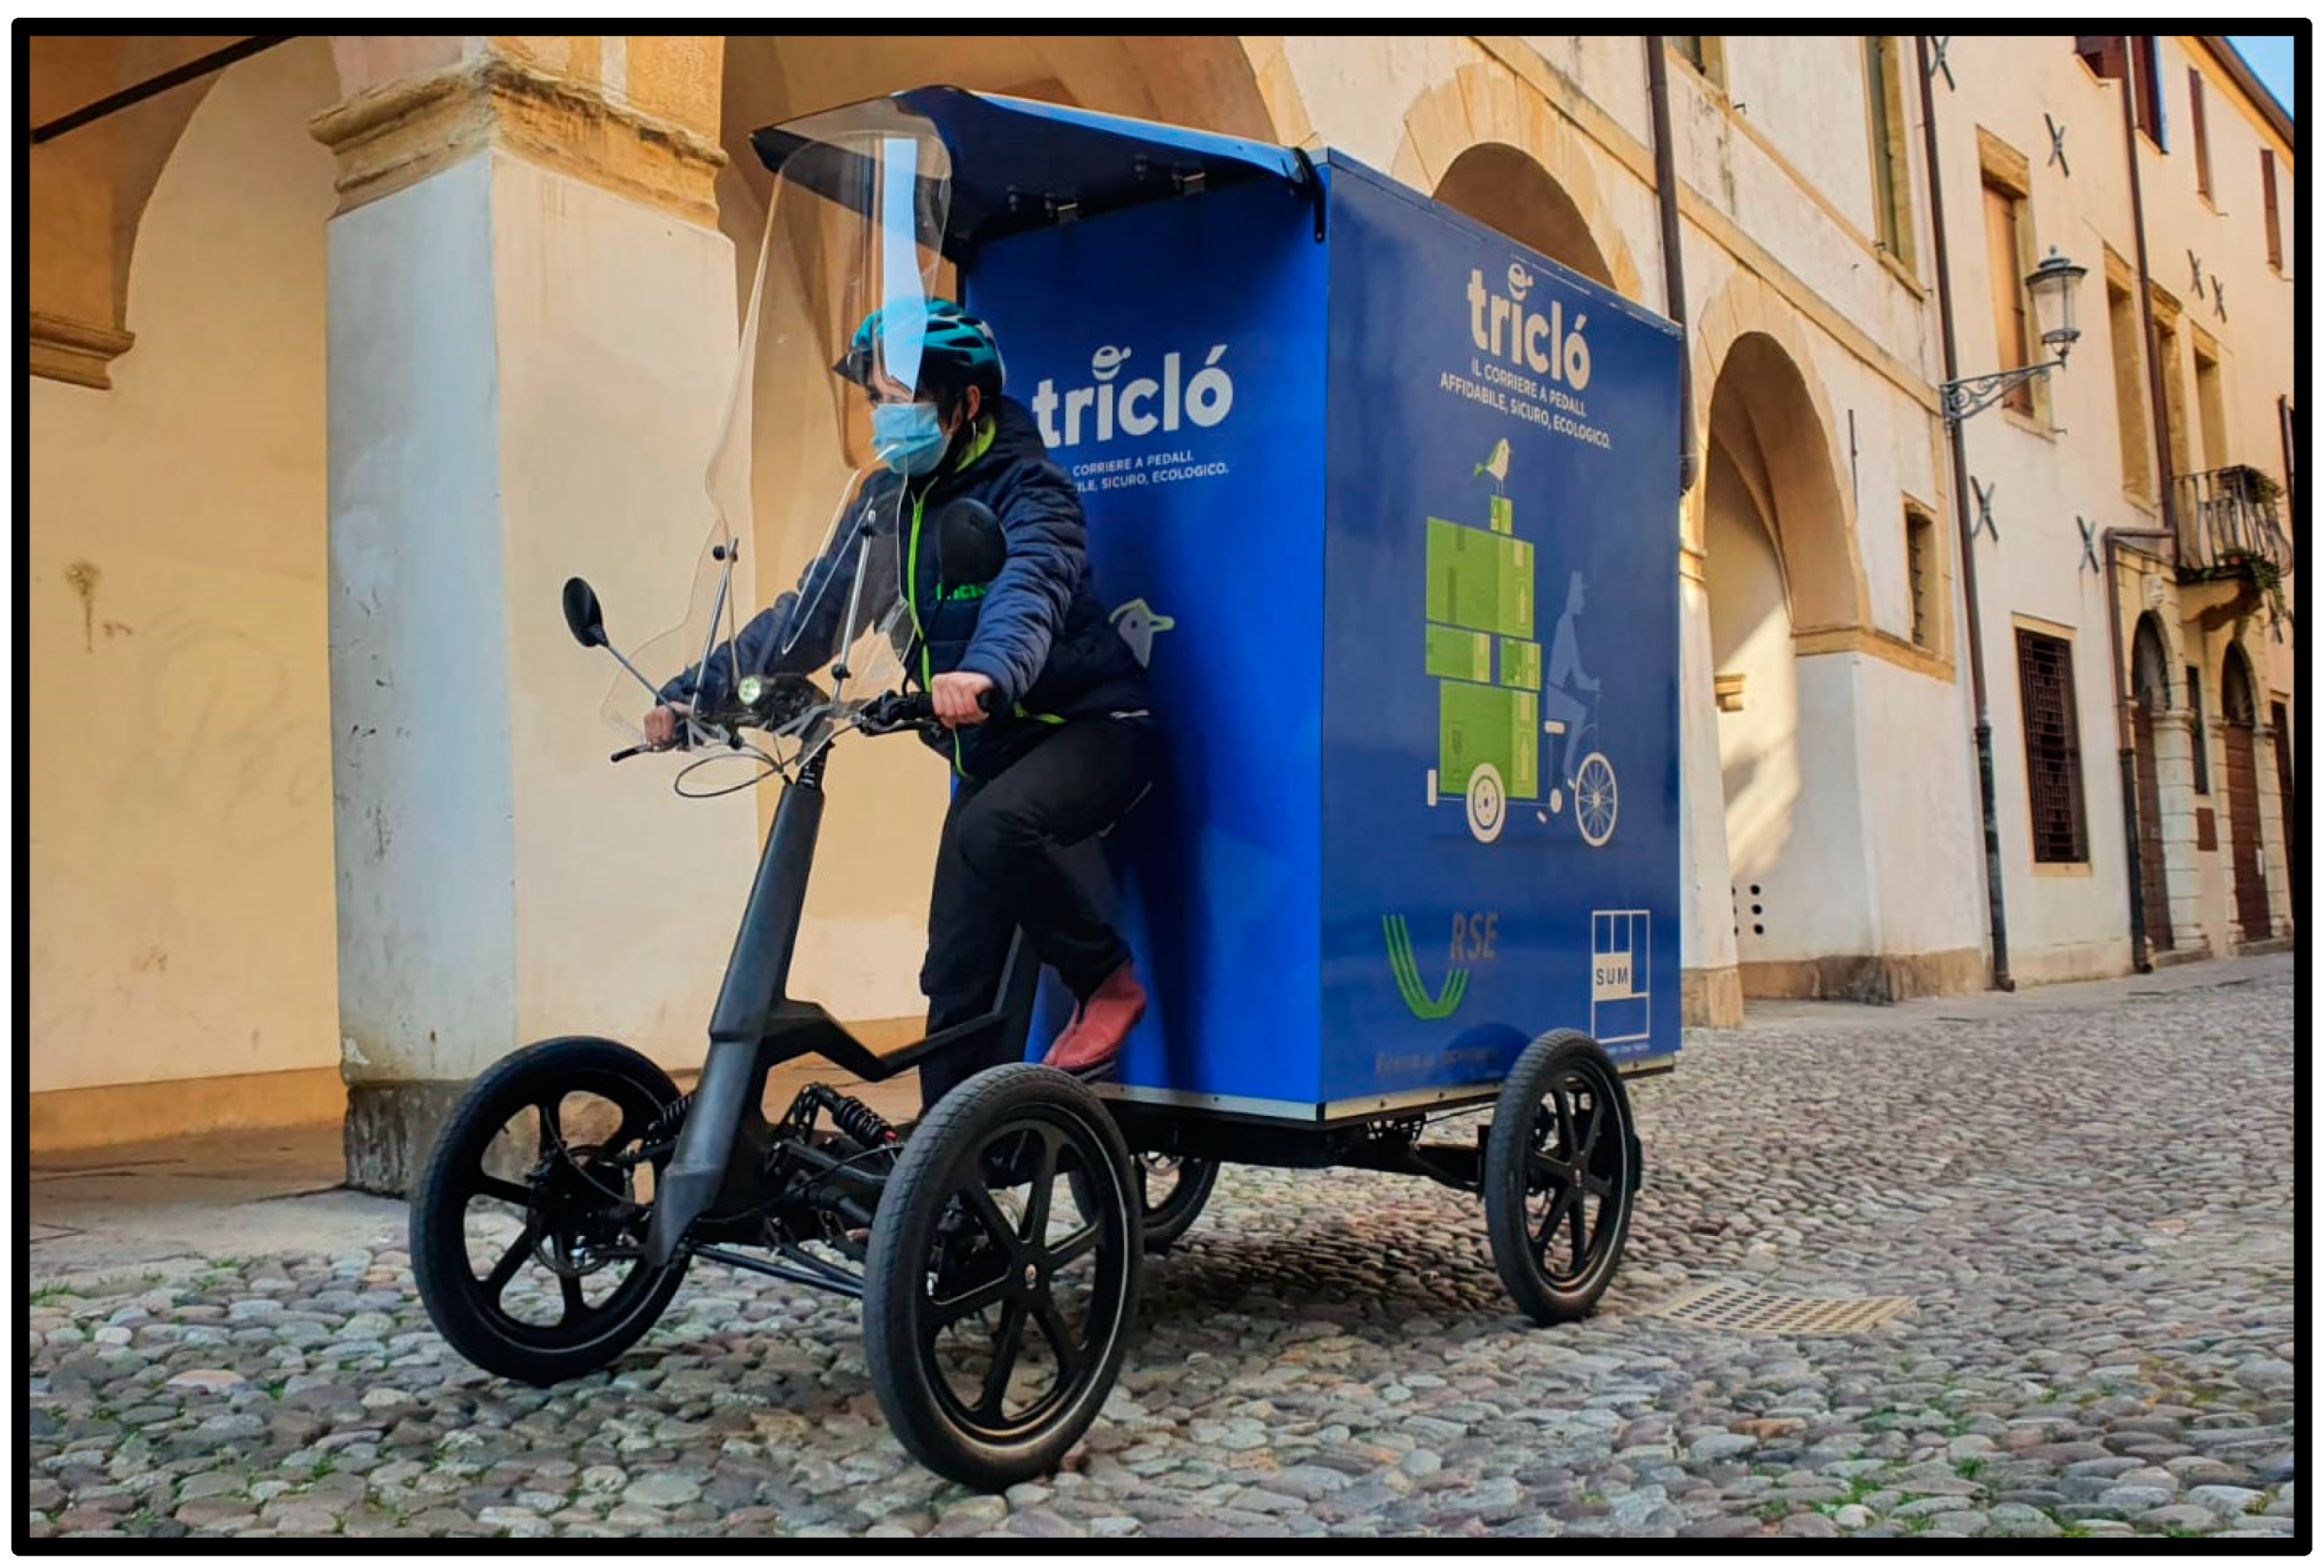
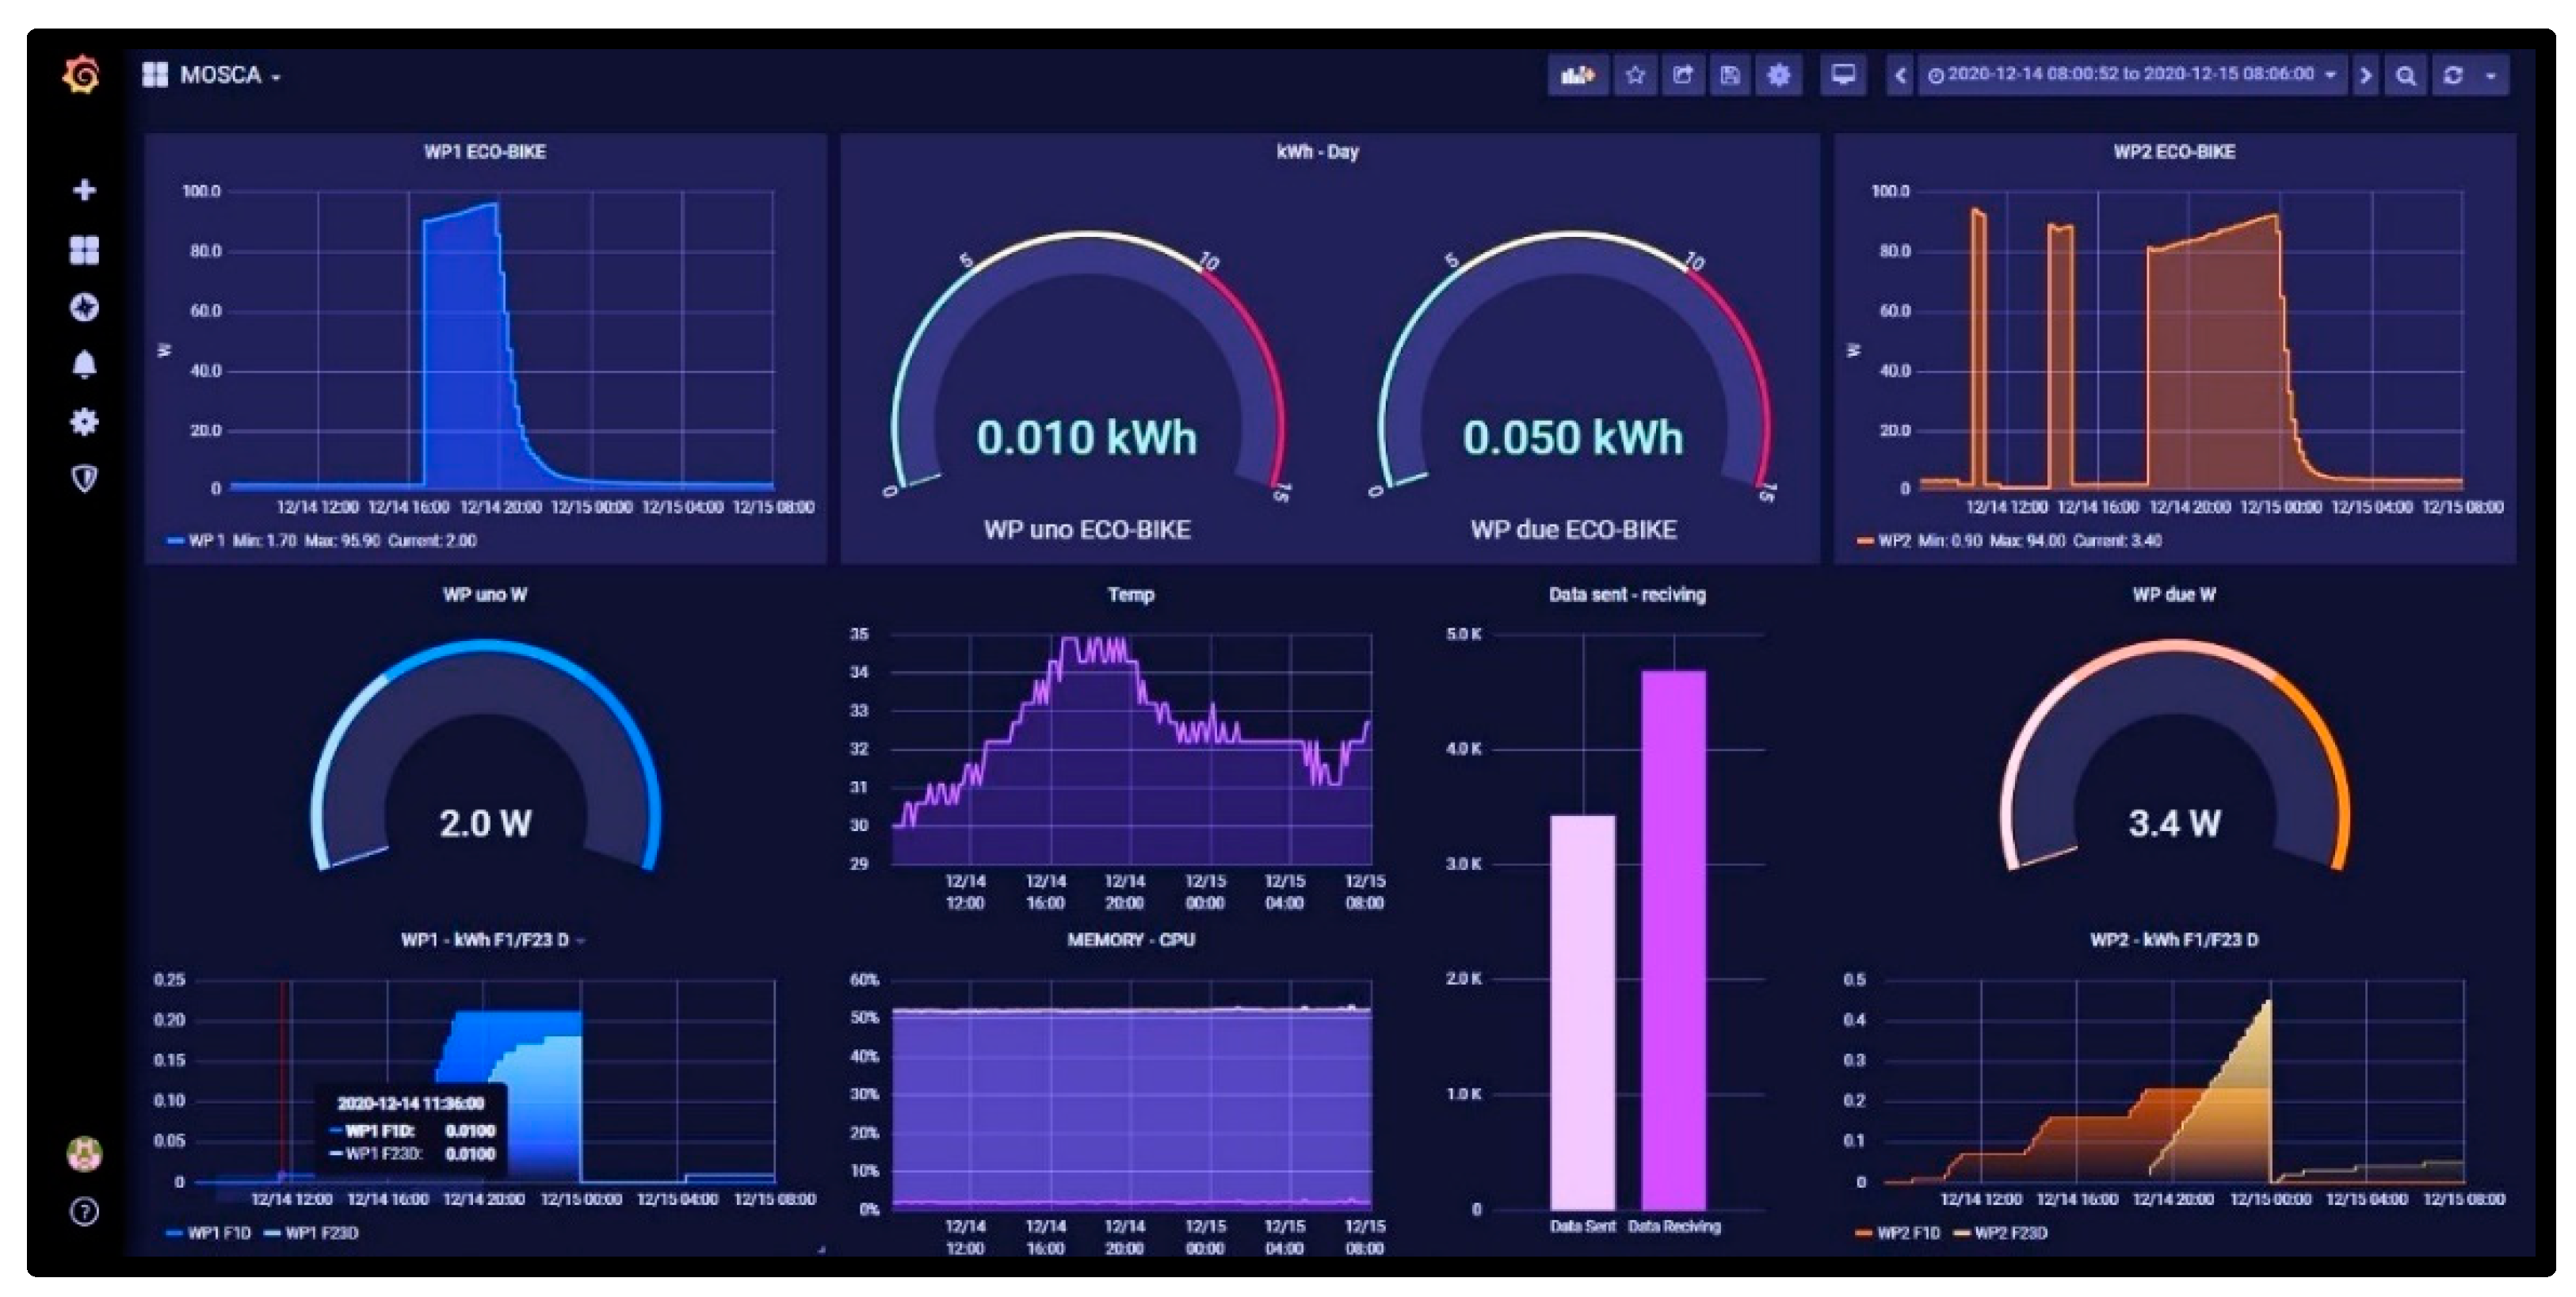
4.1. E-Cargo Bike
4.2. Electric, Diesel and Plug-In Hybrid Van
- The electric van was the same already used for the experimentation in the EU project Sharing Cities [42], which was our reference for the delivery routes.
- The diesel model was the most similar to the electric one (for weight, carrying capacity and engine power) available for rent.
- As no plug-in hybrid van was available for rent, a passenger car similar in weight and engine power was used, assuming, as a first approximation, that it could be considered as a proxy alternative for a plug-in hybrid van.
5. Life Cycle Impact Assessment—LCIA
- The future, deeply decarbonized, Italian electricity mix, according to the 2030 PNIEC scenario (Piano Nazionale Integrato per l’Energia e il Clima) (IT 2030) [38].
- Electricity from only photovoltaic production (All PV) which can represent the optimistic scenario for EVs.
- Electricity from Natural Gas production (All NG), which may represent a pessimistic scenario for EVs.
6. Conclusions
Supplementary Materials
Author Contributions
Funding
Conflicts of Interest
References
- European Environmental Agency EEA. The First and Last Mile—The Key to Sustainable Urban Transport—Transport and Environment Report 2019; Report No 18/2019; Office of the European Union: Luxembourg, 2019. [Google Scholar]
- Lebeau, P.; De Cauwer, C.; Van Mierlo, J.; Macharis, C.; Verbeke, W.; Coosemans, T. Conventional, hybrid, or electric vehicles: Which technology for an urban distribution centre? Sci. World J. 2015, 2015, 302867. [Google Scholar] [CrossRef] [Green Version]
- European Commission. A European Green Deal. 2019. Available online: https://ec.europa.eu/info/strategy/priorities-2019-2024/european-green-deal_en#documents (accessed on 1 September 2022).
- Bosona, T. Urban freight last mile logistics—Challenges and opportunities to improve sustainability: A literature review. Sustainability 2020, 12, 8769. [Google Scholar] [CrossRef]
- Croci, E.; Donelli, M.; Colelli, F. An LCA comparison of last-mile distribution logistics scenarios in Milan and Turin municipalities. Case Stud. Transp. Policy 2021, 9, 181–190. [Google Scholar] [CrossRef]
- Oliveira, C.M.d.; Albergaria De Mello Bandeira, R.; Vasconcelos Goes, G.; Schmitz Gonçalves, D.N.; D’Agosto, M.D.A. Sustainable vehicles-based alternatives in last mile distribution of urban freight transport: A systematic literature review. Sustainability 2017, 9, 1324. [Google Scholar] [CrossRef] [Green Version]
- Saenz-Esteruelas, J.; Figliozzi, M.; Serrano, A.; Faulin, J. Electrifying last-mile deliveries: A carbon footprint comparison between internal combustion engine and electric vehicles. In International Conference on Smart Cities; Springer: Màlaga, Spain, 2016; pp. 76–84. [Google Scholar]
- Hill, N.; Amaral, S.; Morgan-Price, S. Determining the Environmental Impacts of Conventional and Alternatively Fuelled Vehicles through LCA: Final Report; European Commission, Directorate-General for Climate Action: Brussels, Belgium, 2020. [Google Scholar]
- Hottle, T.; Caffrey, C.; McDonald, J.; Dodder, R. Critical factors affecting life cycle assessments of material choice for vehicle mass reduction. Transp. Res. Part D Transp. Environ. 2017, 56, 241–257. [Google Scholar] [CrossRef] [PubMed]
- Burnham, A. Updated Vehicle Specifications in the GREET Vehicle-Cycle Model; Argonne National Laboratory: Lemont, IL, USA, 2012.
- Marmiroli, B.; Venditti, M.; Dotelli, G.; Spessa, E. The transport of goods in the urban environment: A comparative life cycle assessment of electric, compressed natural gas and diesel light-duty vehicles. Appl. Energy 2020, 260, 114236. [Google Scholar] [CrossRef]
- Giordano, A.; Fischbeck, P.; Matthews, H. Environmental and economic comparison of diesel and battery electric delivery vans to inform city logistics fleet replacement strategies. Transp. Res. Part D Transp. Environ. 2018, 64, 216–229. [Google Scholar] [CrossRef]
- Yang, L.; Hao, C.; Chai, Y. Life Cycle Assessment of Commercial Delivery Trucks: Diesel, Plug-in Electric and Battery-Swap Electric. Sustainability 2018, 10, 4547. [Google Scholar] [CrossRef] [Green Version]
- Shahraeen, M.; Ahmed, S.; Malek, K.; Van Drimmelen, B.; Kjeang, E. Life cycle emissions and cost of transportation systems: Case study on diesel and natural gas for light duty trucks in municipal fleet operations. J. Nat. Gas Sci. Eng. 2015, 24, 26–34. [Google Scholar] [CrossRef]
- Cecchel, S.; Chindamo, D.; Collotta, M.; Cornacchia, G.; Panvini, A.; Tomasoni, G.; Gadola, M. Lightweighting in light commercial vehicles: Cradle-to-grave life cycle assessment of a safety-relevant component. Int. J. Life Cycle Assess. 2018, 23, 2043–2054. [Google Scholar] [CrossRef]
- Siragusa, C.; Tumino, A.; Mangiaracina, R.; Perego, A. Electric vehicles performing last-mile delivery in B2C e-commerce: An economic and environmental assessment. Int. J. Sustain. Transp. 2020, 16, 22–33. [Google Scholar] [CrossRef]
- Bachmann, C.; Chingcuanco, F.; MacLean, H.; Roorda, M. Life-cycle assessment of diesel-electric hybrid and conventional diesel trucks for deliveries. J. Transp. Eng. 2015, 141, 05014008-1–05014008-8. [Google Scholar] [CrossRef]
- Lee, D.Y.; Thomas, V.M. Parametric modeling approach for economic and environmental life cycle assessment of medium-duty truck electrification. J. Clean. Prod. 2017, 142, 3300–3321. [Google Scholar] [CrossRef] [Green Version]
- Garraín, D.; Lechón, Y. Exploratory environmental impact assessment of the manufacturing and disposal stages of a new PEM fuel cell. Int. J. Hydrogen Energy 2014, 39, 1769–1774. [Google Scholar] [CrossRef]
- Schünemann, J.; Finke, S.; Severengiz, S.; Schelte, N.; Gandhi, S. Life Cycle Assessment on Electric Cargo Bikes for the Use-Case of Urban Freight Transportation in Ghana. Procedia CIRP 2022, 105, 721–726. [Google Scholar] [CrossRef]
- Marques, D.L.; Coelho, M.C. A Literature Review of Emerging Research Needs for Micromobility—Integration through a Life Cycle Thinking Approach. Future Transp. 2022, 2, 135–164. [Google Scholar] [CrossRef]
- Fraselle, J.; Limbourg, S.L.; Vidal, L. Cost and Environmental Impacts of a Mixed Fleet of Vehicles. Sustainability 2021, 13, 9413. [Google Scholar] [CrossRef]
- Heilmann, B.H.; Reinthaler, M.R.; Ganev, B.G.; Eibl, M.E. Does the introduction of small electric cargo vehicles into a logistics concept for last mile delivery of parcels and groceries in urban areas reduce its environmental impact? In Proceedings of the 7th Transport Research Arena TRA, Wien, Austria, 16–19 April 2018; Available online: https://zenodo.org/record/1451426 (accessed on 5 August 2022).
- Saénz Esteruelas, J.M. An Evaluation of the Environmental Impact Reduction in the Urban Delivery Logistics Using Tricycles: A Case Study in Portland, OR, USA. Master’s thesis, Departamento de Estadística e Investigación Operativa, Universidad Pública de Navarra, Pamplona, Spain, 2016. [Google Scholar]
- Letnik, T.; Marksel, M.; Luppino, G.; Bardi, A.; Božičnik, S. Review of policies and measures for sustainable and energy efficient urban transport. Energy 2018, 163, 245–257. [Google Scholar] [CrossRef]
- ISO 14040:2006; Environmental Management—Life Cycle Assessment—Principles and Framework. ISO—The International Organization for Standardization: Geneva, Switzerland, 2006.
- ISO 14044:2006; Environmental Management—Life Cycle Assessment—Requirements and Guidelines. ISO—The International Organization for Standardization: Geneva, Switzerland, 2006.
- Faccio, M.; Gamberi, M. New city logistics paradigm: From the “last mile” to the “last 50 miles” sustainable distribution. Sustainability 2015, 7, 14873–14894. [Google Scholar] [CrossRef] [Green Version]
- Ministero Delle Infrastrutture e dei Trasporti. La Logistica Urbana in Una Visione Integrata; STM: Rome, Italy, 2020.
- Wernet, G.; Bauer, C.; Steubing, B.; Reinhard, J.; Moreno-Ruiz, E.; Weidema, B. The Ecoinvent database version 3 (part I): Overview and methodology. Int. J. Life Cycle Assess. 2016, 21, 1218–1230, 2016. [Google Scholar] [CrossRef]
- Carvalho, M.L.; Temporelli, A.; Girardi, P. Life cycle assessment of stationary storage systems within the Italian electric network. Energies 2021, 14, 2047. [Google Scholar] [CrossRef]
- Fazio, S.; Castellani, V.; Sala, S.; Schau, E.; Secchi, M.; Zampori, L.; Diaconu, E. Supporting Information to the Characterisation Factors of Recommended EF Life Cycle Impact Assessment Methods; JRC109369, EUR 28888 EN; European Commission: Ispra, Italy, 2018. [Google Scholar]
- Zampori, L.; Pant, R. Suggestions for Updating the Product Environmental Footprint (PEF); JRC Technical Reports; European Commission: Ispra, Italy, 2019. [Google Scholar]
- Girardi, P.; Gargiulo, A.; Brambilla, P.C. A comparative LCA of an electric vehicle and an internal combustion engine vehicle using the appropriate power mix: The Italian case study. Int. J. Life Cycle Assess. 2015, 20, 1127–1142. [Google Scholar] [CrossRef]
- Wrighton, S.; Reiter, K. CycleLogistics–moving Europe forward. Transp. Res. Procedia 2015, 12, 950–958. [Google Scholar] [CrossRef] [Green Version]
- Garrone, F.; Cazzaniga, A.C.M.; Terruggia, R.; Bartalesi, D.; Zanon, F.; Guagliardi, G.A.; Lazzari, R. Risultati della sperimentazione di casi d’uso per servizi elettrici sulla piattaforma Fog INtelliGent Edge Reactive (FINGER); 21008730; RSE, Rapporto di Ricerca di Sistema: Milan, Italy, 2021; Available online: https://www.rse-web.it/rapporti/ (accessed on 24 August 2022).
- Simons, A. Road transport: New life cycle inventories for fossil-fuelled passenger cars and non-exhaust emissions in ecoinvent v3. Int. J. Life Cycle Assess. 2016, 21, 1299–1313. [Google Scholar] [CrossRef]
- Carvalho, M.L.; Marmiroli, B.; Girardi, P. Life cycle assessment of Italian electricity production and comparison with the European context. Energy Rep. 2022, 8, 561–568. [Google Scholar] [CrossRef]
- TERNA. Dati Statistici—Dati generali. 2018. Available online: https://www.terna.it/it/sistema-elettrico/statistiche/pubblicazioni-statistiche#:~:text=Dati%20statistici%202021&text=Il%20fabbisogno%20di%20energia%20elettrica,%2C9%25%20rispetto%20al%202020 (accessed on 24 August 2022).
- Peters, J.F.; Baumann, M.; Zimmermann, B.; Braun, J.; Weil, M. The environmental impact of Li-Ion batteries and the role of key parameters–A review. Renew. Sustain. Energy Rev. 2017, 67, 491–506. [Google Scholar] [CrossRef]
- Istituto Superiore per la Protezione e la Ricerca. Rapporto rifiuti Speciali; ISPRA: Rome, Italy, 2020.
- Eurocities, Sharing Cities. Available online: http://www.sharingcities.eu/ (accessed on 3 March 2021).
- Manca, F.; O’Dwyer, E.; Sivakumar, A.; Rolim, C.; Gomes, R.; Tatti, A.; Causone, F.; De Antonellis, S.; Temporelli, A.; Girardi, P. Deliverable D8.7—Final Economic, Social and Environmental Appraisal. Sharing Cities, Call: H2020-SCC-2015; Ref. Ares(2021)8022860-31/12/2021; European Commission: Luxembourg, 2021. [Google Scholar]
- Burnham, A.; Wang, M.; Wu, Y. Development and Applications of GREET 2.7--The Transportation Vehicle-CycleModel; Argonne National Lab.(ANL): Argonne, IL, USA, 2006.
- Ntziachristos, L.; Boulter, P. Road Vehicle Tyre and Brake Wear. Road Surface Wear. EMEP/CORINAIR Emission Inventory Guidebook; European Environment Agency: Copenhagen, Denmark, 2009. [Google Scholar]
- Del Duce, A.; Gauch, M.; Althaus, H.J. Electric passenger car transport and passenger car life cycle inventories in ecoinvent version 3. Int. J. Life Cycle Assess. 2016, 21, 1314–1326. [Google Scholar] [CrossRef]
- Ministero dello Sviluppo Economico. Produzione nazionale di idrocarburi—anno 2019. 2019. Available online: https://unmig.mise.gov.it/images/dati/produzione-2019.pdf (accessed on 24 August 2022).
- Ministero dello Sviluppo Economico. La situazione energetica nazionale nel 2019. 2020. Available online: https://dgsaie.mise.gov.it/pub/sen/relazioni/relazione_annuale_situazione_energetica_nazionale_dati_2019.pdf (accessed on 24 August 2022).
- Girardi, P.; Brambilla, P.C.; Mela, G. Life Cycle Air Emissions External Costs Assessment for Comparing Electric and Traditional Passenger Cars. Integr. Environ. Assess. Manag. 2020, 16, 140–150. [Google Scholar] [CrossRef] [Green Version]
- Saxena, S.; Le Floch, C.; MacDonald, J.; Moura, S. Quantifying EV battery end-of-life through analysis of travel needs with vehicle powertrain models. J. Power Sources 2015, 282, 265–276. [Google Scholar] [CrossRef] [Green Version]
- Brambilla, P.C.; Temporelli, A.; Mela, G.; Molocchi, A.; Brivio, F. LCA della Mobilità Urbana dalle Persone alle Merci; 21010643; RSE, Rapporto di Ricerca di Sistema: Milan, Italy, 2021; Available online: https://www.rse-web.it/rapporti/ (accessed on 24 August 2022).
- Saenz, J.F.M.; Faulin, J. Assessment of the carbon footprint reductions of tricycle logistics services. Transp. Res. Rec. 2016, 2570, 48–56. [Google Scholar] [CrossRef]
- Aiello, G.; Quaranta, S.; Certa, A.; Inguanta, R. Optimization of urban delivery systems based on electric assisted cargo bikes with modular battery size, taking into account the service requirements and the specific operational context. Energies 2021, 14, 4672. [Google Scholar] [CrossRef]


| Data | E-Cargo Bike | Electric Van | Plug-In Hybrid Van | Diesel Van |
|---|---|---|---|---|
| Model | SUM-X | Nissan e-NV200 | Renault Megane | Ford Transit Connect |
| Size (length × width × height) [cm] | 260 × 150 × 195 | 456 × 175 × 186 | 436 × 181 × 144 | 442 × 197 × 183 |
| Load compartment capacity [m3] | 1.75 | 4.2 | 1.4 | 3.6 |
| Max load capacity [kg] | 300 | 742 | N.A. | 903 |
| Curb weight [kg] | 80 | 1480 | 1603 | 1620 |
| Range [km] | 60 | 300 | 65 (electric)+500 | 850 |
| Power supply system | Human + Electric | Electric | Plug-in hybrid (petrol) | Diesel |
| Engine size [cc] | - | - | 1598 | 1499 |
| Emission standard | - | - | Euro 6D ISC FCM | Euro 6D ISC FCM |
| Emission treatment system | - | - | TWC | EGR-DOC-SCR-DPF |
| Vehicle | Energy Carrier | UM Consumption | Consumption | Energy Consumption [MJ/km] |
|---|---|---|---|---|
| Nissan e-NV200 | Electricity | kWh/km | 0.220 | 0.79 |
| Renault Megane PHEV | Electricity | kWh/km | 0.180 | 1.88 |
| Petrol | kg/km | 0.028 | ||
| Ford Transit Connect | Diesel | kg/km | 0.075 | 3.21 |
| Renault Megane PHEV | Ford Transit Connect | UM | |
|---|---|---|---|
| CO2 | 84.624 | 230.283 | g/km |
| CO | 159.179 | 78.216 | mg/km |
| NOx | 8.882 | 21.676 | mg/km |
| THC | 19.437 | 4.236 | mg/km |
| CH4 | 1.203 | 1.151 | mg/km |
| NMHC | 18.234 | 3.085 | mg/km |
| NH3 | 2.767 | 0.164 | mg/km |
| N2O | 1.326 | 10.286 | mg/km |
| PM2.5 | 0.004 | 0.532 | mg/km |
| Impact Category | UM | Cargo Bike SC0 | Cargo Bike SC1 | Electric Van | Plug-In Hybrid Van | Diesel Van |
|---|---|---|---|---|---|---|
| Climate Change | kg CO2 eq | 7.89 × 10⁻² | 8.01 × 10⁻² | 1.58 × 10⁻¹ | 2.46 × 10⁻¹ | 3.31 × 10⁻¹ |
| Photochemical Ozone Formation | kg NMVOC eq | 1.78 × 10⁻⁴ | 1.82 × 10⁻⁴ | 3.10 × 10⁻⁴ | 4.48 × 10⁻⁴ | 4.88 × 10⁻⁴ |
| Acidification terrestrial and freshwater | mol H+ eq | 4.40 × 10⁻⁴ | 4.49 × 10⁻⁴ | 9.37 × 10⁻⁴ | 1.14 × 10⁻³ | 9.61 × 10⁻⁴ |
| Respiratory inorganics | disease inc | 4.44 × 10⁻⁹ | 4.49 × 10⁻⁹ | 8.62 × 10⁻⁹ | 1.01 × 10⁻⁸ | 9.08 × 10⁻⁹ |
| Non-cancer human health effects | CTUh | 8.77 × 10⁻⁹ | 8.96 × 10⁻⁹ | 2.61 × 10⁻⁸ | 3.06 × 10⁻⁸ | 2.64 × 10⁻⁸ |
| Cancer human health effects | CTUh | 1.15 × 10⁻⁹ | 1.17 × 10⁻⁹ | 3.76 × 10⁻⁹ | 4.37 × 10⁻⁹ | 4.21 × 10⁻⁹ |
| Resource use, energy carriers | MJ | 8.42 × 10⁻¹ | 8.62 × 10⁻¹ | 1.89 × 100 | 3.25 × 100 | 4.49 × 100 |
| Resource use, mineral and metals | kg Sb eq | 7.06 × 10⁻⁷ | 7.34 × 10⁻⁷ | 3.88 × 10⁻⁶ | 3.62 × 10⁻⁶ | 1.51 × 10⁻⁶ |
| Electricity Production [%] | IT 2018 | IT 2030 | All PV | All NG |
|---|---|---|---|---|
| Solids (coal) | 9% | 0% | 0% | 0% |
| Gas (including derived gases) | 39% | 35% | 0% | 100% |
| Oil (including refinery gas) | 3% | 1% | 0% | 0% |
| Hydro (pumping excluded) | 15% | 15% | 0% | 0% |
| Solar | 7% | 22% | 100% | 0% |
| Biomass-waste | 6% | 5% | 0% | 0% |
| Nuclear energy | 0% | 0% | 0% | 0% |
| Import | 13% | 8% | 0% | 0% |
| Wind | 5% | 12% | 0% | 0% |
| Geothermal and other renewables | 2% | 2% | 0% | 0% |
| Other fuels (hydrogen, methanol) | 0% | 0% | 0% | 0% |
Publisher’s Note: MDPI stays neutral with regard to jurisdictional claims in published maps and institutional affiliations. |
© 2022 by the authors. Licensee MDPI, Basel, Switzerland. This article is an open access article distributed under the terms and conditions of the Creative Commons Attribution (CC BY) license (https://creativecommons.org/licenses/by/4.0/).
Share and Cite
Temporelli, A.; Brambilla, P.C.; Brivio, E.; Girardi, P. Last Mile Logistics Life Cycle Assessment: A Comparative Analysis from Diesel Van to E-Cargo Bike. Energies 2022, 15, 7817. https://doi.org/10.3390/en15207817
Temporelli A, Brambilla PC, Brivio E, Girardi P. Last Mile Logistics Life Cycle Assessment: A Comparative Analysis from Diesel Van to E-Cargo Bike. Energies. 2022; 15(20):7817. https://doi.org/10.3390/en15207817
Chicago/Turabian StyleTemporelli, Andrea, Paola Cristina Brambilla, Elisabetta Brivio, and Pierpaolo Girardi. 2022. "Last Mile Logistics Life Cycle Assessment: A Comparative Analysis from Diesel Van to E-Cargo Bike" Energies 15, no. 20: 7817. https://doi.org/10.3390/en15207817
APA StyleTemporelli, A., Brambilla, P. C., Brivio, E., & Girardi, P. (2022). Last Mile Logistics Life Cycle Assessment: A Comparative Analysis from Diesel Van to E-Cargo Bike. Energies, 15(20), 7817. https://doi.org/10.3390/en15207817