Abstract
Balancing electricity demand and supply remains a significant challenge for the power systems in developing countries, such as Nigeria. In Nigeria, there is a shortage of adequate power supply, and demand-side management (DSM) plays a minor role in the power balancing mechanism with load shedding being widely used. The paper aims to review and compare various existing and emerging DSM strategies in developing countries. An extensive and systematic review was conducted to evaluate potential solutions using DSM to increase the overall energy efficiency in the Nigerian electricity market. This study found that, although the technical and economic potentials of DSM vary in developed countries, the uptakes of DSM have been severely hampered hence preventing the full exploitation and utilisation of the full potential of DSM. The initiatives of a DSM model in Nigeria and other developing countries can play a significant role in addressing demand and supply challenges but an upgrade of the energy infrastructures, a reform of the market structure and the provision of financial incentives are required to allow for wide implementations of DSM strategies in developing countries.
1. Introduction
Electricity plays a vital role in the economic, social and political development of a country, serving as the cornerstone of modern society [1,2]. The increment in the standard of living, industrialisation and other sectors (such as health, education) is significantly influenced by the limitation of adequate energy supply [2,3]. Different studies have correlated the relationship between the role energy consumption plays in the economic, social and technological growth of a country [4]. The quest for electrical vitality is increasing exponentially, and the accessible assets are exhausting at an alarming rate. Subsequently, it is imperative to adequately manage the energy sources, enhancing the use and curtailing the production cost [5]. For years developing countries have been forecast to experience growth in energy demand and increased fossil fuel use, and an associated increase in emissions of greenhouse gasses, with low-income households driving the rise in energy consumption [6]. The energy consumption in developing countries is set to increase by 3% annually from 46% to 58% between 2004 and 2040 [7]. The wealth of resources has not translated to available power in a country like Nigeria which, while abundant in natural resources, retains one of Africa’s lowest electric power consumption per capita rates of 145 kWh, in comparison to the likes of South African with 4198 kWh, Egypt with 1683 kWh, Namibia with 1653 kWh and Botswana 1816 kWh [8]. According to the World Resource Institute, 61.4% of global greenhouse gas (GHG) emissions is the result of energy-related activities, and history has illustrated that the bulk of these emissions emerge from developing countries [9]. Air pollutants associated with solid fuel use have become of great concern to environmentalists and policymakers in Sub-Saharan Africa, and this energy source is responsible for 4000 premature death per day [10]. According to the Intergovernmental Panel on Climate Change (IPCC), the current climate and the crises in the global economy due to the recent global pandemic (COVID-19) have further necessitated the need to transition to low-carbon energy systems, with renewable energy estimated to supply 70–80% of the global electricity by 2050 [11]. The growth in electricity demand, together with economic and policy drivers, has promoted the universal consumption of renewable energy by 3% annually between 2018 and 2050, making it the leading source of primary energy consumption, although fossil fuel continues to meet much of the world’s present energy demand requirement [12]. The potential of renewable energy in developing countries has placed it in a crucial position in the energy transition, with a projected double increase in electricity demand [13]. The African Renewable Energy Initiative (AREI) was launched at COP21 with a pledge to mobilize the continent to generate 300 GW from renewable energy by 2030 and to provide a new and additional renewable energy capacity of 10 GW in 2020 [14]. It is estimated that the impact of COVID-19 could significantly hinder future investment due to economic and financial constraints, in other words, making it paramount to provide a suitable strategy of investment for an effective transition to a sustainable renewable energy system [15]. Many countries face the challenge of balancing demand and supply, with many adopting the traditional approach of increasing energy supply utilities in matching the demand [16]. The distinct orientation of top-down and single-direction energy flow has presented challenges with the increasing number of renewable resources, thereby requiring sophisticated real-time control of distributed energy resources. Demand-side management (DSM) presents an alternative in balancing demand and supply [17].
Most research has focused on consumers in industrialized or developed economies with few studies undertaken on alternative schemes for consumers in developing economies. This paper fills the gap by reviewing DSM policies, experiences and hindrances in developed countries, and assessing the potentials and requirements of the role DSM could play in the electricity industry in Nigeria.
An overview of DSM in developed countries, examining the depth of DSM initiatives, potentials and policies, is presented in Section 2. The role DSM is playing in developing countries is described in Section 3. This paper presents and discusses the market and regulatory structure of the Nigerian electricity supply industry in Section 4. The DSM applications in developed and developing countries are analysed and compared in Section 5. Conclusions and recommendations for the realisation of DSM in developing countries are presented in Section 6.
2. Overview of Demand Side Management (DSM)
In this section, the definitions and classification of DSM initiatives have been evaluated.
DSM was introduced in the 1980s by the Electric Power Research Institute to change load shapes and patterns of energy consumption to improve reliability, monitoring, and investment deferral. DSM places customers in the middle of the decision-making process to decide how and when electricity is utilized [18,19]. The evolution of the electricity market has further evolved DSM [20]. The definition of DSM in the literature is broad, but the overall goal of DSM is to reduce the energy demand by shifting consumption patterns on the customer side. According to Warren [17] “DSM refers to technologies, actions and programmes on the demand-side of energy metres that seek to manage or decrease energy consumption, in order to reduce total energy system expenditures or contribute to the achievement of policy objectives such as emissions reduction or balancing supply and demand.” According to Lampropoulos [21], DSM involves the complete series of management functions which are allied with guiding demand-side activities such as programme planning, evaluation, implementation, and monitoring. Strabac [22] defines DSM in terms of consumers’ response to changes in price and shifting of load for on- to off-peak periods.
Overall the literature categorized DSM into two classifications (see Figure 1) [23]:
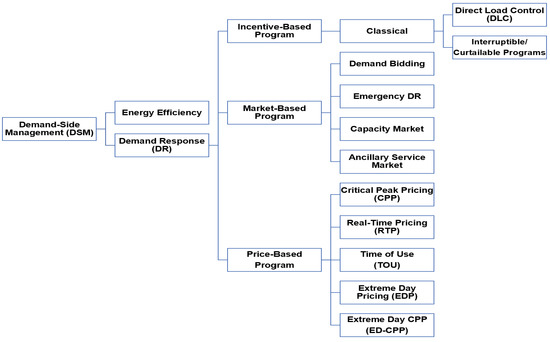
Figure 1.
Classification of Demand-Side Management [23].
- (i)
- Demand response (DR) provides the platform for end-users to alter load consumption patterns in response to a price change of electricity over a period, thereby reducing the overall peak of the system.
- (ii)
- Energy efficiency emphasizes persuading consumers to utilize efficient products as a means of reducing demand [19,24,25].
DR programmes are divided into incentive-based and price-based [19,23]. In the incentive-based programme, classical programme customers receive bill credit or discount rates for participating in the programmes while market-based customers receive a reward for load reduction. Price-based programmes are utilized to flatten the demand curve by providing high prices during peak periods and lower prices during the off-peak period [23]. This paper focuses on the benefits, potentials, and challenges of both DR and EE.
3. Methodology
In this paper, we aim to compare and evaluate DSM programmes in developed countries (including the U.S., Australia and UK) to developing countries (including India, South Africa and Nigeria) from the 1980s to 2021. This comparison aims to identify replicable success factors to accelerate the implementation and uptake of DSM initiatives in developing countries, particularly Nigeria. The review is limited to the use of academic journals, government, and official reports to appraise the selected countries’ various power system architecture and energy markets. The paper also aims to gain an in-depth understanding of the key barriers to the implementation of DSM and innovative balancing mechanisms in developing countries.
The U.S. and UK were selected as the case studies, as they are the leading developed countries in providing DSM programmes with DSM playing a prominent role in balancing their power grid [26,27]. Australia was selected as a case study, as Australia experiences extreme summer days across the eastern seaboard with temperate climbing beyond 40 degrees [28], and Nigeria experiences similar weather conditions. Among developing countries, this paper will review India, South Africa, and Nigeria. India is the second-most populated country in the world that experiences challenges to suppling its energy demand requirement. Similarly, South Africa currently faces severe crises in the supply of its energy demand. Nigeria is the most populated county in Africa continuing to face the challenge of matching demand with supply.
The literature classifies DSM programmes into three categories: (i) price-based, (ii) incentive-based and (iii) energy efficiency programmes. The analysis on the level of implementation for the different countries is based on categories (e.g., industrial, commercial, and residential sectors). “Majorly implemented” means these countries run different DSM programmes in the three sectors of industrial, commercial, and residential. “Partly implemented” indicates various DSM programmes in two sectors, while “Not/negligible implementation” indicates no programmes, or an insignificant number of programmes, in any of the sectors. This comparison illustrates the level of implementation of DSM programmes in these countries.
4. Evaluation of Demand-Side Management Programme Mechanisms in Developed Countries: U.S., Australia and UK
This section provides an overview of DSM initiatives to identify the key factors contributing to an efficient power system in the U.S., Australia, and the UK.
4.1. The United States (U.S.)
Utilities in the U.S. have contributed to the immense development of energy efficiency and DR, with energy efficiency being the most extensive DSM. These U.S. Utilities have invested USD5.9, USD6.2 and USD5.9 billion in 2014, 2016 and 2017, respectively, producing increased savings from 26.5 MWh to 29.9 million. These investments were the provision of customer incentives such as free or low-cost energy audits of homes and businesses, free or discounted energy-efficient bulbs, and rebates for the purchase of energy-efficient appliances amongst others [27]. According to Mordor [29], 9.5 million customers are enrolled in different DR programmes accounting for nearly 10% of the electricity demand, providing significant peak demand savings across utilities as illustrated in Figure 2.
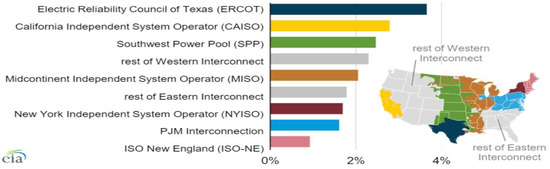
Figure 2.
Percentage of the total peak demand savings from demand response [30].
DSM Programmes in the U.S.
The Pennsylvania-Maryland-New Jersey Interconnection (PJM), a mid-Atlantic grid operator that coordinates wholesale electricity, is considered the largest power market in the U.S., serving 13 states and the Columbia district. The California Independent System Operator (CAISO) is the second-largest and most modern power grid globally, serving California, the most populated U.S. state with 39.512 million [31]. In response to the state energy policy committing to carbon-free electricity sources by 2024 [32], with an unmatched challenge in balancing the growing share of solar and wind energy, California is turning to demand response (DR) and energy efficiency (EE) as the bedrock for an essential, dependable and predictable resource for a stable, cleaner, greener and environmentally sustainable electricity grid [33]. DR plays a crucial part in the PJM and CAISO markets. The different array of market products operated by both PJM and CAISO is shown in Table 1 [33,34].

Table 1.
Summary of the PJM and CAISO Electricity Market (NEM) mechanisms.
The California government, in an effort to boost the DR programme in the residential sector, ran a study to advance the DR programme with the goal of (i) evaluating the effect of different timing and messaging, (ii) assessing diverse financial incentive mechanisms, (iii) evaluating the current baseline methodology and the effect on customer electricity conservation, and (iv) forestalling the effect of time of use rate based on the project team research findings [35]. The regulatory reform has created new opportunities for DR such as the Demand Response Auction Mechanism (DRAM), which seeks to cover areas where electric reliability may be at risk. The goal is to fully integrate DR resources with the CAISO market, permit the residential sector to engage directly into the CAISO market and assess the possibility of third parties providing resources without a structured utility programme [36]. CAISO identified the challenges hindering the success of DR programmes and proffers roadmaps in achieving a successfully configured DR programme. (See Table 2). This removal of barriers will increase DR and Energy Efficiency’s penetration and places them as essential, reliable, and predictable resources that will support a reliable and environmentally sustainable electric power system.
Table 2.
The barriers hindering the DR programme and the recommendation by CASIO for a properly configured DR programme.
The launch of the state’s green new normal initiative for fossil-free energy is set to increase the proportion of fossil-free electricity generation from the present 36% to 60% in 2030 and 100% in 2045 [37]. The Californian state-set targets and continuous dependence on renewable energy has increased the challenge for CAISO to ensure a reliable power supply in periods of intense heat which often causes a spike in power demand [38,39]. An analysis conducted in August 2020 due to rotating electricity outages revealed resource adequacy, planning processes and other market practices as the root causes. This suggests the need to realign strategies to ensure high reliability to avert future occurrences [40]. The event has provided for a USD100 m expansion of infrastructure which increases the load reduction capacity from 100 MW to 550 MW over three years. The investment includes the provision of smart thermostats to shift air-conditioning loads and wireless-connected smart plugs to remotely turn on and off appliances [41].
4.2. Australia
The Australian National Electricity Market (NEM) is operated by the Australian Energy Market Operator (AEMO) across Victoria, Queensland, New South Wales, South Australia, the Australian Capital Territory, and Tasmania [42], with a population of 25,764,830 [43]. Trading in the electricity market is designed to be conducted as a spot market, where balancing demand and supply is driven in real-time via a centrally coordinated dispatch process with the daily offer submitted at 5 min intervals for a market price cap of AUD12,500 per megawatt-hour (MWh). A customer has a choice to purchase energy from AEMO or a retailer with access to the spot market [44]. Australian Renewable Energy Agency (ARENA) and AEMO, are collaborating to run ten pilot DR projects worth AUD35.7 million to deliver 200 megawatts (MW) in Victoria, South Australia, and New South Wales. The incentive-based initiative aims to reduce power consumption when reserves attain critical levels and demonstrate the role DR could play during summer heat waves [45]. Despite these initiatives, Australia still lags behind most European and North American countries in the use of DR for balancing mechanisms [46].
DSM Programmes in Australia
The Australian National Electricity Market (NEM) comprises two markets (see Table 3):
Table 3.
Summary of the Australian National Electricity Market (NEM) mechanisms.
- (a)
- Competitive wholesale markets [47,48,49].
- (b)
- Regulated monopoly network—a framework for the electricity sector [50,51].
AEMO allows customers with access to the market to reduce consumption through a demand response mechanism (DRM) and ancillary service. DRM allows end-users to be compensated for DR from the spot market through a demand response aggregator (DRA). This mechanism will mainly assist commercial and industrial users with annual consumption of 100 MWh per year while the future design will allow end-users (demand response load) to participate through a DRA [52]. AEMO operates eight separate ancillary markets [49], and these ancillary service markets are categorized into three functions as shown in Table 4 [44,49,53].
Table 4.
Ancillary markets in Australia.
The potential of DR was demonstrated by the Alcoa aluminium smelter in western Victoria. The company powered down for 100 min as the temperature soared, freeing 400 megawatts of electricity, eliminating the need for load shedding on the grid [54]. Meridian Energy, the retailer, as part of the DR trail, runs a mobile phone user-operated DR phone application. Participants receive a notification from the app when power spikes up, requesting them to alter energy consumption. This system is to save 5 MW a year [55]. Furthermore, customers under DR programmes such as interruptible tariffs, spot pass-through, and scheduled loads incur some degree of risk and transaction cost, which cannot be efficiently managed by most commercial and industrial users. The policy, regulation, design and competition in the past have amounted to the high cost of electricity, making it unaffordable to consumers and businesses [52]. The report [56], and AEMC draft rule reform for the energy market rolling out in 2022, aim to reduce electricity prices. This allows large commercial and industrial energy-user businesses through DRA into the wholesale market offering demand reductions, which will consequently increase competition, eventually help to lower prices for customers, and increase the efficiency of the power system. The ancillary market restructure enables DRA participation in FCAS using individual load or aggregated load independently of the retailer, consequently removing the control of retailers [54].
The continuous growth of renewable energy and AEMO Integrated System Plan 2020 suggest the need for 6–19 GW of energy storage by 2035 for the energy market. This necessitated ARENA to collaborate on different energy storage programmes such as the AUD777 million Kidston hydro facility with a capacity of 250 MW. The energy storage will provide 8-h storage which will ensure the reliability of supply and support for power systems security [57]. Another facility is the AUD30 million, 30 MW/8 MWh grid-connected battery, Energy Storage for Commercial Renewable Integration (ESCRI). This phase two programme aims to offer storage support to renewable generation in the event of generation shortfalls, a blackout, or the provision of fast frequency response to stabilise the electricity network in a time when more renewable sources are coming online [58]. Similarly, a AUD13.03 million project will conduct trials on the deployment of 600 MW PHES using underground coal mining voids as a cost-reduction alternative compared to traditional PHES [59]. Furthermore, project MATCH (Monitoring and Analysis Toolbox for Compliance in a High DER Future) aims to study the behaviour of distributed energy resources under disturbance, with the aim to provide AEMO with tools to manage DER response to disturbance and changes required for FCAS linked to real-time DER generation [60].
4.3. The United Kingdom (U.K.)
The U.K., more than most other European countries, provides different DR markets. These DR programmes offer a paradigm shift in the operation of the electricity market from a unidirectional mode to a system where customers play a role in the use of energy through the increase and decrease in demand. This programmeacts to balance power across the grid through ancillary services [61]. The U.K. residential demand accounts for one-third of overall electricity demand with a 40% peak demand. The network faces an increasingly significant peak demand, causing an imbalance of demand and supply, which significantly increases the energy costs [62].
DSM Programmes in the United Kingdom
The National Grid Electricity System Operator conducts the balancing mechanism by providing a resilient, flexible electricity system through suppliers, generators, traders, and the wholesale electricity market (see Table 5) [63].
Table 5.
Balancing services in the United Kingdom [64,65].
Prominent services contracted by the system operator are frequency response service, fast reserve, STOR and time use of tariff [61]. Flexitricity, a commercial aggregator, provides opportunities to businesses to increase revenue while participating in the STOR service. This service offers a minimum of 3 MW of generation or reduces demand within 4 h of accepting instruction from the National operator for a sustainable period of 2 h, while the frequency response service curtails frequency drops when large stations experience drops in generation. Similarly, it engages in the Triad programme, three half-hour periods of peak power (November–February) demand across the grid [66], with case studies of Royal United Hospital in Bath [67] and Thameswey Central, Milton Keynes [68]. Another example is [63], which provided energy efficient solutions such as LED lighting, automatic doors and pipe insulation for Durham County Council at three facilities, providing a 34% energy reduction, saving 380 kWh, which translates to a GBP44,000 cost reduction [69]. Time-of-use programmes such as Octopus Agile, Octopus Go and Go Tariff have played a significant role in shifting energy use to off-peak while providing the customer with the opportunity to save [70].
The need for flexibility is increasing as renewable power generation capacity has grown in the U.K. to 47% of its capacity in 2020, eclipsing fossil fuel [71]. The U.K. has the largest installed capacity of offshore wind in the world; however, a non-consistent wind speed is a major factor. This uncertainty has necessitated the government to remove barriers to enabling the construction of large battery storage facilities to store the energy generated from wind and solar. The legislation removed the barriers to storage above 50 MW in England and 350 MW in Wales which is estimated to save the U.K. energy system up to GBP40 billion by 2050 [72]. The policy has also ushered in a GBP10 million liquid air energy storage facility in Greater Manchester. This 50 MW/250 MWh project is expected to be one of Europe’s largest energy storage facilities, powering 200,000 homes and producing a performance longer than a lithium battery in delivering the much-needed clean, reliable and cost-efficient energy storage to the U.K. national grid [73].
5. The Role of DSM in Developing Countries
This section provides an overview of Indian, South African, and Nigerian DSM programmes as examples of developing countries, in order to critically evaluate the role and importance of DSM initiatives in the electricity market of developing countries and to identify the factors that have influenced the slow uptake of DSM in these countries.
5.1. India
India is globally the third-largest energy consumer, with the fifth-largest electricity grid and third-largest distribution and transmission network with a total installed capacity of 372,693 MW of electricity [74,75]. The network faces the challenge of voltage fluctuations, recurrent load shedding, lack of reactive power support, and inefficient metering systems [76].
DSM Programmes in India
In 2001, the Energy Conservation Act was enacted to reduce energy intensity in India with the Bureau of Energy Efficiency given the responsibility of providing a regulatory framework [77]. The Energy Conservation Act offers a mandate for the following schemes to encourage energy efficiency and energy conversation:
- (1)
- Standard labeling of equipment and appliances: this scheme enables consumers to choose energy-saving and cost-saving products. It prescribes the limits of equipment’s energy consumption with labels attached to energy performance, which gives customers the necessary information to make a knowledgeable purchase. This schemes presently has 26 appliances/equipment with star ratings [78].
- (2)
- Energy Conservation Building Code for commercial buildings (ECBC): this is a useful tool to curb future energy growth delivering cost-saving tools to building users and owners, with the building sector accounting for 33%. This effective implementation of the code is projected to save 125 billion units of electricity by 2030 [79].
DSM in India is categorized into different aspects as highlighted in Table 6.
Table 6.
DSM programmes in India [80,81,82].
Energy efficiency in the small and medium enterprise (SME) sector accounts for sixty-three million, with the majority lacking energy efficiency due to obsolete, low-efficiency technologies. BEE initiated an intervention on 25 SMEs during the XI plan, and a study was conducted to assess the technology gap, produce EE manuals and build capacity, amongst other things. The second phase is the implementation of 100 proven technology projects in five SME sectors [83]. The need for DSM in India cannot be overemphasized, with demand outstripping capacity and inadequate cash flow experienced by utilities [84]. DSM’s significant barriers have been the deficiency of knowledge, lack of awareness from utility companies and consumers, cross-subsidy to agriculture and domestic customers, and inefficient tariff and market structure. Furthermore, utilities’ unwillingness to promote energy conservation among industrial and commercial customers due to fear of revenue loss from high-paying customers, as well as the absence of any penal provision for the lack of power factor correction, has hampered the development of DSM [81]. Appropriate policy and programmes with legal backing, incentives for DSM investment and proper tariff structure will propel the development of DSM in India [85].
The government intends to attain 175 GW of renewable energy (100 GW from Solar, 10 GW from bio-power, 60 GW from wind and 5 GW from hydropower) by 2022, with projections indicating renewable energy will contribute 20.3% and 24.2% by 2027 [86]. Presently, India has an installed variable renewable energy (VRE) capacity of 73.74 GW from solar and wind, accounting for 19.79% of the total installed capacity. The report from the national load despatch agency indicates an energy mix varying between 6% to 10% over a month, with the system lacking adequate storage facilities, and as such all energy generated is fed onto the grid creating a possible imbalance in frequency. This limitation has hampered the growth of renewable energy, with support for the control of the grid using energy generated from the mix of thermal and hydropower [87]. The growth of renewable energy is greatly hampered due to the high reliance of the sector on private investment and stimulus, to which the COVID-19 pandemic has added several financial and logistical obstacles, increasing the gap between the actual and target capacity [88].
5.2. South Africa
The South African electricity supply industry is a vertically integrated, publicly owned utility of the South African Government known as Eskom Holding SOC Limited (Eskom). This is regulated by the National Electricity Regulator of South Africa (NERSA) [89,90]. For a population of 59,978,099 [91], South Africa has an installed 48 GW capacity with Eskom supplying 94% to the market, while 6% is supplied by municipal power stations and the private sector [92]. The depletion of the electricity reserve margin has led to substantial power shortages with balancing mechanisms in the form of load shedding [93,94]. In 2004, NERSA promulgated the regulatory policy on energy efficiency and DSM. The policy presents EE/DSM as one of the pre-conditions for licensing all electricity distributors. A total of 203 projects from different programmes produced a total evening peak demand savings of 409.6 MW, with NERSA projecting savings of 379 MW [95]. Peak demand ranges between six in the morning and midday, and five and nine in the evening [96].
DSM Programmes in South Africa
DSM is an integral part of the South African electricity market with DR programmes driven by the occurrence of constraints on the national power system. These DR programmes are categorized into four as shown in Table 7 while EE programmes are highlighted in Table 8.
Table 7.
DR programmes in South Africa [97,98].
Table 8.
EE programmes in South Africa [99,100,101,102,103].
DR and EE’s role in the energy market is projected to play a significant part, with electricity costs set to increase by 15% from mid-2021. These increases in energy tariffs are the driving force for growth development, decreasing grid reliability based on load shedding. Policy enabling private or distributed generation may encourage businesses to choose to relinquish expensive grids, thereby eliminating the Eskom revenue stream, further worsening the tariff cost [104]. South Africa is highly reliant on coal, accounting for the generation of close to 70% of the energy supply, while biofuel represents 10.7%, crude oil 14.8%, nuclear 2.4%, gas 2.9%, hydroelectric 0.1% and the combination of solar and wind accounts for 0.1% of the energy supply [105]. Renewable energy is set to play a vital role with the estimated total revenue from the energy market of $1.3 billion in 2019, representing a compound annual growth of 20.3% between 2015–2019 [106]. The launch of the Renewable Energy Independent Power Producer Procurement Programme will provide for the installation of 17.8 GW of renewable energy (wind, solar, biomass, biogas and hydropower, for a period from 2012–2030. This will reduce the dependence on nuclear and coal as a source of energy [107]. The government has set legislation to penalize high carbon end-users, emitters such as mines and large industrial operators through the new carbon tax. Banks on their part have initiated the termination of the finance on the new coal power station [108]. To decarbonise the country and meet the energy demand, Eskom has launched 1400 MWh solar and energy storage projects to allow for the greater integration of renewable energy [105]. The sign-off for the construction of a 128 MW combined photovoltaics, wind and lithium-ion battery storage power plant will make it the largest hybrid energy project in Africa. The plant is expected to dispatch power between the hours of 5.00 and 21.30 while excess power will be stored in the lithium batteries [109].
6. Nigeria
Nigeria is Africa’s most populated country, with 206 million people, growing at an average of 2% annually with a United Nations projection of 401.31 and 728 million by 2050 and 2100 respectively [110,111]. The sub-Saharan country can boast an estimated reserve of 185 trillion cubic feet of natural gas, 2.75 billion tons of coal, and 35 billion barrels of crude oil [112].
6.1. Overview of Nigerian Electricity Market (NEM)
The continuous challenge with power supply has propelled different amendments, with the most recent being to the Electric Power Sector bill of 2005 known as (ESPR Act) 2005. These paved the way for the privatization and the creation of 18 companies, mainly private owners of the six generation companies (GENCO), one transmission Company (TCN), and 60% of its shares in the eleven distribution Companies (DISCO). This process has provided a platform for private participation in the industry [113]. The country has an installed capacity of 10,396 MW (thermal 8457.6 MW, and hydropower 1938.4 MW) [114]. Table 9 illustrates the importance of the various energy sources. For comparison, the table shows the average value for the world and Africa.
Table 9.
Percent of electricity generation [115].
The Nigerian Electricity Market (NEM) has gone through a transformation in recent years in the quest to provide energy security to the country. The Nigerian Electricity Market structure is designed as illustrated in Figure 3 to provide an efficient, competitive, reliable, and transparent electricity market. This transformation was structured into pre-privatisation and post-privatisation, categorized with a four-stage framework: (i) the pre-transitional stage of unbundling the state-owned utility and privatisation of generation and distribution assets, (ii) the transitional phase, providing a formalised competition with transactions based on contracts, (iii) the medium stage creates more competition in generation with a centralised balancing mechanism, (iv) the long term stage is the full implementation of the competitive wholesale and retail electricity market [116].
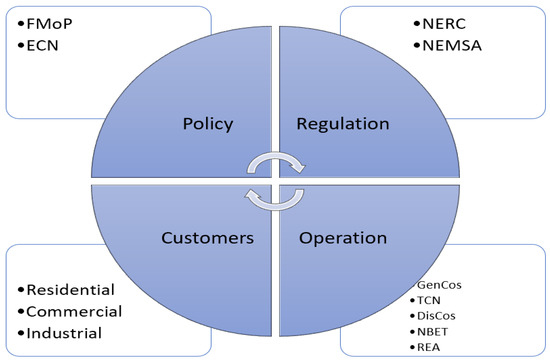
Figure 3.
Nigeria Electricity Market Industry (FMoP: Federal Ministry of Power; ECN: Energy Commission of Nigeria; NERC: Nigeria Electricity Regulatory Commission; NEMSA: Nigeria Electricity Management Services Agency; GenCos: Generation Companies; TCN: Transmission Company of Nigeria; DisCos: Distribution Companies; NBET: Nigeria Bulk Electricity Trading Company Plc).
6.1.1. Challenges in the Nigeria Electric Power Systems
The challenge of meeting energy security is illustrated in Figure 4. Available data collected over nine months in 2018 indicate that the available energy hovered between 3700 and 4100 MW for a system capacity ranging between 7400 and 8200 MW due to a combination of factors such as inadequate gas supply, limitation of the distribution network, challenges with water management, transmission line capacity limitation, and other associated infrastructure issues [117]. Further decline is due to insufficient funding of power stations, inadequate communication infrastructure, ineffective and delayed maintenance of facilities, low staff morale, outdated equipment, tools, safety, and lack of operations vehicles [118].
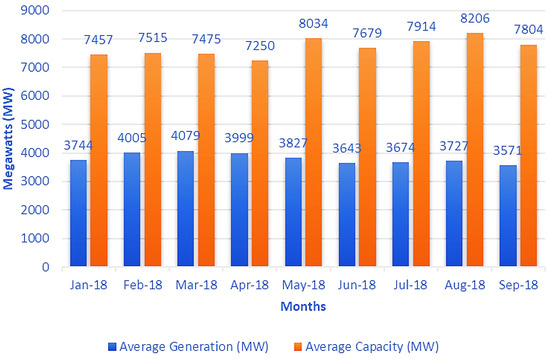
Figure 4.
Capacity margin (MW) [119].
In 2019, the Federal Government of Nigeria and Siemens entered into an agreement for the Nigeria Electrification Roadmap to rehabilitate, upgrade and expand transmission and distribution, and increase power generation. The roadmap, amongst other factors, includes the installation of a Supervisory Control and Data Acquisition (SCADA)/Energy Management System (EMS) and associated telecommunication infrastructure to provide real-time visibility, monitoring, and dispatching of power [120]. The roadmap is categorized into three phases:
- Phase 1: This will concentrate on critical and swift win measures by upgrading the system end-to-end operating capacity to 7 GW.
- Phase 2: This stage aims to illuminate the remaining bottlenecks to enable the full utilization of the existing structure of the generation network and last-mile distribution capacities, bringing the system’s operating capacity to 11 GW.
- Phase 3: The final stage of the agreement includes upgrading and expanding the grid to a capacity of 25 GW [121].
6.1.2. DSM Programmes in Nigeria
The National Energy Policy provides amongst others: (i) promotion of energy efficiency and conservation in the industry, (ii) enlightening of customers on the benefit of improved energy efficiency, (iii) the creation of guidelines and regulation of energy efficiency within the country, (iii) the policy on utilisation of energy efficiency methodology, machinery, and technologies for the construction, agriculture, industry, transport, household and commercial/service sectors, and (iv) development of standards, codes and guidelines on energy conservation [122]. Furthermore, NERC has historically promoted energy efficiency at different times through (i) the EPSR Act 2005, (ii) the Draft National Energy Master Plan in 2006, later revised in 2011, (iii) in 2008, the creation of the energy efficiency labelling standard for electrical appliances, equipment, and machinery, (iv) the inter-ministration committee on renewable energy (RE) and energy efficiency in 2009, and (v) the Review of Multi-Year Tariff Order (MYTO), presenting energy efficiency as cost migration to consumers [123]. NERC has developed two programmes:
- (1)
- The promotion of the benefits of CFLs and light-emitting diodes (LED). This bulb replacement is estimated to reduce peak demand between 3000 MW and 4000 MW of electricity with system peak corresponding to residential peak, with lighting accounting for 60% [124].
- (2)
- The deployment and roll-out of electricity meters under the Meter Asset Provider (MAP). The MAP framework is created for the supply, installation, and maintenance of end-user meters by independent providers approved by the commission [125]. This programme is designed to bridge the metering gap in the power market. The 11 DISCOS has a collective customer base of 8,292,840 but has only supplied meters to 3,591,168, representing 43% [126]. Nigeria’s government has approved a one-year deferment of the 35% import adjustment tax (levy) to support the roll-out of three million electricity meters [127,128].
The projections of the Nigerian national energy efficiency action plan are that with the increase in awareness, utilization of efficient lighting by households will increase by 40% in 2020 and 100% in 2030. The high energy-consuming sectors (transport, power, and industrial) will increase by 20% in 2020 and 50% compared to the baseline, resulting in a distribution loss-reduction target of less than 10% [129]. The DSM’s potential is enormous, with industrialisation expected to drive electrification, the industrial load will boost electricity demand. This prospect is expected to support growth in demand flexibility, further offering the platform a more significant role for DSM within the electricity market [130].
Nigeria is a country that is gifted with conventional energy resources which have contributed to over 90% of the country’s income. These non-renewable sources are the major sources of electrical energy production [131]. The abundant renewable resources such as solar, wind, hydroelectric, tidal and biomass have propelled the development of the Renewable Energy Master Plan (REMP) [1]. The plan seeks to grow the supply of renewable energy by 13% in 2015, 23% in 2025 and 36% by 2030 [132]. The existing deployment of renewable energy in Nigeria has been in the form of the customers installing residential rooftop PV while government activities include the investment in microgrid systems as a remote off-grid solution for rural areas with a lack of access to the grid.
A part of the government economic sustainability plan in the aftermath of COVID-19 is the installation of a new off-grid solar connection to power five million communities, the initiative is estimated to provide NGN 7 billion (USD18 million) in increased tax revenue per annum as well as USD10 million in annual import substitution. The initiative will expand access to 25 million individuals through the provision of a solar home system (SHS) or connection to a mini-grid, and it will increase local content in the off-grid solar value chain and the creation of 250,000 new jobs in the energy sector [133]. The Energizing Economics Initiative seeks to deploy an off-grid solution to micro, small and medium enterprises (markets, shopping complexes and agricultural/industrial clusters). This aims to improve energy access and economic growth with a projected creation of 2500 jobs [134]. Another programme is the Energizing Education Programme (EEP) which seeks to deliver 28.5 MW of solar hybrid and/or gas-fired captive power plants to nine federal universities and one university teaching hospital. This will provide street lighting while decommissioning hundreds of generators [135].
7. Discussion
7.1. Comparison of DSM Programmes in Developed and Developing Countries
While the various developed countries have implemented different DSM programmes, it is possible to identify the most replicable success factors which are relevant elements for Nigeria when designing a mechanism for incorporating DSM into Nigeria’s energy market.
The U.S. and Australia have conducted numerical trials of peak load reduction using price-based programmes (e.g., real-time pricing, time-of-use, critical-peak pricing). These programmes were majorly implemented across the residential, commercial, and industrial sectors of their energy systems, providing security of the supply. In the U.K., a price-based programme such as Octopus Agile or Octopus Go and Go Faster has been implemented mostly by energy-intensive users in the industrial and large-commercial sectors which provides the flexibility of tariffs, ensuring an overall better energy management system. In India, price-based tariffs have been mostly implemented in the industrial sector and considerations are given to the application of these in the commercial sector. In South Africa, price-based tariffs in the industrial and commercial sectors were implemented. The operating hours may likely push customers to a flat-rate tariff structure in the near future due to the inability to shift demand (most commercial customers in South Africa have fixed operating hours from 8 am to 6 pm [136]). It has also been proposed that the time-of-use programme for the residential customer will be introduced by 2021 [137].
Incentive-based programmes (e.g., direct load control, interruptible/curtailable programmes) have been provided to residential, commercial, and industrial customers to reduce (or increase) load during system contingencies, in exchange for a discounted bill or credit. These programmes are operated as an aggregator business model and have been majorly implemented in the U.S. Currently, the incentive-based programme in Australia and the UK electricity market is limited to large industrial customers. In South Africa, the benefits of the DLC programme for cloth washers and cloth dryers were studied [93]. The results of this study clearly illustrated the potential of applying DLC programmes for load management in a developing country. The incentive-based programmes are regarded as the last line of defence in providing energy security and power system stability, and they are yet to be deployed in South Africa, Nigeria, and India.
Energy efficiency programmes have transformed the way energy is used in the world. Several energy efficiency policies and programmes have been adopted in the U.S., such as fuel economy standards, appliance and equipment energy efficiency standards, the energy star programme, etc. These policies and programmes have offered significant savings without which annual power consumption would be 23% higher. Furthermore, the energy efficiency programmes have provided 2.3 million jobs, accounting for 40% of all energy jobs [138]. Energy efficiency policy in Australia has shown a substantial decline in household electricity consumption over the last decades despite increased household equipment, in a country with appliances and lighting accounting for 30% and 15% of energy use, respectively. UK energy efficiency programmes (EEC 1 and EEC 2) achieved savings of 86.8 TWh and 187 TWh [17]. South Africa and India have significantly invested in energy efficiency programmes to reduce peak demand with campaigns aimed at the mass roll-out of CFL bulbs, consequently improving energy management.
A comparison of the level of implementation of these DSM programmes in the abovementioned countries is presented in Table 10.
Table 10.
Comparison of DSM programmes.
7.2. DSM Prospects in Nigeria
DSM can play a vital role in reducing the gap toward achieving energy security in Nigeria. The four-stage transition mechanism outlined by NERC in moving the energy market from the pre-transitional, transitional, medium to long term [123]. The goal was to build a competitive wholesale market with a real-time balancing mechanisms. However, Nigeria is currently in the transitional stage and the progress of moving to medium term has been ineffective due to the non-cost-effective tariff structure and political influence. As a result, load shedding has still been the most widely used method to manage demand and supply balance.
Price based programmes such as Time-of-Use (TOU) and Real-Time-Pricing (RTP) are examples of DSM programmes that utilise DSM strategies of peak clipping to reduce power demand in on-peak periods, and valley filling to increase power demand in off-peak periods. This programme will be suitable for Nigeria once it transitions to the medium-term energy market. Examples of this concept are supplying residential customers with a smart meter for a differential tariff, similar to the Economy 7 programme previously used in the UK, which allows for higher electricity prices during the day and lower during the night, or the present programme such as Octopus Agile, Octopus Go and Go Faster tariff programmes that allow for a fixed rate for a selected period of time and a competitive flat rate for the other times. Industrial customers can utilize the load shifting concept to shift demand from on-peak to the off-peak period, reducing operating costs and eliminating the need for load shedding on the grid.
Incentive-based programmes such as DLC and interruptible/curtailable load are concepts that utilize the load shifting strategy of DSM. It allows system operators to control the operation of some equipment of customers for a payment. DLC is suitable for Nigeria, unlike interruptible/curtailable load which is a contract-based programme that requires longer curtailment duration and longer curtailment notice. One possible concept with the incentive-based programme which can be deployed in Nigeria is to supply industrial and commercial customers during working hours (e.g., 8 am–6 pm) while applying DLC to residential customers to allow them to access a limited amount of capacity. This concept could contribute to more efficient use of existing networks and reduce load shedding. Nigeria’s power utility can adopt the DLC for air conditioners and water heating in the residential sector being the highest load consuming equipment. Furthermore, a smartphone app can also be adopted, e.g., one similar to the Australian mobile app Powershop, where customers will receive notifications to curtail load. Nigeria can implement the UK incentive-based programmes such as STOR in the industrial and commercial sectors to manage demand. Distribution companies can utilize this control strategy to transform the business portfolio to minimize operating costs.
Energy efficiency programmes (e.g., U.S. energy star programme) can provide information that residential consumers can rely on when purchasing energy-efficient products (e.g., air conditioners, light bulbs, washers, dryers, etc). The energy star programme can enable industrial and commercial customers to identify cost-effective approaches to save energy. Nigeria can adopt these energy efficiency programmes. The Nigerian government needs to increase awareness campaigns, and provide incentive support to residential, commercial, and industrial customers (such as training programmes and workshops).
The implementation of DSM programmes in Nigeria would provide benefits such as (i) a reduction in the requirement of generation margin, (ii) improving distribution network efficiency, (iii) a tool for balancing demand and supply, (iv) an additional revenue stream for both power utilities and end-uses (v) allowing for the integration of distributed generation.
Additionally, the prospects of DSM would be greatly encouraged and developed through the following policy recommendations:
- (i)
- Upgrade of infrastructures providing advanced metering, communication, information technology, and control mechanisms.
- (ii)
- Reform of the electricity market structure by allowing and facilitating DSM strategies.
- (iii)
- Establishment of a comprehensive policy and regulatory framework to support all DSM programmes.
- (iv)
- Formulation of incentives to encourage investment in DSM.
- (v)
- Promotion of and enlightenment on the benefit of DSM to consumers.
- (vi)
- Policymakers’ commitment to DSM policies and programmes.
- (vii)
- Evaluating, reviewing and monitoring the DSM programmes and targets after implementation.
8. Conclusions
This study has identified that most research works are centred on consumers in industrialized or developed economies with few studies undertaken on alternative schemes for consumers in developing economies. This work presents an overview of the DSM initiatives in the U.S., Australia, and the UK with the aim to evaluate the potential of utilizing DSM as a solution in addressing the challenge of power in Nigeria’s electricity market. Furthermore, it provided an overview of the development of DSM programmes in developing countries, including India, South Africa, and Nigeria, evaluating the position and status of DSM initiatives in their electricity markets, and recognising the factors that have influenced the slow uptake of DSM in these countries. The comparative analysis of the developed countries has shown significant progress with DSM in the U.S. meeting 10% electricity demand, in the UK with flexibility available from industrial and commercial end-users amounting to 2300 megawatt (MW) and Australia achieving success in different trial projects, exceeding the contracted capacity of 200 megawatts (MW). The study also identified that the uptake of the full exploitation of the potential of DSM has been severely hampered by factors such as (i) some programmes being poorly aligned with the market, (ii) disconnection of policy implementation between operators and regulators, (iii) underrating market complexity, (iv) underestimation of customers behaviour towards DSM programmes, and (v) lack of personnel training to properly operate different DSM programmes. In the Nigerian market, the development of DSM has been relatively slow due to the following key reasons: (i) the slow pace of the transition mechanism from the transitional stage to the medium stage of the market as regulated by NERC, (ii) the lack of adequate infrastructural facilities to support DSM programmes, (iii) inadequate enlightenment on the potential of the role DSM could play in an energy management system, (iv) deficient policy programmes to support the implementation of DSM programmes.
From the review, it is found that a complete, holistic review of the market will allow different programmes such as the application of DLC to residential customers. The concept involves limiting residential appliance use during working hours (e.g., 8 am–6 pm) while supplying industrial and commercial customers the much-needed energy. Another concept of DLC that could work in the market is the provision of a smart thermostat to shift heavy air conditioning loads (heavy load) as well as a smart plugs to remotely control appliances. Utilities could use the smart app concept in the provision of information to the customer to curtail load. Time-of-use programmes such as the UK Octopus Agile, Octopus Go and Go Faster, which provide flexible tariff structure and can help utilities provide a better energy management system. The STOR and fast reserve style system can play a part for industrial and commercial customers with an extra source of power that can supply energy onto the grid. Energy efficiency programmes such as the U.S. energy star can provide a substantial decline in household electricity consumption.
This experience has made clear that DSM evolves according to market needs and it is imperative for Nigeria and developing countries to take advantage of the experiences of developed electricity markets with mature demand management programmes to build a suitable DSM model for their market. The potentials of the DSM programme illustrate the capability of DSM programmes in playing a major role in the energy management of developing countries even when the supply does not meet the demand of the country.
It is important to note that the implementation of the DSM programme in Nigeria will not be the sole solution to address the system’s adequacy challenges. Investment in generation will still be necessary to cover the big deficit in, and increase the reliability of, supply and the percentage of electrification in the country.
With the abundance of renewable energy in the country, it is vital to increase energy generation from those sources. There is also a need to integrate the energy generated from the different renewable energy (microgrid) programmes into the national grid. Particularly, now that there is a clear worldwide trend which established that enhancing electricity demand flexibility increases energy security and system reliability. With the development of clean and reliable microgrids in distribution networks across the country, DSM will play a vital role in the provision of balancing services in the microgrid systems, reducing the operational cost.
Further studies should include an in-depth study of more developed and developing countries. Additionally, a comprehensive study should be conducted to fully utilize potential flexibility to shift/curtail demand within each load category for the residential, commercial, and industrial sectors of Nigeria.
Author Contributions
R.U.: Conceptualization, Methodology, Investigation, Writing—original draft preparation; C.L., P.M., S.W.A., P.H.: Conceptualization, Methodology, Supervision. R.U.: writing—review & editing. All authors have read and agreed to the published version of the manuscript.
Funding
This work is partly supported by Petroleum Technology Development Fund (PTDF), Nigeria, (PTDF/ED/OSS/PHD/RU/1667/19), and the Royal Academy of Engineering, TSP project ‘South Africa energy infrastructure planning for rural urbanisation based on optimal peer-to-peer energy sharing’.
Conflicts of Interest
The authors declare no conflict of interest.
References
- Dada, J.O. Towards understanding the benefits and challenges of Smart/Micro-Grid for electricity supply system in Nigeria. Renew. Sustain. Energy Rev. 2014, 38, 1003–1014. [Google Scholar] [CrossRef]
- Oseni, M.O. An analysis of the power sector performance in Nigeria. Renew. Sustain. Energy Rev. 2011, 15, 4765–4774. [Google Scholar] [CrossRef]
- Usman, R.; Gidado, A. Feasibility Analysis of a Grid Connected Pv/Wind Options for Rural Healthcare Centre Using Homer. Eur. J. Eng. Technol. 2017, 5, 12–20. [Google Scholar]
- Ozturk, I. A literature survey on energy-growth nexus. Energy Policy 2010, 38, 340–349. [Google Scholar] [CrossRef]
- Khan, A.R.; Mahmood, A.; Safdar, A.; Khan, Z.A.; Khan, N.A. Load forecasting, dynamic pricing and DSM in smart grid: A review. Renew. Sustain. Energy Rev. 2016, 54, 1311–1322. [Google Scholar] [CrossRef]
- Wolfram, C.; Shelef, O.; Gertler, P. How Will Energy Demand Develop in the Developing World? J. Econ. Perspect. 2012, 26, 119–138. [Google Scholar] [CrossRef]
- IEA. World Energy Outlook 2015–Analysis–IEA. 2015. Available online: https://www.iea.org/reports/world-energy-outlook-2015 (accessed on 3 May 2021).
- The World Bank. Electric Power Consumption (kWh per Capita)|Data. 2014. Available online: https://data.worldbank.org/indicator/EG.USE.ELEC.KH.PC (accessed on 21 July 2020).
- Sadorsky, P. The impact of financial development on energy consumption in emerging economies. Energy Policy 2010, 38, 2528–2535. [Google Scholar] [CrossRef]
- IEA. World Energy Outlook 2006–Analysis-IEA. 2006. Available online: https://www.iea.org/reports/world-energy-outlook-2006 (accessed on 3 May 2021).
- IPCC. Global Warming of 1.5 °C—2021. Available online: https://www.ipcc.ch/sr15/ (accessed on 3 May 2021).
- U.S. Energy Information Administration. International Energy Outlook 2019; U.S. Energy Information Administration: Washington, DC, USA, 2019.
- IEA. Renewables–World Energy Outlook 2019–Analysis-IEA. 2019. Available online: https://www.iea.org/reports/world-energy-outlook-2019/renewables#abstract (accessed on 3 May 2021).
- Keho, Y. What drives energy consumption in developing countries? The experience of selected African countries. Energy Policy 2016, 91, 233–246. [Google Scholar] [CrossRef]
- Vanegas Cantarero, M.M. Of renewable energy, energy democracy, and sustainable development: A roadmap to accelerate the energy transition in developing countries. Energy Res. Soc. Sci. 2020, 70, 101716. [Google Scholar] [CrossRef]
- Usman, R.; Sigalo, M.B.; Mcdonald, S. Analysis Of the Effect of Flexible Alternating Current Transmission System (Facts) on the Nigerian 330KV Transmission Network Using Eracs and Matlab Simullink. Eur. J. Eng. Technol. 2016, 4, 18–34. Available online: www.idpublications.org/ejet-vol-4-no-3-2016/ (accessed on 3 May 2021).
- Warren, P. A review of demand-side management policy in the UK. Renew. Sustain. Energy Rev. 2014, 29, 941–951. [Google Scholar] [CrossRef]
- Gelazanskas, L.; Gamage, K.A. Demand side management in smart grid: A review and proposals for future direction. Sustain. Cities Soc. 2013, 11, 22–30. [Google Scholar] [CrossRef]
- Behrangrad, M. A review of demand side management business models in the electricity market. Renew. Sustain. Energy Rev. 2015, 47, 270–283. [Google Scholar] [CrossRef]
- Eissa, M. Demand side management program evaluation based on industrial and commercial field data. Energy Policy 2011, 39, 5961–5969. [Google Scholar] [CrossRef]
- Lampropoulos, I.; Kling, W.L.; Ribeiro, P.F.; Berg, J.V.D. History of demand side management and classification of demand response control schemes. In Proceedings of the 2013 IEEE Power & Energy Society General Meeting, Vancouver, BC, Canada, 21–25 July 2013; pp. 31–35. [Google Scholar]
- Strbac, G. Demand side management: Benefits and challenges. Energy Policy 2008, 36, 4419–4426. [Google Scholar] [CrossRef]
- Albadi, M.H.; El-Saadany, E.F. Demand Response in Electricity Markets: An Overview. In Proceedings of the 2007 IEEE power engineering society general meeting, Tampa, FL, USA, 24–28 June 2007; pp. 1–5. [Google Scholar]
- Palensky, P.; Dietrich, D. Demand Side Management: Demand Response, Intelligent Energy Systems, and Smart Loads. IEEE Trans. Ind. Inform. 2011, 7, 381–388. [Google Scholar] [CrossRef]
- Albadi, M.; El-Saadany, E. A summary of demand response in electricity markets. Electr. Power Syst. Res. 2008, 78, 1989–1996. [Google Scholar] [CrossRef]
- EIA. Demand-Side Management Programs Save Energy and Reduce Peak Demand-Today in Energy-U.S. Energy Information Administration (EIA). 2019. Available online: https://www.eia.gov/todayinenergy/detail.php?id=38872 (accessed on 24 August 2020).
- Martinez, V.J.; Rudnick, H. Design of Demand Response programs in emerging countries. In Proceedings of the 2012 IEEE International Conference on Power System Technology, POWERCON 2012, Auckland, New Zealand, 30 October 2012–2 November 2012; pp. 1–6. [Google Scholar]
- Arenawire-Dr. What Is Demand Response?—Australian. Renewable Energy Agency. 2017. Available online: https://arena.gov.au/blog/what-is-demand-response/ (accessed on 7 July 2021).
- Mordor. United States Demand Response Management Systems (DRMS) Market. 2020. Available online: https://www.mordorintelligence.com/industry-reports/united-states-demand-response-market-industry (accessed on 25 August 2020).
- EIA-861. Annual Electric Power Industry Report, Form EIA-861 Detailed Data Files. 2020. Available online: https://www.eia.gov/electricity/data/eia861/ (accessed on 24 August 2020).
- CA. www.ca.gov|California State Portal. 2020. Available online: https://www.ca.gov/ (accessed on 7 September 2020).
- BBC. California Governor Signs Law for Clean Energy by 2045-BBC News. 2018. Available online: https://www.bbc.co.uk/news/world-us-canada-45476865 (accessed on 7 September 2020).
- CAISO-MO. California ISO-Market & Operations. 2020. Available online: http://www.caiso.com/market/Pages/default.aspx (accessed on 7 September 2020).
- Newsom, G. Identifying Effective Demand Response Program Designs for Residential Customer. 2020. Available online: https://innovation.luskin.ucla.edu/wp-content/uploads/2021/01/Identifying-Effective-Demand-Response-Program-Designs-for-Residential-Customers.pdf (accessed on 10 May 2021).
- PJM-MO. PJM-Demand Response 2020. Available online: https://www.pjm.com/markets-and-operations/demand-response.aspx (accessed on 5 September 2020).
- Chamberlin, J. How to Maximize Demand Response Earnings with California’s DRAM Program-CPower Energy Management. 2017. Available online: https://cpowerenergymanagement.com/maximize-demand-response-earnings-californias-dram-program/ (accessed on 9 May 2021).
- CAISO-Renewable. California ISO-Clean, Green Grid. 2021. Available online: http://www.caiso.com/informed/Pages/CleanGrid/default.aspx (accessed on 5 May 2021).
- WSJ. California’s Green Blackouts–WSJ. 2020. Available online: https://www.wsj.com/articles/californias-green-blackouts-11597879215 (accessed on 5 May 2021).
- CAISO-Green. Energy and Environmental Goals Drive Change. 2016. Available online: https://www.energy.ca.gov/programs-and-topics/topics/renewable-energy (accessed on 6 May 2021).
- CEC-Report. CAISO, CPUC, CEC Issue Final Report on Causes of August 2020 Rotating Outages. 2021. Available online: https://www.energy.ca.gov/news/2021-01/caiso-cpuc-cec-issue-final-report-causes-august-2020-rotating-outages (accessed on 8 May 2021).
- John, J.S.T. Energy Hedging: A New Way to Make Demand Response Pay in California?|Greentech Media. 2021. Available online: https://www.greentechmedia.com/articles/read/energy-hedging-a-new-way-to-make-demand-response-pay-in-california (accessed on 9 May 2021).
- AEMO-EM. AEMO|Energy Markets and Systems. 2020. Available online: https://www.aemo.com.au/learn/energy-markets-and-systems (accessed on 9 September 2020).
- Worldometer-Australia. Australia Population (2021)—Worldometer. 2021. Available online: https://www.worldometers.info/world-population/australia-population/ (accessed on 26 May 2021).
- Aemo-Mo. An Introduction to Australia’s National Electricity Market. 2010. Available online: http://www.abc.net.au/mediawatch/transcripts/1234_aemo2.pdf (accessed on 9 September 2020).
- ARENA. Demand Response Trial to Provide 200 Megawatts of Emergency Reserves. 2017. Available online: https://arena.gov.au/news/aemo-arena-demand-response/ (accessed on 12 September 2020).
- Deign, J. As Renewables Surge, Australia Ponders Options for Demand Response Market|Greentech Media. 2020. Available online: https://www.greentechmedia.com/articles/read/australia-ponders-the-shape-of-its-decarbonized-grid (accessed on 12 September 2020).
- AEMC-SM. Spot and Contract Markets|AEMC. 2020. Available online: https://www.aemc.gov.au/energy-system/electricity/electricity-market/spot-and-contract-markets (accessed on 13 September 2020).
- AEMC-LD. How Power Is Dispatched Across the System|AEMC. 2020. Available online: https://www.aemc.gov.au/energy-system/electricity/electricity-market/how-power-dispatched-across-system (accessed on 13 September 2020).
- AEMO-AS. AEMO|Ancillary Services. 2020. Available online: https://www.aemo.com.au/energy-systems/electricity/national-electricity-market-nem/system-operations/ancillary-services (accessed on 9 September 2020).
- AEMC-ES. Electricity|AEMC. 2020. Available online: https://www.aemc.gov.au/energy-system/electricity (accessed on 13 September 2020).
- AEMC-NR. Network Regulation|AEMC. 2020. Available online: https://www.aemc.gov.au/energy-system/electricity/network-regulation (accessed on 13 September 2020).
- Aemo-Drm. Demand Response Mechanism and Ancillary Services Unbundling-High Level Market Design Prepared by: Aemo Final Demand Response Mechanism and Ancillary Services Unbundling-High Level Market Design. 2013. Available online: www.aemo.com.au (accessed on 13 September 2020).
- Aemo-Nem. Guide to Ancillary Services in the National Electricity Market. 2015. Available online: www.aemo.com.au (accessed on 13 September 2020).
- Arenawire. AEMC Rules on Demand Response Wholesale Mechanism-Australian Renewable Energy Agency. 2019. Available online: https://arena.gov.au/blog/aemc-demand-response/ (accessed on 12 September 2020).
- ARENAWIRE-PS. Your Phone Buzzes, a Message Arrives. You’re about to Play a Small Part in a Really Big Shift-Australian Renewable Energy Agency. 2017. Available online: https://arena.gov.au/blog/powershop-demand-response/ (accessed on 12 September 2020).
- ACCC. Final Report|ACCC. 2018. Available online: https://www.accc.gov.au/regulated-infrastructure/energy/retail-electricity-pricing-inquiry-2017-2018/final-report (accessed on 13 September 2020).
- ARENA-Kidston PHES. Kidston Pumped Hydro Energy Storage-Australian Renewable Energy Agency (ARENA). 2021. Available online: https://arena.gov.au/projects/kidston-pumped-hydro-energy-storage/ (accessed on 17 May 2021).
- ARENA-ESCRI. Energy Storage for Commercial Renewable Integration (ESCRI) Phase 2-Australian Renewable Energy Agency (ARENA). 2021. Available online: https://arena.gov.au/projects/energy-storage-for-commercial-renewable-integration-escri-phase-2/ (accessed on 17 May 2021).
- ARENA-Coal PHES. Centennial Pumped Hydro Energy Storage-Australian Renewable Energy Agency (ARENA). 2021. Available online: https://arena.gov.au/projects/centennial-pumped-hydro-energy-storage/ (accessed on 17 May 2021).
- ARENA-Project MATCH. Project MATCH-Australian Renewable Energy Agency (ARENA). 2021. Available online: https://arena.gov.au/projects/project-match/ (accessed on 17 May 2021).
- Lau, E.; Yang, Q.; Stokes, L.; Taylor, G.; Forbes, A.; Clarkson, P.; Wright, P.; Livina, V. Carbon savings in the UK demand side response programmes. Appl. Energy 2015, 159, 478–489. [Google Scholar] [CrossRef]
- Palmer, J.; Cooper, I. United Kingdom housing energy fact file 2013 UK Housing Energy Fact File. Appl. Energy 2013, 159, 478–489. [Google Scholar]
- Centrica. Demand Side Response (DSR)|Centrica Business Solutions. 2020. Available online: https://www.centricabusinesssolutions.com/demand-side-response-dsr?creative=&device=c&keyword=%2Bdemand%2Bside%2Bmanagement&matchtype=b&msclkid=b0e0b4d83ea412da25fdeb87be9f2a97&network=o (accessed on 14 September 2020).
- NGESO-BS. Electricity Balancing Services|National Grid ESO. 2020. Available online: https://www.nationalgrideso.com/industry-information/balancing-services (accessed on 14 September 2020).
- Mirzania, P.; Ford, A.; Andrews, D.; Ofori, G.; Maidment, G. The impact of policy changes: The opportunities of Community Renewable Energy projects in the UK and the barriers they face. Energy Policy 2019, 129, 1282–1296. [Google Scholar] [CrossRef]
- Flexitricity. Home|Flexitricity. 2020. Available online: https://www.flexitricity.com/ (accessed on 15 September 2020).
- Flexitricity-RBH. Royal United Hospital Bath: Revenue with On-Load Testing of Critical Generators-Resources|Flexitricity. 2020. Available online: https://www.flexitricity.com/resources/case-studies/royal-united-hospital-bath-revenue-load-testing-critical-generators/ (accessed on 15 September 2020).
- Flexitricity-Thameswey. Thameswey Provides 6MW of Generating Capacity to Help Support National Grid-Resources|Flexitricity. 2020. Available online: https://www.flexitricity.com/resources/case-studies/thameswey-provides-6mw-generating-capacity-help-support-national-grid/ (accessed on 15 September 2020).
- Centrica-DCC. Council Becomes More Energy Efficient and Saves £44,000 a Year|Centrica Business Solutions. 2020. Available online: https://www.centricabusinesssolutions.com/case-study/council-cuts-energy-use-34 (accessed on 16 September 2020).
- Energy-stats. Home-Energy Stats UK. 2021. Available online: https://www.energy-stats.uk/ (accessed on 22 June 2021).
- Ambrose, J. How Renewable Energy could Power Britain’s Economic Recovery|UK News|The Guardian. 2020. Available online: https://www.theguardian.com/environment/2020/may/19/how-renewable-energy-could-power-britains-economic-recovery (accessed on 17 May 2021).
- DBEI-Battery Storage. Battery Storage Boost to Power Greener Electricity Grid-GOV.UK. 2020. Available online: https://www.gov.uk/government/news/battery-storage-boost-to-power-greener-electricity-grid (accessed on 18 May 2021).
- Smart Energy. Work Starts on UK Cryogenic Energy Storage Project|Renewable Energy World. 2020. Available online: https://www.renewableenergyworld.com/storage/work-starts-on-uk-cryogenic-energy-storage-project/ (accessed on 18 May 2021).
- EIA-India. International-U.S. Energy Information Administration (EIA). 2017. Available online: https://www.eia.gov/international/overview/country/IND (accessed on 28 September 2020).
- MoP-India. Power Sector at a Glance ALL INDIA|Government of India|Ministry of Power. 2020. Available online: https://powermin.nic.in/en/content/power-sector-glance-all-india (accessed on 28 September 2020).
- Mukhopadhyay, S.; Rajput, A.K. Demand side management and load control—An Indian experience. In Proceedings of the IEEE PES General Meeting, Minneapolis, MN, USA, 25–29 July 2010. [Google Scholar] [CrossRef]
- MoP-EE. Overview Of Energy Efficiency. 2020. Available online: https://powermin.nic.in/en/content/overview-2 (accessed on 28 September 2020).
- BEE-S&L. Standards & Labeling|Bureau of Energy Efficiency. 2020. Available online: https://beeindia.gov.in/content/standards-labeling (accessed on 28 September 2020).
- Shaurya Bajaj. India Announces New Energy Conservation Building Code for Residential Buildings-Mercom India. 2018. Available online: https://mercomindia.com/india-energy-conservation-building-code-residential/ (accessed on 28 September 2020).
- BEE-Capacity DISCOMs. Capacity Building of DISCOMs|Bureau of Energy Efficiency. 2020. Available online: https://beeindia.gov.in/content/capacity-building-discoms (accessed on 29 September 2020).
- BEE-Municipal. Municipal DSM|Bureau of Energy Efficiency. 2020. Available online: https://beeindia.gov.in/content/municipal-dsm (accessed on 28 September 2020).
- BEE-AgDSM. Agriculture DSM|Bureau of Energy Efficiency. 2020. Available online: https://www.beeindia.gov.in/content/agriculture-dsm-0 (accessed on 28 September 2020).
- BEE-SME. Energy Efficiency in SMEs|Bureau of Energy Efficiency. 2020. Available online: https://www.beeindia.gov.in/content/energy-efficiency-smes (accessed on 29 September 2020).
- CTI. Electricity Demand Side Management (DSM) in India-A Strategic and Policy Perspective Overview. 2020. [Google Scholar]
- Harish, V.S.K.V.; Kumar, A. Demand side management in India: Action plan, policies and regulations. Renew. Sustain. Energy Rev. 2014, 33, 613–624. [Google Scholar] [CrossRef]
- Kumar, J.C.R.; Majid, M.A. Renewable energy for sustainable development in India: Current status, future prospects, challenges, employment, and investment opportunities. Energy Sustain. Soc. 2020, 10, 1–36. [Google Scholar] [CrossRef]
- Shekhar, J.; Suri, D.; Somani, P.; Lee, S.J.; Arora, M. Reduced renewable energy stability in India following COVID-19: Insights and key policy recommendations. Renew. Sustain. Energy Rev. 2021, 144, 111015. [Google Scholar] [CrossRef]
- Samuel, J. Can Battery Storage Propel India’s Energy Transition?—The Wire Science. 2020. Available online: https://science.thewire.in/economy/energy/can-battery-storage-propel-indias-energy-transition/ (accessed on 19 May 2021).
- Eberhard, A. Competition and Regulation in the Electricity Supply Industry in South Africa a Paper by A/Prof. 2000. Available online: https://www.gsb.uct.ac.za/files/Electricity_competion_in_SA-Eberhardt.pdf. (accessed on 26 May 2021).
- Mirzania, P.; Balta-Ozkan, N.; Marais, L. One technology, two pathways? Strategic Niche Management and the diverging diffusion of concentrated solar power in South Africa and the United States. Energy Res. Soc. Sci. 2020, 69, 101729. [Google Scholar] [CrossRef]
- Wo, A. South Africa Population (2021)-Worldometer. 2021. Available online: https://www.worldometers.info/world-population/south-africa-population/ (accessed on 26 May 2021).
- Thomson Reuters. Electricity Regulation in South Africa: Overview Q&A|Practical Law. 2020. Available online: https://uk.practicallaw.thomsonreuters.com/w-018-5347?contextData=(sc.Default)&transitionType=Dfault&firstPage=true#co_anchor_a502112 (accessed on 22 September 2020).
- Monyei, C.G.; Adewumi, A.O. Demand Side Management potentials for mitigating energy poverty in South Africa. Energy Policy 2017, 111, 298–311. [Google Scholar] [CrossRef]
- Minnaar, U.; Visser, W.; Crafford, J. An economic model for the cost of electricity service interruption in South Africa. Util. Policy 2017, 48, 41–50. [Google Scholar] [CrossRef]
- ESMAP. Implementing Energy Efficiency and Demand Side Management South Africa’s Standard Offer Model Low Carbon Growth Study Program Mitigating Climate Change through Development 2011. Available online: https://www.esmap.org/sites/esmap.org/files/ESMAP_StandardOffer_SouthAfrica_WebFinal.pdf (accessed on 22 September 2020).
- ESKOM-IDM. Eskom Integrated Demand Management Annual Report for the Financial Year 2013/14. 2014. Available online: overendstudio.co.za/online_reports/eskom_ar2014/abt-esk-eskom.php (accessed on 23 September 2020).
- Eskom-DR. Demand Response. 2020. Available online: https://www.eskom.co.za/sites/idm/ManageYourConsumption/Pages/DemandResponse.aspx (accessed on 22 September 2020).
- Vaughan Smith. System Operator Ancillary Services Technical Requirements for.2022/23–2026/27 2017. Available online: https://www.eskom.co.za/wp-content/uploads/2022/04/Ancillary-Services-Technical-Requirements-2022_23-to-2026_27.pdf. (accessed on 22 September 2020).
- DOE-Sa. Policy to Support the Energy Efficiency and Demand Side Management Program for the Electricity Sector through the Standard Offer Incentive Scheme. 2010. Available online: http://www.energy.gov.za/files/policies/Standard_Offer_Policy.pdf. (accessed on 27 September 2020).
- Skinner, T. An Overview of Energy Efficiency and Demand Side Management in South Africa. 2012. Available online: www.energy.gov.za/files/policies/Energy_Efficiency_and_Demand_Side_Management_Policy.pdf (accessed on 25 September 2020).
- DOME-Sa. Capacity Building in Energy Efficiency & Renewable Energy Agreements & Financing Volume 3: AGREEMENTS & FINANCING. 2005. Available online: ww.energy.gov.za/EEE/Projects/Energy%20Efficiency%20%20Roll-out%20of%20%20Energy%20Management%20in%20%20National%20Government%20Buidlings/Report%203%20Agreements%20and%20Financing%20final.pdf. (accessed on 25 September 2020).
- DOME-SaSP. Energy Efficiency Strategy of the Republic of South Africa. 2005. Available online: https://www.gov.za/documents/national-energy-efficiency-strategy-republic-south-africa (accessed on 30 September 2020).
- Eskom. Residential Mass Roll-Out Technical Approval Process, Technical Specification And Installation Guideline. 2011. Available online: https://www.karebo.co.za/featured_item/residential-mass-rollout/ (accessed on 27 September 2020).
- ESI-Africa. Electricity Costs: South Africa’s Double-Edged Energy Sword. 2020. Available online: https://www.esi-africa.com/industry-sectors/future-energy/electricity-costs-south-africas-double-edged-energy-sword/ (accessed on 27 September 2020).
- Colthorpe, A. South Africa makes Huge Distributed Energy Storage Commitment|Energy Storage News. 2018. Available online: https://www.energy-storage.news/news/south-africa-makes-huge-distributed-energy-storage-commitment (accessed on 20 May 2021).
- Market Research. Renewable Energy in South Africa|Market Research Reports® Inc. 2021. Available online: https://www.marketresearchreports.com/marketline/renewable-energy-south-africa (accessed on 20 May 2021).
- Walwyn, D.R.; Brent, A.C. Renewable energy gathers steam in South Africa. In Renewable and Sustainable Energy Reviews; Elsevier Ltd.: Amsterdam, The Netherlands, 2015; Volume 41, pp. 390–400. [Google Scholar] [CrossRef]
- ESI- Africa. Energy Storage Is Key to the Future of Power|ESI-Africa.com. 2019. Available online: https://www.esi-africa.com/industry-sectors/renewable-energy/energy-storage-is-key-to-the-future-of-power/ (accessed on 20 May 2021).
- Caboz, J. SA to Get a New Kind of Power Plant, Which Combines Wind, Solar and Batteries. 2021. Available online: https://www.businessinsider.co.za/oya-energy-hybrid-facility-renewable-hybrid-project-could-bring-128mw-by-august-2022-rmippp-2021-3 (accessed on 19 May 2021).
- WPR. Nigeria Population 2020 (Demographics, Maps, Graphs). 2020. Available online: https://worldpopulationreview.com/countries/nigeria-population/ (accessed on 5 July 2020).
- Energypedia. Nigeria Energy Situation-Energypedia.info. 2019. Available online: https://energypedia.info/wiki/Nigeria_Energy_Situation (accessed on 5 July 2020).
- Olaoye, T.; Ajilore, T.; Akinluwade, K.; Omole, F.; Adetunji, A. Cite This Article: Tunde Olaoye, Titilayo Ajilore, Kunle Akinluwade, Femi Omole, and Adelana Adetunji. Am. J. Electr. Electron. Eng. 2016, 4, 1–8. [Google Scholar] [CrossRef]
- NESO. The Nigeria Electricity System Operator. 2020. Available online: https://www.nsong.org/AboutUs/History (accessed on 6 July 2020).
- NESI. “Generation”. 2020. Available online: https://nerc.gov.ng/index.php/home/nesi/403-generation (accessed on 4 December 2020).
- Global Petrol Price. Nigeria: Energy Mix for Electricity Generation|GlobalPetrolPrices.com. 2020. Available online: https://www.globalpetrolprices.com/energy_mix.php?countryId=90 (accessed on 15 December 2020).
- NERC. Nigerian Electricity Market. 2020. Available online: https://nerc.gov.ng/index.php/home/operators/ltmr/405-nigerian-electricity-market (accessed on 30 September 2020).
- Oseni, M. Third Quarter 2018 Nerc Quarterly Reports 2 [Nigerian Electricity Regulatory Commission]. 2018. Available online: https://nerc.gov.ng/ (accessed on 6 July 2020).
- Sambo, A.S.; Garba, B.; Zarma, I.H.; Gaji, M.M. Electricity Generation and the Present Challenges in the Nigerian Power Sector. In Proceedings of the Conference: 21st World Energy Congress (WEC) 2010, Montreal, QC, Canada, 12–16 September 2010; pp. 1–7. [Google Scholar]
- Arowolo, W.; Perez, Y. Market reform in the Nigeria power sector: A review of the issues and potential solutions. Energy Policy 2020, 144, 111580. [Google Scholar] [CrossRef]
- Siemens. Siemens and Nigerian Government Signed Implementation Agreement for Electrification Roadmap|Press|Company|Siemens. 2019. Available online: https://press.siemens.com/global/en/pressrelease/siemens-and-nigerian-government-signed-implementation-agreement-electrification (accessed on 6 July 2020).
- Omonfoman, O. Analyzing the Siemens Electricity Roadmap Proposal-Businessday NG. 2019. Available online: https://businessday.ng/opinion/article/analyzing-the-siemens-electricity-roadmap-proposal/ (accessed on 6 July 2020).
- Energy Commission of Nigeria. Energy Commission of Nigeria Federal Ministry of Science and Technology Federal Republic of Nigeria National Energy Policy Energy Commission of Nigeria 2018 Energy Commission of Nigeria Plot 701c Central Business District. 2018. Available online: https://www.energy.gov.ng (accessed on 16 August 2020).
- Abdussalam, Y. Energy Efficiency in Nigeria: Planning and Goals. 2014. Available online: https://nerc.gov.ng/nercdocs/NERC-Regulation-for-IEDN-2012.pdf. (accessed on 16 August 2020).
- Chinedum; Ukabiala, O. The Potential for Demand Side Management (DSM) in Nigeria. 2014. Available online: https://pubs.naruc.org/pub.cfm?id=538F558F-2354-D714-5114-2C8B5EFA57AF (accessed on 4 October 2020).
- NERC-MAP. MAP Regulations will Fast-Track Closure of Metering Gap. 2018. Available online: https://nerc.gov.ng/index.php/media-library/press-releases/551-map-regulations-will-fast-track-closure-of-metering-gap (accessed on 4 October 2020).
- The Sun. Bridging Metering Gap with MAP–The Sun Nigeria. 2019. Available online: https://www.sunnewsonline.com/bridging-metering-gap-with-map/ (accessed on 4 October 2020).
- Leadership. Strengthening Local Meter Manufacturing. 2020. Available online: https://leadership.ng/2020/09/06/strengthening-local-meter-manufacturing/ (accessed on 4 October 2020).
- Sweet Crude. Power: How Nigeria Can Solve Metering Challenges-EMMAN-SweetCrudeReports. 2020. Available online: https://sweetcrudereports.com/power-how-nigeria-can-solve-metering-challenges-emman/ (accessed on 4 October 2020).
- Nacop. The Federal Republic of Nigeria National Energy Efficiency Action Plans (Neeap) Inter-Ministerial Committee on Renewable Energy and Energy Efficiency (ICREEE). 2015. Available online: https://rise.esmap.org/data/files/library/nigeria/Energy%20Efficiency/EE%201.1%20National%20Energy%20Efficiency%20Action%20Plan%20NEEAP%202015-2030%20APPROVED.pdf (accessed on 4 October 2020).
- Ikpe, E.; Torriti, J. A means to an industrialisation end? Demand Side Management in Nigeria. Energy Policy 2018, 115, 207–215. [Google Scholar] [CrossRef]
- Aliyu, A.S.; Dada, J.O.; Adam, I.K. Current status and future prospects of renewable energy in Nigeria. Renew. Sustain. Energy Rev. 2015, 48, 336–346. [Google Scholar] [CrossRef]
- IEA-Renewable. Nigeria Renewable Energy Master Plan–Policies-IEA. 2013. Available online: https://www.iea.org/policies/4974-nigeria-renewable-energy-master-plan (accessed on 20 May 2021).
- REA-Solar Naija. Solar Power Naija–Enabling 5Million New Connections–Nigeria Electrification Programme. 2021. Available online: https://nep.rea.gov.ng/federal-governments-5milion-solar-connections-program/ (accessed on 20 May 2021).
- REA-EEI. About Energizing Economies Initiative–Energizing Economies Initiatives. 2021. Available online: https://eei.rea.gov.ng/about-eei/ (accessed on 22 May 2021).
- REA-EEP. About EEP–Energizing Education Programme. 2021. Available online: https://eep.rea.gov.ng/about-eep/ (accessed on 22 May 2021).
- Cousins, J.T. Using Time of Use (Tou) Tariffs In Industrial, Commercial and Residential Applications Effectively. 2020. Available online: https://www.researchgate.net/publication/242244552_Using_Time_Of_Use_Tou_Tariffs_In_Industrial_Commercial_And_Residential_Applications_Effectively (accessed on 10 October 2020).
- Eskom, T. Tariffs and Charges. 2020. Available online: https://www.eskom.co.za/CustomerCare/TariffsAndCharges/Pages/Tariffs_And_Charges.aspx (accessed on 19 October 2020).
- EE. Energy Efficiency Impact Report–Why Energy Efficiency Matters 2020. Available online: https://energyefficiencyimpact.org/ (accessed on 6 October 2020).


Publisher’s Note: MDPI stays neutral with regard to jurisdictional claims in published maps and institutional affiliations. |
© 2022 by the authors. Licensee MDPI, Basel, Switzerland. This article is an open access article distributed under the terms and conditions of the Creative Commons Attribution (CC BY) license (https://creativecommons.org/licenses/by/4.0/).