1. Introduction and Literature Review
The 2019 coronavirus disease (COVID-19) outbreak was declared a global pandemic on 11 March 2020, by the World Health Organization [
1]. Since then, the entire world has faced major repercussions from which people continue to recover and adapt. In addition to public health, several other aspects of human life were affected. These included economic, social, environmental, and political aspects. Due to these combined factors, there were significant ramifications for home life, office life, leisure, global supply chain, etc. Certain areas, such as online retail, saw a huge spike in growth and traffic [
2]. Certain other areas, such as hospitality and leisure, saw a huge dip [
3]. Generally speaking, several countries followed national and international health guidelines and enacted “stay-at-home” orders (SAHOs) or “lockdown” on top of other containment measures. Several businesses, specifically in the service (tertiary) sector, moved to partial or fully online operation. In-person or physical operations were limited to essential employees and sectors. As mentioned, sectors such as entertainment, hospitality, leisure, sports, travel, etc. saw near-zero operation.
Towards the beginning of Summer 2020, several countries gradually started relaxing lockdown measures [
4]. While people were coping with the new realities of COVID-19, the second wave of infections started proliferating in several countries. Of course, as the data [
5,
6] and studies like [
4] show, different countries experienced successive waves of the pandemic at different times. In the United States (US), the second wave was from the end of June to the beginning of September. The third wave started towards the middle of October and peaked by the end of 2020. As a result, the death toll continued to rise, and economic disruptions continued to worsen despite government efforts to ameliorate the worst effects.
Expectedly, this drastic change in daily life had a significant impact on a multitude of socioeconomic indicators such as life expectancy, gross domestic product (GDP), commuter miles traveled, energy consumption, Internet use, consumer spending patterns, etc. Several studies over the past couple of years have attempted to quantify and record these unprecedented changes. The International Energy Agency published a comprehensive report indicating that there was a decrease in electricity consumption in several countries and regions such as the European Union, the US, China, and India [
7]. In Italy, pandemic restrictions and unemployment exacerbated the poverty situation for over half a million families. Out-of-home food consumption fell by 64% in the second quarter of 2020. Food exports and imports both fell [
8]. As for the global cruise tourism industry, the top three lines that account for about three-quarters of the global cruise market saw revenues drop by 59% in 2020 relative to 2019. Similarly, jobs supported by this industry were reduced by about 50.6% (590,000 jobs) [
9]. In India, as a result of the 2020 lockdown and pandemic disruptions and pressure on the healthcare system, the overall mortality was about 22% higher than the same period the previous year. The hospitalization rate also increased. Females and socioeconomically disadvantaged groups faced worse outcomes in critical, life-saving, non-COVID health services [
10]. One of the positive changes in 2020 relative to 2019 was a reduction in atmospheric pollutants in several countries, precipitated predominantly via a reduction in the use of fossil fuels [
11].
Similarly, energy resources saw a significant change in 2020 relative to 2019. Energy production and consumption are of particular importance for a number of reasons. Energy production is by far the largest producer of greenhouse gases, which are responsible for the current climate crisis [
12]. Ironically, the ability of a civilization to harness energy is considered a direct measure of its technological progress [
13]. Today, the richest and most developed or rapidly developing countries use the most energy per capita. Every sector of modern economies is heavily dependent on energy. The authors in [
14] list a number of studies that conclude that energy consumption correlates positively with economic growth.
While it is still early days in the COVID pandemic, several studies have attempted to understand the energy trends during the past couple of years. In [
15], the general trend of a decrease in overall electricity demand for several countries most affected by COVID was studied. These included France, Germany, Italy, India, the United Kingdom (UK), and the US. It was found that, during the general lockdown period from March 2020 to June 2020, the decrease in electricity ranged from 15% to 28%. A similar reduction in electricity consumption was noted by [
16] in India (23%), Spain (18%), Germany (12%), the US (5%), etc. Further, it was noted that changes in the load profiles and composition posed challenges for operators. In [
17], the investigators examined the influence of pandemic waves on the business cycle by studying energy consumption in 28 European countries. They found that no country’s energy consumption was immune to the pandemic’s influence and that the business cycle shifted in response to reducing restrictions and non-pharmaceutical interventions. Several studies that focus on individual countries offer insight into the unique circumstances in those countries that will undoubtedly offer guidance for future scenarios. In Sharjah [
18], one of the seven emirates of the United Arab Emirates (UAE), it was found that the overall variation in power demand in 2020 was only 1.04% relative to 2016–2019. Sectors such as residential and government increased, whereas commercial, industrial, and agricultural all decreased. Of all the countries examined in [
18], Sharjah was found to have the lowest change. One explanation forwarded was the huge fraction of the expatriate population in the UAE, about 90%. With lockdowns forcing most of this demographic to remain at home during the early part of the hot season, the residential sector saw a 5.44% increase. In Romania, the negative impact of reduced activity on electricity consumption and GDP in the first half of 2020 was noted [
19]. For each percentage point increase/decrease in electricity consumption, the national GDP was found to increase/decrease by 1.2%.
Price fluctuations are also important considerations. The authors in [
20] found that both crude oil and natural gas prices were affected by the pandemic in Japan and the US, but to different extents. In the US, oil prices were negatively impacted, whereas gas prices were positively affected. In Japan, oil prices only experienced a short-run shock, and gas prices were largely unaffected. This was explained by looking at the hundred-fold difference in case counts between the two countries. Further, Japan did not have any severe lockdown measures, with only about 27% of surveyed employers asking employees to work from home. Focusing a bit more on the US, [
21] looked at the energy trends in Los Angeles, California, the second-largest city and combined statistical area after New York City. Los Angeles, like the majority of the US, receives its residential heating predominantly from natural gas. Stay-at-home orders were found to have a minimal impact on natural gas consumption. However, an overall 5.1% increase in total residential energy for non-temperature-sensitive loads during the pandemic period relative to the 2018–2019 baseline was found. The Alabama Power Smart Neighborhood has energy-efficient smart devices with around 40 advanced metering data points. Analysis of pre- and post-pandemic data showed that smart devices were effective in managing residential energy consumption compared to traditional homes during lockdown periods. While overall energy use was found to be higher, the peak load in 2020 was not as sharp as in 2019. Further, it was shifted from the evening to earlier in the day. This was explained by people spreading out tasks like cooking and other household chores to the entire day during the lockdown. Weekend patterns were found to be similar to the pre-pandemic levels [
22].
These recent studies serve to confirm the hypothesis that the COVID pandemic had a significant impact on human life, including energy consumption. However, these effects varied by region and over the course of the pandemic. In many cases, the effects went against expert predictions or expectations. All these observations demonstrate why it is important to study the pandemic’s effects: to prepare for the future and create a more resilient society. This study focuses on energy consumption in the US during the early stages of the COVID-19 pandemic in 2020. While there are many studies analyzing pandemic energy trends, there is a dearth of studies looking at the US as a whole. This work attempts to bridge that gap. Energy consumption by the country and by individual states was analyzed. The pandemic’s effect on energy prices, sectors, sources, renewable generation, etc. was examined. Related quantities like GDP and pollution have also been presented. Existing work tends to focus heavily on electricity. Here, electricity is considered individually so future studies can draw from this work. However, non-electricity (e.g., transportation) uses are given due attention. The main contributions of this work are:
- -
Comprehensively summarizing US energy consumption for 2020, including providing sector-wise and state-wise breakdowns using aggregate data processed from multiple sources.
- -
Quantifying COVID-19 impacts on US energy consumption.
- -
Quantifying the influence of change in energy consumption on greenhouse gas emissions and energy expenditure.
Section 2 presents the methodology and data sources.
Section 3 presents the results organized by data source. A robust discussion and analysis of the results are also included. Finally,
Section 4 provides some salient conclusions and scope for future work.
3. Results
Human beings are infinitely adaptable and innovative organisms. The COVID pandemic posed unique challenges to several aspects of human life. The most significant one was the human cost.
Figure 1 shows the case count and deaths per 100,000 people for each US state as of December 2021. It also shows the population density according to the 2020 census by state in
Figure 1c. For acceptable color contrast, all states above 300/km
2 are shown as red. The highest population density is Washington, DC (4361/km
2). The US has a very non-uniform distribution of people. The eastern corridor is home to the oldest and densest cities. The southernmost ‘Sun Belt’ states are also densely populated and rapidly growing. The west coast is also densely populated. The center or heartland, predominantly agricultural as well as home to some arid and rugged terrain (e.g., Rockies), is very sparsely populated. Looking at
Figure 1a tells a different story. The normalized case count is highest in some of the most sparsely populated states, like Alaska and North Dakota. The death toll tells a grimmer story. Most of the states had a death rate on the high end of the scale. Only nine states (including Washington, DC) were below 200 deaths/100,000, whereas 32 were above 300. The US total death rate was almost twice that of Germany and about eight times that of India [
25]. It is difficult to infer a strong mathematical or geographical pattern in the death rate other than to observe that it is very poorly correlated with initial population distribution and case count. This certainly defies expectations.
The next step was to determine what was the response to the challenges of the pandemic and its effects on human life.
Figure 2 shows the change in energy consumption between 2018 and 2019 and 2019 and 2020 for 10 countries, combining 51% of the global population. It also juxtaposes this with the total deaths in 2020. In general, most countries increased their energy consumption in 2019, except for the most developed economies of Germany, Japan, and the US. In 2020, however, most countries saw a reduction in energy consumption. The exceptions are China and Iran, which saw a slight increase of 0.47%, but about 10 times lower than the previous year. The drop was about 7.5% for the US. It is difficult to draw any correlation between the change in energy and the COVID deaths. However, what is clear is that, even when placed against some of the largest countries in the world in terms of population, the US clearly stands out in its death toll. This has been attributed mainly to widespread refusal to adopt safety measures like masks and vaccinations, but also the high obesity rate and aging population, two demographics that are considered vulnerable.
Diving deeper into the data for the US,
Figure 3 shows the historical population of the country from 1950 to 2021. It also shows the total energy consumption in terawatt-hours. Note that the listed sources have detailed methodologies about data collection and source estimates. These have been elided here for the sake of brevity. The population grew continuously, but at a gradually decreasing rate. This is because live births have fallen below the replacement level, but healthy immigration numbers drive growth. As the country continued to industrialize after World War II, energy consumption doubled within 20 years. Since then, it has increased by less than 50%, mostly leveling off from 2010 to 2020. As noted previously, the 2020 COVID drop of 7.5% is the steepest drop in at least 70 years. The only comparable drop was during the Great Recession of 2008. In 2009, the drop was 4.9%. The 2020 drop was followed by an increase of 4.7% in 2021, but the overall levels were still below the 2018 peaks. For
Figure 3, there is a +0.94 correlation between the population and energy consumption, so the 2020 drop is very noteworthy and indicative of a nationwide change. The cause for this change is the COVID pandemic.
The year 2020 had distinct phases in the US. The first couple of months were largely unaffected. Between 1 March and 6 April, 42 states and territories issued stay-at-home orders (SAHO) [
29]. By early June, most of these orders had been relaxed or completely rescinded as the first wave died down. The rest of the year saw two more waves in September and leading into 2021.
Figure 4 gives a snapshot of relevant statistics leading up to the pandemic, starting in 2018, and ending in December 2021. The lockdown period is highlighted in both plots. Note that no official SAHOs were issued for subsequent waves, so no further lockdown periods appear on either plot.
Figure 4a gives more detail on the energy trends: the seasonal variation in energy consumption is clear from year to year. During the 2020 lockdown, there was a steep 30% drop in energy consumption as large parts of the country shut down. Interestingly, the population numbers also flatline during 2020. Besides using the SAHO dates to define the lockdown period,
Figure 4b provides temporal data for the heat map in
Figure 1. The first three waves, all in 2020, are clearly visible in the case count and the total deaths. The end of the first wave coincides perfectly with the final SAHOs being relaxed or rescinded. For the rest of the year, economic activity largely resumed with distancing, masking, and increased sanitization. The end of the year saw the first public vaccines administered.
Figure 5 shows the state-wise total energy consumption for the US in 2019 and 2020. Total energy and per capita energy are shown due to the wide variation in population distribution and consumption trends. The difference between 2019 and 2020 is reflected in the color bar for both years. Individually, the total energy use roughly scales with the population. Texas, despite having about 25% less population than California, uses almost twice as much energy. This is seen clearly in the per capita maps. While the distribution of consumption did not significantly vary from 2019 to 2020, it did reduce for most of the country. From state to state, there is a wide variation. Tropical states like Florida and Hawaii are on the lower end of the energy use spectrum, while Louisiana is on the higher end. North Dakota was the highest, edging out Alaska. The ratio of highest to lowest per capita consumption is over 5:1. Generally, the eastern and western portions that are more densely populated tend to be more energy efficient. The mostly rural middle of the country tends to consume more energy per capita. The COVID pandemic did not significantly alter this consumption pattern.
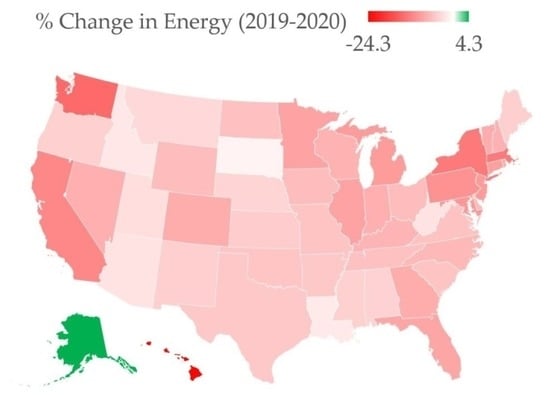
Figure 6 gives a summary of the percent change in the per capita energy consumption by state between 2019 and 2020, sorted from highest to lowest. The biggest change was for Hawaii, whose economy derives about a fifth of its GDP from tourism. This was one of the sectors that were hit the worst by the pandemic. Hawaii is isolated from the rest of the country or any other land mass, and so about 37% of its energy use comes from jet fuel. This was almost halved in 2020, contributing to the 26.4% drop in total energy. The seven states that had no statewide SAHO are marked with ‘**’ in
Figure 6. Note that in the US, there were various levels of lockdowns announced by each state with no Federal mandate ever announced. These ranged from ‘mandatory for all’ to ‘mandatory for certain counties’ to ‘mandatory for persons at increased risk in certain counties’. Certain states, such as New Mexico and Texas, only issued advisory orders. The population-weighted average change for these states with SAHOs was −5.7%. For the rest of the US, it was −9.1%. All seven states are in the middle of the country, where the case count and death tolls were particularly high. The explanation is that residents in these states were less likely to follow lockdown protocols and continued with life as usual, leading to high death rates and a lower drop in energy consumption. States like New York, New Jersey, Pennsylvania, and California, which were some of the earliest to issue SAHOs, appear on the lower end of the energy drop. This implies that lockdown protocols were more likely to be followed, leading to a greater drop in energy consumption. The only state that saw an increase in energy consumption, 4%, was Alaska, whose SAHO lasted less than a month.
The effect of lockdowns on the decrease in GDP was examined next, as shown in
Figure 7. For context, the US saw a 4.1% growth in GDP from 2018 to 2019. From 2019 to 2020, however, there was a 2.2% decline [
31]. When comparing the decrease in energy with the decrease in GDP for each state, there is a +0.45 correlation. Comparing GDP with the normalized case count gives a +0.28 correlation, whereas GDP and normalized death rate give a +0.37 correlation. Thus, while there is a weak correlation between the health toll of the pandemic and the GDP, there is a stronger correlation between the energy drop and the GDP.
Figure 7a shows that the majority of the US states experienced healthy GDP growth. In 2020, however, due to the pandemic, all but two states experienced a decrease. The exceptions were South Dakota and Utah, but the growth was about 0.1% for each. Neither state had SAHOs. Nebraska saw a 0.5% decrease and also did not have a SAHO. Once again, Hawaii experienced the maximum decrease, 10.8%. Another state heavily reliant on tourism and gambling revenue, Nevada, saw a decrease of 7.2%. Despite the increase in energy, Alaska saw a 6% decrease in GDP.
Figure 8 shows the breakdown of total energy for each state in 2020. It gives sector-wise insight into data from
Figure 5. Gulf Coast states like Alabama, Louisiana, Mississippi, and Texas, which have huge petroleum and ancillary industries, had the industrial sector as the largest consumer of energy. Pennsylvania is another heavily industrial state. Transportation is the majority in states like California and Florida. The commercial and residential sectors tend to be in the minority nationwide. When this bar graph is compared with the map in
Figure 9, some patterns emerge. This figure shows the change in sector energy consumption by state in 2020 relative to 2019. Note that the color white represents no change for each map.
In the commercial sector, besides Alaska and Texas experiencing a slight increase, each state saw a decrease, as high as −15.6%. The lockdown and reduced foot traffic at millions of businesses across the nation explain this. The industrial sector appears to have been least affected. While some states saw drops as high as −15.7%, several states had an increase. This is particularly true in the middle portion of the country, including states that had no SAHO. While certain businesses completely shut down, others such as home improvement, online retail, home delivery, pandemic-related safety supplies, etc. exploded. The Great Plains dominate the geography of the middle of the country. Given the sparse population and rural landscape, the increase in energy consumption is understandable in these areas. The residential and transportation sectors are perhaps the most interesting. With monthslong lockdowns in place, several sectors of the economy switched to remote work. This continued in 2021 and 2022 with some businesses still allowing employees to work in a hybrid modality: in the office or at home. Given the car-centric, suburban city layouts in the US coupled with the fact that over 80% of the US is urban, most of the states saw a decrease in transportation energy when people stopped commuting. This, however, did not result in an increase in residential energy consumption in most states. Only seven states saw an increase, and all of these were southern states where the climate tends to be hot and dry. The exception was Alaska. Its almost 12% increase in residential energy consumption can be attributed to the winter of 2020 being colder than 2019. Note that winter conditions can vary drastically in various parts of the US, and since Alaska is located to the far northwest, it can experience significantly different conditions from the rest of the mainland. As for the states that had no SAHO, there is a +0.44 correlation between the decrease in residential energy and case count. This is a medium positive correlation, but it does suggest that as the case count increased, the residential energy tended to decrease. The following is a very plausible explanation. US hospitals were overflowing despite added capacity during the subsequent waves of the pandemic. If thousands of people were spending several days in the hospital, then they were not spending that time at home. For the country as a whole, the correlation between residential energy change and case count was lower, +0.24.
Figure 10 shows the change in 2020 electricity consumption for each state by sector. The commercial section (
Figure 10b) saw a decrease in virtually every state, precipitated by the closures of most businesses. States like Nevada and Texas saw an increase, but no more than 2.5%. The industrial sector was more mixed. As mentioned previously, several industries were required to remain open and support critical societal needs like food and energy. Certain manufacturers were asked to produce pandemic safety supplies under the Defense Production Act of 1950 by order of the President of the US. The population-weighted commercial energy drop was 5.6%, whereas the industrial drop was only 3.8%. For the states without SAHOs, these were −5.3% and +1.2%, respectively. The trend is similar to the nation, with a large drop in commercial but an increase in industrial. It is interesting to note that these seven states collectively saw a rise in industrial electricity consumption while the country as a whole saw a significant decrease.
In the US, electric vehicle adoption is still lacking, especially away from the coasts.
Figure 10d shows the change in transportation electricity consumption and several states are at zero. The Department of Energy’s database records a zero if the data are measured as zero or (s) if below a certain minimum threshold, 0.5 GWh. For the sake of plotting, both entries were treated as zero in this study. For states with data, several saw drops of over 10%. This is to be expected from the reduced travel caused by lockdowns. The most interesting sector is perhaps the residential sector, shown in
Figure 10a. Southern states like Arizona and Nevada saw rises of 11.5% and 11.4%, respectively. This provides further evidence that lockdowns caused an overall 2.6% increase in residential energy consumption. However, this was not uniform, as states like Arkansas and Mississippi recorded drops in residential electricity consumption. The largest drop was in Arkansas at −4.1%. Once again, the states without SAHOs saw a much smaller increase in residential electricity, 1.4%. This supports the idea that without lockdown protocols, people did not spend as much time at home as in the states with SAHOs. A low value of 1.4% could be attributed to the natural increase in energy consumption over time. One thing to note is that the residential electricity consumption is not the same as the total residential energy consumption. There is a +0.93 correlation between the two. While several states derive more than 50% of their residential heating from electricity, natural gas and propane are also very popular. Distillate fuel (e.g., diesel, heating oil) and wood are less common but still used. The overall electricity trend in the US is similar to European countries. It was found that countries like the UK, Spain, and Italy with strict lockdowns saw a larger decrease in weekday consumption than those with less restrictive measures like the Netherlands and Sweden [
32].
Figure 11 shows the historic energy consumption for the entire US by fossil fuel type. All fossil fuels are grouped into one of three categories: coal, petroleum, and natural gas. Each point represents a month between January 2010 and December 2021. Source data provide detailed methodology on heat capacity values and conversions between various fuel subtypes as well as missing or anomalous data.
Figure 11a shows coal consumption in short tons (1 short ton = 0.907 metric tons). The seasonal cycle is clear, but the plot also reveals the downward trend in coal over the past 12 years. The peak value was in August 2010, and the bottom was in April 2020, about 73% lower than the peak. After the lockdown, there was a slight increase in coal consumption. The peak in 2021 was 12% higher than in 2020. It remains to be seen whether this will continue.
Figure 11b shows the petroleum consumption in barrels per day (1 barrel = 158.987 L). The seasonal variation in
Figure 11b can be seen, but it is not as drastic as coal. Peak consumption happens over the summer and during the holiday season towards the end of the year. Overall, there is a slight increase in consumption starting from 2010. This was because the US gradually recovered from the Great Recession. While vehicles became more efficient, consumers switched from sedans to sports utility vehicles and pickup trucks to such an extent that they account for over 50% of new vehicle sales in the latter years of the 2010s. The peak before the lockdown was in August 2018 and is about 18% higher than the bottom in September 2012. The sharp dip during the lockdown period is clear. The 2020 low was in April 2020 and was about 28% lower than in April 2019. For the year, 2020 was about 11.4% lower than 2019. However, 2021 followed the same trend as coal: 8.9% higher than in 2020, but still lower than in 2019. The natural gas consumption is shown in
Figure 11c. The overall trend is that of a gradual increase since 2010, keeping in line with population growth and replacing coal. The seasonal trend is similar to that of coal. About 52% of natural gas in the US is used to produce electricity and residential heating. About 44% is used by the commercial and industrial sectors, which explains why there is a baseline of consumption regardless of the season. Lockdowns did not significantly affect consumption. The period from April to June 2020 saw a 0.3% reduction relative to 2019, but the same period saw a 1.5% increase in 2021.
Having analyzed the fossil fuel trends,
Figure 12 plots show the change in renewable energy generation in 2020 relative to 2019.
Figure 12a shows biomass, which includes agricultural and wood waste, biogas (including landfill gas), and bioethanol. The heart of the bioethanol industry happens to lie in the central states because these states produce the feedstock—corn. States with SAHOs like North Dakota, South Dakota, Iowa, and Nebraska saw the largest drop in production, as high as 88%. This is because of the overall decrease in demand for transportation fuel. Several production facilities halted production. Pandemic safety measures added further restrictions in those facilities. The biomass generation for the US as a whole was about 23% lower than in 2019. The vast majority of states do not have significant geothermal generation. For Hawaii, the 2019 value was reported to be zero, so the increase was technically infinite. For the sake of plotting, it was capped at 100%. For hydroelectric generation, there were huge variations from state to state. The highest change was in Kansas, 50%. The lowest change was New Jersey, −50%. For the US as a whole, it was about 2.4% lower. While this may not be a large value, given that the 2021 hydroelectric generation was 9% lower than in 2020, it continues to highlight the degree to which drought and water shortages have affected the country. On the other hand, as seen in
Figure 12d, solar energy increased in almost every state as the country continues to embrace adoption. The increase was about 19.2%, with Kansas seeing a 100% increase and Rhode Island seeing a 109% increase. For wind energy, several states did not report appreciable levels, but virtually all the states that did reported an increase. The nationwide increase was about 12.5%. Midwestern states like the Dakotas, Iowa, Montana, and Nebraska saw the largest increase. The largest decrease was for Alaska, 15.4%. The total change in renewable energy was −5.8%. However, not including biomass, renewable energy increased by about 7.3% as the country continues to increase its adoption of carbon-free energy.
Figure 13 shows the final major component of US energy: total nuclear energy generation from 2018 to 2020. Not every state has nuclear power plants, so only total generation is shown. The capacity factor of the nuclear power industry averages about 90–93%. France, which is considered a world leader in nuclear power, hovers around 77%. As such, the data seen in
Figure 13 are very close to the maximum generation capacity. As the capacity plot indicates, total nuclear generation has gradually fallen as the US decommissions aging nuclear plants. Correspondingly, total energy generation has fallen. The energy production in December 2020 was 4.7% lower than in January 2020. The generation plot shows some seasonal fluctuations. While nuclear plants operate as base load plants, there is some momentum on the concept of flexible nuclear operation. However, the historic data shown in
Figure 13 simply show the two seasonal peaks, much like the coal and natural gas plots in
Figure 11. Besides minor seasonal variations, the effect of refueling and plant maintenance outages also plays a part. The pandemic did not have any appreciable impact on the nuclear sector. Finally, it is important to note that the peak-to-trough variation in a year is about 20%, whereas it is about 50% for natural gas.
Figure 14 shows the historic greenhouse gas emissions for the US from 2010 to 2020. The top three pollutants are shows: carbon dioxide, methane, and nitrous oxide. From
Figure 14a, the general trend that can be noted is that emissions have trended downward. Carbon dioxide emissions fell by about 7.5% between 2010 and 2019. Just the next year, they fell by 10.4%, keeping in line with the general fall in energy consumption in the country. Given that electricity and transportation account for 70% of carbon emissions, and considering that each fell by 2.5% and 7.5%, respectively, the 10.4% drop is understandable. Similarly, methane fell by 5.2% between 2010 and 2019, an average of 0.5% per year. The following year, the drop was 2.8%. The top two sources of methane emissions in the US are petroleum systems (including old or abandoned wells that leak methane) and enteric fermentation (from animal husbandry), combining for 59%. The other major sources are landfills and manure management. Since the agricultural sector is such a large methane emitter, the pandemic did not result in a decrease in methane emissions that was as drastic as carbon dioxide. Overall, between 2010 and 2020, there is a +0.78 correlation between carbon dioxide and methane. Nitrous oxide increased by 0.9% from 2010 to 2019. The largest source of nitric oxide is the agricultural section at 67%. The next two sources are fossil fuel combustion and biomass combustion, 19% in total. Between 2010 and 2019, gasoline consumption increased by 1.6% and distillate fuel (predominantly diesel) increased by 13.1%. Diesel engines typically produce ten times as much nitric oxide as gasoline engines. Similarly, biofuel production more than doubled. This explains why nitric oxide emissions increased during this period. In 2020, it fell by 6.7% due to the reduced fossil fuel consumption during the pandemic.
Figure 14b shows the year-over-year change. The most severe change in any one-year period was in 2020. This demonstrates the effect the pandemic and lockdowns have on emissions. It also matches similar studies on energy and emissions trends during the pandemic.
In
Figure 15, the total energy picture for 2020 can be seen in order to understand the source of the drop in energy consumption. Coal saw the largest drop at 18.8% relative to 2019, but only accounted for about 9.8% of the energy total. Given its role in heating and industrial production, natural gas decreased only by 1.8%, but accounted for 33.8% of the total. Petroleum saw a 9.3% drop while accounting for 35.8% of the total, the greatest share. Nuclear and renewable energy fell by 2.4% and 5.8%, respectively, while accounting for 8.8% and 11.4%, respectively. Finally, electricity imports from Canada and Mexico increased by +57.4%. The total energy decrease in 2020 was about −7.5%. Note that state-wise energy totals do not account for net electricity imports. As described previously, the transportation sector had the largest sector-wise drop of about 15%.
To round out the energy picture, it is instructive to consider energy expenditures [
30]. On a per capita basis, the US spent USD 3040 on energy in 2020, down about 18.5% from 2019. Wyoming spent the most, USD 6707. New York spent the least, USD 2375. The largest drop was, once again, Hawaii, at 32.1%. The total state-wise electricity expenditures closely followed consumption trends, with a +0.92 correlation. There is a +0.98 correlation between electricity expenditures and total energy expenditures. Washington, DC saw the largest drop, 14%, while California saw the largest rise, 6.5%. Interestingly, California was not the state with the largest increase in consumption; its change in electricity consumption was −0.1%. Sector-wise, expenditures fell in every sector in every state, except for a few states in the residential sector. These states were Alaska, Michigan, and southwestern states. As for energy prices, they fell in every state. The lowest drop was in Alaska, −2.6%. The largest drop was in Louisiana and Washington, DC, 19.4%. The country saw an energy-weighted overall drop in energy prices of about 8%. The state with the highest energy prices was Hawaii, USD 0.1386/kWh, while the lowest was Louisiana, USD 0.0310/kWh. This is a huge discrepancy, but it is emblematic of how these states obtain their energy. Louisiana has a massive petroleum industry. Hawaii, on the other hand, relies on importing the vast majority of its energy supply. Given its distance from the mainland, transportation costs contribute significantly to its overall energy prices. There were weak negative correlations between the average state-wise energy price and the per capita energy consumption (−0.36) and the same price and state-wise energy consumption (−0.19). However, there was a +0.997 correlation between the average state-wise energy price and state-wise energy expenditures. Note that the energy expenditure is essentially calculated by multiplying the price by the consumption.
4. Discussion, Conclusions, and Future Work
This section provides additional discussion and key takeaways based on the results and analysis of the preceding section. This paper focuses on the impact of the COVID-19 pandemic on the energy sector in the US in 2020. The goal was to provide a comprehensive picture of the country using data gathered and processed from several sources in an easily accessible and insightful manner. As was discussed in
Section 1, previous studies have focused on smaller regions or even individual cities. However, a nationwide perspective is critical for a country like the US, which is a huge energy consumer and importer. Uncovering national trends during pandemic times makes future action and preparedness easier for governments. It is hoped that future studies can draw from this work, make comparisons wherever possible, and extend its scope.
The data sources were from Federal agencies responsible for collecting state-wise data. These data, together with the associated methodology, are available for public access. However, there are significant delays in when such data are made available. The 2021 data were still not available as of Summer 2022. The 2020 data were also incomplete or required significant processing when compared to the 2019 data. Whether this was a result of the pandemic and accompanying disruptions is unclear.
- -
Data availability issues could delay or hinder research and policymaking during critical events like the COVID-19 pandemic. Such “black swan” events are extremely important learning experiences for society and governments, and data collection, processing, archiving, and dissemination should be treated as a priority. For example, as was described in the present work, while energy consumption as a whole fell, residential energy consumption increased in several states. Climate change, the switch to electric vehicles, etc. will severely stress the aging grid infrastructure in the US. Utilities and planners should have access to broad data in order to prepare for such events in the future.
The fact that US case counts and death rates were some of the highest in the world has been well documented. In total, 32 out of 51 states and territories had a death rate above 300/100,000 in 2020–2021. No strong correlation between the initial population and the case count was found. Geographically speaking, the middle and southern portions of the country generally had higher rates than the east and west coasts. These human costs were juxtaposed with the change in energy consumption for some of the largest countries in the world. Virtually all countries saw a decrease in energy in 2020 relative to 2019 but saw an increase in energy in 2019 relative to 2018. Again, no strong correlation between the energy drops and the death rate was found. Out of the 10 countries, accounting for 51% of the global population, the US had the highest death rate and number of deaths and the second-highest energy drop. Historically (1950–2021), a +0.94 correlation between population and energy consumption in the US was found. A 7.5% drop in energy in 2020 was the steepest in 71 years, followed by a 4.9% drop during the 2008 Great Recession. This drop was amplified to 30% during the March–June 2020 lockdown period.
- -
The COVID pandemic was directly responsible for a −7.5% drop in total energy consumption in the US in 2020 due to the disruption of daily life in all sectors.
The state-wise energy consumption revealed that the rural middle of the country tended to have a higher per capita energy consumption than some of the coastal states, as high as 5:1 in some cases. The seven states without SAHOs were also centrally located, and several of the middle states imposed lockdowns as late as April. Thus, the change in energy consumption by state landed on a spectrum, from +4% (Alaska) to −26.4% (Hawaii). The population-weighted average change for the states with SAHOs was −5.7%. For the rest of the US, it was −9.1%.
- -
The lack of SAHOs resulted in a lower decrease in energy consumption and a higher death rate.
GDP declined by 2.2% for the US as a whole. Weak correlations between GDP and normalized case count (+0.28) and normalized death rate (+0.37) were found. A stronger correlation of +0.45 between GDP and energy drop was found.
- -
GDP was more heavily influenced by energy consumption than the COVID health toll.
Sector-wise energy breakdown for each state revealed a reduction in energy consumption in virtually every sector across the country. The residential sector was found to have the most states that saw an increase in energy. The industrial sector was least affected, with several states experiencing a minuscule change relative to 2019. The transportation sector was the most affected. For states without SAHOs, a +0.44 correlation between the decrease in residential energy and case count was found.
- -
While several states saw an increase in energy residential consumption, non-SAHO states saw a disproportionate decrease in energy as their case counts increased.
Electricity consumption followed a similar trend as the total sector-wise energy consumption. Residential electricity consumption increased by +2.6%.
- -
Lockdowns contributed to an increase in residential electricity consumption, but states without SAHOs experienced a lower increase, +1.4%.
Examining historical fossil fuel consumption showed that petroleum consumption was most affected by the lockdown period, dropping 28% in April 2020 and 11.4% in 2020. Coal consumption increased after the lockdown period after falling year after year for the past 12 years. Natural gas has been historically increasing as coal falls out of favor, and lockdowns did not have a significant impact on historical trends.
- -
As fossil fuel import economies like the US continue to reduce consumption, the influence of the pandemic and related supply chain disruptions must be accounted for. Similar events in the future can be expected to result in a decrease in petroleum consumption, but this was followed immediately by a rapid recovery.
Renewable energy generation overall decreased by 5.8%, but, excluding biomass, it increased by 7.3%. Biomass is the only renewable resource that can be said to have been seriously affected by the pandemic. The primary reason for the decrease was the precipitous decrease in biomass-based fuel production. Biomass is considered renewable and carbon neutral. However, its primary disadvantage is that it competes with food production. For countries like the US, this is not a problem. However, food security is expected to affect an increasing proportion of the global population due to supply chain disruptions, climate change, war, etc.
- -
Several US states still do not have appreciable levels of renewable energy. While natural resources like geothermal, solar, and wind vary dramatically across the vast nation, the lack of a unified energy policy has delayed the transition of certain state economies. This could lead to severe economic and infrastructure consequences and imbalances in the coming years.
Total nuclear energy continues to decrease as US nuclear power plants age and undergo decommissioning. US greenhouse gas emissions also expectedly decreased in 2020. Carbon dioxide emissions fell by 10.4%, methane by 2.8%, and nitric oxide by 6.7%.
- -
The US is still heavily dependent on fossil fuels. As such, the lockdowns provided an undesigned benefit—a decrease in energy consumption led to a decrease in emissions and cleaner air. Similar effects have been reported by other recent studies. With several companies continuing to allow employees to work from home and several business meetings and similar activities being held virtually, such enduring emissions reductions could build on the concerted effort to reduce fossil fuel consumption.
Most states saw a drop in per capita energy expenditure, about 18.5% for the country. Every sector in every state saw a drop in expenditure except for the residential sector in a handful of states. A wide disparity in spending was noted: the state that spent the most (Wyoming) spent 2.8 times more than the least (New York). A +0.92 correlation between total energy consumption and electricity expenditure was found. Similarly, a +0.98 correlation between total energy expenditure and electricity expenditure was found. Energy prices fell in every state. The overall energy-weighted average drop in price for the country was about 8%. The state with the highest price per kWh (Hawaii, USD 0.1386/kWh) was about 4.5 times higher than the state with the lowest price (Louisiana, USD 0.0310/kWh). There was a +0.997 correlation between the average state-wise energy price and state-wise energy expenditures. On the other hand, comparing price with per capita energy yields a +0.56 correlation. This is a moderate correlation and implies that states consume more energy when it is cheap. Looking at the map in
Figure 5 shows that the coastal states tend to consume less energy per capita than the middle parts of the country.
Climate plays a factor as well, but one of the critical challenges facing the US today is how it manages its energy use. US citizens enjoy a relatively high standard of living, and this includes one of the highest per capita energy consumption rates in the world. Gasoline prices are less than half that of countries like the UK and Norway and lower than China, India, Indonesia, Mexico, South Korea, etc. Similarly, electricity prices are less than half that of the UK, Germany, and Denmark, and lower than Australia, Brazil, France, and Japan. Energy use is not taxed to the extent that it is in other developed countries. Fossil fuel use is still subsidized by the government, so people have very little individual impetus to rapidly switch to cleaner sources. Further, the aging grid continues to face challenges due to the climate crisis and the slow adoption of renewable sources, all of which produce electricity.
This study has the following limitations. Publicly available sources of data were used to conduct the analysis presented here. This does not represent all the pandemic-related data currently available. The focus was on data that can be easily accessed for reproducibility. In the data sources, some state-wise breakdowns were not available. For example, fossil fuel consumption by fuel type for each state. In such cases, nationwide data were presented. In order to keep the length reasonable, energy consumption by economic sector (primary, secondary, tertiary) was not presented. Similarly, the data on energy prices were also kept extremely brief. Most of the plots deal with data exclusively from 2020, since the 2021 data are incomplete. Finally, the societal impact of COVID was not considered. Rather, the focus was on energy consumption, which changed because of changes in society brought on by the pandemic. A detailed socioeconomic analysis is beyond the scope of this work.
Future work on US energy consumption and the influence of the COVID-19 pandemic should consider the 2022 data when available. Such data over the duration of the pandemic would be critical to help grid operators and utilities inform their strategies to cope with such events in the future. Over 75% of the US economy is in the tertiary sector, meaning several key businesses were able to operate remotely. However, employees in this sector tend to be the most financially flexible and spent a lower fraction of their income on food and energy. Future work could also look at the unequal impacts of the shift in the energy usage during the pandemic. Finally, future work should re-examine pandemic changes to investigate which changes, if any, have gone from short-term to long-term.


