Abstract
The limited availability of fossil fuels such as coal and increasing air pollution levels due to the burning of coal have pushed the trend of generating electricity from fossil fuels to generating it from locally available renewable resources. It is expected that the cost of electricity will decrease when locally available renewable resources are used. In this paper, it was proposed to commission a solar PV system in a part of an academic building of SRM IST University. The present study is an effort in-line with many initiatives taken up by the Indian Government. The performance index of solar PV system was analyzed. Supporting data were obtained from the NASA PDAV tool and then techno-economical analysis was carried out on HOMER. The average performance ratio and capacity factor of the solar PV system were obtained as 64.49% and 14.90%, respectively. For the optimal configuration, the net present cost and the levelized cost of electricity are $639,981 and $0.34 per kWh, respectively. As per the estimation, there will be no air pollution due to the proposed configuration, whereas if only a diesel generator is commissioned, then 200,417 kg of carbon dioxide will be emitted annually.
1. Introduction
There are several sectors contributing to the rising demand for electricity in India. These sectors include those involved in the development of smart cities, IoT-enabled devices, smart agriculture, automation in manufacturing industries, the hospitality industry, automated life-saving equipment in hospitals, and many other sectors. This rise in electricity demand has an impact on the Indian economy. In India, around 50.7% of electricity is generated using fossil fuels and around 41.5% through non-fossil fuels [1]. Alternative resources of energy, other than fossil fuels, and a reliable energy infrastructure, can lead to the sustainable development of the economy [2]. The alternate energy source is green energy, which is generated through natural sources such as sunlight, wind, and water. Green energy supports the achievement of energy security in a country [3]. It is imperative to understand the downside of fossil fuels compared with renewable energy sources (RES)—(i) a decrease in reserves of fossil fuels and (ii) a rise in the level of greenhouse gases in the atmosphere due to the burning of fossil fuels for generating electricity. RES, such as sunlight and wind, are unlimited, and cause no environmental pollution. These reasons are promoting the use of RES to produce electricity [4]. As the RES-based power plant is situated close to the load center, the transmission and distribution losses are minimal [5]. It is imperative to create suitable policies to employ RES for electricity generation, which will positively impact the Indian economy, and the dependency on fossil fuels will reduce with time [6]. India is located in the continent of Asia. India is situated north of the equator between 8°4′ north to 37°6′ north latitude and 68°7′ east to 97°25′ east longitude [7]. Therefore, India experiences a lot of sunlight and high wind speeds, together with its locally available biomass and hydropower. This means India has high potential for electricity generation using RES.
As sunlight is non-polluting and is available in abundance, electricity generation through solar energy is gaining popularity in residential and commercial buildings. Recently, electric vehicles have been implemented to reduce the air pollution produced by petrol- and diesel-based vehicles. These electric vehicles need electric charging for their operation. Therefore, charging stations have been commissioned at various locations and these charging stations are powered from solar energy-based power plants. Commissioning solar power plants reduces carbon footprints and involves zero emissions of greenhouse gases [8]. Even though solar energy is called sustainable, it has a few limitations—(i) it is not steady, (ii) it is not available during cloudy seasons and night hours, and (iii) the shadow effect reduces the efficiency of solar panels. Due to these limitations, energy planners draw electricity generation estimations based on weather forecasts. Such limitations can be overcome by optimally blending other RES or non-RES with solar energy to serve the load continuously. Other RES for electricity generation can comprise wind energy, geothermal energy, hydropower, tidal energy, bio-fuels, and bio-mass, etc. It is worthwhile to note here that when a diesel generator (DG) uses bio-fuels in place of diesel to generate electricity, it is considered RES. In this way, hybrid power generation plants (HPGP) can be optimally designed and employed to serve the load of the area under consideration. An HPGP can be off-grid or on-grid [9]. An off-grid HPGP is a stand-alone power plant which is not connected to the primary grid. It is mainly useful for load centers in remote areas such as isolated islands, hill stations, and rural areas [10,11]. The excess electricity produced by an off-grid HPGP can be stored in a suitable energy-storage system such as batteries. This means that whenever HPGP cannot serve the load, probably during peak hours, the stored energy supports HPGP in fulfilling the demand of peak load [12]. An on-grid HPGP is connected to the primary grid. It promotes the bi-directional flow of electrical energy between the grid and HPGP. This means electricity can be borrowed from the primary grid whenever HPGP cannot fulfill the peak load demand. If HPGP produces excess energy, it can be sent to the primary grid. Therefore, smart meters employed at HPGP measure the net flow of electrical energy between the primary grid and the HPGP [13].
With rising global warming and pollution levels, many countries have initiated work on technologies supporting electricity generation using RES [14,15]. An optimum blend of RES is created based on the weather conditions of the concerned area, and suitable HPGP is employed. It has been estimated that it is preferred to generate electricity with RES-based HPGP due to its non-polluting characteristics compared with DG-based power plants [16]. Though the government provides subsidies in fuel prices for electricity generation using DG-based power plants, HPGPs are observed to be economically viable when the net present cost, operational cost, and energy cost are compared [17]. The government is also designing policies for RES-based power plants, especially for solar photovoltaic (SPV) systems, which are readily deployed on residential and commercial buildings [18].
The Indian Government has taken many steps to reduce air pollution by adopting green energy and in this regard, it has taken many initiatives to promote the installation of HPGPs. In January 2010, the government started The Jawaharlal Nehru National Solar Mission (JNNSM), also called the National Solar Mission. The target of JNNSM is 100,000 MW for grid-connected solar PV arrays and 2000MW for off-grid applications [19]. In order to bring down global warming levels worldwide, the Paris Agreement was adopted by 196 countries, including India. This agreement aims to reduce the emission of greenhouse gases by the mid-century [20]. The Kyoto Protocol operates with the United Nations Framework Convention. It works on reducing greenhouse gases, with individual targets committed by industrialized countries [21]. In continuation of the agreements and protocols mentioned above, the International Solar Alliance (ISA) was formed in collaboration with countries with a high solar radiance. In this way, the member countries can work towards meeting energy requirements sustainably and affordably [22]. The aim of ISA is to create a world solar bank with one grid. The world’s largest solar park, with a capacity of 2.70 GW, is located at Bhadla in Rajasthan, India [23]. The Indian Government has set a target of increasing India’s electricity generation capacity to 175 GW by 2022 and 500 GW through renewable energy sources [24]. Another target of the Indian Government is to build the world’s largest renewable park of 30 GW with the combination of solar and wind energy in the Kutch district, Gujrat [25]. The present study contributed to the targets and agreements mentioned earlier.
In this article, an educational campus, SRM Institute of Science and Technology, Delhi-NCR Educational Campus, estimated the performance parameters of the SPV system and technical analysis. The geographical location of India enables approximately 300 solar days [26]. Delhi-NCR is also blessed with almost 300 sunny days, but has low potential for generating wind or hydro energy. Moreover, the minimum temperature experienced in Delhi during winter season is around 1 °C for 2 to 3 days only in a year [27]. The campus aims to promote a green environment, so a solar energy-based power plant is proposed for the concerned location. This proposed HPGP will be commissioned on one campus building with 15 classrooms. The other factors to adopting green energy technology by the campus are (i) to reduce the dependency on the primary grid for electricity supply, (ii) to reduce the cost of energy, (iii) to reduce the usage of DG and, hence, diesel consumption, and (iv) to reduce environmental pollution by decreasing the emission of greenhouse gases; the proposed HPGP is off-grid, so excess electricity produced can be stored in suitable energy storage systems. The objective is to balance technical and financial metrics while optimizing the design of HPGP. This paper is organized as follows: the introduction to the work is given in Section 1; in Section 2, meteorological conditions of the concerned area and estimated load are discussed, and Section 3 provides the details of the simulation tool used for HPGP analysis. The configuration of the proposed HPGP system is discussed in Section 4, performance and economic analysis of HPGP are provided in Section 5, Section 6 provides the results and discussions, a comparison of HPGP with a reference case is provided in Section 7, and Section 8 draws the conclusions.
2. Weather Conditions and Load Estimation of the Selected Site
An educational campus was chosen to assess the performance parameters and analyze the technical and economic parameters of the SPV system. The site selected for the mentioned purpose is SRM Institute of Science and Technology (IST), Delhi-NCR Educational Campus. Its geographical location is 28.8377° northand 77.5826° east. The selected site was marked on a map, as shown in Figure 1 [28]. The meteorological data of the selected site exhibited variation of earth skin temperature between 13 °C to 37 °C, a monthly average ambient temperature between 13 °C and 32 °C, and monthly average daylight hours between 10 to 14 h. This is presented in Figure 2. The average annual daytime hoursof the selected site is 12.17 h [29].
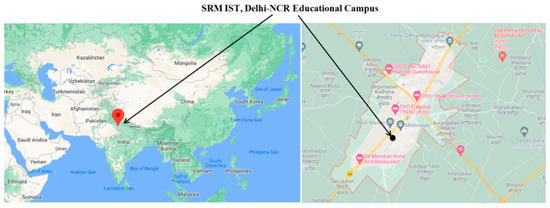
Figure 1.
Map showing SRM IST, Delhi-NCR Educational Campus, South Central Asia.
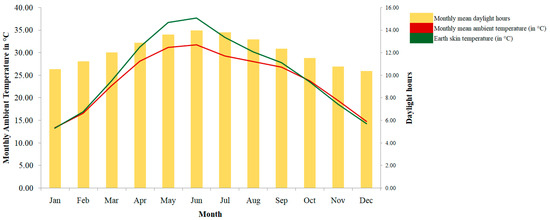
Figure 2.
Monthly mean ambient temperature, earth skin temperature, and daylight hours of the selected site.
In the present scenario, the campus purchases electricity from the primary grid to meet the electricity demand. To optimize the electricity cost, it has been proposed to commission the SPV system in one part of the campus. So, a part of a building with 15 classrooms was chosen in the first phase. The load estimation of these 15 classrooms is provided in Table 1. As per the campus schedule, the classrooms are used for an average of 6 h daily, and the average energy consumption is approximately 400 kWh per day. It is essential to assess the performance parameters of the SPV system to attain the required efficiency. In the present study, different performance indices were calculated based on the climatic conditions of the selected site. This analysis of the SPV system may help to decide on the future commissioning of SPV systems in other areas of the campus.

Table 1.
Load estimation of 15 classrooms at the campus of the selected site.
3. Software for Optimization of HPGP
HOMER (Hybrid Optimization of Multiple Electric Renewables) is a simulation software tool developed by the National Renewable Energy Laboratory (NREL) [30]. This software tool was used in the present study. It takes the input as the location of the selected site, weather conditions of the selected site, the specifications of the components proposed to commission HPGP, and the load profile. The meteorological data, including solar radiation, were taken from NASA (National Aeronautics and Space Administration)—PDAV (Power Data Access Viewer) tool [29]. Other data from NASA-PDAV are monthly average daylight hours, direct normal radiation, diffuse radiation, and global horizontal radiation. The components of HPGP vary in cost and availability of RES. HOMER performs several simulations using optimization algorithms and performs sensitivity analysis to aid in the decision-making process. The output from HOMER includes, but is not limited to, economic analysis and size of the components, sensitivity analysis, time-series analysis, estimation of the performance index, and emission of the pollutants in the atmosphere. This information is presented in a block diagram, as shown in Figure 3.
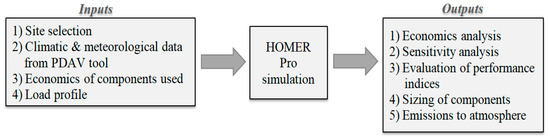
Figure 3.
Flow chart of the HOMER Pro simulation tool.
The data available from the NASA-PDAV tool can be utilized to estimate the performance index of the SPV system. The economic analysis estimates the least cost of energy (LCOE) and net present cost (NPC). The technical analysis provides estimates of the sizing of the components of HPGP. There are other optimization tools available to calculate these estimations; these are based on artificial-intelligence methods. Such methods include the genetic algorithm, particle swarm optimization, flower pollination method, and the bird flocking method, etc. These methods have high convergence speed. However, the main drawback is that they require high-speed computers to perform complex calculations and long memory space to store the results.
4. Components of HPGP
The proposed components of HPGP include the SPV system, the battery storage system (BSS) for storing excess energy produced, and DG as a source of captive power generation. As observed from the configuration of the proposed HPGP shown in Figure 4, there are two bus systems—AC and DC. Because DG supplies AC power, it is connected to the AC bus, while the SPV system and BSS provide DC power; it is connected to the DC bus. This DC power is converted to AC power by the converter, which is why the converter is connected between the AC and DC bus, and then AC power is supplied to the electric load. If the SPV system produces excess power, it will be stored in BSS. Considering another case, when the SPV system and BSS are not able to meet the load demand or peak load, then the DG will operate. A converter to charge BSS will supply AC power supplied by DG, which will be converted to DC power. The proposed HPGP is expected to serve an average load of 400 kWh/day. The related diagrams and other component details were taken from the HOMER Pro software.
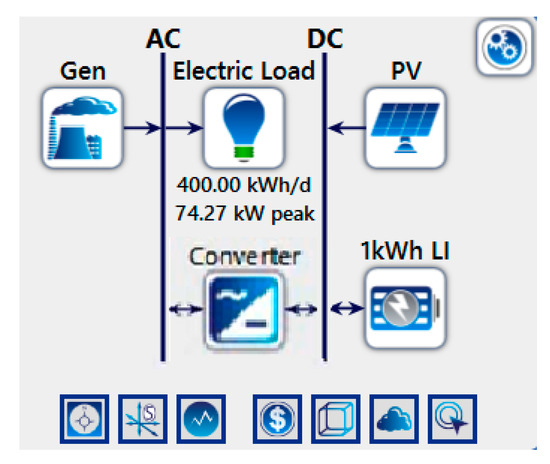
Figure 4.
Proposed configuration of HPGP.
4.1. Solar PV System
The load estimation is provided in Table 1. The 24 h load profile is provided in Figure 5. The load profile for 365 days in a year is provided in Figure 6. The factors affecting electricity generation through the SPV system are radiations from the sun and the ambient temperature. The sun’s total radiation on the earth’s horizontal surface is known as ALLSKY INSOL [30]. The ALLSKY INSOL and clearness index of the selected site were taken from HOMER and are mentioned in Figure 7. The light scattered at the earth’s surface due to dust particles and moisture content in the atmosphere is known as diffuse horizontal irradiance (DIFF) [31]. Direct normal radiance (DNR) is measured at the earth’s surface, which is location specific and does not include the scattered radiation due to atmospheric components [32]. DNR depends on the site’s weather conditions, time of day, and time of year. Cos z is the compass direction from which the sunlight comes and is known as the azimuth angle [33]. The three types of radiations were taken from the NASA-PDAV tool and are presented in Figure 8 for the selected site [29]. The ratio of direct to diffuse radiation is shown in Figure 9.
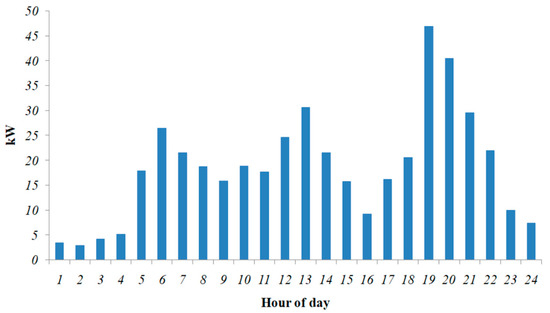
Figure 5.
Daily profile of the electricity demand of 15 classrooms at the selected site.
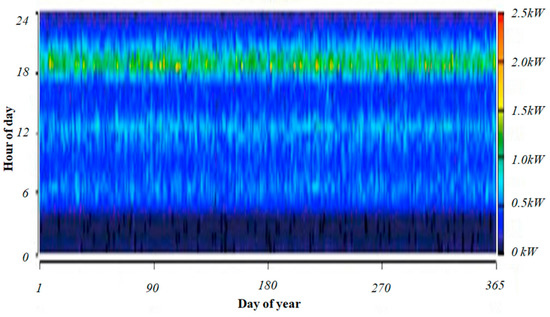
Figure 6.
Yearly profile of 15 classrooms at SRM IST, Delhi-NCR Campus.
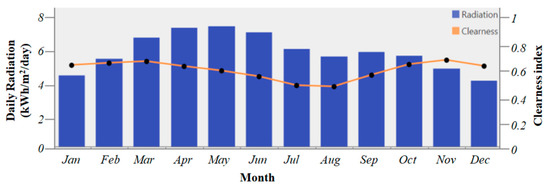
Figure 7.
Solar radiation and clearness index of the selected location.
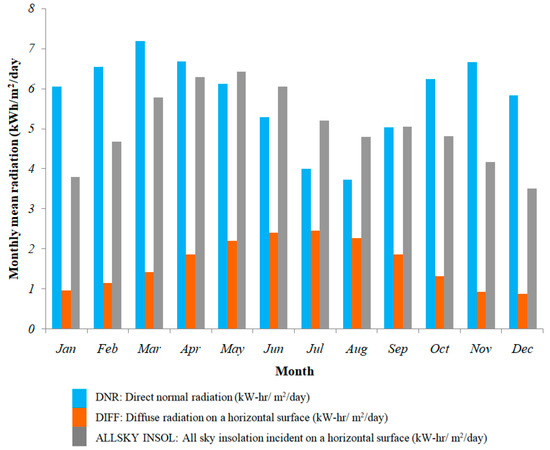
Figure 8.
ALLSKY INSOL, DIFF and DNR of the solar radiation of theselected location.
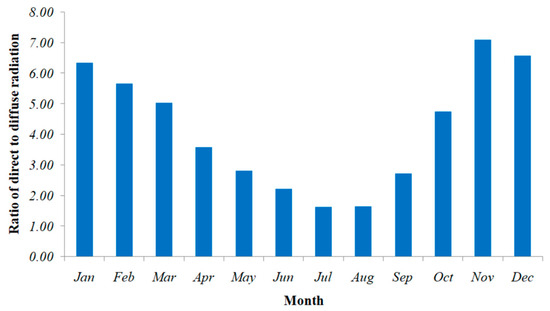
Figure 9.
Ratio of direct to diffuse radiation of theselected location.
The SPV system provides DC power, and because the load is AC in nature, it is required to be converted to AC power. The SPV array yield is fed into the inverter for conversion of DC power to AC power. The efficiency of the inverter was considered as 90% for the analysis [30]. The information related to the power output from the inverter was used for calculating the performance parameters of the SPV system. It is depicted in Figure 10. Specifications of the polycrystalline PV array used in the proposed configuration are in Table 2.
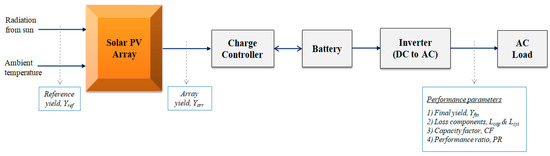
Figure 10.
Block diagram of the solar PV array system.
Table 2.
Specifications of the polycrystalline PV array.
4.2. Energy Storage System—Li-Ion Batteries
The extra energy generated from the SPV system or DG will be stored in BSS. In this proposed configuration, generic 1kWh Li-Ion batteries were applied, which are provided in Table 3. This stored energy can be utilized during peak hours, night hours, or cloudy days when sunlight is unavailable. Therefore, it becomes imperative to regularly check battery health by monitoring the battery state of charge (SOC). This monitoring helps to the improve system’s battery life and prevent it from overcharging. Mathematically, SOC is defined as given in Equation (1) [32].
Table 3.
Technical details of the battery.
Over time, the battery system becomes useless. The battery life is calculated as per Equation (2) [33].
4.3. Backup System—Diesel Generator
For the uninterrupted operation of HPGP, captive power generation is essential. In comparing the efficiency and initial investment of other systems such as turbines, DG has high efficiency and low initial investment. Therefore, in this article, DG was considered a captive power generation source. Diesel consumption was plotted in a fuel curve by HOMER, as shown in Figure 11. The intercept on the vertical axis shows fuel consumption at no-load. The consumption of diesel depends on the amount of electrical energy generated by DG, which can be calculated using Equation (3) [34].
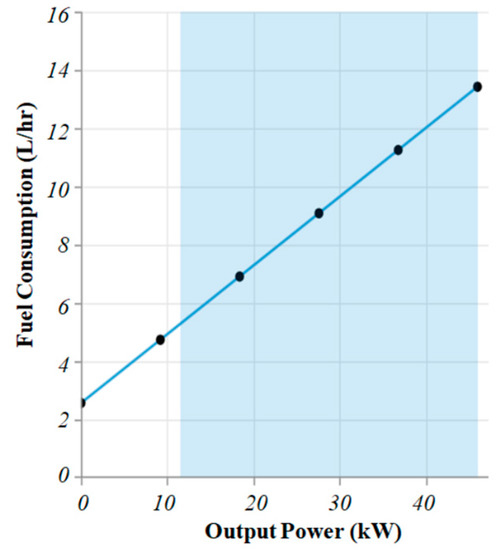
Figure 11.
Fuel curve of the diesel generator.
The efficiency curve for the DG output has been plotted between zero and the rated output, as shown in Figure 12. In this proposed configuration, auto size Genset was considered, and its technical details are provided in Table 4.
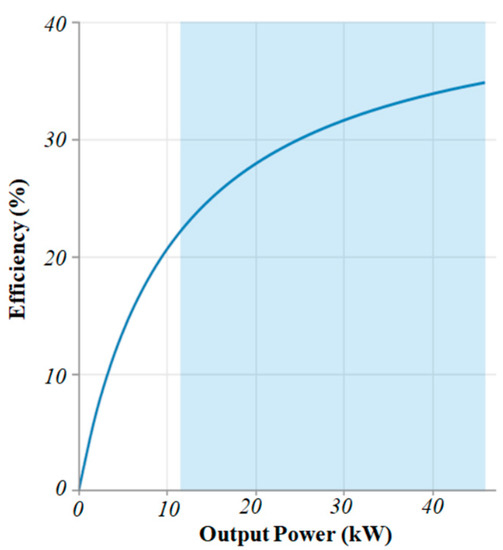
Figure 12.
Efficiency curve of the diesel generator.
Table 4.
Technical details of the diesel generator.
4.4. Converter
The HPGP contains both an AC bus and DC bus, as shown in Figure 4. The electrical load is AC in nature, so it will accept AC power. Out of all the components of HPGP, DG provides AC power. The SPV system and BSS will serve DC power, so this is required to be converted to AC power. In such a case, a converter is required to act as the inverter and convert DC power to AC power. On the other hand, BSS takes DC power to charge the batteries. If DG is serving the load, then AC power generated from DG must be converted to DC power. In this case, the converter will act like a rectifier and convert AC power to DC power to charge BSS. This converter serves the purpose of both rectifier and inverter to adjust the current direction between AC and DC bus components. The battery SOC level is the deciding factor for the size of the converter.
5. Evaluation of Performance and Economic Analysis of HPGP
Before commissioning the SPV system, comparing the performance to design expectations is imperative. This comparison helps to determine the potential faults and performance trends of the SPV system. The analysis was conducted by calculating the performance index, which is defined as the ratio of measured energy to predicted energy of the SPV system. A performance index can also be termed an energy performance index (EPI) or power performance index (PPI). EPI was calculated based on the amount of energy, in kWh, for a particular interval of time. In contrast, PPI was calculated on the basis of instantaneous power (kW). These data were plotted to analyze the time series trend [35].
The performance analysis of HPGP was conducted based on technical and economic analysis. This detailed analysis was conducted with the help of suitable software, which estimates the capital investment required and payback period, etc. It helps in the decision-making process of investing in technology. The relevant factors taken into consideration are (i) the total cost of the project, (ii) operating and maintenance costs, (iii) benefits, risks, and uncertainties of the technology, and (iv) the non-economic factors such as the location of HPGP [36].
5.1. Performance Index of SPV System
The guidelines for calculating the performance index of the SPV system are provided in IEC 61724 [37]. The performance index is the ratio of actual energy generated by the SPV system to the forecasted value. It helps to make a comparison of the design parameters with its performance and a comparison with other similar configurations, which are commissioned at different locations. The performance index also helps identify probable faults in the SPV system. In this article, the following six performance indices were calculated for analyzing the performance of the SPV array system [38,39].
5.1.1. AC Energy Output, EAC
The AC energy output of the SPV system is determined by the efficiency of the inverter, as given in Equation (4).
5.1.2. Array Yield, Yarr
This ratio calculates the DC energy yield from the SPV system. The performance is calculated with respect to its rated capacity. It can be calculated daily for a month or a year. Mathematically, it is given as Equation (5).
5.1.3. Reference Yield, Yref
This parameter is the ratio of incident solar radiation to reference radiation. The reference irradiation was considered as 1000 W/m2. This ratio is location specific because it depends on the daylight hours of the selected site. Mathematically, it is given as Equation (6).
5.1.4. Final Yield, Yfin
This parameter is the ratio of AC energy yield to the rated capacity of the SPV system. In other words, AC energy yield depends on the size of the SPV system. This ratio can be calculated on a daily basis, for a month or for a year. Mathematically, it is given as Equation (7).
5.1.5. Performance Ratio, PR
The performance ratio is the ratio of Yfin to Yref, which signifies the gap between them. This gap is expected due to certain losses in the SPV system such as thermal loss, environmental loss, ageing of the PV array, and optical losses etc. Mathematically, it is given as Equation (8).
5.1.6. Capacity Factor, CF
The capacity factor is the ratio of the AC energy output to the actual energy output when the SPV system is operated at its rated capacity. This ratio can be calculated on a daily, monthly, or annual basis. Equation (9) presents a mathematical expression of CF, calculated every month.
5.1.7. Array Capture Loss, Lcap
The SPV system cannot gather the entire incident solar radiation in any location. So, there is a difference between actual and reference radiance, known as the array capture loss. Equation (10) presents the mathematical expression.
5.1.8. System Loss, Lsys
The difference between Yarr and Yfin, is known as system loss. It is expressed as given in Equation (11).
5.2. Economic Analysis of HPGP
An economic analysis was conducted to review the feasibility of the proposed HPGP. Two parameters were considered in this article—LCOE and NPC. LCOE is the ratio of the total associated cost of HPGP to the summation of electricity generated over the system’s lifetime. The mathematical expression of LCOE is given in Equation (12) [40]. The cost of HPGP includes, but is not limited to, capital investment on the components of HPGP, expenditure on operations, and the maintenance of the technology used and other related costs required for the proper functioning of HPGP during its lifetime. The calculations were performed considering a discount of 8% and an inflation rate of 2%.
In Equation (12), It is capital expenditure in $, Mt is the expenditure for the operation and maintenance in $, Ft is the expenditure of fuel in $, Et is the electrical energy generation in kW, r is the rate of discount in percentage, and n is the lifetime of the system in years.
NPC is the total cost linked with HPGP over its lifetime, and from this, lifetime earnings of HPGP are deducted. The total cost includes capital investment, replacement cost, operation and maintenance cost, fuel cost, any penalties paid for emitting pollutants, and the electricity cost purchased from the primary grid. The costs deducted are salvage costs and the cost of electricity provided to the primary grid. Mathematically, it is given as Equation (13) [41].
In Equation (13), Ct is the net cash flow in $, r is the discount rate in percentage, and t is the time of cash flow in years. The specifications of HPGP components are provided in Table 5.
Table 5.
Specifications of the components of HPGP.
6. Results and Discussion
The project lifetime was taken as 25 years for the proposed HPGP. The simulation results support deciding the optimal configuration of HPGP. PV(509 kW)/BSS(383 kWh) was chosen as the optimal configuration due to its lowest energy cost. The evaluation of the performance index and technical and economic analysis are discussed in the following sections.
6.1. Evaluation of Performance Index
HOMER software provided data of optimal configuration for the time series analysis. Using these data, DC energy generated (EDC) by the SPV system was calculated for 12 months in a year. The efficiency of the inverter was taken as 90%, so based on this, AC energy generated (EAC) by the SPV system was calculated. The energy produced by the SPV system depends on solar radiance, daylight hours, and ambient temperature. Taking into consideration these facts and the calculation, it can be observed from Table 6 that the maximum energy was produced in March for the selected site, where EDC was 2427.75 kWh, and EAC was 2184.97 kWh. The minimum energy was produced in August, where EDC was 1664.27 kWh, and EAC was 1497.85 kWh.
Table 6.
Energy produced by SPV system at the selected site.
The performance index calculated for the SPV system is provided in Table 7. It was calculated using Equation (5) to Equation (11). It can be seen from Table 7 that the average SPV array yield, reference yield, and final yield were 4.05 per month, 5.66 per month, and 3.65 per month, respectively. Maximum array yield could be observed in March, and the minimum occurred in August. The average performance ratio and capacity factors were 64.49% and 14.90%. The array capture loss and system loss were 1.60 per month and 0.41 per month, respectively. Maximum system loss occurred in March and the minimum in July and August.
Table 7.
Performance index of the SPV system at the selected site.
The ambient temperature and the average SPV array cell temperature are plotted in Figure 13 of the selected site. The ambient temperature data were taken from the NASA-PDAV tool [28]. The average SPV array cell temperature was taken from HOMER. The cell temperature of the SPV array varied due to variations in solar radiation and ambient temperature. There are lots of cooling techniques available, which can reduce the SPV array cell temperature and help to increase the efficiency of the PV panel [42,43]. The average maximum cell temperature was achieved in June (42.46 °C) and the average minimum in January (20.72 °C). The ambient temperature ranged from 13.93 to 35.83 °C, with an average of 25.42 °C.
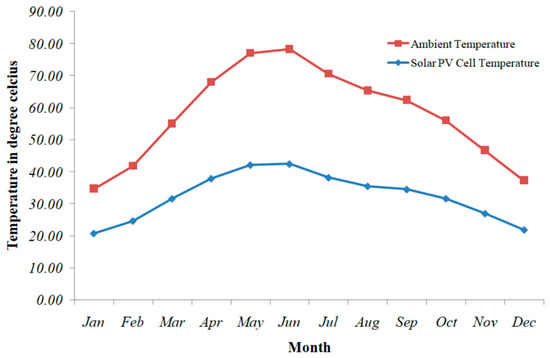
Figure 13.
Average SPV cell temperature and ambient temperature of the selected site.
The quality of the SPV system can be inferred from PR. It indicates the amount of solar energy available for conversion to electrical energy. It is the ratio of measured output to expected output, where the expected output can be taken from the specifications of the SPV system. Table 7 indicates that maximum PR occurred in January (68.06%) and the minimum in May (61.41%). The capacity factor calculates the capability of the SPV array system to generate electrical energy. Table 7 indicates that the maximum CF occurred in March (17.89%) and the minimum in August (12.26%), the average CF for the year being 14.90%.
The above-discussed outcomes are outlined as follows:
- GHI ranged from 3.52 to 6.42 kWh/m2/day, with an average of 5.05 kWh/m2/day (refer to Figure 8).
- The average DNI was5.78 kWh/m2/day (refer to Figure 8).
- The average DHI was1.65 kWh/m2/day (refer to Figure 8).
- The average CI of the selected site was 0.58 (refer to Figure 7).
- The ratio of direct and diffuse radiation varied between 1.62 and 7.09 (refer to Figure 9).
- The performance index varied as follows (refer to Table 7):
- Yarr between 3.27 and 4.77 per month
- Yref between 4.61 and 6.68 per month
- Yfin between 2.94 and 4.29 per month
- Lcap between 1.30 and 1.92 per month
- Lsys between 0.33 and 0.48 per month
- The average cell temperature ranged from 20.72 to 42.46 °C, and the ambient temperature varied between 13.93 and 35.83 °C (refer to Figure 13).
- Average PR and CF varied between 61.41% and 68.06% and 12.26% and 17.89%, respectively (refer to Table 7).
The performance index of the SPV system commissioned at the selected site was compared with the SPV system commissioned at different locations. This comparison is provided in Table 8. The SPV systems of other locations were commissioned according to electricity demand and the weather conditions of respective locations.
Table 8.
Comparison of the performance indices of different SPV arrays installed at different locations.
6.2. Evaluation of Economic Analysis
The simulation from HOMER provided 31,071 results, of which 4 optimal configurations for HPGP were obtained. These configurations and the details of the simulation are provided in Table 9. The simulation took all possible combinations of the SPV system, DG, and BSS. The first optimal configuration obtained was PV (509 kW)/BSS (383 kWh), which has the least energy cost. This configuration was taken up as the proposed solution for HPGP. A reference case of a DG-based power plant will be compared with this proposed HPGP to understand the benefits of the proposed solution. The sensitivity analysis was conducted by considering variables such as inflation rate, discount rate, and the entire project’s lifetime.
Table 9.
Optimal configurations evaluated by the HOMER software.
6.2.1. Technical and Economic Analysis of PV/BSS Configuration
The technical and economic analysis of HPGP has been performed using the HOMER Pro software. The optimum configuration was obtained as PV (509 kW)/BSS (383 kWh). For the selected configuration, LCOE, NPC, and operating costs were $0.34, $639,981, and $13,119 per year, respectively. The component cost summary for the selected configuration is presented in Table 10. Figure 14 shows that the SPV system comprised 51% of the total capital cost, while BSS was 44% of the total capital cost. The converter made up only 5% of the total capital cost. This means renewable sources of this configuration comprised 51% of the total cost. BSS and the converter comprised 49% of the total cost. The selected site had an average GHI of 5.06 kWh/m2/day and a clearness index of 0.58, so the weather conditions favor the generation of electricity using renewable energy sources. The generation of electricity from the SPV system is shown in Figure 15.
Table 10.
Cost summary of the components for PV–BSS configuration.
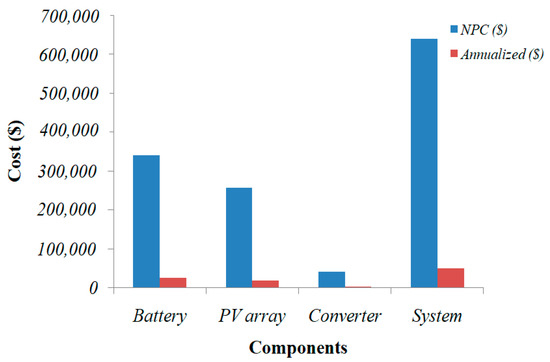
Figure 14.
Cost summary of the components in PV–BSS configuration.
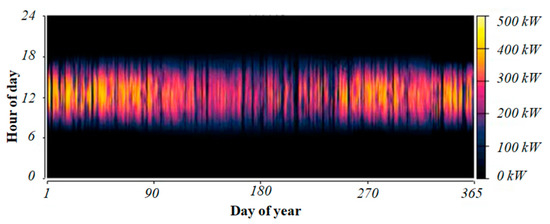
Figure 15.
SPV array power output for the PV–BSS configuration.
The total electricity generation with the PV–BSS configuration estimated by the HOMER software was 752,328 kW per year. The monthly production of electricity from the SPV array is given in Figure 16.
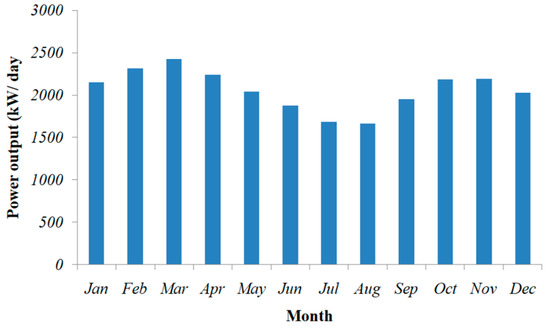
Figure 16.
Electricity production in each month from PV–BSS configuration.
The energy stored in BSS is utilized at peak hours or when SPV arrays cannot generate electricity. Depending upon the energy output, batteries become charged between 80% and 100% from the 9th to the 19th h. This can be observed from the red-colored region in Figure 17. The monthly SOC of BSS is provided in Figure 18.
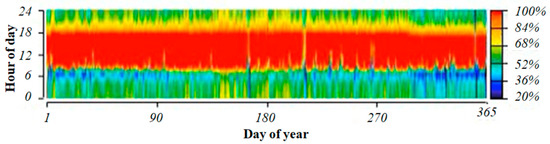
Figure 17.
Yearly profile of the SOC of batteries for PV–BSS configuration.
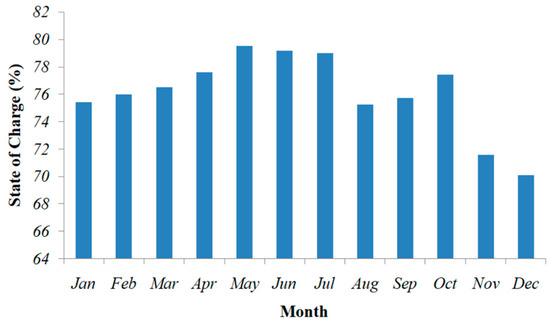
Figure 18.
Monthly SOC of batteries for PV–BSS configuration.
A time series analysis for 24 h duration was conducted to study the total electrical load served. This analysis was conducted on 1 January. The individual contribution of the SPV system and BSS was plotted. The following points can be observed in Figure 19:
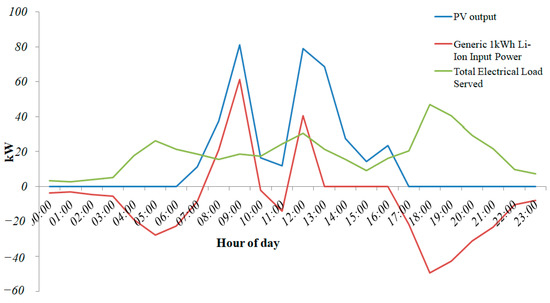
Figure 19.
Time series plot of the electrical load served by PV–BSS configuration for 1 January.
- From 0 to 6th h—during this time, the demand for electricity was zero or minimum. The energy stored in BSS served the load.
- From 6th to 17th h—as the sunlight was available from the 6th h, the SPV system started generating electricity. Now, the SPV system and BSS served the load as the demand for electricity rose during this duration.
- From 17th to 23rd h—in this duration, the demand for electricity dropped, so it was served by BSS. Additionally, during evening and night hours the SPV system cannot generate electricity.
6.2.2. Sensitivity Analysis
Before commissioning a project, it is imperative to study the impact of different parameters which affect the project’s economics. The model known as what-if analysis is generally used to perform such a study. Another name for this model is sensitivity analysis. It provides an economic model that estimates one parameter’s impact on the other. In this article, sensitivity variables were considered as inflation rate, discount rate, and project lifetime. This variation was considered as (i) inflation rate was taken as 2%, 4%, and 6%, (ii) discount rate as 6%, 8%, and 10%, and (iii) project lifetime as 20 years, 25 years, and 30 years. However, the analysis uses a noble single-fix duo to vary the approach to investigate the impact of variation of these variables on system performance.
Figure 20 presents an optimization plot in which the project lifetime was kept constant at 25 years, and the cost of energy and renewable fraction was varied. Every point in the optimization plot is a feasible solution for that particular sensitivity case. It can be observed that most obtained solutions have a high renewable fraction with a low cost of energy.
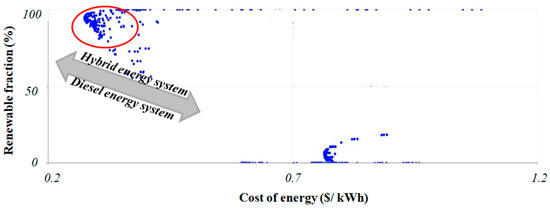
Figure 20.
Optimization plot between the cost of energy and a renewable fraction (project lifetime of 25 years).
The sensitivity variables impact cost of energy and NPC. NPC was plotted on the surface for a clear overview, and the corresponding energy cost was superimposed, as shown in Figure 21a–c. In each plot, the inflation rate and discount rate were varied while keeping the project lifetime constant. So, these three surface plots correspond to project lifetime of 20 years, 25 years, and 30 years. These plots indicate that as the inflation rate increases and, correspondingly, the discount rate decreases, a decrease in the cost of energy occurs.
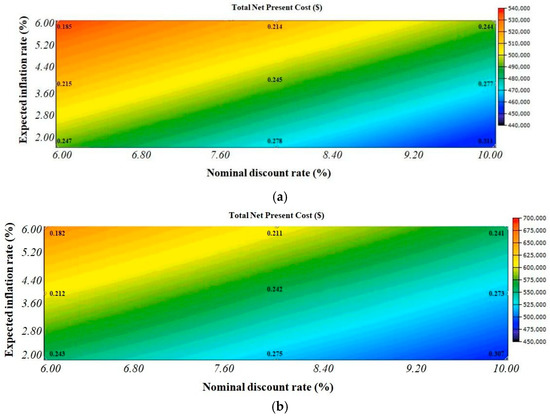
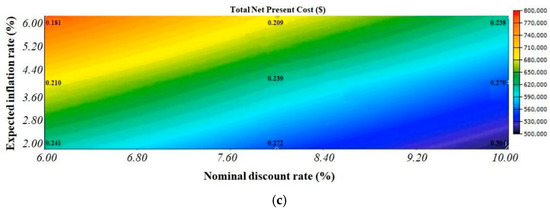
Figure 21.
Variation in NPC concerning the inflation rate and discount rate with project lifetime of (a) 20 years, (b) 25 years, and (c) 30 years.
6.3. Environmental Impact Assessment
Electricity generation using renewable resources results in the production of hydrogen, which can be used as fuel for cars and produce electricity, etc. The production of hydrogen results in the emission of CO2, which is a major concern these days. So, an estimation of CO2 emission, which can be avoided due to electricity generation from the proposed HPGP, was calculated. This calculation was conducted using Equation (14) [58].
where, E(CO2) represents the mitigating CO2 emissions, EG represents the annual electricity generated from HPGP, and FE is the emission factor for India, taken as 0.8274 kgCO2/kWh [57]. The result of this calculation is shown in Table 11. So, on commissioning this HPGP, 18,437.21 kg of CO2 can be saved from emission into the atmosphere.
Table 11.
Emission of CO2 avoided due to electricity generation from HPGP.
7. Comparison of Proposed HPGP with the Reference Case
In this article, a DG-based power plant was chosen as a reference case. The selected optimal configuration of PV–BSS was compared with this reference case. The simulation performed by HOMER software estimated a DG of 82kW. This comparison is provided in Table 12. The points observed from this comparison are as follows:
Table 12.
Comparison between the selected configurations of HPGP with the reference case.
- (i)
- The reference case provided an LCOE of $0.93 per kWh, while the proposed configuration provided $0.34 per kWh. This difference is mainly due to the cost of diesel used fuel to generate electricity in the reference case. It is estimated that diesel consumption in the reference case will be $87,284 per year. The diesel cost has a direct impact on LCOE.
- (ii)
- Initial capital investment in the reference case was $54,530, which is low compared with the selected configuration of HPGP ($470,385).
- (iii)
- It was estimated that the reference case will have high NPC ($1,747,678) and a high operating cost ($130,972) as compared with the selected configuration of HPGP (NPC will be $639,981 and the operating cost will be $13,119).
- (iv)
- The O&M cost of the reference case ($250,725) is high compared with the selected configuration of HPGP (24,495).
As DG is not used in PV–BSS configuration, it will not emit any pollutants into the atmosphere. The emission of the greenhouse, in this case, will be zero. On the other hand, if the DG-based power plant is operated throughout the year to generate electricity, then 76,565 L/year fuel will be consumed. This will emit 200,417 kg/year of carbon dioxide, which results in an increase in greenhouse gases and, hence, global warming. This comparison is presented in Table 13.
Table 13.
Comparison of emission of pollutants to the atmosphere between the selected configuration of HPGP and the reference case.
The time taken to recover the investment cost of components is known as the payback period. The selected configuration of HPGP has a payback period of 3.39 years. Table 14 presents a comparison of different hybrid power plants in different locations.
Table 14.
Comparison of off-grid hybrid systems at different locations.
8. Conclusions
- (i)
- In this paper, a stand-alone HPGP was commissioned for a part of an academic building. The optimal configuration of this stand-alone HPGP is PV(509 kW)/BSS(383 kWh). BSS is required to fulfill the electricity demand either in peak hours or when the SPV system is not able to meet the load demand.
- (ii)
- In this paper, the performance and feasibility of SPV system was analyzed. The performance ratio was 64.49% and the capacity factor was 14.90%. The performance ratio is basically the proportion of the energy available for export to the grid. This value is less than 100% because of energy loss and energy consumption during operation. The energy loss can be due to thermal losses and conduction losses. This means that 64.49% is available for export to grid and the rest is lost in energy loss and energy consumption. CF measures the amount of energy is produced by solar plant in comparison to its maximum output. CF is low in SPV systems due to the intermittent nature of solar energy.
- (iii)
- The meteorological data were taken from the NASA PDAV tool. These data helped to perform the above-mentioned calculations.
- (iv)
- The techno-economic analysis was conducted using HOMER. The initial investment was estimated to be $470,385, while NPC was $639,981. The LCOE was estimated as $0.34 per kWh.
- (v)
- The commissioning of the SPV system will also lead to zero emissions of air pollutants.
Therefore, the electricity demand of selected site can be fulfilled with by harnessing solar energy in a greater ratio in the near future.
Author Contributions
Supervision, G.F., V.V. and L.E.; writing—original draft, S.S.; writing—review and editing, P.K. and H.S. All authors have read and agreed to the published version of the manuscript.
Funding
This research received no external funding.
Conflicts of Interest
The authors declare no conflict of interest.
References
- Power Sector at a Glance ALL INDIA|Government of India|Ministry of Power. Available online: powermin.gov.in (accessed on 12 October 2021).
- Majority of New Renewables Undercut Cheapest Fossil Fuel on Cost. Available online: https://irena.org/ (accessed on 10 August 2021).
- Aryanpur, A.; Atabaki, M.S.; Marzband, M.; Siano, P.; Ghayoumi, K. An overview of energy planning in Iran and transition pathways towards sustainable electricity supply sector. Renew. Sustain. Energy Rev. 2019, 112, 58–74. [Google Scholar] [CrossRef]
- Ahmadi, A.; Ehyaei, M.A.; Doustgani, A.; Assad, M.e.; Hmida, A.; Jamali, D.H.; Kumar, R.; Li, Z.X.; Razmjoo, A. Recent residential applications of low-temperature solar collector. J. Clean. Prod. 2021, 279, 123549. [Google Scholar] [CrossRef]
- Kreishan, M.Z.; Fotis, G.; Vita, V.; Ekonomou, L. Distributed generation islanding effect on distribution networks and end user loads using the load sharing islanding method. Energies 2016, 9, 956. [Google Scholar] [CrossRef]
- Zafeiropoulou, M.; Mentis, I.; Sijakovic, N.; Terzic, A.; Fotis, G.; Maris, T.I.; Vita, V.; Zoulias, E.; Ristic, V.; Ekonomou, L. Forecasting transmission and distribution system flexibility needs for severe weather condition resilience and outage management. Appl. Sci. 2022, 12, 7334. [Google Scholar] [CrossRef]
- National Portal of India. Available online: https://www.india.gov.in/india-glance/profile (accessed on 17 October 2022).
- Kumar, P.; Sharma, H.; Pal, N.; Sadhu, P.K. Comparative assessment and obstacles in the advancement of renewable energy in India and China. Probl. Ekorozw. 2019, 14, 191–200. [Google Scholar]
- Kumar, R.S.; Raghav, L.P.; Raju, D.K.; Singh, A.R. Customer-oriented energy demand management of grid connected microgrids. Int. J. Energy Res. 2021, 45, 18695–18712. [Google Scholar] [CrossRef]
- Behura, A.K.; Kumar, A.; Rajak, D.K.; Pruncu, C.I.; Lamberti, L. Towards better performances for a novel rooftop solar PV system. Sol. Energy 2021, 216, 518–529. [Google Scholar] [CrossRef]
- Kumar, P.; Pal, N.; Sharma, H. Techno-economic analysis of solar photovoltaic/diesel generator hybrid system using different energy storage technologies for isolated islands of India. J. Energy Storage 2021, 41, 102965. [Google Scholar] [CrossRef]
- Ekonomou, L.; Fotis, G.; Vita, V.; Mladenov, V. Distributed generation islanding effect on distribution networks and end user loads using the master-slave islanding method. J. Power Energy Eng. 2016, 4, 1–24. [Google Scholar] [CrossRef]
- Sambhi, S.; Sambhi, S.; Bhadoria, V.S. IoT based optimized and secured ecosystem for energy internet: The state of the art. In Internet of Things in Business Transformation: Developing an Engineering and Business Strategy for Industry 5.0; Scrivener Publishing LLC: Beverly, MA, USA, 2021; pp. 91–126. [Google Scholar] [CrossRef]
- Praveenkumar, S.; Agyekum, E.B.; Ampah, J.D.; Afrane, S.; Velkin, V.I.; Mehmood, U.; Awosusi, A.A. Techno-economic optimization of PV system for hydrogen production and electric vehicle charging stations under five different climatic conditions in India. Int. J. Hydrog. Energy 2022, in press. [Google Scholar] [CrossRef]
- Vidinopoulos, A.; Whale, J.; Hutfilter, U.F. Assessing the technical potential of ASEAN countries to achieve 100% renewable energy supply. Sustain. Energy Technol. Assess. 2020, 42, 100878. [Google Scholar] [CrossRef]
- William, M.A.; Suárez-López, M.J.; Soutullo, S.; Hanafy, A.A. Building envelopes toward energy-efficient buildings: A balanced multi-approach decision making. Int. J. Energy Res. 2021, 45, 21096–21113. [Google Scholar] [CrossRef]
- Rout, A.; Mainali, B.; Singh, S.; Solanki, C.S.; Bhati, G.S. Assessing the financial sustainability of rural grid electrification pathway: A case study of India. Sustain. Prod. Consum. 2021, 25, 27–42. [Google Scholar] [CrossRef]
- Eshraghi, A.; Salehi, G.; Heibati, S.; Lari, K. An assessment of the effect of different energy storage technologies on solar power generators for different power sale scenarios: The case of Iran. Sustain. Energy Technol. Assess. 2019, 34, 62–67. [Google Scholar] [CrossRef]
- Jawaharlal Nehru National Solar Mission (Phase I, II and III). Available online: https://www.iea.org/policies/4916-jawaharlal-nehru-national-solar-mission-phase-i-ii-and-iii (accessed on 15 September 2021).
- The Paris Agreement. Available online: https://unfccc.int/process-and-meetings/the-paris-agreement/the-paris-agreement (accessed on 15 September 2021).
- What Is Kyoto Protocol? Available online: https://unfccc.int/kyoto_protocol (accessed on 29 September 2021).
- International Solar Alliance. Available online: https://isolaralliance.org/ (accessed on 29 September 2021).
- With 2,245 MW of Commissioned Solar Projects, World’s Largest Solar Park Is Now at Bhadla. Available online: https://mercomindia.com/world-largest-solar-park-bhadla/ (accessed on 12 October 2022).
- India’s Utility-Scale Solar Parks a Global Success Story. Available online: https://ieefa.org/wp-content/uploads/2020/05/Indias-Utility-Scale-Solar-Parks-Success-Story_May-2020.pdf (accessed on 15 September 2021).
- PM Modi to Inaugurate 30-GW Renewable Energy Park at Kutch. Available online: https://www.thehindubusinessline.com/news/national/pm-modi-to-inaugurate-30-gw-renewable-energy-park-at-kutch/article33241348.ece (accessed on 15 September 2021).
- Solar Policy. Available online: http://ipgcl-ppcl.gov.in/renewable.htm (accessed on 12 October 2022).
- Why Despite Touching 1 Degree Celsius in Delhi, Mercury Won’t Touch Zero-Mark. Available online: https://www.indiatoday.in/cities/delhi/story/delhi-sees-record-winter-temperature-drop-imd-1759412-2021-01-15 (accessed on 16 October 2022).
- Google Maps. Available online: https://maps.google.com (accessed on 10 February 2021).
- NASA Power—Data Access Viewer. Available online: https://power.larc.nasa.gov/data-access-viewer/ (accessed on 10 February 2021).
- HOMER Software. Available online: https://www.homerenergy.com (accessed on 20 February 2021).
- Solar Resource Glossary. Available online: https://www.nrel.gov/grid/solar-resource/solar-glossary.html (accessed on 20 February 2021).
- Direct Solar Irradiation. Available online: https://www.sciencedirect.com/topics/engineering/direct-normal-irradiation (accessed on 20 February 2021).
- Solar Azimuth Angle. Available online: https://www.sciencedirect.com/topics/engineering/solar-azimuth-angle (accessed on 20 February 2021).
- HOMER Pro 3.15. Available online: https://www.homerenergy.com/products/pro/docs/latest/index.html (accessed on 15 March 2021).
- Yan, P.; Zhu, Y.; Pan, X.; Ji, H. A novel flame-retardant electrolyte additive for safer lithium-ion batteries. Int. J. Energy Res. 2021, 45, 2776–2784. [Google Scholar] [CrossRef]
- Performance Index. Available online: https://pvpmc.sandia.gov/modeling-steps/5-ac-system-output/pv-performance-metrics/performance-index/ (accessed on 27 March 2021).
- Techno-Economic Analysis. Available online: https://www.nrel.gov/analysis/techno-economic.html (accessed on 30 March 2021).
- NREL—Monotoring System Performance. Available online: https://www.nrel.gov/docs/fy11osti/50643.pdf (accessed on 20 March 2021).
- Kumar, P.; Pal, N.; Sharma, H. Performance analysis and evaluation of 10 kWp solar photovoltaic array for remote islands of Andaman and Nicobar. Sustain. Energy Technol. Assess. 2020, 42, 100889. [Google Scholar] [CrossRef]
- Percis, E.S.; Nalini, A.; Jenish, T.N.; Jayarajan, J.; Bhuvaneswari, S.; Rama, S.T. Design of a self-sustained hybrid renewable energy microgrid for rural electrification of dry lands. Int. J. Energy Res. 2021, 45, 8316–8326. [Google Scholar] [CrossRef]
- Sijakovic, N.; Terzic, A.; Fotis, G.; Mentis, I.; Zafeiropoulou, M.; Maris, T.I.; Zoulias, E.; Elias, C.; Ristic, V.; Vita, V. Active System Management Approach for Flexibility Services to the Greek Transmission and Distribution System. Energies 2022, 15, 6134. [Google Scholar] [CrossRef]
- Kumar, S.P.; Agyekum, E.B.; Qasim, M.A.; Alwan, N.T.; Velkin, V.I.; Shcheklein, S.E. Experimental assessment of thermoelectric cooling on the efficiency of PV module. Int. J. Renew. Energy Res. IJRER 2022, 12, 13087. [Google Scholar] [CrossRef]
- Praveenkumar, S.; Gulakhmadov, A.; Agyekum, E.B.; Alwan, N.T.; Velkin, V.I.; Sharipov, P.; Safaraliev, M.; Chen, X. experimental study on performance enhancement of a photovoltaic module incorporated with CPU heat pipe—A 5E analysis. Sensors 2022, 22, 6367. [Google Scholar] [CrossRef]
- Chabachi, S.; Necaibia, A.; Abdelkhalek, O.; Bourajou, A.; Ziane, A.; Hamouda, M. Performance analysis of an experimental and simulated grid connected photovoltaic system in southwest Algeria. Int. J. Energy Environ. Eng. 2022, 13, 831–851. [Google Scholar] [CrossRef]
- Bhakta, S.; Mukherjee, V. Solar potential assessment and performance indices analysis of photovoltaic generator for isolated Lakshadweep Island of India. Sustain. Energy Technol. Assess. 2016, 17, 1–10. [Google Scholar] [CrossRef]
- Al-Badi, A. Performance assessment of 20.4 kW eco-house grid-connected PV plant in Oman. Int. J. Sustain. Eng. 2020, 13, 230–241. [Google Scholar] [CrossRef]
- Mudgil, K.; Yadav, R.K.; Tiwari, G.N. Performance evaluation of 12 kWP rooftop grid-connected photovoltaic plant installed under net metering in Delhi, India. Int. J. Ambient. Energy 2022, 43, 788–794. [Google Scholar] [CrossRef]
- Mondol, J.D.; Yohanis, Y.; Smyth, M.; Norton, B. Long term performance analysis of a grid connected photovoltaic system in Northern Ireland. Energy Convers. Manag. 2006, 47, 2925–2947. [Google Scholar] [CrossRef]
- Baghel, N.S.; Chander, N. Performance comparison of mono and polycrystalline silicon solar photovoltaic modules under tropical wet and dry climatic conditions in East-Central India. Clean Energy 2022, 6, 165–177. [Google Scholar] [CrossRef]
- Cheruiyot, W.K.; Tonui, J.K.; Limo, S.C. Performance evaluation of 780 Wp rooftop solar PV power backup system in Western Kenya. J. Energy Res. Rev. 2021, 8, 1–9. [Google Scholar] [CrossRef]
- Boddapati, V.; Nandikatti, A.S.R.; Daniel, S.A. Techno-economic performance assessment and the effect of power evacuation curtailment of a 50 MWp grid-interactive solar power park. Energy Sustain. Dev. 2021, 62, 16–28. [Google Scholar] [CrossRef]
- Saxena, A.K.; Saxena, S.; Sudhakar, K. Energy performance and loss analysis of 100 kWp grid-connected rooftop solar photovoltaic system. Build. Serv. Eng. Res. Technol. 2021, 42, 485–500. [Google Scholar] [CrossRef]
- Kymakis, E.; Kalykakis, S.; Papazoglou, T.M. Performance analysis of a grid connected photovoltaic park on the island of Crete. Energy Convers. Manag. 2009, 50, 433–438. [Google Scholar] [CrossRef]
- Falih, H.; Hamed, A.J.; Khalifa, A.H.N. Techno-economic assessment of a hybrid connected PV solar system. Int. J. Air-Cond. Refrig. 2022, 30, 3. [Google Scholar] [CrossRef]
- Oloya, I.T.; Gutu, T.J.L.; Adaramola, M.S. Techno-economic assessment of 10 MW centralised grid-tied solar photovoltaic system in Uganda. Case Stud. Therm. Eng. 2021, 25, 100928. [Google Scholar] [CrossRef]
- Attari, K.; Elyaakoubi, A.; Asselman, A. Performance analysis and investigation of a grid-connected photovoltaic installation in Morocco. Energy Rep. 2016, 2, 261–266. [Google Scholar] [CrossRef]
- De Miguel, A.; Bilbao, J.; Cazorro, J.R.; Martin, C. Performance analysis of a grid connected PV system in a rural site in the Northwest of Spain. In Proceedings of the World Renewable Energy Congress VII, Cologne, Germany, 29 June–5 July 2002. [Google Scholar]
- Praveenkumar, S.; Agyekum, E.B.; Kumar, A.; Ampah, J.D.; Afrane, S.; Amjad, F.; Velkin, V.I. Techno-economics and the identification of environmental barriers to the development of concentrated solar thermal power plants in India. Appl. Sci. 2022, 12, 400. [Google Scholar] [CrossRef]
- Chimtavee, A.; Ketjoy, N.; Sriprapha, K.; Vaivudh, S. Evaluation of PV generator performance and energy supplied fraction of the 120 kWp PV microgrid system in Thailand. Energy Procedia 2011, 9, 117–127. [Google Scholar] [CrossRef]
- Kumar, A.; Singh, A.R.; Deng, Y.; He, X.; Kumar, P.; Bansal, R.C. Integrated assessment of a sustainable microgrid for a remote village in hilly region. Energy Convers. Manag. 2019, 180, 442–472. [Google Scholar] [CrossRef]
- Wu, T.; Zhang, H.; Shang, L. Optimal sizing of a grid-connected hybrid renewable energy systems considering hydroelectric storage. Energy Sources Part A: Recovery Util. Environ. Eff. 2020, 1–17. [Google Scholar] [CrossRef]
- Leithon, J.; Werner, S.; Koivunen, V. Cost-aware renewable energy management: Centralized vs. distributed generation. Renew. Energy 2020, 147, 1164e1179. [Google Scholar] [CrossRef]
- Gebrehiwot, K.; Mondal, A.H.; Ringler, C.; Gebremeskel, A.G. Optimization and cost-benefit assessment of hybrid power systems for off-grid rural electrification in Ethiopia. Energy 2019, 177, 234e246. [Google Scholar] [CrossRef]
- Sherwani, A.F.; Asjad, M.; Haleem, A. Performance evaluation of solar photovoltaic electricity-generating systems: An Indian perspective. Int. J. Sustain. Eng. 2019, 12, 70–75. [Google Scholar] [CrossRef]
- Razmjoo, A.; Kaigutha, L.G.; Rad, M.A.V.; Marzband, M.; Davarpanah, A.; Denai, M. A Technical analysis investigating energy sustainability utilizing reliable renewable energy sources to reduce CO2 emissions in a high potential area. Renew. Energy 2021, 164, 46e57. [Google Scholar] [CrossRef]
- Li, J.; Liu, P.; Li, Z. Optimal design and techno-economic analysis of a solar-wind-biomass off-grid hybrid power system for remote rural electrification: A case study of west China. Energy 2020, 208, 118387. [Google Scholar] [CrossRef]
- Zhang, G.; Xiao, C.; Razmjooy, N. Optimal operational strategy of hybrid PV/wind renewable energy system using Homer: A case study. Int. J. Ambient. Energy 2020, 43, 3953–3966. [Google Scholar] [CrossRef]
- Odou, O.D.T.; Bhandari, R.; Adamou, R. Hybrid off-grid renewable power system for sustainable rural electrification in Benin. Renew. Energy 2020, 145, 1266e1279. [Google Scholar] [CrossRef]
- Ramesh, M.; Saini, R.P. Dispatch strategies based performance analysis of a hybrid renewable energy system for a remote rural area in India. J. Clean. Prod. 2020, 259, 120697. [Google Scholar] [CrossRef]
- Das, S.; Ray, A.; De, S. Optimum combination of renewable resources to meet local power demand in distributed generation: A case study for a remote place of India. Energy 2020, 209, 118473. [Google Scholar] [CrossRef]


Publisher’s Note: MDPI stays neutral with regard to jurisdictional claims in published maps and institutional affiliations. |
© 2022 by the authors. Licensee MDPI, Basel, Switzerland. This article is an open access article distributed under the terms and conditions of the Creative Commons Attribution (CC BY) license (https://creativecommons.org/licenses/by/4.0/).