Review

Electric Bus Scheduling and Timetabling, Fast Charging Infrastructure Planning, and Their Impact on the Grid: A Review

1
Department of Building, Civil and Environmental Engineering, Concordia University, Montreal, QC H3G 1M8, Canada
2
Department of Electrical and Computer Engineering, Concordia University, Montreal, QC H3G 1M8, Canada
*
Author to whom correspondence should be addressed.
Energies 2022, 15(21), 7919; https://doi.org/10.3390/en15217919
Submission received: 20 September 2022 / Revised: 13 October 2022 / Accepted: 17 October 2022 / Published: 25 October 2022
(This article belongs to the Section E: Electric Vehicles)

Abstract

:
Transit agencies are increasingly embracing electric buses (EB) as an energy-efficient and emission-free alternative to the conventional bus fleets. They are rapidly replacing conventional buses with electric ones. As a result, emerging challenges of electrifying public transportation bus networks in cities should be addressed. Introducing electric buses to the bus transit system would affect the public transit operation planning steps. The steps are network design, timetabling, bus scheduling, and crew scheduling. Regarding the functional and operational differences between conventional buses and electric buses, such stages should be changed and optimized to enhance the level of service for the users while reducing operating costs for service providers. Many mathematical optimization models have been developed for conventional buses. However, such models would not fit the electric buses due to EBs’ limited traveling range and long charging time. Therefore, new mathematical models should be developed to consider the unique features of electric buses. We present a comprehensive literature review to critically review and classify the work done on these topics. This paper compares the studies that have been done in this field and highlight the missing links and gaps in the considered papers, and the potential future studies that could be done. The considered papers cover the integration of timetabling and vehicle scheduling, recharging scheduling planning, and fast charging infrastructure location planning and its impacts on the grid. The main goal of this research is to highlight the research gaps and potential directions for future studies in this domain to encourage more realistic and applicable models and solution approaches for fully electric bus transit systems.

1. Introduction

Greenhouse gas emitting energy sources are responsible for global warming. Thus, replacing such energy sources with clean and renewable sources of energy has become crucial during the past few decades. According to Figure 1, transportation is one of the significant emission sectors, contributing 22% of the total C O 2 emissions. Road transport accounts for three-quarters of transport emissions and 15% of total C O 2 emissions [1]. For example, in the UK, the total emission from buses is around 4.3 million tons if we assume that the average emission rate is 822 g per km for each bus [2]. That is why public transport has become an attractive area for potential emission reduction [3]. Electrifying transportation is a way to address both urban air pollution and the energy crisis. The world is witnessing a rapid increase in electric vehicles and electric buses because of the increasing concerns about air quality, greenhouse gas emissions, and energy demand. The electrification of buses could significantly reduce environmental concerns, decrease the exploitation of natural resources, and provide better fuel economy and greater energy efficiency [4]. According to [3], electrifying public buses will improve living conditions in metropolitan areas. Other advantages of using electric buses are their low noise levels and regenerative braking system for recovering energy [5]. On the other hand, EBs’ operational range is shorter than that of diesel buses, and their recharging process via depot charging is considerably more time-consuming than refueling. Furthermore, the costs of electric buses are significantly higher than conventional buses, due to the buses themselves and their batteries, charging infrastructure, and establishment costs.
The number of electric buses in cities worldwide has grown in recent years. A recent study by Bloomberg New Energy Finance Electric predicted that EBs will replace over 47% of the world’s total city bus fleet by 2025 [6]. Figure 2 illustrates the year-over-year growth of the battery-electric bus (BEB) fleet in European Union (EU) countries from 2021 to 2022 [7]. In 2017, 9% of all buses sold in Europe were EBs [8]. From 2022 to 2027, the market for electric buses in Europe is anticipated to grow by 18.6%. This shows the trend of switching from conventional buses to electric buses.
Cities are struggling to improve their public transport systems’ efficiency, especially bus transit systems. Operational processes are one of the most critical aspects of the bus transit system’s performance [9]. Bus timetabling (TT) and scheduling are among the most vital processes in bus operations. Bus timetabling aims to collect departure and arrival times for all trips and routes in the network. It seeks to maximize passengers’ satisfaction [10] through minimizing the waiting time, transferring time, increasing seat availability, etc. The process of assigning vehicles to the trips of a specified timetable is known as vehicle scheduling (VS). It aims to use the minimum number of vehicles while minimizing operational costs. Bus scheduling has a notable impact on operational costs and passenger travel times. With the increase in electric buses, a new set of scheduling and timetabling problems has emerged. Electric buses’ limited driving range and long recharging times should be considered in the studies in this field. For example, charging during off-peak hours could reduce both the fleet size and impact on the grid. Thus, timetabling and bus scheduling should be coordinated and changed regarding the new constraints of electric buses to satisfy both bus operators’ and public users’ interests. Furthermore, to improve bus schedules, a reasonable charging strategy is required [11].
The limited traveling range of EBs has prompted new research in the literature on the problem of locating charging stations for electric buses. This task involves finding the best locations for fast-charging infrastructures on the bus transit network while determining the optimum number of such stations. Public transportation agencies introduced fast-charging technology with high voltage power to recharge e-buses in several minutes to address long charging times and limited driving range issues. On the other hand, fast-charging station location planning makes battery-electric bus scheduling more complex [12]. However, bus transit systems that use fast-charging technologies are gaining popularity. This approach needs extensive infrastructure for the installation of charging stations along bus routes. Moreover, compared to depot charging, charging stations at bus terminals are less expensive and more suited to bus electrification throughout the life cycle [13].
Most studies deal with public transit operation planning steps sequentially. This means that the output of an operational planning step would be the input of the subsequent step. The drawback of this approach is the inefficient public transit operation compared to the complete integration approach. The complete integration approach investigates the problem as a whole integrated problem that simultaneously considers each step of public transit planning. For instance, slight changes in the timetable of buses could result in a better vehicle schedule, and determining the location of fast charging infrastructures based on the bus schedules could reduce the operational costs of vehicle scheduling in a few years.

The Surveying Method

We wrote this review paper based on a methodological framework by choosing several keywords to look for papers that fit the scope of this article. The selected keywords were electric bus scheduling, electric bus timetabling, fast charging location, charging schedule fast charging infrastructure, vehicle to grid (V2G) and impact on the grid. After the articles’ titles and abstracts were initially reviewed, the relevant papers were thoroughly examined, their content was analyzed in detail, and each study’s methodology was explained. Google scholar was the scientific database used to track the articles that fall within the purview of this study. Table 1 illustrates the comparison of this survey with other review papers in this scope.
This literature review has been structured as follows: Different types of electric buses and their charging technologies will be discussed in Section 2. The theoretical background and related works of fast charging infrastructure location planning, scheduling, timetabling of electric buses, and the impact of electric buses’ charging stations on the grid are reviewed in Section 3. Section 4 describes the challenges and limitations of electric buses planning. Finally, Section 5 addresses future research, potential research directions, and gaps in earlier studies. Figure 3 represents a scheme of the group of problems that will be reviewed in this paper.

2. Different Types of EBs and Charging Technologies

Electric buses are mainly divided into three groups, hybrid electric, fuel cell electric, and fully electric, as shown in Figure 4. The former is categorized as parallel, series, and series-parallel. In a parallel design, both the combustion engine end electric motors could propel the bus, unlike the series type, in which only the electric motor is used for the propulsion. The combustion engine supplies the energy of the electric motor. The combination of such two types is known as series-parallel, which benefits from the advantages of both types [14]. Hybrid electric buses can travel longer compared to fully electric ones, and they have very minor emissions. The issues related to this kind of bus are managing the sources of their energy and optimizing the sizes of engines and batteries. Fully electric buses only rely on electric power stored in their batteries to operate. They are not dependent on oil, so they have no emissions, and the travel range of such EBs is dependent on the capacity of the batteries. On the other hand, the high price of batteries and long charging time, along with the sparsity of charging stations, are the main issues of buses of this kind.
Different charging strategies for electric buses are fast/quick charging, depot/overnight charging, battery swapping, and continuous charging. Quick or fast charging requires a large amount of voltage to the recharge buses in a short time (a few minutes). Depot or overnight charging refers to the charging poles which use less voltage to recharge buses but in a longer time. In battery swapping, electric buses’ batteries will be replaced with new charged ones. The last one, continuous charging, includes wireless charging and overhead lines. With this type, buses will be charged all the time during their trips. Table 2 summarizes the information about different charging technologies and bus features for each charging type (for more detailed information, readers are referred to [19]).
Table 3 represents the differences between conventional and fully electric buses in terms of environment, economic, and energy points of view (for more information, readers are referred to [28].) Note that the manufacturing and operational costs of electric buses and conventional ones vary, so the average costs are compared.
The advantages and disadvantages of each charging technology follow (see Table 4):

2.1. Depot Charging

It has high efficiency and multiple charring levels. This charging technique could help reduce the grid’s power loss by using the vehicle-to-grid (V2G) configuration. Compared to fast-charging technology, this charging technology does not require upgrading in its lifetime. Additionally, it will provide higher grid stability and higher profits for bus depot operators. On the other hand, it has a complex infrastructure and is highly dependent on electricity grid restrictions. The weights and costs of buses that use this charging technique are higher in comparison to those emplying other charging technologies. The recharging procedure is time consuming, as it takes 4 to 6 h to completely charge a battery. Moreover, if bus depot operators use a vehicle-to-grid configuration, the lifetime of batteries will decrease.

2.2. Fast Charging

This charging technique is the most efficient way to recharge electric buses in terms of time. The charging time is somewhere between 5 and 10 min. As the capacity of electric buses which use this charging technology is lower than that of buses that use depot or battery swapping technology, the weight and cost are lower. However, the travel range is limited. Additionally, the transformers of such charging techniques need to be upgraded, and this causes low grid stability. Low bus-depot-operator profits is another disadvantage of fast charging. For more information and explanations, readers are referred to [31,32].
Pantograph charging belongs to this category and is typically more costly and logistically difficult than depot charging. To establish charging stations along their routes, agencies might need to purchase land or right of way. Fast chargers, which are more expensive than slower chargers, are necessary for en-route charging. Due to demand charges and time-of-use rates, agencies have no control over when en-route charging takes place, resulting in expensive power expenditures. The placement of chargers in open outdoor areas has a variety of problems as well: pantograph chargers being deliberately damaged, a recycling truck demolishing charging infrastructure, complaints from neighbors who do not like having chargers next to their homes, and turning off below −20 °F are some difficulties that transit agencies could encounter. It may be more difficult for agencies to repair or maintain fast chargers when these or other issues arise, since maintenance specialists must travel to get to them. Additionally, if one en-route charger is not working, it might occasionally affect the dependability of the transit service when relying on fast charging infrastructure [33]. The cost of pantograph charging stations for battery electric buses is much higher than stationary overnight depot charging. However, the battery cost for buses that use overnight charging is higher than that of fast-charging electric buses.

2.3. Battery Swapping

Quick battery replacement, benefits from V2G technology, and extended battery life due to slow charging are the main advantages of battery swapping technology. Nevertheless, a high initial cost and area utilization are the drawbacks of this technology. It requires a huge investment to rent a large area to store the batteries, a large number of expensive batteries, and equipment.

2.4. Wireless Charging

The recharging procedure is safe and convenient, and there is no need to stop for recharging. Furthermore, there is no need for a standard connector compared to conductive charging. On the other hand, it does not provide strong power, and it has a low range of power transmission. Moreover, it requires a huge amount of investment for en-route charging infrastructure on the roads.
Table 4. Advantages and disadvantages of different charging technologies.
Charging TechnologyAdvantagesDisadvantages
Depot charging [34,35]Multiple charging levelBatteries’ lifetime will decrease due to V2G operation
Providing V2G configurationLong recharging time
High efficiencyIncrease the number of deadhead trips to/from the depot
Less grid lossLarger battery packs, more weight and cost
No need to leases the property around the service areaRestrictions on placing bus routes due to EBs’ travel range limitation and deadhead trips to/from depot
The upfront capital cost is often cheaper
Fast charging [31,32]Less recharging durationVoltage instability
Cover longer bus routes compared to depot chargingHigh cost of fast charging infrastructure
Little time loss for recharging during the operation hoursDifficulty of placing fast chargers in tight and crowded city downtowns
Require smaller batteries
Wireless charging [36,37]Recharging process is safe and convenient without using any plugsHuge investment cost for establishing on road infrastructure
No need for socket and connectorLow range of power transmission
Capability of recharge while the bus is movingWeak power transfer
Battery swapping [38,39,40]Fully charged batteries replaced in a short timeMore expensive than conventional buses due to ownership or rent of a large battery swap station
Prevent the battery capacity and lifetime fade by slow chargingRequires a large amount of budget for buying batteries
Provide V2G configuration to balance the electricity demand and loadRequires a large area for swapping batteries and their equipment

3. Theoretical Background and Related Works

In this section, first, brief background regarding different types of charging station location planning approaches are described. Then, a detailed review of the literature on fast charging infrastructure locations and recharging planning is given. In the next part, a concise overview of bus scheduling and timetabling is presented, followed by a comprehensive investigation of studies focusing on the integration of bus scheduling and timetabling.

3.1. Charging Station Location Planning

There are several main approaches for locating charging infrastructures for electric vehicles, as follows:

3.1.1. Node-Based Approach

This approach would satisfy the charging demand by finding the best locations/nodes for chargers among the potential set of nodes. P-median and p-center are among the most common models to deal with node-based approaches. The p-median model minimizes the average distance between the charging demand nodes and the closest charging infrastructures [41]. In comparison, p-center aims to minimize the maximum distance between demand nodes and charging infrastructure location [42]. Baouche et al. [43] optimized the charging station locations concerning the p-dispersion constraint. The p-dispersion constraint would not allow the charging infrastructures to be placed at less than a predefined threshold. Other classic facility location approaches are maximal covering and set covering. The former seeks to cover the most charging demand of EVs [44], and the latter tries to minimize the total installed charging infrastructures while satisfying all the charging demands [45].

3.1.2. Flow-Based Approach

The flow-based approach is more suitable than the node-based approach for vehicles, since the cars move along the roads instead of remaining idle at specific nodes. Kuby and Lim [46] developed a flow-refueling location model based on the flow-capturing approach to find the best locations for refueling stations. Maximizing the total volume of flow was the objective of this study.

3.1.3. Path-Based Approach

Unlike the past two approaches, which focused on flows or nodes, the path-based focuses on vehicles paths. Path refueling location model and sub-path location model are the two branches of this approach. The objective is to find the best places for the charging infrastructure on the path, to ensure that vehicles can complete their trips on that path [47,48].

3.1.4. Equilibrium-Based Approach

This approach analyzes the impact of charging stations’ locations on the travel behavior of electric vehicle drivers [49,50]. An equilibrium modeling framework was presented by He et al. [51] to maximize the social benefit regarding the plug-in hybrid electric vehicles (PHEV) recharging routing. The objective of the study was to find the best places for charging stations for PHEVs. They considered the availability of charging stations, route choice of electric vehicles, and electricity price to formulate a mathematical allocation model.
According to [52], the path-based approach is the most common approach for solving charging station location problems for electric buses. Such problems are classified into two categories: charging lanes and charging stops. The former has attracted significant attention recently and is the most advanced charging technology. In [53], wireless charging location planning for lanes and optimizing battery capacity were studied, and particle swarm optimization was used to find the best location and optimum battery capacity. Liu and Song [54] studied the same problem while considering the uncertain nature of electric buses’ energy consumption. They dealt with the uncertainty of buses’ energy consumption and travel time by adopting a robust optimization approach followed by the affinely adjustable robust counterpart (AARC). In a more recent study, Helber et al. [55] investigated the wireless charging location planning for an airport’s electric shuttle buses. For the latter, electric buses are supposed to be charged only at several specific spots on the road network. Kunith et al. [56] presented a capacitated set-covering problem to solve a joint fast-charging infrastructure location and battery capacity problem. The authors developed a mixed-integer linear programming (MILP) formulation to find the optimum number of chargers and their optimal locations. For inductive and conductive charging infrastructure planning, Xylia et al. [57] studied a case study in an urban context in Stockholm. The objective was to minimize the total energy consumption and operational costs of the system.
In the overnight or depot charging strategy, the locations of depots is a critical factor. Charging’s impacts on the grid [58], the establishing costs of charging stations, and operational costs such as deadhead trips would be affected by charging station locations [59]. Another important issue addressed by [60,61] is the trade-off between the accessibility of overnight charging stations and the total establishment cost of such stations. Moreover, the possibility of upgrading existing depots with charging infrastructure should be considered [52], as should the locations where the continuous charging infrastructure is to be and how the electrified distance of the road affects the network planning of bus lines too. There is no paper considering the effects of wireless charging on the network route design of bus lines. By introducing fast chargers for electric buses, a group of new location planning problems has emerged in the scope of the network design problem. Fast charging infrastructures are new inputs for the network route design, and the best locations for bus stops and such infrastructures should be considered simultaneously [62].

Fast Charging Infrastructure Location Planning (FCILP)

Electric buses have not yet gained widespread adoption compared to other electric vehicles due to their high ownership and operating costs, their long charging times, and the uneven spatial distribution of charging infrastructure. Furthermore, dynamic environmental factors, such as unanticipated traffic congestion, varying travel demand, and even different weather conditions, can considerably impact electric buses’ charging efficiency [63]. Another critical factor is the lack of adequate charging infrastructure for large-scale EB fleets. As a result, studying the location planning of charging infrastructure for electric buses is essential. Pantograph chargers can decrease the number of deadhead trips to and from the depots, decrease the battery capacity, and minimize energy usage compared to standard overnight/depot charging. Although fast-charging technologies can shorten the time it takes for buses to charge, they significantly increase operational costs. As a result, the costs of installing and planning of fast-charging stations should be factored into the planning process. The simple formulation of charging station location planning is presented in the Appendix A.3. Kunith et al. [64] performed one of the first studies of fast charging infrastructure planning in 2014. They aimed to find the optimum number of fast chargers and their best locations in the network, considering the operational constraints. The distribution and bus operating networks have been considered for this problem in [65]. The model’s goals were to reduce the total installation costs of fast chargers, their operating and maintenance expenses, travel cost to the chargers, and the cost of their power loss. To find the number of required fast charging infrastructure, the affinity propagation method was used, and the best locations of chargers and their optimum capacities were obtained by binary particle swarm optimization (BPSO). Another optimization method to deal with the fast charging infrastructure location planning is enhanced heuristic descent gradient (EHDG). Othman et al. [66] used this algorithm to find the optimum locations for placing fast chargers. Csonka [67] solved the problem for both static and dynamic charging to find the best locations for charging infrastructures. Static charging and dynamic charging refer to conductive charging stations and overhead wire charging lanes, respectively. The amount of charging in each charging event was a decision variable in this study.
Bus systems that use fast-charging technologies are gaining popularity. This trend necessitates extensive studies on optimizing the location planning of establishing charging station infrastructures along bus routes. Kunith et al. [56] proposed a mixed-integer linear programming model to simultaneously optimize electric buses’ fast-charging infrastructure planning and battery capacity for each line. Through a set covering problem, the best locations and the optimum number of chargers were determined. He et al. [68] addressed the same problem by considering installing an energy storage system to store the energy in off-peak hours and supply it to fast-charging infrastructure in on-peak hours. A reduction of 9.2% in the total system costs was the result of this study compared to Kunith et al.’s outcome [56]. Olmos et al. [69] investigated the problem of locating opportunity charging infrastructure for hybrid and fully electric buses to find the best locations for such facilities. The two other objective functions in their paper were the power rates of opportunity charging infrastructures and the sizes of energy storage systems. Battery aging and partial charging for the problem of charging station location were considered in [70]. The objective was to reduce total costs, which included the price of establishing charging stations and the costs of purchasing the vehicles to be used. Liu et al. [71] dealt with the problem while considering uncertain energy consumption for battery-electric buses. They developed a mixed-integer linear programming model based on a robust optimization approach to find the minimum total implementation cost. The combination of charging station location planning and the power grid was studied in the paper of Lin et al. [52] in 2019. Other extensions of this problem are determining the best capacity for e-buses [56], designing transit route networks [62], and determining charging schedule for each fast-charging infrastructure [12].
In a recent study by Hu et al. [72], the combination of opportunity charging location and the charging scheduling problem of EBs was studied. They considered time-of-use electricity pricing and added the waiting time of passengers due to the charging process during the trips as a penalty cost. They aimed to minimize the cost of purchasing both opportunity chargers and electric buses’ batteries, reduce the total charging costs, and minimize the passengers’ extra waiting time. To address the uncertainties related to trip time and passenger travel demand, a robust optimization technique was suggested.
The combination of depot charging planning and electric bus scheduling (EBS) was considered in the paper of Olsen and Kliewer [73]. The objective was to minimize the total cost, including those of installing depot chargers, vehicle costs, and operating costs. A metaheuristic solution approach based on variable neighborhood search (VNS) was developed to solve this problem. They showed that simultaneously optimizing these two problems would yield better results than sequential planning. The multi-depot and multi-vehicle-type version of this problem for refueling charging stations was studied by Li et al. [74] in 2019. They aimed to minimize the numbers of required buses and refueling stations, maintenance costs, energy consumption, and external emission costs. They developed an integer linear program to solve the small-scale problems and proposed a time-space bus flow network to deal with large-scale problems. Alwesabi et al. [21] presented a mixed-integer linear programming formulation to simultaneously find the optimum fleet size, battery capacity, and dynamic wireless charging locations. The combination of electric bus scheduling and fast charging infrastructure location planning has not been widely studied in the literature. The most similar research was the work of Stumpe et al. [75]. The authors studied the simultaneous optimization of electric bus scheduling and opportunity charging location planning. They proposed a new mixed-integer linear formulation and solved it using VNS.
Some public transit operators cooperate with companies that provide operational and strategic planning services. Li et al. [76] examined the fast-charging-infrastructure location planning in Chengdu under the build-operate-transfer (BOT) model. The transit agency tries to minimize the present value of deadhead trips and charging services. They addressed the location problem in a multistage scenario due to the gradual transport electrification. Fast-wireless-charging-infrastructure location planning considering the impact of delays caused by buses queuing up to charge at charger locations was studied by Tzamakos et al. [77]. They developed a MILP model to minimize the total the expenses of building wireless charging. The details of each study are presented in Table 5.
Since the electric power demand of fast charging infrastructures is high, and charging during peak hours would put much pressure on the grid, charging scheduling of EBs using such charging technology is challenging. Without paying attention to charging scheduling, the energy cost of this charging type would heighten, and the economic viability of switching to electric bus transit systems would be lower. He et al. [12] addressed this problem by proposing a network modeling framework. They minimized the total charging costs, including energy and electricity demand charges. (For more information, see [12]). Another critical issue of implementing fast-charging infrastructures for electric buses is the congestion of EBs at the charging stations due to the lack of available stations. Abdelwahed et al. [78] addressed this issue by presenting two mixed-integer linear programming models. They also considered the impact of the recharging schedule on the grid by considering off-peak and on-peak charging periods. One way to deal with the congestion of electric buses at fast charger stations is the bus-holding strategy. Gkiotsalitis [79] determined the best departure times of buses based on bus-holding strategy while considering the scheduled charging times. Minimizing the charging time of EBs during the service time was studied by Patil et al. [80].
Wang et al. [81] proposed an optimization model to find the best recharging schedule for electric buses while considering planning decisions such as finding the best number of chargers, their locations, and station capacity. The combination of optimal charging scheduling of electric buses and drivers’ mealtime time window has been discussed in [82]. Battery degradation and bus-to-grid (B2G) technology were studied by [83] for battery electric bus charging optimization. The objective was to minimize the charging cost of a real case study in Portugal. They provided a mixed-integer linear programming model for this problem and solved it with IBM ILOG CPLEX. There are other approaches, such as Lagrangian relaxation for depot charging [84], the progressive hedging algorithm (PHA) for both fast charging and battery swapping [85], and the genetic algorithm (GA) [86] that could be adopted to deal with the charging scheduling of electric buses.
Table 5. Comparison of different studies on EBs’ charging infrastructure location planning.
PaperObjectives and Decision VariablesCharging TypeModelAlgorithmCase StudyRemarks
Kunith et al. (2014) [64]Optimum number of fast charging stations; min construction costFast charging 1MILPstandard solver-Considering battery charging behavior and operational constraints
Kunith et al. (2017) [56]Best locations and the optimum number of chargers and battery capacityFast charging 1MILPstandard solverBerlin, GermanyCapacitated set covering problem
Rogge et al. (2018) [61]Min the total cost of ownershipDepot chargingMILPGrouping genetic algorithmGermany & DenmarkMin vehicle investment, charger investment, operational costs, and energy expenses
Rohrbeck et al. (2018) [70]Min total costs: the price of establishing charging stations and purchasing cost of vehiclesOpportunity chargingMILPstandard solverMannheim, GermanyConsidering battery aging, traffic congestion, and partial charging
Liu et al. (2018) [71]Min the cost of installing fast-chargers and batteriesFast charging 2MILPAARCUtah, United StatesConsidering uncertain energy consumption for battery-EB
He et al. (2019) [68]Minimizing the total cost of installing fast chargers, ESS, and EB batteriesFast charging 2MILPstandard solverUtah, United StatesShowing how the ESSs may save system costs by lowering demand charges
Olmos et al. (2019) [69]Best location of chargers, power rate of charging infrastructures, and size of ESSOpportunity charging-Iterative sequenceDonostia, SpainMinimizing the total cost of ownership
Lin et al. (2019) [52]Min the total operating, establishing, and grid power loss costsFast charging 1MISOCPSpatial-temporal approachShenzhen, ChinaMultistage planning model
Liu & Ceder (2020) [87]Min the required number of EBs and fast charging infrastructureFast charging 3DF and IPAdjusted max-flowSingaporelexicographic method-based two-stage construction-and-optimization solution was adopted to solve the bi-objective problem
Othman et al. (2020) [66]Min the operational costs and energy consumptionFast charging 4EHDGVoronoi diagramToronto, CanadaThe proposed EHDG algorithm is based on genetic algorithm and gradient descent technique
Liu et al. (2020) [59]Min operating costs; all backup buses, drivers, maintenance, energy consumption cost, and construction costs of charging depotsDepot chargingMILPArtificial fish swarm algorithmChinaOptimizing the layout of bus routes, the service frequency, and the location of charging depots
Zhang et al. (2021) [62]Total costs of user and operator unsatisfied demand, passengers’ travel time, and operator costFast charging 3MINLP
& MILP
Modified genetic algorithmSwissBi-level programming framework
Uslu & Kaya (2021) [60]Min the total cost; optimal locations and capacities of EB charging stationsDepot chargingMILPstandard solverTurkeyDriving range has the highest effect for selecting locations and capacities of charging stations at minimum cost
Wu et al. (2021) [65]Min maintenance, fast charging station construction, travel to charging stations costs and power loss of fast chargersFast charging 3BPSOMathematical programYangjiang, ChinaThe bus terminuses clustered by the Affinity Propagation approach in order to estimate the approximate number of charging stations
Olsen et al. (2021) [73]Min the total cost of installing depot chargers, vehicle, and operating costsOpportunity chargingVNS--They proved that complete integration of BEB scheduling and charging station location planning is better than sequential planning
Alwesabi et al. (2021) [21]Min the battery cost, system inverters, and total cable costWireless chargingMILPstandard solverBinghamton UniversityFinding the optimum fleet size, battery capacity, and dynamic wireless charging locations, simultaneously
Stumpe et al. (2021) [75]Min the number of required vehicles, personnel and energy consumption costsOpportunity chargingVNSMILP-They performed sensitivity analysis for different input parameter uncertainties
Tzamakos et al. (2022) [77]Min the number of wireless chargersWireless chargingMILPstandard solver-M/M/1 queuing model was used for bus recharging queuing
Li et al. (2022) [76]Min the deadhead trips and charging servicesFast charging 3MILPstandard solverChengdu, ChinaThe fast charging infrastructure location planning was investigated under the BOT model
Hu et al. (2022) [72]Min the total cost of system; buying new chargers, EBs’ batteries, charging cost and passengers’ extra waiting timeOpportunity chargingMILPstandard solverSydney, AustraliaRobust optimization technique was used to deal with the uncertain passengers’ travel demand and trip time
Wang et al. (2022) [88]Min the fleet size, BEBs; batteries, and installing pantograph chargers costsOpportunity chargingMILPstandard solverOslo, NorwayTime-dependent dwelling time, ridership, and travel time of BEBs were considered
1 In depot. 2 At bus stop. 3 In terminal. 4 In a specific station.

3.2. Bus Timetabling

A “good” timetable has different meanings from passengers’ points of view. One may recognize a good timetable by its regularity, whereas another will prefer a timetable with the exact headway or frequency that he wants; or a good-quality timetable may be represented by the minimum difference between the actual and desired frequency. Thus, determining a timetable would be challenging due to several objectives that should be satisfied. Minimizing the waiting times of passengers and maximizing the bus-line-departures synchronization are the main objectives of timetabling. Improving safety, quality of service, and comfort are the other objectives of the bus timetabling problem.
Researchers addressed the timetabling problem from various angles. Multi-objective models, which simultaneously reduce the passengers’ waiting times and increase bus utilization [89,90,91], maximizing bus frequencies to satisfy the passengers’ travel demands [92], and maximizing uniform loading on buses through even-load headways [93]. According to [94], depot charging does not affect electric bus timetables. Thus, the timetabling approaches and their methods for conventional buses could be implemented on EBs without any modifications. However, fast-charging affects the development of bus timetabling. The time taken for charging, which is about 5 to 10 min, should be considered when generating the timetable. Although fast-charging technology affects the timetabling problem (the recharging time should be added as an input to the problem), there is no study in the literature modeling the problem of electric bus timetabling specifically. Note that overnight and continuous wireless charging have no impact on generating timetables. According to [94], the methods to deal with the timetabling problem for conventional buses could also be implemented on EBs.
Ceder et al. [95] presented a mixed-integer model to create timetables with the maximum synchronization of bus arrivals at transfer stops. Since the suggested mixed-integer programming model belongs to an NP-hard set of problems, a heuristic approach was presented to solve the large-scale problems. Liu et al. [96] solved this problem using the Nesting Tabu Search algorithm. Ibarra-Rojas and Rios-Solis [97] solved this problem while avoiding bus bunching of bus lines. Minimizing the passengers’ waiting times has been addressed in [98] through optimizing the synchronization of bus arrivals at the connection nodes in the network. The authors solved the problem by formulating a MILP model. Parbo et al. [99] investigated the maximal synchronization problem to minimize the passengers’ waiting times by focusing on the social benefits of the created timetable.
Ceder et al. [89] developed a multi-objective model to reduce the expected waiting times of randomly arriving passengers while increasing bus utilization from the operator’s perspective. Zhang et al. [91], in 2020, proposed a decomposition heuristic algorithm to solve the multiple-vehicle-types scheduling problem and introduced a bi-objective optimization model for a feeder bus line to reduce operating costs and passenger waiting times with consideration of three different types of buses.
Shang et al. [92] proposed a timetabling problem for maximizing bus frequency and headway based on customer satisfaction. The timetabling is optimized by striking a balance between customer satisfaction and bus transit performance, taking the load factor into account. Ceder and Philibert [93] developed an approach for creating even-load transit timetables to achieve a uniform maximum load on vehicles and seamless transfers. Due to the low load discrepancy, such even-load timetables would improve vehicle utilization and minimize empty seat-minutes. However, they would prolong the waiting periods for passengers arriving at random stops. Gkiotsalitis and Alesiani [100] presented a robust timetable using a bus movement mathematical model which incorporates travel times and passenger demand uncertainty to reduce the potential loss in worst-case scenarios by minimizing the deviation between actual departure times of buses and the desired ones.

3.3. Bus Scheduling

The process of assigning buses to the trips of a specified timetable is known as vehicle scheduling (VS). The set of trips from the timetable is fed into the vehicle schedule, aiming to cover them as efficiently as possible while meeting all operational constraints, typically by reducing the required bus numbers and deadhead trips. Both exact and heuristic/metaheuristic solution approaches are adopted to solve this problem [101,102]. Vehicle scheduling with one depot and multi depots are the two main categories of bus scheduling. The single-depot vehicle scheduling problem can be solved in polynomial time, whereas multi-depot vehicle scheduling belongs to the class of NP-hard problems. The time-space network is another framework for modeling vehicle scheduling problems. In this framework, nodes represent the departures and arrivals of buses at a certain time and location, and arcs represent the travel between nodes by a vehicle. The simple formulation of electric bus scheduling is presented in the Appendix A.2.
Another approach to deal with bus scheduling problems is deficit function (DF) modeling. References [103,104,105] used this method to find the optimum required number of vehicles and assign them to the predetermined timetable based on DF theory. The applications of this theory to network design and crew scheduling of public transit operation planning were investigated by [105]. The deficit function’s visual aspect is its key benefit. Readers are directed to [106] for a thorough explanation of the fundamental theory and significant advancements in DF modeling and applications.
Driving range limitation and long time recharging process for electric buses are the two factors which alter the conventional models and solution approaches of vehicle scheduling problems. EBs have range limitations and should be recharged at bus depots, terminals, or bus stops, depending on the charging technology, a few times a day. This would necessitate studying electric bus scheduling from the economic and operational points of view. Li [107] showed the changes to the bus scheduling process after introducing electric buses.

3.3.1. EB Scheduling with Heuristic Solution Approaches

Wang and Shen’s paper [108] is one of the first studies in electric bus scheduling with a limited travel range and minimum recharging time. The objectives were to minimize the number of buses and decrease the total time of deadhead trips. The authors solved the problem by ant colony optimization (ACO) algorithm. Zhu and Chen [109] addressed this problem in a single-depot VSP form. They considered a battery swapping strategy for charging electric buses. Minimizing the cost of ownership of buses and their extra batteries and minimizing the charging costs were the two objectives of this study. The solution approach was based on non-dominated sorting genetic algorithm II (NSGA-II) to present optimal Pareto fronts for a case study in China. Paul and Yamada [110] addressed the charging and operation scheduling of electric buses and the operating of conventional buses for four bus lines. They aimed to maximize the EBs’ total travel distance and decrease the amount of C O 2 emissions and fuel cost. The authors solved the proposed problem by a k-greedy algorithm and validated it through a simulation process using real data from a case study in Japan. Simulation models could be adopted to solve electric bus scheduling too. Sung et al. [111] sought to minimize the cost of charging stations, batteries, and buses, and electricity consumption using a simulation model and a heuristic algorithm was developed to solve the problem. This study’s main outputs are buses and charging stations’ optimum number and type. Other metaheuristic solution methods and their combinations were used to determine the optimum departure times of buses. Ke et al. [112] combined GA, PSO, and SA to minimize the electricity costs and total emissions of greenhouse gases. Joint optimization of EB scheduling and crew scheduling for a heterogeneous bus fleet (traditional and electric buses) were studied in [113]. A bi-level programming model was provided to minimize the economic and operational costs of C O 2 in the upper level and minimize the drivers’ wage while increasing the bus-driver specificity (the same driver operates the same bus) in the lower level. To solve this problem, a PSO algorithm was adopted based on an epsilon constraint method.
The adaptive genetic algorithm (AGA) is another approach to solving the vehicle scheduling problem. Li et al. [114] used this method to tackle the integration of electric bus scheduling and stationary charger deployment for a real case study in Anting Town, Shanghai. They considered partial charging and time-varying electricity prices and tried to minimize the total construction and maintenance cost of electric bus scheduling and charging infrastructure. Uncertainties in the number of arriving passengers, their waiting times and the energy consumption of electric buses were considered in [115] to find the optimum departure intervals of EBs. The problem was solved based on an uncertain bi-level programming model (UBPM). The upper level seeks to minimize the passengers’ travel costs, and the lower level tries to minimize the energy consumption of electric buses. GA was adopted to solve a real case study in Nanchang, China. Additionally, reducing power consumption and in-service costs were included in the objective function. A multi-vehicle version of electric bus scheduling was studied by Yao et al. [116] in 2020. They aimed to reduce the required investment for buying electric buses and charging infrastructures while minimizing the operational costs of deadhead trips. Since the problem was an NP-hard one, a heuristic approach was adopted to solve it in a reasonable time. A bi-objective integer programming approach was developed by Liu and Ceder [87] to minimize both the total number of EBs and required fast charging infrastructures in a multiple bus line transit system with a partial charging policy. To solve this problem, the authors suggested two methods: a lexicographic and a modified max-flow approach. They implemented their model in a real case study in Singapore. The collaborative optimization of electric bus scheduling and charging scheduling was studied in [117]. This study provided a multi-objective bi-level programming model to minimize carbon emissions and operating costs, including deadhead trip costs, passenger trip costs, and power consumption costs. An iterative neighborhood search and a greedy dynamic search strategy were adopted to solve the electric bus scheduling and charging scheduling, respectively. Zhu et al. [118] solved the IoT electric bus scheduling based on a new metahuristic solution named the phasmatodea population evolution (PPE) algorithm, and they obtained a smaller loss value in comparison with the PSO algorithm.

3.3.2. EB Scheduling with Exact Solution Approaches

Alwesabi et al. [119] studied the EB scheduling problem by minimizing the total cost, by finding the optimum number of electric buses and taking into account the number of charging stations and battery size limitations. Li [107] investigated scheduling of electric buses which use fast chargers or battery swapping technology. He also studied this problem with a limited travel range form for buses with different sources of energy. Mixed-integer programming models have been proposed for these problems. The author believes that the proposed model could be used for both charging types, since the battery swapping time is approximately equal to the fast-charging time. To deal with this scheduling problem, column generation algorithm was used. Rinaldi et al. [120] studied the scheduling problem of electric buses with a service factor and charging-factor constraints to determine the sequence of electric and hybrid buses departing from a multi-line bus terminal. They presented a mixed-integer linear program to minimize the total operation costs. In 2020, Tang et al. [121] addressed the electric bus scheduling problem by presenting static and dynamic scheduling models to reduce the total operating costs and expected costs through introducing a buffer-distance strategy and rescheduling buses regarding the updated traffic condition. They solved the problem with a branch-and-price algorithm.
According to [105], multi-depot vehicle scheduling problems are split into two parts: determining the trip chains and assigning buses to each trip. The introduction of EBs has a larger impact on the former, since the trip chains should be modified regarding the limited travel range of EBs. Jiang and Zhang [122] addressed this problem with a partial charging policy and vehicle-depot constraint (the starting point and end point of EBs trips should be at the same depot). They developed a MILP and solved it using a branch-and-price algorithm. Gkiotsalitis et al. [123] considered time windows for the multi-depot electric bus scheduling problem. They aimed to minimize buses’ costs and waiting times by proposing a mixed-integer nonlinear program. They linearized the model and solved it using a branch-and-cut algorithm based on valid inequalities. A multi-vehicle-type electric vehicle scheduling problem with a limited battery capacity constraint was discussed by Reuer et al. [124]. They solved the problem using a time-space network. Multi-depot electric bus scheduling with a partial charging policy for a heterogeneous fleet was investigated by Zhang et al. [125], in 2022. The objective function was to minimize the purchase cost of EBs and operational costs. They proposed a MILP and solved it using an adaptive large neighborhood search algorithm. Wu et al. [126] solved the problem by taking the time-of-use and peak load of the power grid into account. They aimed to reduce the peak charging demand and overall operating costs, and to do that, they developed a MILP based on a time-expanded network and solved it using a branch-and-price algorithm.
Van Kooten Niekerk et al. [127] proposed two models for battery electric bus scheduling with a limited-travel-range constraint—* one with different assumptions, such as assuming linear chargeability of buses, neglecting to consider the time-of-use (TOU) electricity price, and neglecting the impact of depth-of-discharge (DOD). The second model was more realistic by relaxing the mentioned assumptions. By introducing integer linear programming, the suggested model for this problem could be solved in a reasonable time for small and medium-scale problems. The authors presented two other techniques based on the column generation approach to find near-optimum solutions for large-scale problems. As stated in [81], by adopting the best recharging strategy, the travel range limitation of EBs could be addressed and eliminated. Thus, the aim of the research was to find the best strategy for recharging electric buses. Finally, the authors implemented their model for a real case study in California. Joint optimization of pantograph charger location planning, BEB scheduling, and battery capacity were addressed in [88]. The aim was to reduce the total annual cost associated with the fleet, and they developed a MILP to deal with the problem.

3.4. Integration of Bus Scheduling and Timetabling

This portion of the literature discusses the integration of timetabling and vehicle scheduling problems. Häll et al. [94] studied the EBs timetabling and vehicle scheduling changes, seeking to optimize various charging methods, including continuous, overnight, and quick charging. The authors investigated the effects of introducing EBs on public transportation’s operational planning (transit network, timetabling, and scheduling). Integration of electric bus timetabling and vehicle scheduling is required to meet passengers’ demands, enhance social benefits, and reduce operator costs [90]. Hence, finding the optimal timetable and vehicle schedule for electric buses is a key factor in reaching a more sustainable transit system. Most previous studies considered bus scheduling and bus timetabling individually and separately. Ceder et al. [128] and Chakroborty et al. [129] were the first researchers who studied the integration of TT and VS. Ceder et al. addressed an approach for combining timetables and vehicle scheduling from both the customer and the operator’s perspective to reduce the fleet size. Their approach was based on a four-step sequential method with a feedback loop. Chakroborty et al. addressed the problem without the interlining option and minimized the fleet size while reducing passengers’ transfer and waiting times, based on a genetic algorithm approach. Most of the studies in the literature mainly discuss the minimization of passengers’ waiting and travel time for timetabling and minimization of bus operator costs (purchase costs of new buses, deadhead trip costs, scheduling, and recharging costs).
The combination of bus timetabling and scheduling is a bi-objective problem. On the one hand, it should optimize the passengers’ satisfaction by minimizing waiting time, travel time, seat availability, and so on; on the other hand, it should consider operational costs from the bus companies’ point of view. These two objectives are in conflict, and to solve and handle such issues, several strategies could be adopted: shifting, weighting, Pareto front, bi-level programming, and reordering.
In shifting, VS could be solved with minor changes in the timetable, i.e., small shifts in arrival and departure times to reduce the operational costs of scheduling. In this approach, a selected objective function would be optimized regardless of another objective function on the condition that the second objective will not exceed/be less than a given threshold value. Kliewer et al. [101] were the first scholars who introduced shifting strategy for vehicle scheduling problem, which is called the vehicle scheduling problem with time windows (VSP-TW). They used a time-space network to find out the feasible combinations of trips and solved the problem using heuristic and column generation methods. Fleurent et al. [130] and Van den Heuvel et al. [131] extended the model presented by Kliewer et al. [101], proposed a hierarchical approach to solve the vehicle scheduling problem, and used mathematical programming models to find the best number of vehicles and optimize the type of vehicles based on a simulated annealing (SA) approach. A combination of shifting and weighting strategies based on a metaheuristic approach was developed by Fonseca et al. [132]. They aimed to minimize the total operational costs while minimizing the passengers’ transfer times.
The weighting strategy is one of the most straightforward strategies to dealing with such a problem, but the issue is determining the weights’ best values to describe the preferences of passengers and public transportation service providers. Petersen et al. [133] introduced a new problem to simultaneously address passengers’ waiting time and total resource costs for an integrated TT and VS problem. They solved the model based on the large neighborhood search (LNS) metaheuristic solution approach and used the weighted sum method to deal with the bi-objective nature of the problem. Carosi et al. [134] looked at vehicle scheduling and timetabling and used the weighted objective function to prove that the integrated timetabling and vehicle scheduling problem is a bi-objective problem. Furthermore, they proposed a multicommodity-flow-style mixed-integer linear programming model to balance service providers’ costs and customer satisfaction optimally. In another paper, Guihaire and Hao [135] suggested an iterative local search method to solve the integrated timetabling and vehicle scheduling (ITTVS) problem. The objectives of the problem were minimizing the operational costs of vehicles and maximizing the service quality. The latter objective was measured by evenness of headways, and the former was calculated with respect to the lengths of the deadhead trips and fleet size. Schmid and Ehmke [136] addressed the ITTVS problem with a degree of flexibility to change the timetable and balanced departure times and solved it based on the large neighborhood search (LNS) approach. The two objectives were improving the quality of timetable and reducing the operating costs, which were optimized using the weighted sum approach.
Another strategy is using the Pareto front. This strategy aims to find the Pareto optimal front, which any other solutions would not dominate. Ibarra-Rojas et al. [137] solved timetabling and vehicle scheduling individually by introducing two integer linear programming formulations. Then, they combined the two problems into a bi-objective integrated problem. The method used to deal with this bi-objective model was based on the epsilon constraint method. The authors believe that their proposed model and solution approach could solve the problem for up to 50 bus lines. A combination of timetabling and VS was also suggested by Weiszer et al. [138] in 2010. The suggested model included two objective functions: minimizing passengers’ waiting times at each bus stop and minimizing the required number of buses to cover all the trips mentioned in the timetable. Finally, the authors solved the problem by proposing a NSGA-II optimization technique. Liu and Ceder [139] studied the impact of schedule deviations on public transport users’ routing choices. They developed a collaborative approach for timetabling, vehicle scheduling, and demand assignment simultaneously. For the electric buses, Teng et al. [90] addressed the single-line bus timetabling and vehicle scheduling problem by proposing a multi-objective particle swarm optimization (PSO) algorithm. This paper aims to minimize the number of electric buses, and simultaneously, their charging cost.
Bi-level programming solves the problem in two different stages: leader and follower. Leaders optimize their objective regardless of followers’ objective; then, followers solve the problem and optimize their objective function based on the output of the first stage optimization of leader. Liu and Ceder [140] proposed a bi-level integer programming model that considers the interests of public transport users and service providers to optimize the public transport timetable integrated with vehicle scheduling. A novel deficit function (DF)-based sequential search method is proposed to solve the problem and obtain Pareto fronts. Liu et al. [141] formulated an integer programming model to address integrated bus timetabling and vehicle scheduling. Their research aimed to minimize the number of vehicles required for the total trips and maximize the number of vehicles that arrived simultaneously at the transfer nodes. This bi-objective model was solved based on a two-stage deficit function approach to generate Pareto optimal fronts. It is worth mentioning that the last two papers showed how changes in bus timetable and even vehicle scheduling could affect passengers’ trip mode choice. Liu and Shen [142] presented a bi-level programming formulation to solve bus timetabling and vehicle scheduling. At the first level, the number of required vehicles to assign to each trip is minimized. Then, at the second level, passengers’ transfer time in connection stops is minimized concerning the solution from the first level.
The last strategy is reordering, which means considering public transportation planning as one integrated problem. Michaelis and Schöbel [143] considered four stages of a public transportation planning system as one integrated problem. The four stages were: network design (line planning), timetabling, vehicle scheduling, and crew scheduling. The authors proposed new order for the public transportation system planning. First, the vehicle routes are designed; in the second stage, the designed routes should be split into bus lines; and in the final stage, a periodic timetable should be assigned for each line. Pätzold et al. [144] proposed three ways to include VS in different planning stages of public transportation systems, such as timetabling and line planning. The research aimed to consider three ways to “look ahead” of planning to decrease operational costs. The complete integration of electric bus scheduling and crew scheduling was studied by Perumal et al. [145]. The column-generation method was used to find the best vehicle and crew schedule regarding operational costs. Table 6 represents an overview of the objective functions of various studies on bus scheduling and timetabling. This table shows the potential research areas for future studies regarding simultaneous optimization of bus scheduling and timetabling objectives. Additionally, we can conclude that there is a significant lack of research on integrating electric bus scheduling and charging TOU and combined optimization of EBS and timetabling. Table 7 represents the method and algorithms adopted to solve electric bus scheduling and timetabling problems. The table shows that the number of studies using exact solution methods is remarkably less than the number papers using heuristic or metaheuristic solution approaches. Although EBS with multiple depots is an NP-hard problem, there is a research gap in reformulating such problems and solving them by the exact methods. Table 8 shows the advantages and disadvantages of methods used for the bus scheduling and timetabling and the accuracy of the results obtained by such methods.

3.5. Impact on The Power System

Electric buses present both challenges and opportunities for the future power network due to their size and flexibility. One such challenge is charging the electric buses’ batteries [147]. The primary attributes of EBs include a battery capacity greater than 200 kWh, charging power greater than 40 kW, and a driving range of 200 km [
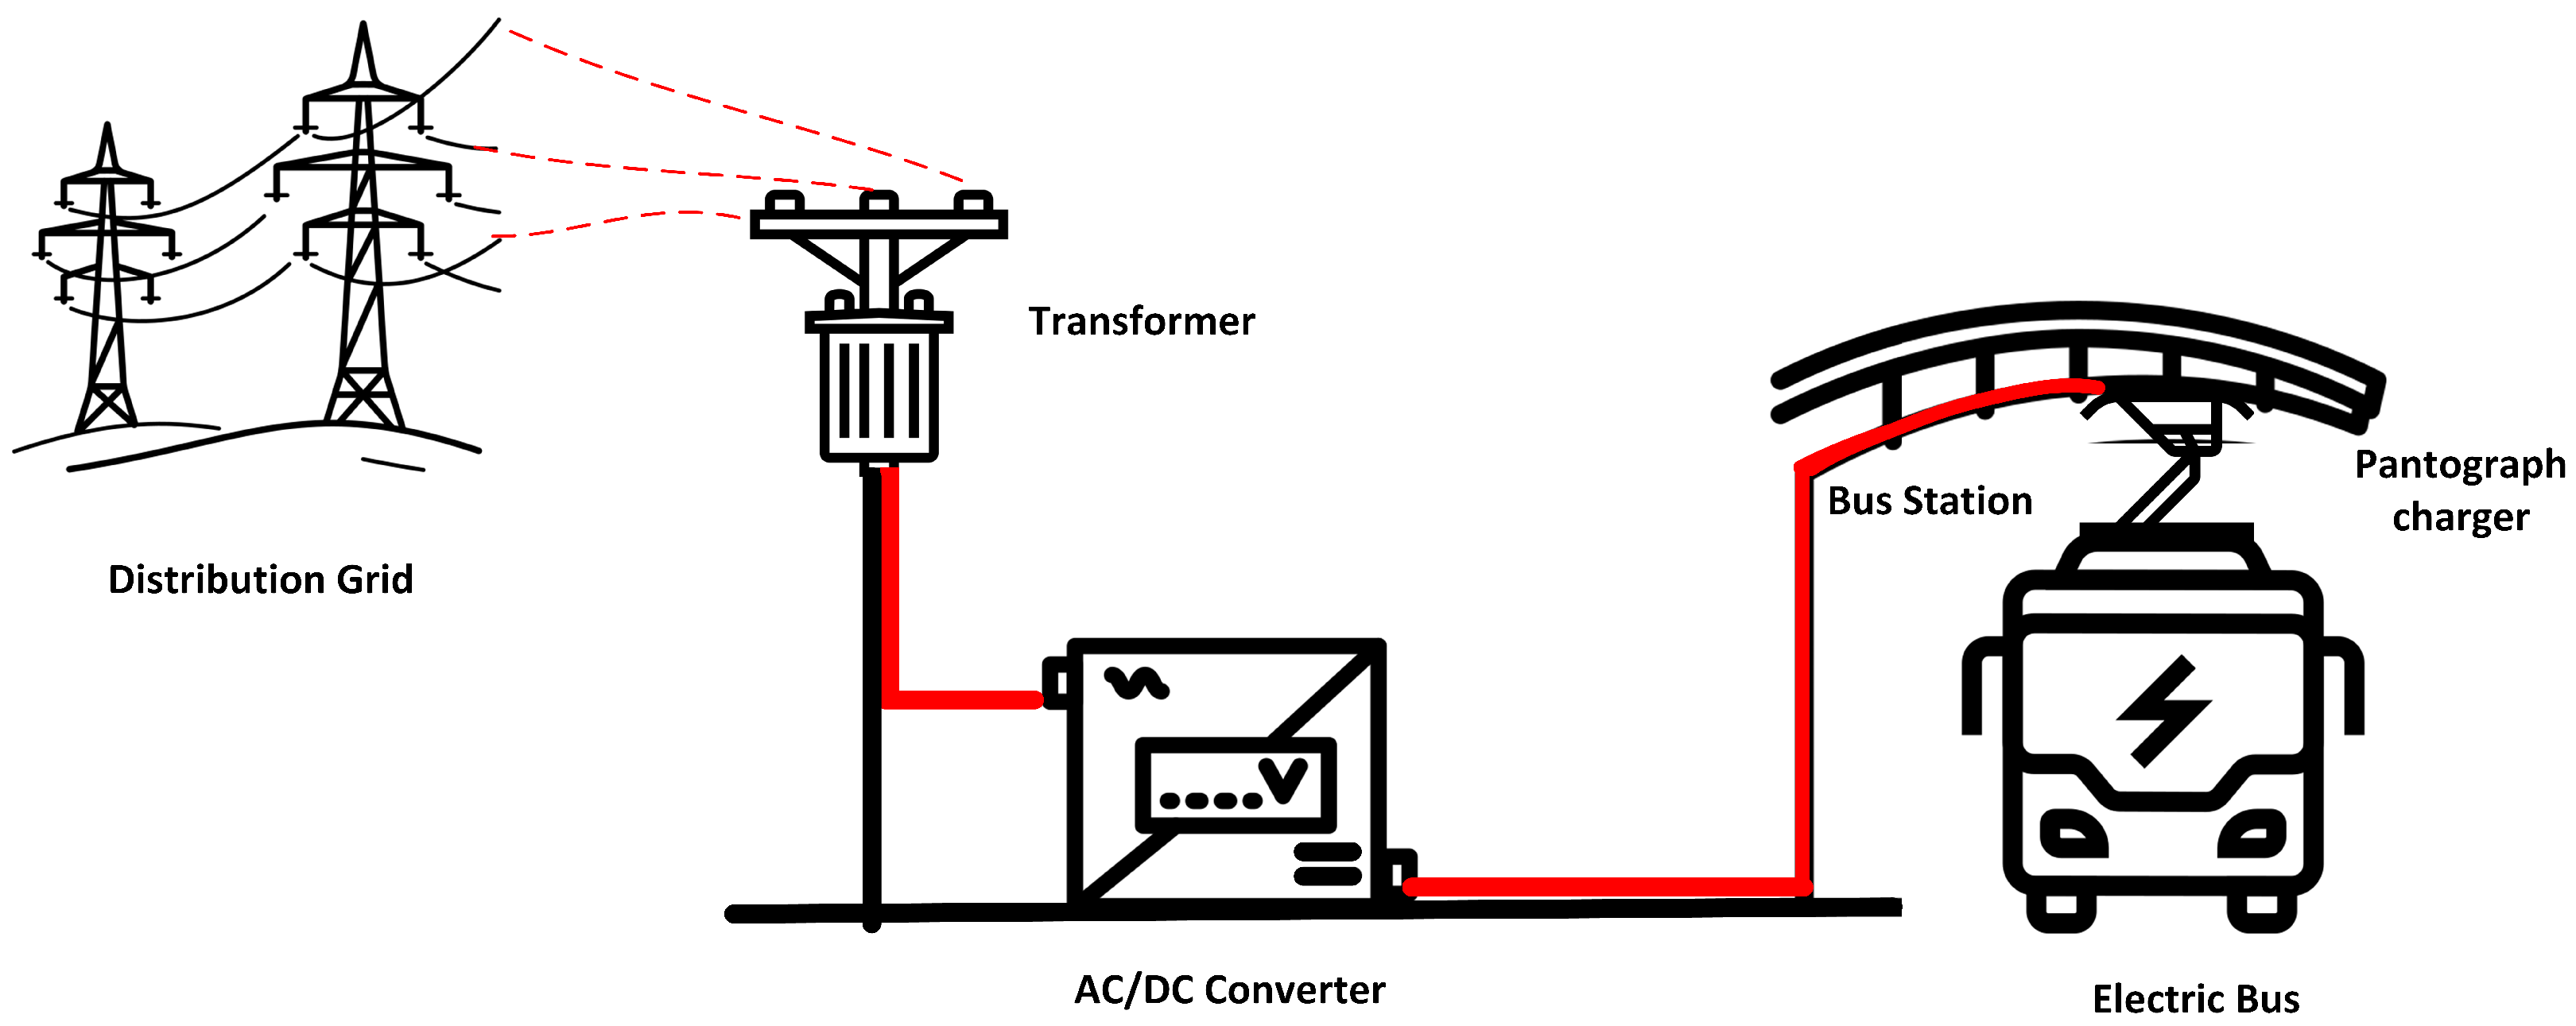
148]. Benefit-wise, EBs are superior to private EVs. They enable large passenger transfers, saving space on the road and using less energy. The basic structure of fast charging infrastructure for charging buses includes an AC/DC power converter, a transformer, a distribution grid, and its connection, as shown in Figure 5. Transformation from the conventional buses to electric buses will have a significant impact on the electric grid. An electric bus depot which has hundreds of buses will have a severe impact on the power grid [149]. Therefore, it is very high important for both the power utilities and transportation companies to quantify electric buses’ power demand and their impact on distribution grid. The power grid can face huge stress due to the uncoordinated charging of EBs [150]. On the other hand, coordinated charging can deliver excessive benefits, such as valley filling and peak clipping [151]. EVs for public transportation, such as electric buses, have received little attention so far. Due to their high-power consumption and rigorous charge times, EBs in particular present unique charging-related issues. Additionally, the battery capacities of EB used for public transportation are very high (150–450 kW), greater than that of electric cars, and the charging power is also several times greater than that of electric cars [152]. As a result, high energy consumption and detrimental effects on power distribution networks may result [153]. As electric transportation increases, the electricity demand required to charge their batteries will also increase.

3.5.1. Impact on the Distribution Grid

System security around the integration of EVs and EBs is receiving a lot of attention due to the high charging power of EVs and EBs. As a result, the majority of existing publications concentrate on the effective analyses of them on the distribution network. They consider the objective operations pertaining to system operation, such as power market participation [154], grid loss minimization [155], and network security [156]. The high penetration of electric transportation deployment can cause different problems in the power system, such as increased peak demand, voltage drops, degrading the power quality, blackouts, and power system losses, as shown in Figure 6. Leou and Hung [153] established a mathematical model and tested it for a small bus fleet of 10 buses in order to take into account the charging scheduling of electric buses for the central depot. This strategy schedules bus charging based on time-of-use rates in an effort to reduce energy costs. The EB fleet’s impact on the grid’s charging, which results in overloading of the distribution transformer [157], and more crucially, the necessity for buses to wait until off-peak hours to be charged, was not considered by the author. In [158], the effects of the EB charging demand on the local grid and distribution were investigated on a substation in Warsaw, Poland. In [159], two case studies employing a technique for predicting the energy and charging needs of electrified public transit are reported. By analyzing their actual, comprehensive energy use, the authors of [160] proposed a battery-sizing methodology for several electric bus services. There are two ways to mitigate the impact of the increasing penetration of electric transportation on the power system. The first one is a direct approach, where the power system operator can directly control the charging and discharging of electric vehicles by using different charging algorithms [161]. Such a method will benefit the power system operation and the consumer. The second method is to indirectly control the charging and discharging behavior of the consumer using demand–response programs, such as time of use pricing or real-time pricing [162]. Such an approach will compel the consumer to use the off-peak hours to charge his electric vehicle by providing low prices for off-peak hours and high for peak hours. However, the second method might have a rebound peak if everyone uses a low pricing peak to charge their electric vehicles.
Within a smart grid, EVs, including EBs, will use optimal charging scheduling for flattening the load profile of the electrical system [163]. In order to address the issue of coordinated charging over day-ahead scheduling, various mathematical models have been proposed and developed, such as linear and mixed-integer linear models, which focus on minimizing EV load deviation [164], total loss minimization [165], and charging cost minimization [166]. One study [167] used data gathered from automated vehicle location (AVL) in the BusGrid system to forecast future passenger demand at bus stops and in routes using supervised machine learning techniques. This improved the design of new routes and improved bus scheduling. BusGrid is an information system for enhancing customer satisfaction and productivity in public transportation bus services. BusGrid works with an operator to enhance bus timetables and develop new bus routes and stops based on anticipated demand by receiving and processing real-time data from sensors put on a bus fleet called AVL and automatic passenger counting (APC). A passenger-demand forecasting model created especially for bus networks is provided in [168]. In this study, a time-series forecasting method was used to present a weighted ensemble prediction model that correctly forecasts bus demand for a P-minute time window using data from two Poisson models and an auto-regressive integrated moving average (ARIMA) model. According to [169], AVL data were used with machine learning clustering techniques to improve the performance of the AVL system for determining bus schedules in Portugal. This connection made it easier to determine whether a schedule adjustment will satisfy the needs of the network. In a different study [170], the authors proposed employing machine learning methods such as unsupervised clustering to identify trends among AVL data in order to enhance Sweden’s public transportation timetables. Other objectives have also been taken into account, including reducing the loss of electricity to the grid, EV battery degradation, reducing C O 2 emissions, and increasing the level of satisfaction among EV owners [171]. A new business paradigm is being facilitated by the rise in EVs and EBs, and the inclusion of renewable energy resources in the future power network [172]. For the introduction of EBs in power systems, several researchers created novel approaches with a variety of primary goals. Electric bus energy estimation has been studied by some writers. Stochastic modeling and forecasting of load demand of EB battery swap station are studied in [173]. Fuzzy clustering and least-squares support vector machines optimized by the Wolf pack method were used to forecast EB load over the short term [174]. The optimization of the EB aggregator will minimize charging costs while satisfying a variety of electrical constraints to optimize the charging load during the charging process. The optimization problem considering the minimizing the daily charging cost of EBs is as Appendix A.1 [148].
Thiringer and Haghbin [175] investigated the effect of EVs (including electric buses) on the substation reserves in order to address the power quality issue in a fast-charging station. The case study used in this work was based on real electric bus data from Gothenburg, Sweden. This study examined potential problems with the effect on the electrical system but did not make recommendations for how to improve the charging schedule. Zoltowska and Lin [176] used aggregated day-ahead auction bids to plan the charging schedule of EBs for minimizing the cost of charging scheduling. Using the market participation idea, an optimization model for coordinated charging of the bus fleet and fast-charging stations was created in this study. There are many optimization techniques for battery switching [177], and there is the flash wireless charging concept for bus timetables [178]. Different studies have evaluated the impact of electric transportation on the distribution voltage by implementing the optimal charging strategy with the operation constraint on the distribution network [179,180]. The author in [181] proposed the Monte Carlo approach to assess the effect of electric transportation charging on the voltage imbalance level and calculate the voltage quality. In [182], other factors of the distribution system, such as, but not limited to, feeder losses, variation in the load, and load factor, were analyzed with an optimal charging algorithm. In [183], the author compared the impacts of electric-vehicle charging on European and North American distribution systems. These voltage drops on the distribution system can be mitigated by installing an additional transformer, but it is expensive and needs infrastructural changes.

3.5.2. Impact on the Transformer

Electricity is typically supplied via liquid-fill and dry-type transformers in distribution systems. The power rating of such a transformer often varies by country, ranging from a few kVA to hundreds of thousands of kVA. For instance, the power rating utilized on 11 and 22 kV networks in Australia ranges from 10 to 2500 kVA [184]. The price of a transformer varies from hundreds of dollars to several hundred thousand dollars depending on the brand, quality, size, and kind. According to [185], EVs are not taken into account while sizing distribution transformers in conventional power systems. As the penetration of EVs rises, the demand on the transformers will peak as a result of charging such a large battery bank. It will result in extreme voltage drops, increased power losses, and a shorter lifespan for the transformers.
Due to the existence of EBs uncoordinated charging, distribution system operators and transmission system operators (TSO) may experience difficulties in the future. All of these issues must be handled by DSO and TSO using all of the resources at their disposal. The EV aggregator is now a required partner who gives the DSO and TSO technical services [186]. The aggregator will serve as a middleman between operators, who will likely make use of market mechanisms to acquire the required assets and EB stations. Such an aggregator can be implemented on the distribution transformer, as distribution transformers are susceptible and costly devices in the distribution system. This will also help the distribution transformer to reduce losses and damage cost due to peak load of buses. The EB aggregator transformer will provide its services to TSO and DSO for grid operations, and maybe to other electricity partners to optimize their energy portfolio purchases. According to a survey, the most significant share in the distribution network is the new installation of the distribution transformer [187]. The peak demand on the transformer side will indirectly raise the temperature that causes the so-called accelerated ageing of the transformer insulation as the penetration level of electric vehicles rises [188].Such an aging effect may cost billions of dollars to the power system utilities [189]. Ahmadian et al. [190] studied the effect of EV charging on the traditional system, which results in voltage profile violation. The authors ideally distributed and designed the shunt capacitor and the wind-based distributed generation (DG) across the system, considering the load variability of the EVs and DGs in relation to the system voltage profile. They also used a short-schedule decision for the load tap changer (LTC) tap setting of the transformer. Azzouz et al. [191] took into account the high penetration of EVs and DGs in an attempt to reduce voltage variation and LTC tap operation, maximize the EVs delivered power, and optimize the power captured by the DGs. The high penetration level of the electric transportation (specifically electric buses) will cause problems on the transformer, including but not limited to decreasing the life-time of transformer, overloading the transformer, and increase power losses on the transformer, as shown in Figure 6 [192].
It is now understood that if the high penetration of electrification of the transport system is not correctly managed, it will cause a severe impact on the distribution system and grid side.

3.5.3. Ancillary Service by Electric Buses

According to [193], uncoordinated charging overloads the transformer and transmission line. EB charging can be categorized as unidirectional or bidirectional depending on the direction of the energy flow [194]. In unidirectional charging, power is sent from the grid to the EB acting as a load in the power system. The control of EV charging during unidirectional and controlled charging should aim to reduce peak demand. A bidirectional AC/DC converter is used by EVs to support energy transfer between the grid and the vehicle in both directions. There are two types of bi-directional power flow, that is, grid-to-vehicle (G2V), in which power is sent to the EV, and vehicle-to-grid (V2G) and vehicle-to-home (V2H), in which the EV serves as an ESS and feeds power into the grid [195]. Controlled and uncontrolled charging are further categories. The uncontrolled charging is done improperly and without the use of any control optimization techniques, which results in supply and demand imbalances, undesirable and unexpected peaks on the distribution system, increased voltage deviations, increased power losses, and decreased reserve margins [196]. In several studies, the V2G mode was taken into account, which is described as the EV’s capability to charge its batteries and give electricity to the grid, resulting in a bidirectional flow between the grid and the EV [197]. As shown in Figure 7, EBs can offer ancillary services to the power grid using various modes of operation, for instance, by improving grid quality through increasing the stability and generation dispatch. Providing improved energy management is also important, and can be accomplished through such things as peak shaving, reducing operation losses, and minimizing the cost. Such ancillary services also improve and regulate the voltage and frequency of the distribution network. The bank of batteries can also provide active power to the grid. The authors of [198] suggest intelligently charged electrified transit by taking into account V2G for EBs to assist renewable energy sources in the Austin power grid. Reference [199] proposed a charging approach for quick-charging stations that was based on a decision-making procedure and held the stance that the EBs only paid under the quick-charger load limit. The best location for fast-charging stations with an energy storage system to maximize the financial advantages was investigated in [200,201]. The authors of [202] investigated multi-external aspects in EB scheduling.
Even if EVs improve the grid in a variety of ways, if the penetration level rises significantly, this negatively impacts the distribution transformer and distribution system. The bidirectional charger consumes EV load, which introduces harmonics into the system and degrades the power quality. Additionally, significant upgrading of the current communication and distribution networks is required for the adoption of a bidirectional charger. On the other hand, it is still challenging to assess how much EVs actually participate in electricity markets. It is challenging to assume these activities for EBs given the economic viability of V2G mode. Additionally, due to driving schedules, EBs are less flexible than light EVs. However, given their limited number, high charging power rate, and ability to charge in public locations, EBs are more easily aggregated.
In a nutshell, it is acknowledged that substantial EB implementation across the distribution system can dramatically increase load demand if EB charging and discharging infrastructure is not handled effectively. It will result in the grid’s generational capacity being increased.

4. Challenges and Limitations

Implementing a fully electric bus transit system involves several challenges. The first challenge is the energy power supply issue of the high energy demand of electric buses, especially in big cities. Not all cities benefit from renewable energy sources for generating electricity; thus, satisfying the energy demand of a fully electric bus transportation system will be a big challenge for the energy side. Another challenge is the high purchasing price of fully electric buses compared to conventional or hybrid ones. Convincing cities’ authorities, municipalities, and governments to switch to such a high-cost transit system is complicated, and that is why many cities have not decided to use electric buses. Last but not least is the range limitation of EBs, and researchers are trying to solve this issue by proposing different charging technologies or producing buses with longer travel ranges. However, such solutions are costly for transit agencies. Thus, still, there is a vast amount of research to be done to address this problem more sustainably.
Another group of challenges are operational-planning challenges. This group relates to the recharging duration, battery degradation, and low efficiency of pantograph chargers. The refueling process of conventional buses does not take long and can be done every hour. The electric bus recharging process is a long-lasting task that should be done during off-peak hours to balance the load on the distribution grid. EB batteries will degrade slowly over time, depending on the frequency and type of charging used. Electric bus batteries are considered to have reached their end of life at 80% capacity or when they lose 5% of their charge per hour without use. Generally, EB batteries are warrantied for 8–12 years. This lifetime is much less than that of traditional buses. Cold temperatures will affect battery charge primarily due to the use of heating, which greatly impacts the amount of charge used, reducing range by up to 41%. Therefore, charge needs to be maintained above 20% to reduce the risk of stalling in the winter.
Switching from a conventional bus system to a wholly electric one for cities lacking the required infrastructure is very complicated. On the other hand, integrating bus depot operators and energy sectors may be feasible for only small towns trying to improve or design a new transit system while considering the impact of charger loads on the grid. That is because managing and optimizing the combination of transit authorities and energy manager agencies for big cities is complex. Moreover, the impact of installing pantograph chargers in the neighborhood is a challenge for transit authorities and urban planners. Safety is another challenging issue with using high voltage chargers for EBs. Although there is no report regarding the injuries or deaths related to charging infrastructure’s low safety measures, such infrastructure should be examined and checked regularly to reduce the risk as much as possible.
The electricity generation finite capacity is an important factor preventing distribution of electric buses in cities around the world. The power generators might not be able to meet the demand of a fully electric transit system, and transforming from the oil-based system to an electricity-based system would take time. This is the reason that most cities will switch from conventional buses to electric ones gradually. In many cases, transit authorities have decided to use hybrid buses as a first step and then gradually replace them with electric ones.
The accelerated deployment of EBs will place a heavy load on the grid, affecting the operation of utilities and power systems. Public transit operators typically lack the infrastructure required to address such a problem. Extending the distribution system’s capacity is possible, although doing so would be expensive and take a long time to complete. Therefore, creating innovative methods to reduce severe grid stress by fleet charging is a crucial problem [58,149,203]. Smart coordinated charging techniques should be regarded as one of the most important aims to be handled for this goal. In addition, public transit authorities must consider how the grid and bus systems interact. The best strategies for dealing with hierarchical decisions and decisions containing various and competing factors to optimize are bi-level and multi-objective optimization. Another attractive study area is the subject of bus to grid (B2G) interactions. For example, public transport authorities can sell energy back to the grid by taking advantage of intra-day changes in the price of electricity.

5. Future Direction

We divided the literature gaps in electric bus operation planning into three categories: electric bus scheduling and timetabling, fast charging infrastructure location planning, and impacts on the grid.
Although electric bus scheduling, timetabling, and the charging station location problem have been the subjects of various studies, more work is still needed to bridge the gap between theory and practice. If we explore the literature, we can find that only a few works have been done on the influence of electric bus scheduling on the location of fast charging infrastructure and vice versa. A few papers currently deal with the location problem of fast charging infrastructures. According to these papers, the charging station location problem is treated as an individual optimization problem.
To the best of our knowledge, there are very few studies on rescheduling and planning robustness for scheduling electric buses in the literature. Thus, future research is expected to focus on the design of recovery techniques that facilitate the use of electric buses. The integration of public transit operation planning steps for electric buses has not been investigated comprehensively and deeply in the literature. Although considering joint optimization of planning problems would increase the computational complexity, it may improve the efficiency and level of service of EBs transit systems. Therefore, such integration could be an interesting area of research in the future.
Charging scheduling of electric buses should be studied for heterogeneous bus types with mixed-type charging technology, such as depot charging and fast charging. Additionally, to dynamically modify the charging schedule, monitoring the real-time information of EBs, such as state of charge (SoC) of batteries, traffic conditions, the passenger travel demand during the day, and buses’ earliness and tardiness, should be considered in future works [72]. Moreover, the stochastic behavior of electric bus operations has not been well examined up to this point. As a result, using stochastic or robust optimization models seems to be a promising area for further research [68].
Another gap that should be filled is the impacts of charging station location and electric bus scheduling on the grid. If we want to categorize such impacts, it will result in negative and positive impacts. Negative impacts refer to the charging loads of electric buses, especially during peak hours. Reducing the grid’s stability, generating harmonics, and reducing the transformer service life are several negative impacts on the grid. Such issues should be addressed in future studies, and the effects of the EBs charging load should be taken into account for each step of public transportation planning. The positive side refers to using V2G, or in this context, B2G configuration. This technology will help the grid to be more stable and supply energy through ancillary services.
In most studies, the charging locations of electric buses are assumed to be at depots or terminals [61]. By eliminating this assumption, the location problem for charging stations could be studied too. With a rapid increase in fully electric buses, research on the integration of bus scheduling and fast-charging infrastructure location problem will be necessary. Integration of crew scheduling with electric bus scheduling and timetabling has significant research value and should be considered in future studies.
In a real-world setting, unpredictable circumstances, including road, weather conditions, and driving habits, may impact how much energy BEBs use [204]. Additionally, estimating EBs’ energy consumption involves an unanticipated inaccuracy due to the uncertainty around passenger volume. This would affect the scheduling process of EBs and their recharging procedure. Thus, the uncertain energy consumption of EBs and more accurate energy consumption models should be taken into account to improve bus scheduling and their charging scheduling. Adding more charging strategies and partial charging choices might further boost the BEB system’s operating effectiveness. As a result, future studies could investigate a hybrid strategy that combines various charging techniques and further look into the possibility of partial charging at the central terminal in mixed-type chargers.
Exploring the effects of charger location planning for expanding or modifying the network design should be a focus. In other words, the impacts of fast charging infrastructure locations should also be taken into account from the bus network design point of view. Furthermore, operational features such as traffic conditions, energy consumption, charging schedules, and time-of-use pricing strategy could be considered in future research [76].
All in all, Figure 8 represents different solution approaches to deal with electric bus scheduling, timetabling, charging scheduling, fast charging infrastructure location planning, and their impacts on the grid. The red dots indicate that the integration of these research areas has not been studied yet. Note that several other possibilities for integrating these problems are not shown in this figure and have not been investigated. The main purpose of this figure is to show the adopted methods for solving the integration of such problems with each other. As it is represented in the figure, a few papers discussed such optimization problems with exact solution approaches. Thus, focusing on developing exact methods to solve these problems would be another research goal for future studies. Another point of this figure is to show the possible future direction for research in this scope. For example, electric bus scheduling, FCILP, and impacts on the grid have not been investigated yet. Thus, this could be an interesting area of research in the future.

Author Contributions

Conceptualization, K.A., S.H. and U.E.; Formal Analysis, K.A. and S.H.; Investigation, K.A. and S.H.; Writing—Original Draft Preparation, K.A. and S.H.; Writing—Review and Editing, U.E. and C.L.; Visualization, K.A. and S.H.; Supervision, U.E. All authors have read and agreed to the published version of the manuscript.

Funding

This research received no external funding.

Data Availability Statement

Not applicable.

Acknowledgments

The authors acknowledge that this research was supported by the Canada Excellence Research Chairs program.

Conflicts of Interest

The authors declare no conflict of interest.

Abbreviations

The following abbreviations are used in this manuscript:
AARC   Affinely adjustable robust counterpart
ACO   Ant colony optimization
AGA   Adaptive genetic algorithm
BEB   Battery-electric bus
BOT   Build-operate-transfer
BPSO   Binary particle swarm optimization
B2G   Bus to grid
DF   Deficit function
DG   Distribution grid
DODDepth of discharge
DSODistribution system operation
EBElectric bus
EBSElectric bus scheduling
EHDGEnhanced heuristic descent gradient
EVElectric vehicle
FCILPFast charging infrastructure location planning
GAGenetic algorithm
G2VGrid to vehicle
ILPInteger linear programming
ITTVSIntegrated timetabling and vehicle scheduling
LNSLarge neighborhood search
MILPMixed-integer linear programming
MIPMixed-integer programming
NSGA-IINon-dominated sorting genetic algorithm II
PHAProgressive hedging algorithm
PHEVPlug-in hybrid electric vehicles
PSOParticle swarm optimization
SASimulated annealing
TOUTime-of-use
TSOTransmission system operation
TTTimetabling
UBPMUncertain bi-level programming model
VSVehicle scheduling
VNSVariable neighborhood search
VSP-TWVehicle scheduling problem with time windows
V2GVehicle to grid
V2HVehicle to home

Appendix A

Appendix A.1

min C E B = min C p + t = 1 D π t · P t E B
The objective function aims to minimize the penalty cost for the aggregated EB is C p and summation of the electricity cost at time interval t, and the charging load for all the EBs at each time interval t is P t E B . The optimal power flow is a combination of the operation constraints and objective function, as mentioned in Equations (A1)–(A10). The power flow equation is subjected to the active and reactive power balance equations as follows:
P j , t g P j , t d = k = 1 N V j , t · V k , t · Y j , k · cos θ j , k + δ k , t δ j , t , t T ; ( j , k ) N
Q j , t g Q j , t d = k = 1 N V j , t · V k , t · Y j , k · sin θ j , k + δ k , t δ j , t , t T ; ( j , k ) N
where j , k , P j , t g , P j , t d , V j , t , V k , t , θ j , k , δ k , t , δ j , t , Q j , t g , and Q j , t d are bus j and k, active power generation, active power demand, voltage at bus j, k at time t, voltage angle at bus j, k at time t, reactive power generation, and reactive power demand, respectively. Equation (A2) is the active power flow equation, where the first term is active power generation of the distribution substation. The second term is the aggregated active power demand of the EB and household connected to that bus. The right-hand sides of the equations in (A2) represent the active power losses at that bus. Equation (A3) is the reactive power flow equation, where the first term is reactive power generation of the distribution substation. The second term is the aggregated reactive power demand. The right-hand sides of the equations in (A3) represent the active power losses at that bus.
Other constraints of the optimal power flow are voltage of the bus, angle of the bus, and active and reactive power generation limit. Equation (A4) ensures that the bus voltage is within the limit. Additionally, Equation (A5) keeps the bus angle between the required limits. Similarly, the active and reactive power drawn from the substation are limited in the equation as in (A6) and (A7), respectively.
V j min V j , t V j max , t T ; j N
σ j min σ j , t σ j max , t T ; j N
P g j min P j , t g P g j max , t T ; j = s
Q g j min Q j , t g Q g j max , t T ; j = s
where V j min , V j max , σ j min , σ j max , P g j min , P g j max , Q g j min , and Q g j min are the minimum and maximum voltage, voltage angle, and minimum and maximum active and reactive generation power limits of the substation, respectively. The power flow equation includes other additional constraints of EB charging and power/energy requirements. The energy required for charging all the EBs is guaranteed in (A8), and the charging power of EB should not exceed the maximum power limit of the distribution system operators (DSO), as in (A9). Equation (A10) ensures that the charging power of the EB is within the limit of the charging power of the charger.
E i req = t = 1 D P t , E B C h · Δ T , t T
P t E B < P t , D S O m a x t T
0 P t , E B C h P t , m a x C h , t T
where E i req , P t , E B C h , P t , E B , P t , D S O m a x , and P t , m a x C h , are the energy required for the EB, charging power of EB, maximum power drawn from the DSO, and maximum power limit on the EB’s charging.

Appendix A.2

Minimize o O c o · x 0
subject to 0 O l , l L
y l o charging σ · x 0 l L
y l s t a r t l in = ϵ 0 O l , l L
y l o in + y l o charging = y l o out 0 O l middle , l L
y l o in = y l o 1 out R o 1 , o l 0 O l e n d l , l L
y l o out R o , 0 + 1 l · 1 + S O C min l L
y l e n d l in = y lend out
x 0 { 0 , 1 } 0 O
y l o in , y l o out , y l o charging Z + 0 O l , l L
The objective function in (A11) is to reduce the overall cost of installing chargers. Constraints (A12), which prevent the energy delivered from the charging station from going over the maximum battery capacity, are in place. The energy level is initialized by constraints (A13) at all line starts and ends. The energy is balanced at each bus stop along a line thanks to constraints (A14). It suggests that the amount of energy in the bus’s battery when it leaves a bus stop is equal to the total of the energy it had when it arrived at the stop and the energy it received from charging. According to Equation (A15), the amount of energy in the battery when the bus enters the middle stop along a line is equal to the amount of energy in the battery when the bus leaves the prior bus stop, less the amount of energy used while traveling. Equation (A16) makes sure that while moving from one stop to another, the energy level does not fall below the minimal state-of-charge. Since there is no more distance to be covered, it is considered that no charging is necessary at line end stops. In (A17), there is support for this assumption.

Appendix A.3

min i : ( j , i ) A c j i x j i
s . t . j : ( j , i ) A x j i = 1 i S ,
j : ( j , i ) A x j i i : ( i , j ) A x i j = 0 j S ,
g i = j : ( j , i ) A g j + d j i x j i i S ,
g o = 0 ,
g j + d j d x j d D ( j , d ) A ,
i : ( j , i ) A x j i K j = 0 ,
x i j { 0 , 1 } ( i , j ) A .
Minimizing total operational costs is the objective. In terms of covering and flow conservation, constraints (A21) and (A22) are used. The cumulative distance traveled since the most recent battery renewal is determined in (A23). Equation (A24) ensures that a vehicle departs from the depot or completes the battery servicing at a station. Equation (A25) ensures the maximum route distance restriction cannot be exceeded. Constraints (A26) ensure that the overall fleet size does not exceed the upper bound.

References

  1. Nejat, P.; Jomehzadeh, F.; Taheri, M.M.; Gohari, M.; Majid, M.Z.A. A global review of energy consumption, CO2 emissions and policy in the residential sector (with an overview of the top ten CO2 emitting countries). Renew. Sustain. Energy Rev. 2015, 43, 843–862. [Google Scholar] [CrossRef]
  2. Emissions from Bus Travel. Available online: https://www.carbonindependent.org/20.html (accessed on 5 May 2022).
  3. Miles, J.; Potter, S. Developing a viable electric bus service: The Milton Keynes demonstration project. Res. Transp. Econ. 2014, 48, 357–363. [Google Scholar] [CrossRef]
  4. Deng, R.; Liu, Y.; Chen, W.; Liang, H. A survey on electric buses—energy storage, power management, and charging scheduling. IEEE Trans. Intell. Transp. Syst. 2019, 22, 9–22. [Google Scholar] [CrossRef]
  5. Li, J.Q. Battery-electric transit bus developments and operations: A review. Int. J. Sustain. Transp. 2016, 10, 157–169. [Google Scholar] [CrossRef]
  6. An, K. Battery electric bus infrastructure planning under demand uncertainty. Transp. Res. Part C: Emerg. Technol. 2020, 111, 572–587. [Google Scholar] [CrossRef]
  7. European Alternative Fuels Observatory. Available online: https://alternative-fuels-observatory.ec.europa.eu/ (accessed on 17 April 2022).
  8. Electric Buses Arrive on Time—Transport & Environment. Available online: https://www.transportenvironment.org/discover/electric-buses-arrive-time/ (accessed on 17 April 2022).
  9. Kang, J.; Yu, R.; Huang, X.; Maharjan, S.; Zhang, Y.; Hossain, E. Enabling Localized Peer-to-Peer Electricity Trading among Plug-in Hybrid Electric Vehicles Using Consortium Blockchains. IEEE Trans. Ind. Inform. 2017, 13, 3154–3164. [Google Scholar] [CrossRef]
  10. Zhang, Y.; Hu, Q.; Meng, Z.; Ralescu, A. Fuzzy dynamic timetable scheduling for public transit. Fuzzy Sets Syst. 2020, 395, 235–253. [Google Scholar] [CrossRef]
  11. Bie, Y.; Hao, M.; Guo, M. Optimal electric bus scheduling based on the combination of all-stop and short-turning strategies. Sustainability 2021, 13, 1827. [Google Scholar] [CrossRef]
  12. He, Y.; Liu, Z.; Song, Z. Optimal charging scheduling and management for a fast-charging battery electric bus system. Transp. Res. Part E Logist. Transp. Rev. 2020, 142, 102056. [Google Scholar] [CrossRef]
  13. Lajunen, A. Lifecycle costs and charging requirements of electric buses with different charging methods. J. Clean. Prod. 2018, 172, 56–67. [Google Scholar] [CrossRef]
  14. Mahmoud, M.; Garnett, R.; Ferguson, M.; Kanaroglou, P. Electric buses: A review of alternative powertrains. Renew. Sustain. Energy Rev. 2016, 62, 673–684. [Google Scholar] [CrossRef]
  15. DaSilva, L.; Mohamed, M. Optimizing Electric Bus Transit Systems: A Review of Modelling Techniques and Methods. In Proceedings of the 55th Annual Meetings of the Canadian Transportation Research Forum, Montreal, QC, USA, 24–27 May 2020. [Google Scholar]
  16. Perumal, S.S.; Lusby, R.M.; Larsen, J. Electric bus planning & scheduling: A review of related problems and methodologies. Eur. J. Oper. Res. 2021, 301, 395–413. [Google Scholar]
  17. Manzolli, J.A.; Trovão, J.P.; Antunes, C.H. A review of electric bus vehicles research topics–Methods and trends. Renew. Sustain. Energy Rev. 2022, 159, 112211. [Google Scholar] [CrossRef]
  18. Rong, A.; Chen, S.; Shi, D.; Zhang, M.; Wang, C. A Review on Electric Bus Charging Scheduling from Viewpoints of Vehicle Scheduling. In Proceedings of the 2021 IEEE International Conference on Industrial Engineering and Engineering Management (IEEM), Marina Bay Sands, Singapore, 13 December 2021; pp. 1–5. [Google Scholar]
  19. Aamodt, A.; Cory, K.; Coney, K. Electrifying Transit: A Guidebook for Implementing Battery Electric Buses; Technical Report; National Renewable Energy Lab. (NREL): Golden, CO, USA, 2021. [Google Scholar]
  20. Mathieu, L. Electric Buses Arrive on Time—Marketplace, Economic, Technology, Environmental and Policy Perspectives for Fully Electric Buses in the EU. Transport and Environment. Available online: https://www.transportenvironment.org/wp-content/uploads/2021/07/Electric-buses-arrive-on-time-1.pdf (accessed on 8 May 2022).
  21. Alwesabi, Y.; Liu, Z.; Kwon, S.; Wang, Y. A novel integration of scheduling and dynamic wireless charging planning models of battery electric buses. Energy 2021, 230, 120806. [Google Scholar] [CrossRef]
  22. Bi, Z.; De Kleine, R.; Keoleian, G.A. Integrated Life Cycle Assessment and Life Cycle Cost Model for Comparing Plug-in versus Wireless Charging for an Electric Bus System. J. Ind. Ecol. 2017, 21, 344–355. [Google Scholar] [CrossRef]
  23. Ahmad, F.; Saad Alam, M.; Saad Alsaidan, I.; Shariff, S.M. Battery swapping station for electric vehicles: Opportunities and challenges. IET Smart Grid 2020, 3, 280–286. [Google Scholar] [CrossRef]
  24. Fang, S.C.; Ke, B.R.; Chung, C.Y. Minimization of construction costs for an all battery-swapping electric-bus transportation system: Comparison with an all plug-in system. Energies 2017, 10, 890. [Google Scholar] [CrossRef] [Green Version]
  25. Kunith, A.; Mendelevitch, R.; Kuschmierz, A.; Goehlich, D. Optimization of fast charging infrastructure for electric bus transportation–Electrification of a city bus network. In Proceedings of the EVS29 International Battery, Hybrid and Fuel Cell Electric Vehicle Symposium, Montréal, QC, Canada, 19–22 June 2016. [Google Scholar]
  26. Bi, Z.; Song, L.; De Kleine, R.; Mi, C.C.; Keoleian, G.A. Plug-in vs. wireless charging: Life cycle energy and greenhouse gas emissions for an electric bus system. Appl. Energy 2015, 146, 11–19. [Google Scholar] [CrossRef] [Green Version]
  27. Shin, J.; Shin, S.; Kim, Y.; Ahn, S.; Lee, S.; Jung, G.; Jeon, S.J.; Cho, D.H. Design and implementation of shaped magnetic-resonance-based wireless power transfer system for roadway-powered moving electric vehicles. IEEE Trans. Ind. Electron. 2013, 61, 1179–1192. [Google Scholar] [CrossRef]
  28. Teoh, L.E.; Khoo, H.L.; Goh, S.Y.; Chong, L.M. Scenario-based electric bus operation: A case study of Putrajaya, Malaysia. Int. J. Transp. Sci. Technol. 2018, 7, 10–25. [Google Scholar] [CrossRef]
  29. Correa, G.; Muñoz, P.; Falaguerra, T.; Rodriguez, C. Performance comparison of conventional, hybrid, hydrogen and electric urban buses using well to wheel analysis. Energy 2017, 141, 537–549. [Google Scholar] [CrossRef]
  30. Al-Ogaili, A.S.; Al-Shetwi, A.Q.; Al-Masri, H.M.; Babu, T.S.; Hoon, Y.; Alzaareer, K.; Babu, N.P. Review of the Estimation Methods of Energy Consumption for Battery Electric Buses. Energies 2021, 14, 7578. [Google Scholar] [CrossRef]
  31. Yoldaş, Y.; Önen, A.; Muyeen, S.; Vasilakos, A.V.; Alan, I. Enhancing smart grid with microgrids: Challenges and opportunities. Renew. Sustain. Energy Rev. 2017, 72, 205–214. [Google Scholar] [CrossRef]
  32. Habib, S.; Khan, M.M.; Abbas, F.; Sang, L.; Shahid, M.U.; Tang, H. A comprehensive study of implemented international standards, technical challenges, impacts and prospects for electric vehicles. IEEE Access 2018, 6, 13866–13890. [Google Scholar]
  33. Lepre, N.; Burget, S.; McKenzie, L. Deploying Charging Infrastructure for Electric Transit Buses. Available online: https://atlaspolicy.com/wp-content/uploads/2022/05/Deploying-Charging-Infrastructure-for-Electric-Transit-Buses.pdf (accessed on 16 July 2022).
  34. Tan, K.M.; Ramachandaramurthy, V.K.; Yong, J.Y. Integration of electric vehicles in smart grid: A review on vehicle to grid technologies and optimization techniques. Renew. Sustain. Energy Rev. 2016, 53, 720–732. [Google Scholar] [CrossRef]
  35. Yong, J.Y.; Ramachandaramurthy, V.K.; Tan, K.M.; Mithulananthan, N. A review on the state-of-the-art technologies of electric vehicle, its impacts and prospects. Renew. Sustain. Energy Rev. 2015, 49, 365–385. [Google Scholar] [CrossRef]
  36. Tran, D.H.; Choi, W. Design of a high-efficiency wireless power transfer system with intermediate coils for the on-board chargers of electric vehicles. IEEE Trans. Power Electron. 2017, 33, 175–187. [Google Scholar] [CrossRef]
  37. Patil, D.; Mcdonough, M.K.; Miller, J.M.; Fahimi, B.; Balsara, P.T. Wireless power transfer for vehicular applications: Overview and challenges. IEEE Trans. Transp. Electrif. 2017, 4, 3–37. [Google Scholar] [CrossRef]
  38. Zhang, T.; Chen, X.; Yu, Z.; Zhu, X.; Shi, D. A Monte Carlo simulation approach to evaluate service capacities of EV charging and battery swapping stations. IEEE Trans. Ind. Inform. 2018, 14, 3914–3923. [Google Scholar] [CrossRef]
  39. Sun, B.; Tan, X.; Tsang, D.H. Optimal charging operation of battery swapping and charging stations with QoS guarantee. IEEE Trans. Smart Grid 2017, 9, 4689–4701. [Google Scholar] [CrossRef]
  40. Martínez-Lao, J.; Montoya, F.G.; Montoya, M.G.; Manzano-Agugliaro, F. Electric vehicles in Spain: An overview of charging systems. Renew. Sustain. Energy Rev. 2017, 77, 970–983. [Google Scholar] [CrossRef]
  41. Jung, J.; Chow, J.Y.; Jayakrishnan, R.; Park, J.Y. Stochastic dynamic itinerary interception refueling location problem with queue delay for electric taxi charging stations. Transp. Res. Part C Emerg. Technol. 2014, 40, 123–142. [Google Scholar] [CrossRef]
  42. Eisel, M.; Schmidt, J.; Kolbe, L.M. Finding suitable locations for charging stations. In Proceedings of the 2014 IEEE International Electric Vehicle Conference (IEVC), Florence, Italy, 17–19 December 2014; pp. 1–8. [Google Scholar]
  43. Baouche, F.; Billot, R.; Trigui, R.; El Faouzi, N.E. Efficient allocation of electric vehicles charging stations: Optimization model and application to a dense urban network. IEEE Intell. Transp. Syst. Mag. 2014, 6, 33–43. [Google Scholar] [CrossRef]
  44. Asamer, J.; Reinthaler, M.; Ruthmair, M.; Straub, M.; Puchinger, J. Optimizing charging station locations for urban taxi providers. Transp. Res. Part A Policy Pract. 2016, 85, 233–246. [Google Scholar] [CrossRef] [Green Version]
  45. He, S.Y.; Kuo, Y.H.; Wu, D. Incorporating institutional and spatial factors in the selection of the optimal locations of public electric vehicle charging facilities: A case study of Beijing, China. Transp. Res. Part C Emerg. Technol. 2016, 67, 131–148. [Google Scholar] [CrossRef]
  46. Kuby, M.; Lim, S. The flow-refueling location problem for alternative-fuel vehicles. Socio-Econ. Plan. Sci. 2005, 39, 125–145. [Google Scholar] [CrossRef]
  47. Mak, H.Y.; Rong, Y.; Shen, Z.J.M. Infrastructure planning for electric vehicles with battery swapping. Manag. Sci. 2013, 59, 1557–1575. [Google Scholar] [CrossRef] [Green Version]
  48. Zhang, H.; Moura, S.J.; Hu, Z.; Qi, W.; Song, Y. A second-order cone programming model for planning PEV fast-charging stations. IEEE Trans. Power Syst. 2017, 33, 2763–2777. [Google Scholar] [CrossRef] [Green Version]
  49. He, F.; Yin, Y.; Zhou, J. Deploying public charging stations for electric vehicles on urban road networks. Transp. Res. Part C: Emerg. Technol. 2015, 60, 227–240. [Google Scholar] [CrossRef]
  50. Chen, Z.; He, F.; Yin, Y. Optimal deployment of charging lanes for electric vehicles in transportation networks. Transp. Res. Part B Methodol. 2016, 91, 344–365. [Google Scholar] [CrossRef] [Green Version]
  51. He, F.; Wu, D.; Yin, Y.; Guan, Y. Optimal deployment of public charging stations for plug-in hybrid electric vehicles. Transp. Res. Part B Methodol. 2013, 47, 87–101. [Google Scholar] [CrossRef]
  52. Lin, Y.; Zhang, K.; Shen, Z.J.M.; Ye, B.; Miao, L. Multistage large-scale charging station planning for electric buses considering transportation network and power grid. Transp. Res. Part C Emerg. Technol. 2019, 107, 423–443. [Google Scholar] [CrossRef]
  53. Ko, Y.D.; Jang, Y.J. The optimal system design of the online electric vehicle utilizing wireless power transmission technology. IEEE Trans. Intell. Transp. Syst. 2013, 14, 1255–1265. [Google Scholar] [CrossRef]
  54. Liu, Z.; Song, Z. Robust planning of dynamic wireless charging infrastructure for battery electric buses. Transp. Res. Part C Emerg. Technol. 2017, 83, 77–103. [Google Scholar] [CrossRef]
  55. Helber, S.; Broihan, J.; Jang, Y.J.; Hecker, P.; Feuerle, T. Location planning for dynamic wireless charging systems for electric airport passenger buses. Energies 2018, 11, 258. [Google Scholar] [CrossRef] [Green Version]
  56. Kunith, A.; Mendelevitch, R.; Goehlich, D. Electrification of a city bus network—An optimization model for cost-effective placing of charging infrastructure and battery sizing of fast-charging electric bus systems. Int. J. Sustain. Transp. 2017, 11, 707–720. [Google Scholar] [CrossRef] [Green Version]
  57. Xylia, M.; Leduc, S.; Patrizio, P.; Kraxner, F.; Silveira, S. Locating charging infrastructure for electric buses in Stockholm. Transp. Res. Part C Emerg. Technol. 2017, 78, 183–200. [Google Scholar] [CrossRef]
  58. Mohamed, M.; Farag, H.; El-Taweel, N.; Ferguson, M. Simulation of electric buses on a full transit network: Operational feasibility and grid impact analysis. Electr. Power Syst. Res. 2017, 142, 163–175. [Google Scholar] [CrossRef]
  59. Liu, Y.; Feng, X.; Ding, C.; Hua, W.; Ruan, Z. Electric transit network design by an improved artificial fish-swarm algorithm. J. Transp. Eng. Part A Syst. 2020, 146, 04020071. [Google Scholar] [CrossRef]
  60. Uslu, T.; Kaya, O. Location and capacity decisions for electric bus charging stations considering waiting times. Transp. Res. Part D Transp. Environ. 2021, 90, 102645. [Google Scholar] [CrossRef]
  61. Rogge, M.; Van der Hurk, E.; Larsen, A.; Sauer, D.U. Electric bus fleet size and mix problem with optimization of charging infrastructure. Appl. Energy 2018, 211, 282–295. [Google Scholar] [CrossRef] [Green Version]
  62. Zhang, W.; Zhao, H.; Song, Z. Integrating transit route network design and fast charging station planning for battery electric buses. IEEE Access 2021, 9, 51604–51617. [Google Scholar] [CrossRef]
  63. Wang, G.; Fang, Z.; Xie, X.; Wang, S.; Sun, H.; Zhang, F.; Liu, Y.; Zhang, D. Pricing-aware real-time charging scheduling and charging station expansion for large-scale electric buses. ACM Trans. Intell. Syst. Technol. (TIST) 2020, 12, 1–26. [Google Scholar] [CrossRef]
  64. Kunith, A.; Goehlich, D.; Mendelevitch, R. Planning and optimization of a fast charging infrastructure for electric urban bus systems. In Proceedings of the 2nd International Conference on Traffic and Transport Engineering, Lisbon, Portugal, 17–18 April 2014; Volume 27. [Google Scholar]
  65. Wu, X.; Feng, Q.; Bai, C.; Lai, C.S.; Jia, Y.; Lai, L.L. A novel fast-charging stations locational planning model for electric bus transit system. Energy 2021, 224, 120106. [Google Scholar] [CrossRef]
  66. Othman, A.M.; Gabbar, H.A.; Pino, F.; Repetto, M. Optimal electrical fast charging stations by enhanced descent gradient and Voronoi diagram. Comput. Electr. Eng. 2020, 83, 106574. [Google Scholar] [CrossRef]
  67. Csonka, B. Optimization of static and dynamic charging infrastructure for electric buses. Energies 2021, 14, 3516. [Google Scholar] [CrossRef]
  68. He, Y.; Song, Z.; Liu, Z. Fast-charging station deployment for battery electric bus systems considering electricity demand charges. Sustain. Cities Soc. 2019, 48, 101530. [Google Scholar] [CrossRef] [Green Version]
  69. Olmos, J.; López, J.A.; Gaztañaga, H.; Herrera, V.I. Analysis of optimal charging points location and storage capacity for hybrid and full electric buses. In Proceedings of the 2019 Fourteenth International Conference on Ecological Vehicles and Renewable Energies (EVER), Monte-Carlo, Monaco, 8–10 May 2019; pp. 1–7. [Google Scholar]
  70. Rohrbeck, B.; Berthold, K.; Hettich, F. Location Planning of Charging Stations for Electric City Buses Considering Battery Ageing Effects. In Operations Research Proceedings 2017; Springer: Berlin/Heidelberg, Germany, 2018; pp. 701–707. [Google Scholar]
  71. Liu, Z.; Song, Z.; He, Y. Planning of fast-charging stations for a battery electric bus system under energy consumption uncertainty. Transp. Res. Rec. 2018, 2672, 96–107. [Google Scholar] [CrossRef] [Green Version]
  72. Hu, H.; Du, B.; Liu, W.; Perez, P. A joint optimisation model for charger locating and electric bus charging scheduling considering opportunity fast charging and uncertainties. Transp. Res. Part C Emerg. Technol. 2022, 141, 103732. [Google Scholar] [CrossRef]
  73. Olsen, N.; Kliewer, N. Location Planning of Charging Stations for Electric Buses in Public Transport Considering Vehicle Scheduling: A Variable Neighborhood Search Based Approach. Appl. Sci. 2022, 12, 3855. [Google Scholar] [CrossRef]
  74. Li, L.; Lo, H.K.; Xiao, F. Mixed bus fleet scheduling under range and refueling constraints. Transp. Res. Part C Emerg. Technol. 2019, 104, 443–462. [Google Scholar] [CrossRef]
  75. Stumpe, M.; Rößler, D.; Schryen, G.; Kliewer, N. Study on sensitivity of electric bus systems under simultaneous optimization of charging infrastructure and vehicle schedules. EURO J. Transp. Logist. 2021, 10, 100049. [Google Scholar] [CrossRef]
  76. Li, M.; Tang, P.; Lin, X.; He, F. Multistage planning of electric transit charging facilities under build-operate-transfer model. Transp. Res. Part D Transp. Environ. 2022, 102, 103118. [Google Scholar] [CrossRef]
  77. Tzamakos, D.; Iliopoulou, C.; Kepaptsoglou, K. Electric bus charging station location optimization considering queues. Int. J. Transp. Sci. Technol. 2022. [Google Scholar] [CrossRef]
  78. Abdelwahed, A.; van den Berg, P.L.; Brandt, T.; Collins, J.; Ketter, W. Evaluating and optimizing opportunity fast-charging schedules in transit battery electric bus networks. Transp. Sci. 2020, 54, 1601–1615. [Google Scholar] [CrossRef]
  79. Gkiotsalitis, K. Bus holding of electric buses with scheduled charging times. IEEE Trans. Intell. Transp. Syst. 2020, 22, 6760–6771. [Google Scholar] [CrossRef]
  80. Patil, R.; Rahegaonkar, A.; Patange, A.; Nalavade, S. Designing an optimized schedule of transit electric bus charging: A municipal level case study. Mater. Today Proc. 2022, 56, 2653–2658. [Google Scholar] [CrossRef]
  81. Wang, Y.; Huang, Y.; Xu, J.; Barclay, N. Optimal recharging scheduling for urban electric buses: A case study in Davis. Transp. Res. Part E Logist. Transp. Rev. 2017, 100, 115–132. [Google Scholar] [CrossRef]
  82. Jiang, Y.; He, T. Optimal Charging Scheduling and Management with Bus-Driver-Trip Assignment considering Mealtime Windows for an Electric Bus Line. Complexity 2022, 2022, 3087279. [Google Scholar] [CrossRef]
  83. Manzolli, J.A.; Trovão, J.P.F.; Antunes, C.H. Electric bus coordinated charging strategy considering V2G and battery degradation. Energy 2022, 254, 124252. [Google Scholar] [CrossRef]
  84. Huang, D.; Wang, Y.; Jia, S.; Liu, Z.; Wang, S. A Lagrangian relaxation approach for the electric bus charging scheduling optimisation problem. Transp. A Transp. Sci. 2022, 1–24. [Google Scholar] [CrossRef]
  85. Huang, D.; Wang, S. A two-stage stochastic programming model of coordinated electric bus charging scheduling for a hybrid charging scheme. Multimodal Transp. 2022, 1, 100006. [Google Scholar] [CrossRef]
  86. Hu, H.; Du, B.; Perez, P. Integrated optimisation of electric bus scheduling and top-up charging at bus stops with fast chargers. In Proceedings of the 2021 IEEE International Intelligent Transportation Systems Conference (ITSC), Indianapolis, IN, USA, 19–22 September 2021; pp. 2324–2329. [Google Scholar]
  87. Liu, T.; Ceder, A.A. Battery-electric transit vehicle scheduling with optimal number of stationary chargers. Transp. Res. Part C Emerg. Technol. 2020, 114, 118–139. [Google Scholar] [CrossRef]
  88. Wang, Y.; Liao, F.; Lu, C. Integrated optimization of charger deployment and fleet scheduling for battery electric buses. Transp. Res. Part D Transp. Environ. 2022, 109, 103382. [Google Scholar] [CrossRef]
  89. Ceder, A.A.; Hassold, S.; Dano, B. Approaching even-load and even-headway transit timetables using different bus sizes. Public Transp. 2013, 5, 193–217. [Google Scholar] [CrossRef]
  90. Teng, J.; Chen, T.; Fan, W. Integrated approach to vehicle scheduling and bus timetabling for an electric bus line. J. Transp. Eng. Part A Syst. 2020, 146, 04019073. [Google Scholar] [CrossRef]
  91. Zhang, S.; Ceder, A.A.; Cao, Z. Integrated optimization for feeder bus timetabling and procurement scheme with consideration of environmental impact. Comput. Ind. Eng. 2020, 145, 106501. [Google Scholar] [CrossRef]
  92. Shang, H.Y.; Huang, H.J.; Wu, W.X. Bus timetabling considering passenger satisfaction: An empirical study in Beijing. Comput. Ind. Eng. 2019, 135, 1155–1166. [Google Scholar] [CrossRef]
  93. Ceder, A.; Philibert, L. Transit timetables resulting in even maximum load on individual vehicles. IEEE Trans. Intell. Transp. Syst. 2014, 15, 2605–2614. [Google Scholar] [CrossRef]
  94. Häll, C.H.; Ceder, A.; Ekström, J.; Quttineh, N.H. Adjustments of public transit operations planning process for the use of electric buses. J. Intell. Transp. Syst. 2019, 23, 216–230. [Google Scholar] [CrossRef]
  95. Ceder, A.; Golany, B.; Tal, O. Creating bus timetables with maximal synchronization. Transp. Res. Part A Policy Pract. 2001, 35, 913–928. [Google Scholar] [CrossRef]
  96. Zhigang, L.; Jinsheng, S.; Haixing, W.; Wei, Y. Regional bus timetabling model with synchronization. J. Transp. Syst. Eng. Inf. Technol. 2007, 7, 109–112. [Google Scholar]
  97. Ibarra-Rojas, O.J.; Rios-Solis, Y.A. Synchronization of bus timetabling. Transp. Res. Part B Methodol. 2012, 46, 599–614. [Google Scholar] [CrossRef]
  98. Saharidis, G.K.; Dimitropoulos, C.; Skordilis, E. Minimizing waiting times at transitional nodes for public bus transportation in Greece. Oper. Res. 2014, 14, 341–359. [Google Scholar] [CrossRef]
  99. Parbo, J.; Nielsen, O.A.; Prato, C.G. User perspectives in public transport timetable optimisation. Transp. Res. Part C Emerg. Technol. 2014, 48, 269–284. [Google Scholar] [CrossRef] [Green Version]
  100. Gkiotsalitis, K.; Alesiani, F. Robust timetable optimization for bus lines subject to resource and regulatory constraints. Transp. Res. Part E Logist. Transp. Rev. 2019, 128, 30–51. [Google Scholar] [CrossRef]
  101. Kliewer, N.; Mellouli, T.; Suhl, L. A time–space network based exact optimization model for multi-depot bus scheduling. Eur. J. Oper. Res. 2006, 175, 1616–1627. [Google Scholar] [CrossRef]
  102. Wen, M.; Linde, E.; Ropke, S.; Mirchandani, P.; Larsen, A. An adaptive large neighborhood search heuristic for the electric vehicle scheduling problem. Comput. Oper. Res. 2016, 76, 73–83. [Google Scholar] [CrossRef] [Green Version]
  103. Gertsbach, I.; Gurevich, Y. Constructing an optimal fleet for a transportation schedule. Transp. Sci. 1977, 11, 20–36. [Google Scholar] [CrossRef]
  104. Ceder, A.; Stern, H.I. Deficit function bus scheduling with deadheading trip insertions for fleet size reduction. Transp. Sci. 1981, 15, 338–363. [Google Scholar] [CrossRef]
  105. Ceder, A. Public Transit Planning and Operation: Modeling, Practice and Behavior; CRC Press: Boca Raton, FL, USA, 2016. [Google Scholar]
  106. Liu, T.; Ceder, A.A. Deficit function related to public transport: 50 year retrospective, new developments, and prospects. Transp. Res. Part B Methodol. 2017, 100, 1–19. [Google Scholar] [CrossRef]
  107. Li, J.Q. Transit bus scheduling with limited energy. Transp. Sci. 2014, 48, 521–539. [Google Scholar] [CrossRef]
  108. Wang, H.; Shen, J. Heuristic approaches for solving transit vehicle scheduling problem with route and fueling time constraints. Appl. Math. Comput. 2007, 190, 1237–1249. [Google Scholar] [CrossRef]
  109. Chao, Z.; Xiaohong, C. Optimizing battery electric bus transit vehicle scheduling with battery exchanging: Model and case study. Procedia-Soc. Behav. Sci. 2013, 96, 2725–2736. [Google Scholar] [CrossRef] [Green Version]
  110. Paul, T.; Yamada, H. Operation and charging scheduling of electric buses in a city bus route network. In Proceedings of the 17th International IEEE Conference on Intelligent Transportation Systems (ITSC), Qingdao, China, 8–11 October 2014; pp. 2780–2786. [Google Scholar]
  111. Sung, Y.W.; Chu, J.C.; Chang, Y.J.; Yeh, J.C.; Chou, Y.H. Optimizing mix of heterogeneous buses and chargers in electric bus scheduling problems. Simul. Model. Pract. Theory 2022, 119, 102584. [Google Scholar] [CrossRef]
  112. Ke, B.R.; Fang, S.C.; Lai, J.H. Adjustment of bus departure time of an electric bus transportation system for reducing costs and carbon emissions: A case study in Penghu. Energy Environ. 2022, 33, 728–751. [Google Scholar] [CrossRef]
  113. Wang, J.; Wang, H.; Chang, A.; Song, C. Collaborative Optimization of Vehicle and Crew Scheduling for a Mixed Fleet with Electric and Conventional Buses. Sustainability 2022, 14, 3627. [Google Scholar] [CrossRef]
  114. Li, X.; Wang, T.; Li, L.; Feng, F.; Wang, W.; Cheng, C. Joint optimization of regular charging electric bus transit network schedule and stationary charger deployment considering partial charging policy and time-of-use electricity prices. J. Adv. Transp. 2020, 2020, 8863905. [Google Scholar] [CrossRef]
  115. Guo, J.; Xue, Y.; Guan, H. Research on the combinatorial optimization of EBs departure interval and vehicle configuration based on uncertain bi-level programming. Transp. Lett. 2022, 1–11. [Google Scholar] [CrossRef]
  116. Yao, E.; Liu, T.; Lu, T.; Yang, Y. Optimization of electric vehicle scheduling with multiple vehicle types in public transport. Sustain. Cities Soc. 2020, 52, 101862. [Google Scholar] [CrossRef]
  117. Zhou, G.J.; Xie, D.F.; Zhao, X.M.; Lu, C. Collaborative optimization of vehicle and charging scheduling for a bus fleet mixed with electric and traditional buses. IEEE Access 2020, 8, 8056–8072. [Google Scholar] [CrossRef]
  118. Zhu, Y.; Yan, F.; Pan, J.S.; Yu, L.; Bai, Y.; Wang, W.; He, C.; Shi, Z. Mutigroup-Based Phasmatodea Population Evolution Algorithm with Mutistrategy for IoT Electric Bus Scheduling. Wirel. Commun. Mob. Comput. 2022, 2022, 1500646. [Google Scholar] [CrossRef]
  119. Alwesabi, Y.; Wang, Y.; Avalos, R.; Liu, Z. Electric bus scheduling under single depot dynamic wireless charging infrastructure planning. Energy 2020, 213, 118855. [Google Scholar] [CrossRef]
  120. Rinaldi, M.; Parisi, F.; Laskaris, G.; D’Ariano, A.; Viti, F. Optimal dispatching of electric and hybrid buses subject to scheduling and charging constraints. In Proceedings of the 2018 21st International Conference on Intelligent Transportation Systems (ITSC), Maui, HI, USA, 4–7 November 2018; pp. 41–46. [Google Scholar]
  121. Tang, X.; Lin, X.; He, F. Robust scheduling strategies of electric buses under stochastic traffic conditions. Transp. Res. Part C Emerg. Technol. 2019, 105, 163–182. [Google Scholar] [CrossRef]
  122. Jiang, M.; Zhang, Y. A Branch-and-Price Algorithm for Large-Scale Multidepot Electric Bus Scheduling. IEEE Trans. Intell. Transp. Syst. 2022. [Google Scholar] [CrossRef]
  123. Gkiotsalitis, K.; Iliopoulou, C.; Kepaptsoglou, K. An exact approach for the multi-depot electric bus scheduling problem with time windows. Eur. J. Oper. Res. 2022. [Google Scholar] [CrossRef]
  124. Reuer, J.; Kliewer, N.; Wolbeck, L. The electric vehicle scheduling problem: A study on time-space network based and heuristic solution. In Proceedings of the Conference on Advanced Systems in Public Transport (CASPT), Rotterdam, The Netherlands, 19–23 July 2015. [Google Scholar]
  125. Zhang, A.; Li, T.; Zheng, Y.; Li, X.; Abdullah, M.G.; Dong, C. Mixed electric bus fleet scheduling problem with partial mixed-route and partial recharging. Int. J. Sustain. Transp. 2022, 16, 73–83. [Google Scholar] [CrossRef]
  126. Wu, W.; Lin, Y.; Liu, R.; Jin, W. The multi-depot electric vehicle scheduling problem with power grid characteristics. Transp. Res. Part B Methodol. 2022, 155, 322–347. [Google Scholar] [CrossRef]
  127. van Kooten Niekerk, M.E.; Van den Akker, J.; Hoogeveen, J. Scheduling electric vehicles. Public Transp. 2017, 9, 155–176. [Google Scholar] [CrossRef] [Green Version]
  128. Ceder, A. Efficient timetabling and vehicle scheduling for public transport. In Computer-Aided Scheduling of Public Transport; Springer: Berlin/Heidelberg, Germany, 2001; pp. 37–52. [Google Scholar]
  129. Chakroborty, P.; Deb, K.; Sharma, R.K. Optimal fleet size distribution and scheduling of transit systems using genetic algorithms. Transp. Plan. Technol. 2001, 24, 209–225. [Google Scholar] [CrossRef]
  130. Fleurent, C.; Lessard, R.; Séguin, L. Transit timetable synchronization: Evaluation and optimization. In Proceedings of the 9th International Conference on Computer-Aided Scheduling of Public Transport (CASPT), San Diego, CA, USA, 9–11 August 2004. [Google Scholar]
  131. van den HEUVEL, A.; van den AKKER, J.; Van Kooten, M. Integrating Timetabling and Vehicle Scheduling in Public Bus Transportation; Reporte Técnico UU-CS-2008-003; Department of Information and Computing Sciences, Utrecht University: Holanda, The Netherlands, 2008. [Google Scholar]
  132. Fonseca, J.P.; van der Hurk, E.; Roberti, R.; Larsen, A. A matheuristic for transfer synchronization through integrated timetabling and vehicle scheduling. Transp. Res. Part B Methodol. 2018, 109, 128–149. [Google Scholar] [CrossRef] [Green Version]
  133. Petersen, H.L.; Larsen, A.; Madsen, O.B.; Petersen, B.; Ropke, S. The simultaneous vehicle scheduling and passenger service problem. Transp. Sci. 2013, 47, 603–616. [Google Scholar] [CrossRef] [Green Version]
  134. Carosi, S.; Frangioni, A.; Galli, L.; Girardi, L.; Vallese, G. A matheuristic for integrated timetabling and vehicle scheduling. Transp. Res. Part B Methodol. 2019, 127, 99–124. [Google Scholar] [CrossRef]
  135. Guihaire, V.; Hao, J.K. Transit network timetabling and vehicle assignment for regulating authorities. Comput. Ind. Eng. 2010, 59, 16–23. [Google Scholar] [CrossRef] [Green Version]
  136. Schmid, V.; Ehmke, J.F. Integrated timetabling and vehicle scheduling with balanced departure times. OR Spectr. 2015, 37, 903–928. [Google Scholar] [CrossRef]
  137. Ibarra-Rojas, O.J.; Giesen, R.; Rios-Solis, Y.A. An integrated approach for timetabling and vehicle scheduling problems to analyze the trade-off between level of service and operating costs of transit networks. Transp. Res. Part B Methodol. 2014, 70, 35–46. [Google Scholar] [CrossRef]
  138. Weiszer, M.; Fedorko, G.; Čujan, Z. Multiobjective evolutionary algorithm for integrated timetable optimization with vehicle scheduling aspects. Perner’s Contacts 2010, 5, 286–294. [Google Scholar]
  139. Liu, T.; Ceder, A. Synchronization of public transport timetabling with multiple vehicle types. Transp. Res. Rec. 2016, 2539, 84–93. [Google Scholar] [CrossRef]
  140. Liu, T.; Ceder, A.A. Integrated public transport timetable synchronization and vehicle scheduling with demand assignment: A bi-objective bi-level model using deficit function approach. Transp. Res. Procedia 2017, 23, 341–361. [Google Scholar] [CrossRef]
  141. Liu, T.; Ceder, A.; Chowdhury, S. Integrated public transport timetable synchronization with vehicle scheduling. Transp. A Transp. Sci. 2017, 13, 932–954. [Google Scholar] [CrossRef]
  142. Liu, Z.g.; Shen, J.s. Regional bus operation bi-level programming model integrating timetabling and vehicle scheduling. Syst. Eng.-Theory Pract. 2007, 27, 135–141. [Google Scholar] [CrossRef]
  143. Michaelis, M.; Schöbel, A. Integrating line planning, timetabling, and vehicle scheduling: A customer-oriented heuristic. Public Transp. 2009, 1, 211–232. [Google Scholar] [CrossRef] [Green Version]
  144. Pätzold, J.; Schiewe, A.; Schiewe, P.; Schöbel, A. Look-ahead approaches for integrated planning in public transportation. In Proceedings of the 17th Workshop on Algorithmic Approaches for Transportation Modelling Optimization, and Systems (ATMOS 2017), Vienna, Austria, 7–8 September 2017; Schloss Dagstuhl-Leibniz-Zentrum fuer Informatik: Dagstuhl, Germany, 2017. [Google Scholar]
  145. Perumal, S.S.; Dollevoet, T.; Huisman, D.; Lusby, R.M.; Larsen, J.; Riis, M. Solution approaches for integrated vehicle and crew scheduling with electric buses. Comput. Oper. Res. 2021, 132, 105268. [Google Scholar] [CrossRef]
  146. Cao, Z.; Ceder, A.A. Autonomous shuttle bus service timetabling and vehicle scheduling using skip-stop tactic. Transp. Res. Part C Emerg. Technol. 2019, 102, 370–395. [Google Scholar] [CrossRef]
  147. Khemakhem, S.; Rekik, M.; Krichen, L. A flexible control strategy of plug-in electric vehicles operating in seven modes for smoothing load power curves in smart grid. Energy 2017, 118, 197–208. [Google Scholar] [CrossRef]
  148. Clairand, J.M.; González-Rodríguez, M.; Cedeño, I.; Escrivá-Escrivá, G. A charging station planning model considering electric bus aggregators. Sustain. Energy Grids Netw. 2022, 30, 100638. [Google Scholar] [CrossRef]
  149. Dietmannsberger, M.; Schumann, M.; Meyer, M.; Schulz, D. Modelling the electrification of bus depots using real data: Consequences for the distribution grid and operational requirements. In Proceedings of the 1st E-Mobility Power System Integration Symposium, Berlin, Germany, 23 October 2017; p. 8. [Google Scholar]
  150. Korolko, N.; Sahinoglu, Z. Robust optimization of EV charging schedules in unregulated electricity markets. IEEE Trans. Smart Grid 2015, 8, 149–157. [Google Scholar] [CrossRef]
  151. Haidar, A.M.; Muttaqi, K.M.; Sutanto, D. Technical challenges for electric power industries due to grid-integrated electric vehicles in low voltage distributions: A review. Energy Convers. Manag. 2014, 86, 689–700. [Google Scholar] [CrossRef]
  152. Al-Saadi, M.; Bhattacharyya, S.; Tichelen, P.V.; Mathes, M.; Käsgen, J.; Van Mierlo, J.; Berecibar, M. Impact on the Power Grid Caused via Ultra-Fast Charging Technologies of the Electric Buses Fleet. Energies 2022, 15, 1424. [Google Scholar] [CrossRef]
  153. Leou, R.C.; Hung, J.J. Optimal Charging Schedule Planning and Economic Analysis for Electric Bus Charging Stations. Energies 2017, 10, 483. [Google Scholar] [CrossRef] [Green Version]
  154. Vagropoulos, S.I.; Bakirtzis, A.G. Optimal bidding strategy for electric vehicle aggregators in electricity markets. IEEE Trans. Power Syst. 2013, 28, 4031–4041. [Google Scholar] [CrossRef]
  155. Clement-Nyns, K.; Haesen, E.; Driesen, J. The impact of charging plug-in hybrid electric vehicles on a residential distribution grid. IEEE Trans. Power Syst. 2009, 25, 371–380. [Google Scholar] [CrossRef] [Green Version]
  156. Foster, J.M.; Trevino, G.; Kuss, M.; Caramanis, M.C. Plug-in electric vehicle and voltage support for distributed solar: Theory and application. IEEE Syst. J. 2012, 7, 881–888. [Google Scholar] [CrossRef]
  157. Li, T.; Zhang, J.; Zhang, Y.; Jiang, L.; Li, B.; Yan, D.; Ma, C. An optimal design and analysis of a hybrid power charging station for electric vehicles considering uncertainties. In Proceedings of the IECON 2018-44th Annual Conference of the IEEE Industrial Electronics Society, Washington, DC, USA, 21–23 October 2018; pp. 5147–5152. [Google Scholar]
  158. Zagrajek, K.; Paska, J.; Kłos, M.; Pawlak, K.; Marchel, P.; Bartecka, M.; Michalski, Ł.; Terlikowski, P. Impact of Electric Bus Charging on Distribution Substation and Local Grid in Warsaw. Energies 2020, 13, 1210. [Google Scholar] [CrossRef]
  159. Purnell, K.; Bruce, A.; MacGill, I. Impacts of electrifying public transit on the electricity grid, from regional to state level analysis. Appl. Energy 2022, 307, 118272. [Google Scholar] [CrossRef]
  160. Basma, H.; Mansour, C.; Haddad, M.; Nemer, M.; Stabat, P. Energy consumption and battery sizing for different types of electric bus service. Energy 2022, 239, 122454. [Google Scholar] [CrossRef]
  161. Abdullah, H.M.; Gastli, A.; Ben-Brahim, L. Reinforcement Learning Based EV Charging Management Systems—A review. IEEE Access 2021, 9, 41506–41531. [Google Scholar] [CrossRef]
  162. Dubey, A.; Santoso, S.; Cloud, M.P.; Waclawiak, M. Determining Time-of-Use Schedules for Electric Vehicle Loads: A Practical Perspective. IEEE Power Energy Technol. Syst. J. 2015, 2, 12–20. [Google Scholar] [CrossRef]
  163. Sun, B.; Huang, Z.; Tan, X.; Tsang, D.H. Optimal scheduling for electric vehicle charging with discrete charging levels in distribution grid. IEEE Trans. Smart Grid 2016, 9, 624–634. [Google Scholar] [CrossRef]
  164. Karfopoulos, E.; Hatziargyriou, N. Distributed coordination of electric vehicles for conforming to an energy schedule. Electr. Power Syst. Res. 2017, 151, 86–95. [Google Scholar] [CrossRef]
  165. Erdinç, O.; Taşcıkaraoǧlu, A.; Paterakis, N.G.; Dursun, I.; Sinim, M.C.; Catalao, J.P. Comprehensive optimization model for sizing and siting of DG units, EV charging stations, and energy storage systems. IEEE Trans. Smart Grid 2017, 9, 3871–3882. [Google Scholar] [CrossRef]
  166. Wu, F.; Sioshansi, R. A two-stage stochastic optimization model for scheduling electric vehicle charging loads to relieve distribution-system constraints. Transp. Res. Part B Methodol. 2017, 102, 55–82. [Google Scholar] [CrossRef]
  167. Samaras, P.; Fachantidis, A.; Tsoumakas, G.; Vlahavas, I. A prediction model of passenger demand using AVL and APC data from a bus fleet. In Proceedings of the 19th Panhellenic Conference on Informatics, Athens, Greece, 1–3 October 2015; pp. 129–134. [Google Scholar]
  168. Zhou, C.; Dai, P.; Li, R. The passenger demand prediction model on bus networks. In Proceedings of the 2013 IEEE 13th International Conference on Data Mining Workshops, Dallas, TX, USA, 7–10 December 2013; pp. 1069–1076. [Google Scholar]
  169. Mendes-Moreira, J.; Moreira-Matias, L.; Gama, J.; de Sousa, J.F. Validating the coverage of bus schedules: A machine learning approach. Inf. Sci. 2015, 293, 299–313. [Google Scholar] [CrossRef]
  170. Khiari, J.; Moreira-Matias, L.; Cerqueira, V.; Cats, O. Automated setting of bus schedule coverage using unsupervised machine learning. In Proceedings of the Pacific-Asia Conference on Knowledge Discovery and Data Mining, Auckland, New Zealand, 19–22 April 2016; pp. 552–564. [Google Scholar]
  171. Kang, Q.; Feng, S.; Zhou, M.; Ammari, A.C.; Sedraoui, K. Optimal load scheduling of plug-in hybrid electric vehicles via weight-aggregation multi-objective evolutionary algorithms. IEEE Trans. Intell. Transp. Syst. 2017, 18, 2557–2568. [Google Scholar] [CrossRef]
  172. Arif, S.M.; Lie, T.T.; Seet, B.C.; Ahsan, S.M.; Khan, H.A. Plug-in electric bus depot charging with PV and ESS and their impact on LV feeder. Energies 2020, 13, 2139. [Google Scholar] [CrossRef]
  173. Dai, Q.; Cai, T.; Duan, S.; Zhao, F. Stochastic modeling and forecasting of load demand for electric bus battery-swap station. IEEE Trans. Power Deliv. 2014, 29, 1909–1917. [Google Scholar] [CrossRef]
  174. Zhang, X. Short-Term Load Forecasting for Electric Bus Charging Stations Based on Fuzzy Clustering and Least Squares Support Vector Machine Optimized by Wolf Pack Algorithm. Energies 2018, 11, 1449. [Google Scholar] [CrossRef] [Green Version]
  175. Thiringer, T.; Haghbin, S. Power quality issues of a battery fast charging station for a fully-electric public transport system in Gothenburg city. Batteries 2015, 1, 22–33. [Google Scholar] [CrossRef] [Green Version]
  176. Zoltowska, I.; Lin, J. Optimal Charging Schedule Planning for Electric Buses Using Aggregated Day-Ahead Auction Bids. Energies 2021, 14, 4727. [Google Scholar] [CrossRef]
  177. You, P.; Yang, Z.; Zhang, Y.; Low, S.H.; Sun, Y. Optimal charging schedule for a battery switching station serving electric buses. IEEE Trans. Power Syst. 2015, 31, 3473–3483. [Google Scholar] [CrossRef]
  178. Yang, C.; Lou, W.; Yao, J.; Xie, S. On charging scheduling optimization for a wirelessly charged electric bus system. IEEE Trans. Intell. Transp. Syst. 2017, 19, 1814–1826. [Google Scholar] [CrossRef]
  179. De Hoog, J.; Alpcan, T.; Brazil, M.; Thomas, D.A.; Mareels, I. Optimal charging of electric vehicles taking distribution network constraints into account. IEEE Trans. Power Syst. 2015, 30, 365–375. [Google Scholar] [CrossRef] [Green Version]
  180. Zhang, B.; Lam, A.Y.; Domínguez-García, A.D.; Tse, D. An Optimal and Distributed Method for Voltage Regulation in Power Distribution Systems. IEEE Trans. Power Syst. 2015, 30, 1714–1726. [Google Scholar] [CrossRef] [Green Version]
  181. Gray, M.K.; Morsi, W.G. Power quality assessment in distribution systems embedded with plug-in hybrid and battery electric vehicles. IEEE Trans. Power Syst. 2015, 30, 663–671. [Google Scholar] [CrossRef]
  182. Sortomme, E.; Hindi, M.M.; MacPherson, S.D.; Venkata, S.S. Coordinated charging of plug-in hybrid electric vehicles to minimize distribution system losses. IEEE Trans. Smart Grid 2011, 2, 198–205. [Google Scholar] [CrossRef]
  183. Bohn, S.; Dubey, A.; Santoso, S. A Comparative Analysis of PEV Charging Impacts-An International Perspective; SAE Technical Papers; SAE: Detroit, MI, USA, 2015. [Google Scholar] [CrossRef]
  184. No, C. Minimum Energy Performance Standards (MEPS); Techical Report; Transformer: Canberra, ACT, Australia, 2014; pp. 3–5. [Google Scholar]
  185. El-Bayeh, C.Z.; Mougharbel, I.; Asber, D.; Saad, M.; Chandra, A.; Lefebvre, S. Novel approach for optimizing the transformer’s critical power limit. IEEE Access 2018, 6, 55870–55882. [Google Scholar] [CrossRef]
  186. Clairand, J.M.; González-Roríguez, M.; Terán, P.G.; Cedenño, I.; Escrivá-Escrivá, G. The impact of charging electric buses on the power grid. In Proceedings of the 2020 IEEE Power & Energy Society General Meeting (PESGM), Montreal, QC, Canada, 2–6 August 2020; pp. 1–5. [Google Scholar]
  187. Balducci, P.J.; Nguyen, T.B.; Fathelrahman, E.M.; Balducci, P.J.; Schienbein, L.A.; Brown, D.R.; Fathelrahman, E.M. An Examination of the Costs and Critical Characteristics of Electric Utility Distribution System Capacity Enhancement Projects. In Proceedings of the IEEE PES Power Systems Conference and Exposition, New York, NY, USA, 10–13 October 2004. [Google Scholar]
  188. IEEE Guide for Loading Mineral-Oil-Immersed Transformers. Available online: https://ieeexplore.ieee.org/stamp/stamp.jsp?tp=&arnumber=6166928&tag=1 (accessed on 4 January 2022).
  189. Georgilakis, P.S.; Amoiralis, E.I. Distribution transformer cost evaluation methodology incorporating environmental cost. IET Gener. Transm. Distrib. 2010, 4, 861–872. [Google Scholar] [CrossRef] [Green Version]
  190. Ahmadian, A.; Sedghi, M.; Aliakbar-Golkar, M.; Fowler, M.; Elkamel, A. Two-layer optimization methodology for wind distributed generation planning considering plug-in electric vehicles uncertainty: A flexible active-reactive power approach. Energy Convers. Manag. 2016, 124, 231–246. [Google Scholar] [CrossRef]
  191. Azzouz, M.A.; Shaaban, M.F.; El-Saadany, E.F. Real-time optimal voltage regulation for distribution networks incorporating high penetration of PEVs. IEEE Trans. Power Syst. 2015, 30, 3234–3245. [Google Scholar] [CrossRef]
  192. Hussain, S.; El-Bayeh, C.Z.; Lai, C.; Eicker, U. Multi-Level Energy Management Systems Toward a Smarter Grid: A Review. IEEE Access 2021, 9, 71994–72016. [Google Scholar] [CrossRef]
  193. Abdelsamad, S.F.; Morsi, W.G.; Sidhu, T.S. Optimal secondary distribution system design considering plug-in electric vehicles. Electr. Power Syst. Res. 2016, 130, 266–276. [Google Scholar] [CrossRef]
  194. Zafar, U.; Bayhan, S.; Sanfilippo, A. Home Energy Management System Concepts, Configurations, and Technologies for the Smart Grid. IEEE Access 2020, 8, 119271–119286. [Google Scholar] [CrossRef]
  195. Saldaña, G.; Ignacio, J.; Martin, S.; Zamora, I.; Asensio, F.J.; Oñederra, O. Electric Vehicle into the Grid: Charging Methodologies Aimed at Providing Ancillary Services Considering Battery Degradation. Energies 2019, 12, 2443. [Google Scholar] [CrossRef]
  196. Yang, J.; He, L.; Fu, S. An improved PSO-based charging strategy of electric vehicles in electrical distribution grid. Appl. Energy 2014, 128, 82–92. [Google Scholar] [CrossRef]
  197. Guille, C.; Gross, G. A conceptual framework for the vehicle-to-grid (V2G) implementation. Energy Policy 2009, 37, 4379–4390. [Google Scholar] [CrossRef]
  198. Wellik, T.; Griffin, J.; Kockelman, K.; Mohamed, M. Utility-transit nexus: Leveraging intelligently charged electrified transit to support a renewable energy grid. Renew. Sustain. Energy Rev. 2021, 139, 110657. [Google Scholar] [CrossRef]
  199. Qin, N.; Gusrialdi, A.; Paul Brooker, R.; T-Raissi, A. Numerical analysis of electric bus fast charging strategies for demand charge reduction. Transp. Res. Part A Policy Pract. 2016, 94, 386–396. [Google Scholar] [CrossRef]
  200. Chen, Z.; Yin, Y.; Song, Z. A cost-competitiveness analysis of charging infrastructure for electric bus operations. Transp. Res. Part C Emerg. Technol. 2018, 93, 351–366. [Google Scholar] [CrossRef]
  201. Chen, H.; Hu, Z.; Zhang, H.; Luo, H. Coordinated charging and discharging strategies for plug-in electric bus fast charging station with energy storage system. IET Gener. Transm. Distrib. 2018, 12, 2019–2028. [Google Scholar] [CrossRef] [Green Version]
  202. Gao, Y.; Guo, S.; Ren, J.; Zhao, Z.; Ehsan, A.; Zheng, Y. An Electric Bus Power Consumption Model and Optimization of Charging Scheduling Concerning Multi-External Factors. Energies 2018, 11, 2060. [Google Scholar] [CrossRef] [Green Version]
  203. Wu, Z.; Guo, F.; Polak, J.; Strbac, G. Evaluating grid-interactive electric bus operation and demand response with load management tariff. Appl. Energy 2019, 255, 113798. [Google Scholar] [CrossRef]
  204. Chen, Y.; Zhang, Y.; Sun, R. Data-driven estimation of energy consumption for electric bus under real-world driving conditions. Transp. Res. Part D Transp. Environ. 2021, 98, 102969. [Google Scholar] [CrossRef]
Figure 1. Total C O 2 emissions of different sectors and the portion of road transport [1].
Energies 15 07919 g001
Figure 2. Growth percentage of battery electric buses in EU [7].
Energies 15 07919 g002
Figure 3. Problems that significantly impact the operation planning of EBs.
Energies 15 07919 g003
Figure 4. Different types of EBs.
Energies 15 07919 g004
Figure 5. Representation of electric bus charging infrastructure’s connection with a power system.
Energies 15 07919 g005
Figure 6. Impact on the transformer and grid.
Energies 15 07919 g006
Figure 7. Ancillary services provided by EBs.
Energies 15 07919 g007
Figure 8. Integration of EB optimization problems and possibilities of future studies.
Energies 15 07919 g008
Table 1. Comparing different review papers with the current study.
Review PaperComparing Charging TechnologiesVSTT-VSCharging Infrastructure LocationCharging SchedulingImpact on the GridRemark
[5] Analyzing the vehicle cost, energy cost, and emissions of buses powered by different sources.
[14] Reviewing environmental, economic, and energy efficiency of electric buses.
[15] Categorizing planning, case studies, and simulation of electric buses.
[4] Reviewing power management, travel range limitation, energy storage system sizing.
[16] An overview of strategic, tactical and operational problems.
[17] Future research on EBs will be strategies for energy and fleet management and sustainability.
[18] Integration of EB charging scheduling and vehicle scheduling for improving economic attractiveness.
This workPublic transit operation planning integration and impact of charging stations on the grid.
Table 2. Recommended features of buses and charging stations as a function of charging technologies.
Depot ChargingFast ChargingWireless/Continuous ChargingBattery Swapping
BusTypeHybrid/fully electricFully electricFully electricHybrid/fully electric
Battery capacity (kWh)>200 [20]40–120 [20]18.1 [21]—(123–201) [22]324 [6], 320–590 [23]
Range (km)175–350 [19], 322 [14]40–110 (unlimited theoretically) [5], 32–48 [14](unlimited theoretically)72–150 [5]
WeightMoreLessLessDepending on the battery size
Cost (bus + battery) ($1000)Hybrid: 650 [22], 624 [19], BEB: 806 [19], 729 [22]806 [19] 591 [22]>650 [24]
ChargerPower (kW)40–50 [14] 65–150 [19], 30–50 [17]Up to 600, 200–500 [25] 350–450 [14] 350–600 [19], 100–600 [17]60 [26], typically 100 [27]9 [5]–60 [22]
Time4–6 h typically, 2–4 h [14]5–10 min [14]3–4 h, no time for en-route charging15 min [6]
TransformerNo need to upgradeNeed to upgrade--
Grid stabilityHighLow-High
LocationBus depotCertain bus stopsCertain bus stops/bus depotSpecific spots
Table 3. Comparison of functional and operational differences between conventional buses and electric buses.
Manufacturing CostOperational CostInfrastructure Cost CO 2 Energy EfficiencyRangeNoise and Vibration
Conventional BusesLessMoreLess822 gr/km [2]Less (20.66 MJ/km) [14]400 km [29]More
Electric BusesMoreLess (80% reduction)More0More 1 [30]40–110 km [5]Less
1 BEB has the highest energy efficiency, with 6.76 MJ/km of fuel consumption, followed by FCEB (10.48 MJ/km) and series HEB (10.81 MJ/km).
Table 6. Different studies related to the objectives of bus scheduling and timetabling.
PaperElectric BusVSTTObjective
Operation CostPassenger
Purchase Cost/Number of VehiclesDeadhead TripsFuel/Electricity CostTOUWaiting TimeTransferring Time
Ibarra-Rojas et al. (2014) [137]
Schmid & Ehmke (2015) [136]
Wen et al. (2016) [102]
Fonseca et al. (2018) [132]
Cao & Ceder (2019) [146]
Li et al. (2019) [74]
Zhang et al. (2020) [91]
Yao et al. (2020) [116]
Teng et al. (2020) [90]
Zhou et al. (2020) [117]
Liu & Ceder (2020) [87]
Li et al. (2020) [114]
Bie et al. (2021) [11]
Sung et al. (2022) [111]
Gkiotsalitis [123]
Wang et al. (2022) [88]
Jiang & Zhang (2022) [122]
Zhang et al. (2022) [125]
Guo et al. (2022) [115]
Wu et al. (2022) [126]
Table 7. The characteristics of electric bus scheduling, timetabling, and solution approaches.
PaperSingle/Multi DepotSingle/Multi LineVehicle TypeModelMethod/AlgorithmCase Study
Ibarra-Rojas et al. (2014) [137]SingleMultiHomogeneousMILP ϵ -constraintMonterrey, Mexico
Schmid & Ehmke (2015) [136]SingleMultiHomogeneousMIPLNSGöttingen, Germany
Wen et al. (2016) [102]MultiMultiHomogeneousMIPAdaptive LNS-
Fonseca et al. (2018) [132]MultiMultiHomogeneousMILPMatheuristicCopenhagen, Denmark
Cao & Ceder (2019) [146]SingleSingleHomogeneousMILPGAAuckland, New Zealand
Li et al. (2019) [74]MultiMultiHeterogeneousILPTime-space-energy network and time-spaceHong Kong
Zhang et al. (2020) [91]SingleSingleHeterogeneousMIPGABeijing, China
Yao et al. (2020) [116]MultiMultiHeterogeneousMILPGABeijing, China
Teng et al. (2020) [90]SingleSingleHomogeneousMIPMultiobjective PSOShanghai, China
Zhou et al. (2020) [117]SingleMultiHeterogeneousBi-level programmingIterative neighborhood searchBeijing, China
Liu & Ceder (2020) [87]MultiMultiHomogeneousDF and IPAdjusted max-flowSingapore
Li et al. (2020) [114]SingleMultiHomogeneousNonconvex mathematical modelAGAAnting Town, Shanghai
Bie et al. (2021) [11]SingleSingleHomogeneousILPBranch-and-price-
Sung et al. (2022) [111]MultiMultiHeterogeneousSimulationHueristicKaohsiung, Taiwan
Gkiotsalitis [123]MultiMultiHomogeneousMILPBranch-and-cut-
Wang et al. (2022) [88]SingleMultiHomogeneousMILPMILPOslo, Norway
Jiang & Zhang (2022) [82]MultiMultiHomogeneousMILPBranch-and-price-
Zhang et al. (2022) [125]MultiMultiHeterogeneousMILPALNSNanjing, China
Guo et al. (2022) [115]SingleSingleHomogeneousUBPMGANanchang, China
Wu et al. (2022) [126]MultiMultiHomogeneousMILPBranch-and-priceGuangzhou, China
Table 8. Comparison of the different studies in terms of accuracy and solution approach.
PaperMethodGapAdvantagesDisadvantages
Ibarra-Rojas et al. (2014) [137] ϵ -constraint0 (for up to 50 bus lines)Allows to analyze the trade-off between level of service and number of buses.Limit to solve small and medium size problems
Schmid & Ehmke (2015) [136]LNS21.68%able to outperform a commercial solver in terms of run time and solution qualitySolutions are far from optimum for large-scale problems
Wen et al. (2016) [102]Adaptive LNS4.4%Provide good solutions for large instances and near optimum solutions for small instancesLarge fluctuation for different instances
Fonseca et al. (2018) [132]Matheuristic9.72%Able to find better feasible solutions faster than a commercial solverRequires many analysis to choose the right parameters
Cao & Ceder (2019) [146]GA0Easy to implementOnly applies on one bus line and one vehicle type
Li et al. (2019) [74]Time-space-energy network and time-space3.19%Simple implementationApproximate solutions
Zhang et al. (2020) [91]GA5.8%It can provide some quick and relatively inexpensive solutionsIt reaches out of memory error after 15 min
Yao et al. (2020) [116]GA- 1Easy to understand and implementUnable to find optimal solutions consistently
Teng et al. (2020) [90]Multiobjective PSO-Robustness to control parametersConverge to local solutions
Zhou et al. (2020) [117]Iterative neighborhood search-Easy to code and useMany parameters have to be tuned
Liu & Ceder (2020) [87]Adjusted max-flow0Could be applied to large-scale problemsHigh complexity
Li et al. (2020) [114]AGA-Easy to understandSolutions may be far from optimum
Bie et al. (2021) [11]Branch-and-price0Obtain the exact solution setHigh complexity to develop
Sung et al. (2022) [111]Hueristic-Could be used for initial solution for other problemsObtain local solutions
Gkiotsalitis [123]Branch-and-cut0Reliable and obtain the exact solution setLimited to 30 number of trips
Wang et al. (2022) [88]MILP4%Can obtain the solution with high qualityUnable to find the optimum solution
Jiang & Zhang (2022) [82]Branch-and-price0.32%Able to generate high-quality solutionsLimited to instances with 400 trips
Zhang et al. (2022) [125]ALNS0.08%Able to find high quality solutionsRequires many analysis to choose the right method
Guo et al. (2022) [115]GA-Easy to understandComputationally expensive
Wu et al. (2022) [126]Branch-and-price9.59%More reliable and efficientLimitation on the scalibility of the method
1 Not mentioned.
Publisher’s Note: MDPI stays neutral with regard to jurisdictional claims in published maps and institutional affiliations.

