Article

Parametric Evaluation of Cooling Pipe in Direct Evaporation Artificial Ice Rink

1
College of Civil and Architectural Engineering, North China University of Science and Technology, Tangshan 063210, China
2
Tangshan Key Laboratory of Low-Carbon Built Environment, Tangshan 063210, China
3
Science and Technology Division, North China University of Science and Technology, Tangshan 063210, China
*
Author to whom correspondence should be addressed.
Energies 2022, 15(21), 7989; https://doi.org/10.3390/en15217989
Submission received: 15 September 2022 / Revised: 20 October 2022 / Accepted: 24 October 2022 / Published: 27 October 2022

Abstract

:
With the coming of the 2022 Beijing Winter Olympic Games, China’s artificial ice rink construction will be in rapid development. A parametric evaluation of the cooling pipe in a direct evaporation rink was performed by numerical simulation. The results showed that the influence of the temperature of the antifreeze pipe on the ice surface temperature can be ignored. The evaporation temperature of the working medium in the cooling pipe is between −32 °C and −22.4 °C to ensure the ice surface temperature is between −5 °C and −3 °C. With the increase in the cooling pipe spacing, the required evaporation temperature of the working medium in the cooling pipe and the uniformity of the ice surface temperature decreased. The required evaporation temperature of the working medium in the cooling pipe decreases by 1.2–1.5 °C for every 10 mm increment of spacing. With the increase in the cooling pipe diameter, the required evaporation temperature of the working medium in the cooling pipe and the uniformity of the ice surface temperature increase. The required evaporation temperature of the working medium in the cooling pipe increases by 2.2–2.9 °C for every 5 mm increment of diameter. The maximum temperature difference of ice surface temperature ranged from 0.004 °C to 0.111 °C.

1. Introduction

The successful holding of the 2022 Beijing Winter Olympics has provided a new opportunity for the development of China’s ice sports industry. However, the development of mass ice sports in China is relatively late, and the industry is still in the early stage of development. In order to achieve the ice sports of 300 million people, the mutual assistance of policy, economy, and technology will inevitably promote the rapid development of ice sports. However, in the global environment of promoting energy conservation and environmental protection, ice rinks, as high energy consumption equipment, have increasingly prominent energy consumption problems. According to international energy data, in Sweden, the total energy consumption of ice rinks is about 300 GWh each year, and the average annual energy consumption of ice rinks is 1000–2000 MWh, and the refrigeration load of the ice rink in summer is 4689–5611 kWh [1]. In Quebec, Canada, the average annual energy consumption of a single ice rink is 1500–2400 MWh [2]. In the total energy consumption of the ice rink, the refrigeration system accounts for 35–75% [3]. Therefore, it is very important to save energy on the ice rink.
The traditional artificial ice rink refrigeration system uses ammonia or halogenated hydrocarbon refrigerants and uses ethylene glycol or brine as the coolant to cool the concrete floor. However, ethylene glycol and brine solutions will have a significant transmission power, which increases the transmission energy consumption [4]. In addition, the Kigali amendment to the Montreal Protocol will phase out and restrict the high GWP halogenated hydrocarbon refrigerants. In order to make the Beijing Winter Olympics a green, environmentally friendly, and energy-saving sports event, the CO2 direct evaporation ice rink technology was adopted in the 2022 Beijing Winter Olympics Games [5,6], and the size of the compressor, heat exchanger, and pipeline of the CO2 system is significantly reduced [7]. Due to its phase change characteristics, compared with the traditional indirect system, the pumping power can be reduced by 80% [8]. In the world, the use of CO2 direct evaporation ice rinks began in 1999 [9]. Momeni et al. [10] found that the coefficient of performance (COP) of the full CO2 refrigeration system with the heat recovery was 33% higher than that of the CO2/brine system and 66% higher than that of the NH3/brine system for the ice rink. Zhang et al. [11] found that the COP of the CO2 direct evaporation ice rink refrigeration system is higher than that of the NH3 refrigeration system under low outdoor ambient temperatures. The speed skating hall project of the reconstruction project for the 2022 Winter Olympics was officially opened in September 2019. The CO2 direct evaporation refrigeration system was used for the ice rink, with a total ice surface area of 9800 m2 and an ice surface temperature difference of less than 0.5 °C, which is 40% more energy-saving than the glycol solution ice rink [12]. The competition hall and training hall of the China Capital Gymnasium for the 2022 Winter Olympic Games adopts the direct second-generation ice rink CO2 refrigeration system [13]. At present, the number of direct evaporation artificial ice rinks is growing rapidly [13,14,15].
For the heat transfer process in the ice rink, as early as 2005, Bellache et al. [16,17] adopted the standard k-ε model, and Gebhart correction method analyzed the radiation and mass transfer loads under steady-state conditions. In 2006, Mun et al. [18] established an ice rink test device and found that there was a temperature difference of 3 °C between the bottom and the center of the ice rink. Adding an insulation layer can effectively reduce the cooling load and ice surface temperature. The arrangement of cooling pipes has a great impact on the refrigeration effect of the ice rink. In 2021, Zhou et al. [19] established the discrete thermal resistance network model of the ice rink and found that with the increase in the pipe spacing, the heat flux of the cooling pipe decreases, resulting in the decrease in the total refrigeration capacity of the refrigeration system and the uniformity of the ice surface temperature. Wang [20] compared the different pipe diameters and pipe spacing of the artificial ice rink with CO2 as the refrigerant established the heat transfer model of the artificial ice rink and studied the optimal layout of the cooling pipes. Shahzad [4] compared 12.7 mm copper pipe, 12.7 mm plastic copper clad pipe, 9.5 mm copper pipe, 9.5 mm plastic copper clad pipe, 21.3 mm steel pipe, and 25 mm plastic pipe in the heat transfer of the ice rink when the distance between the cooling pipes was 100 mm and the heat flux was 100 W/m2. It was found that a 12.7 mm plastic copper-clad pipe had the best heat transfer effect, and the surface temperature was 0.18 °C lower than that of a 9.5 mm plastic copper-clad pipe. Li [21] studied the process of frost formation on ice and the relationship between frost time and moisture content at different stages in the ice rink. It was found that when there was no frost on the ice surface, the upper limit of moisture content nearby could be increased by 1.0 g/kg, expanding the control range, and reducing energy consumption. It gave a reference for temperature and humidity control in the heat transfer process of the ice rink.
To sum up, the parameters of the ice rink cooling pipe have a great impact on the ice surface temperature and ice quality, and it is necessary to optimize the piping layout of the ice rink through heat transfer analysis. The direct evaporation of artificial ice rinks has a positive effect on ice uniformity. However, there are few related studies concerning the parameters of the ice rink cooling pipe. In this paper, the heat transfer characteristics of direct evaporation artificial ice rinks are investigated through numerical simulation. The influence of ice surface temperature on the cooling load and the required evaporation temperature of the working medium in the cooling pipe in the ice rink is investigated. The influence of the cooling pipe spacing and diameter on the heat flux of the cooling pipe, the required evaporation temperature of the working medium in the cooling pipe, and the uniformity of the ice surface temperature are also analyzed.

2. Models and Methods

Ice rinks are divided into sports ice rinks, training ice rinks, and entertainment ice rinks according to their uses. The size and area of the artificial ice rink for competition are determined by the sports competition standards. In this paper, an entertainment ice rink is selected for research, with a length of 61 m, a width of 30 m, and a corner arc radius of 8.5 m [22]. The sport selected is figure skating, and the corresponding ice surface temperature is required to be −3 °C~−5 °C [22].

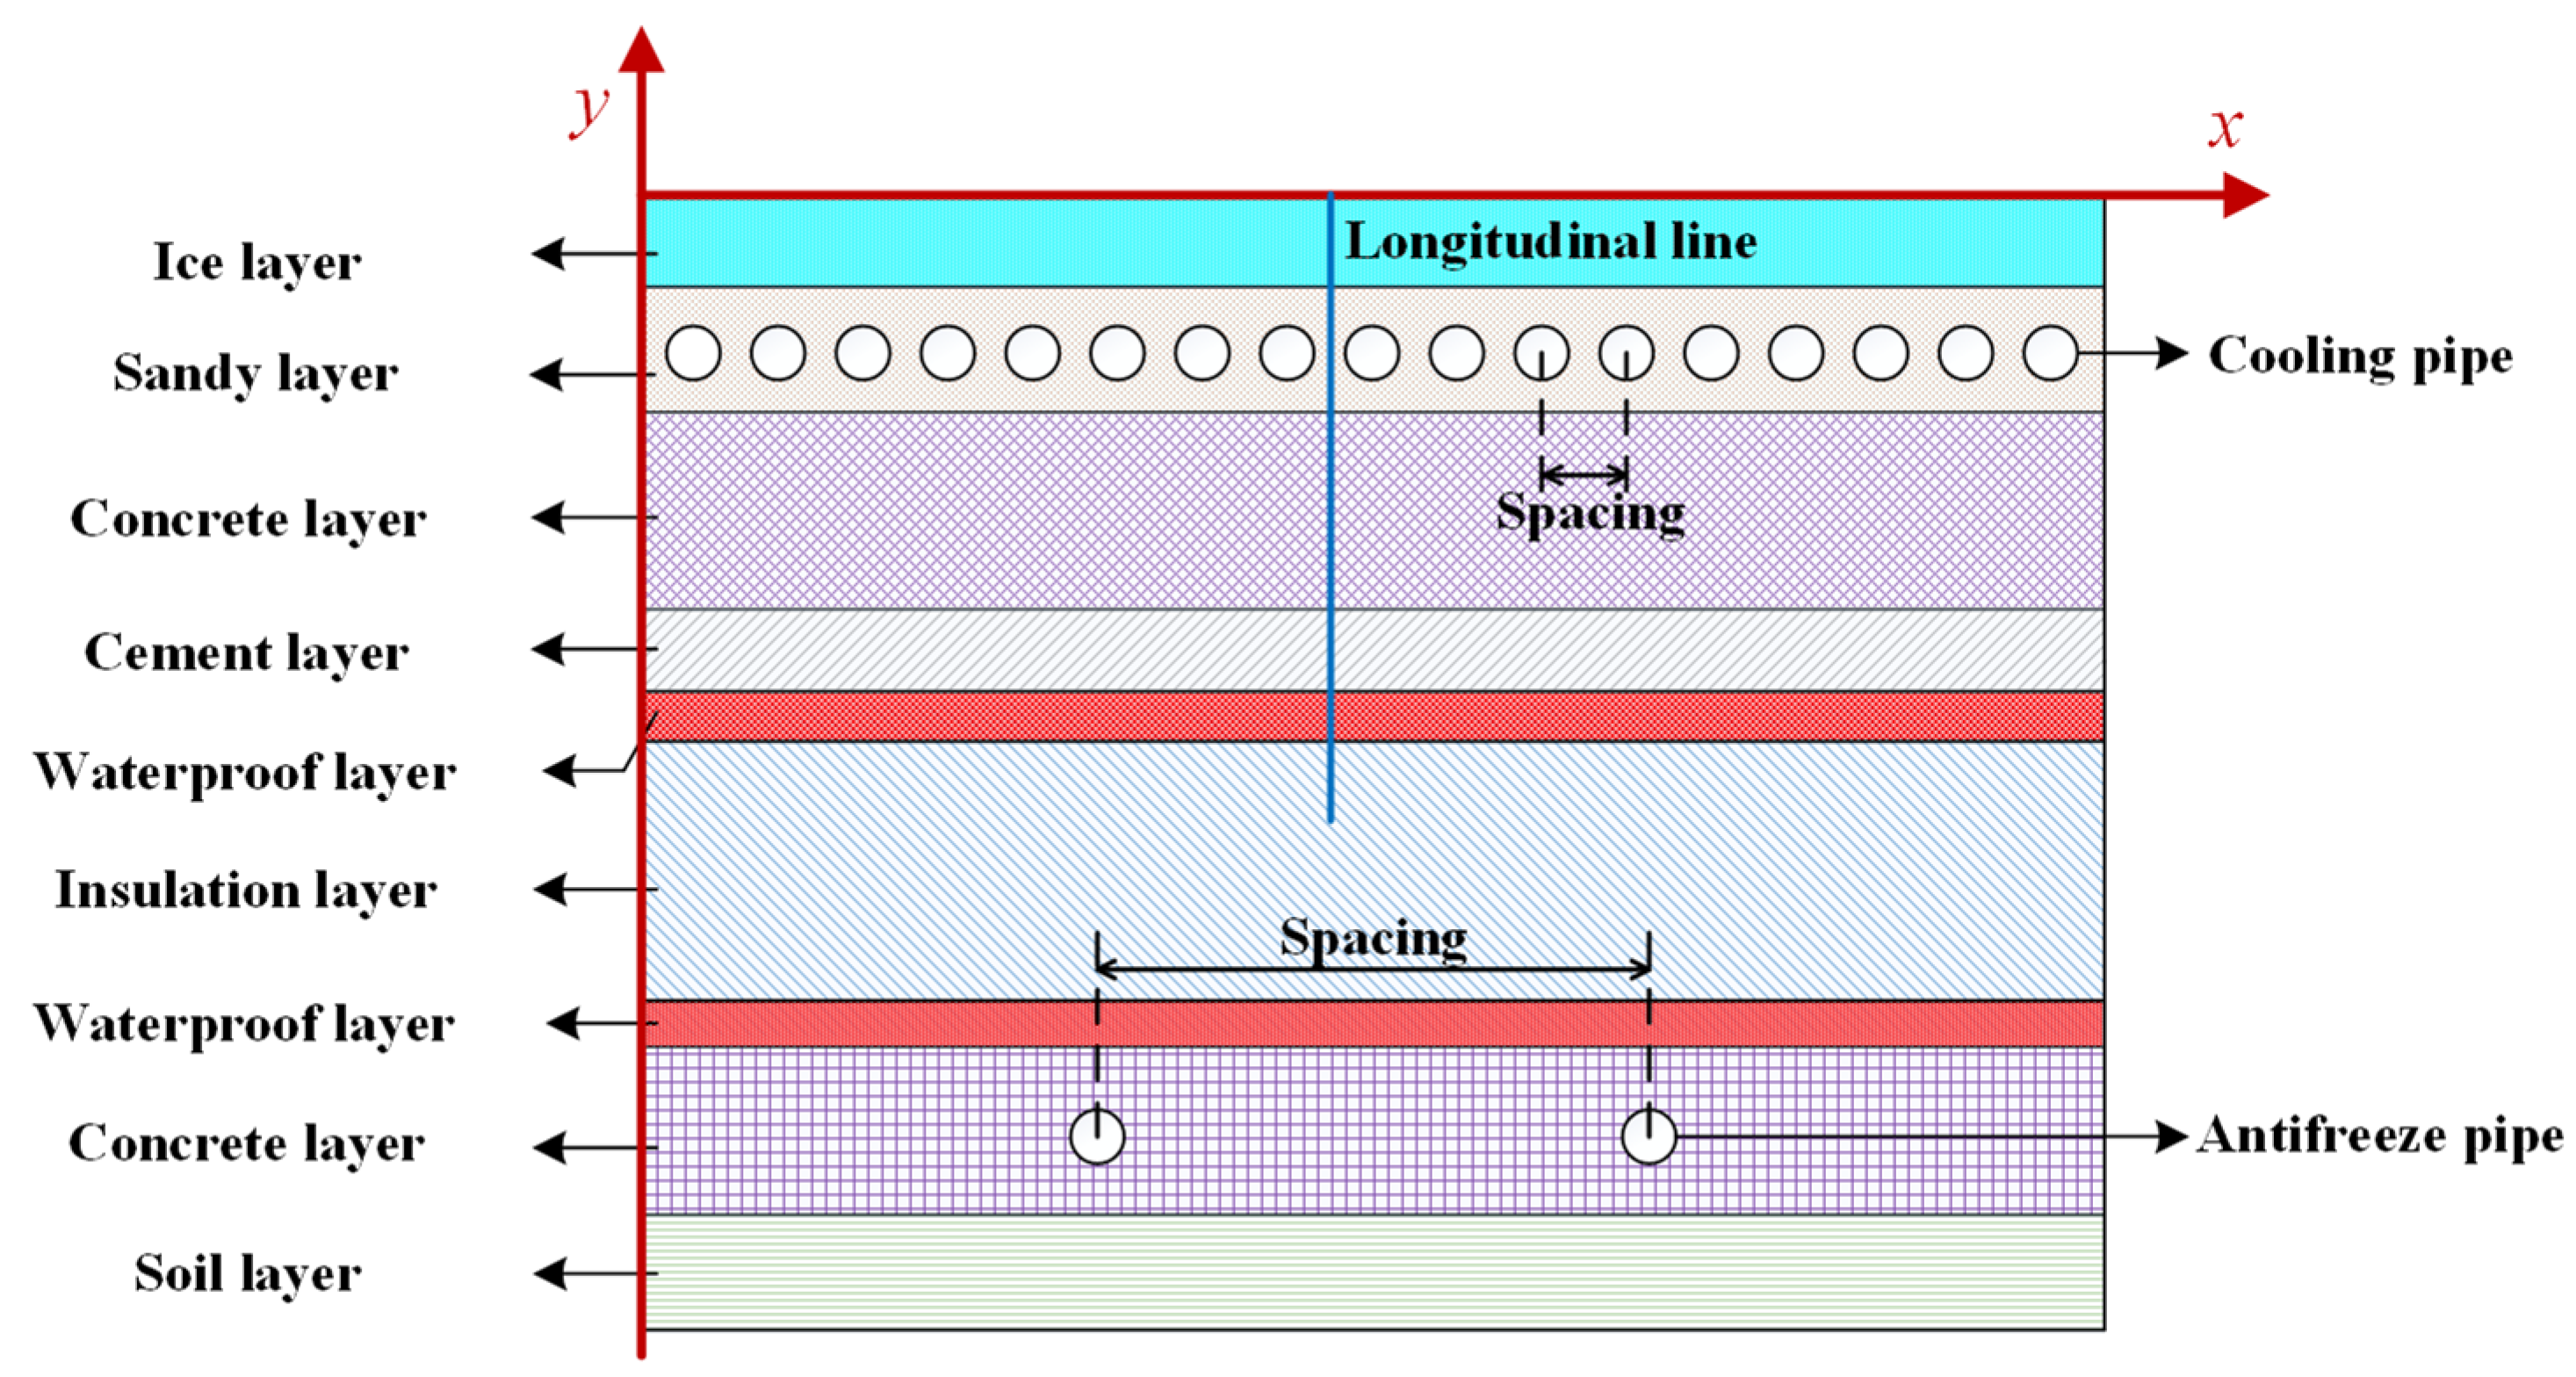
2.1. Ice Rink Geometry

The artificial ice rink system is a three-dimensional system, which should be considered a three-dimensional heat transfer problem. However, considering that the temperature of the working medium in the cooling pipe is almost constant owing to the direct evaporation process and the pressure drop in the cooling pipes is very small [4], the temperature variations along the axis of the cooling pipe can be ignored. Thus, the whole ice rink is simplified as a two-dimensional (2-D) heat transfer model, shown in Figure 1. The model is composed of several layers. The thicknesses of each layer and the geometric structure parameters and material properties have been obtained according to the literature [20,22,23], as shown in Table 1.

2.2. Mathematical Model

The ice rink is in a steady state most of the time except for the initial freezing time. This paper studies the parametric optimization of cooling pipes in the ice rink during steady-state operation. The two-dimensional heat transfer differential equation of the ice rink is shown as:
2 t x 2 + 2 t y 2 = 0
where t is the temperature of each point, °C; x and y are coordinate points, m.
The boundary condition of the ice surface is the second kind of boundary condition, that is, the heat flux of the ice surface is set as a constant heat flux. The sub-item calculation method is adopted to calculate the heat flux of the ice surface. Figure 2 shows the heat transfer and thermal resistance network between the ice surface and the cooling pipe. The heat flux of the ice surface includes the convective heat transfer rate between the indoor air and the ice surface, the latent heat flux owing to the vapor condensation in the air, the radiation heat transfer rate between the inner surface of enclosure and ice surface, the radiation heat transfer rate between lighting equipment and ice surface, the heat released from the skaters on the ice and ground conduction heat rate.
The convective heat transfer flux between the air and the ice surface is calculated as:
q c = h c t a t i
h c = 2.583 v a 0.871
where q c is the convective heat transfer flux, W/m2; h c is the surface convective heat transfer coefficient, W/(m∙°C); t a and t i are air temperature and ice surface temperature, respectively, °C; v a is air velocity, m/s.
The latent heat flux owing to the vapor condensation in the air on the ice surface is calculated as:
q m = h m d a d s ρ a r w i
h c h m c p = L e 2 3
where q m is convective mass transfer heat flux, W/m2; h m is surface convective mass transfer coefficient, m/s; d a and d s are the humidity ratio of air and the saturated humidity ratio of air, respectively, g/kg; ρ a is the air density, kg/m3; r w i is the latent heat of solidification from water to ice, kJ/kg; c p is the specific heat at constant pressure, kJ/(kg∙°C); L e is Lewis number.
The radiant heat transfer flux between the inner surface of the enclosure and the ice surface is calculated as:
q r = ε i ε e σ ( t a + 273 ) 100 4 ( t i + 273 ) 100 4
where q r is the radiant heat transfer flux between enclosure and ice surface, W/m2; ε i and ε e are ice blackness and enclosure blackness; σ is black body radiation coefficient, W/(m2∙°C4).
The radiation heat transfer flux between lighting equipment and ice surface is calculated as:
q lg = P lg × 0.33 × 0.33
P lg = E ϕ U K
where q lg is radiation heat transfer flux between lighting equipment and ice surface, W/m2; P lg is light source power, W/m2; E is ice illuminance, lx; U is utilization coefficient; K is maintenance factor; ϕ is luminous flux of light source, W/m2.
The heat released from the skaters is selected through practical heating and air conditioning manual:
q p = 60 W / m 2
where q p is the heat released from the skaters, W/m2.
The temperature of the working medium in the cooling pipe is set as a constant. When copper is used as material for tubes, the temperature difference between the working medium and cooling pipe outer surface could be as low as 0.001 °C [4], thus the cooling pipe temperature is assumed to be equal to the evaporation temperature of the working medium. The temperature of the antifreeze pipe is determined according to the literature [24,25]. The ground temperature is determined according to the method in the literature [20,26]. The left and right boundaries of the model are adiabatic. These assumptions are consistent with the open references [24,25]. All of the quantities for the boundary conditions in the paper are listed in Table 2.
The numerical procedure is as follows: firstly, based on the geometric structure parameters in Table 1, the 2D physical model of the ice rink was established. The model was drawn using the commercial software Ansys ICEM 15.0. Then, the thermophysical parameters of each structural layer of the ice rink were set, and the hexahedral grid was created. After that, the generated mesh was loaded into the solver, and then the model was built using the input values of the boundary conditions to perform the calculations. The calculation was performed using the commercial software Ansys Fluent. The convergence accuracy of the model calculation was set to 10−4. Then, the grid independence verification and the model validation were performed. Finally, the parametric evaluation of cooling pipe in the ice rink was performed.

2.3. Grid Independence Verification

The ice rink grid is divided considering the calculation speed and the accuracy of the result. The grid density is increased near the cooling pipe. The resulting ice rink grid is shown in Figure 3.
In order to verify the validity of the grid of the ice rink, the simulation results under three different grid numbers of 200,000, 270,000, and 320,000 are compared. The simulation is performed under the same parameter settings, that is, the ice surface heat flux is 287.02 W/m2, the temperature of the working medium in antifreeze pipe is 15 °C, evaporation temperature of working medium in the cooling pipe is −29 °C, the temperature of the ground is 14.5 °C. Figure 4 shows the variations of the ice surface temperature with x positions for the three grid numbers. It can be seen that the distance between adjacent wave peaks (valleys) of the ice surface temperature is identical to the cooling pipe spacing. The wave valley of the ice surface temperature is exactly at the same x position as the cooling pipe where the thermal resistance of the ice layer is the lowest. The wave peak of the ice surface temperature is exactly at the same x position as the halfway between two neighboring cooling tubes where the thermal resistance of the ice layer is the highest. Under the same setting parameters, the simulated ice surface temperature difference at the identical x positions is between 0 °C and 0.02 °C with different grid numbers. All of the above phenomena imply that the selected grid numbers can accurately reflect the temperature distribution of the ice rink.

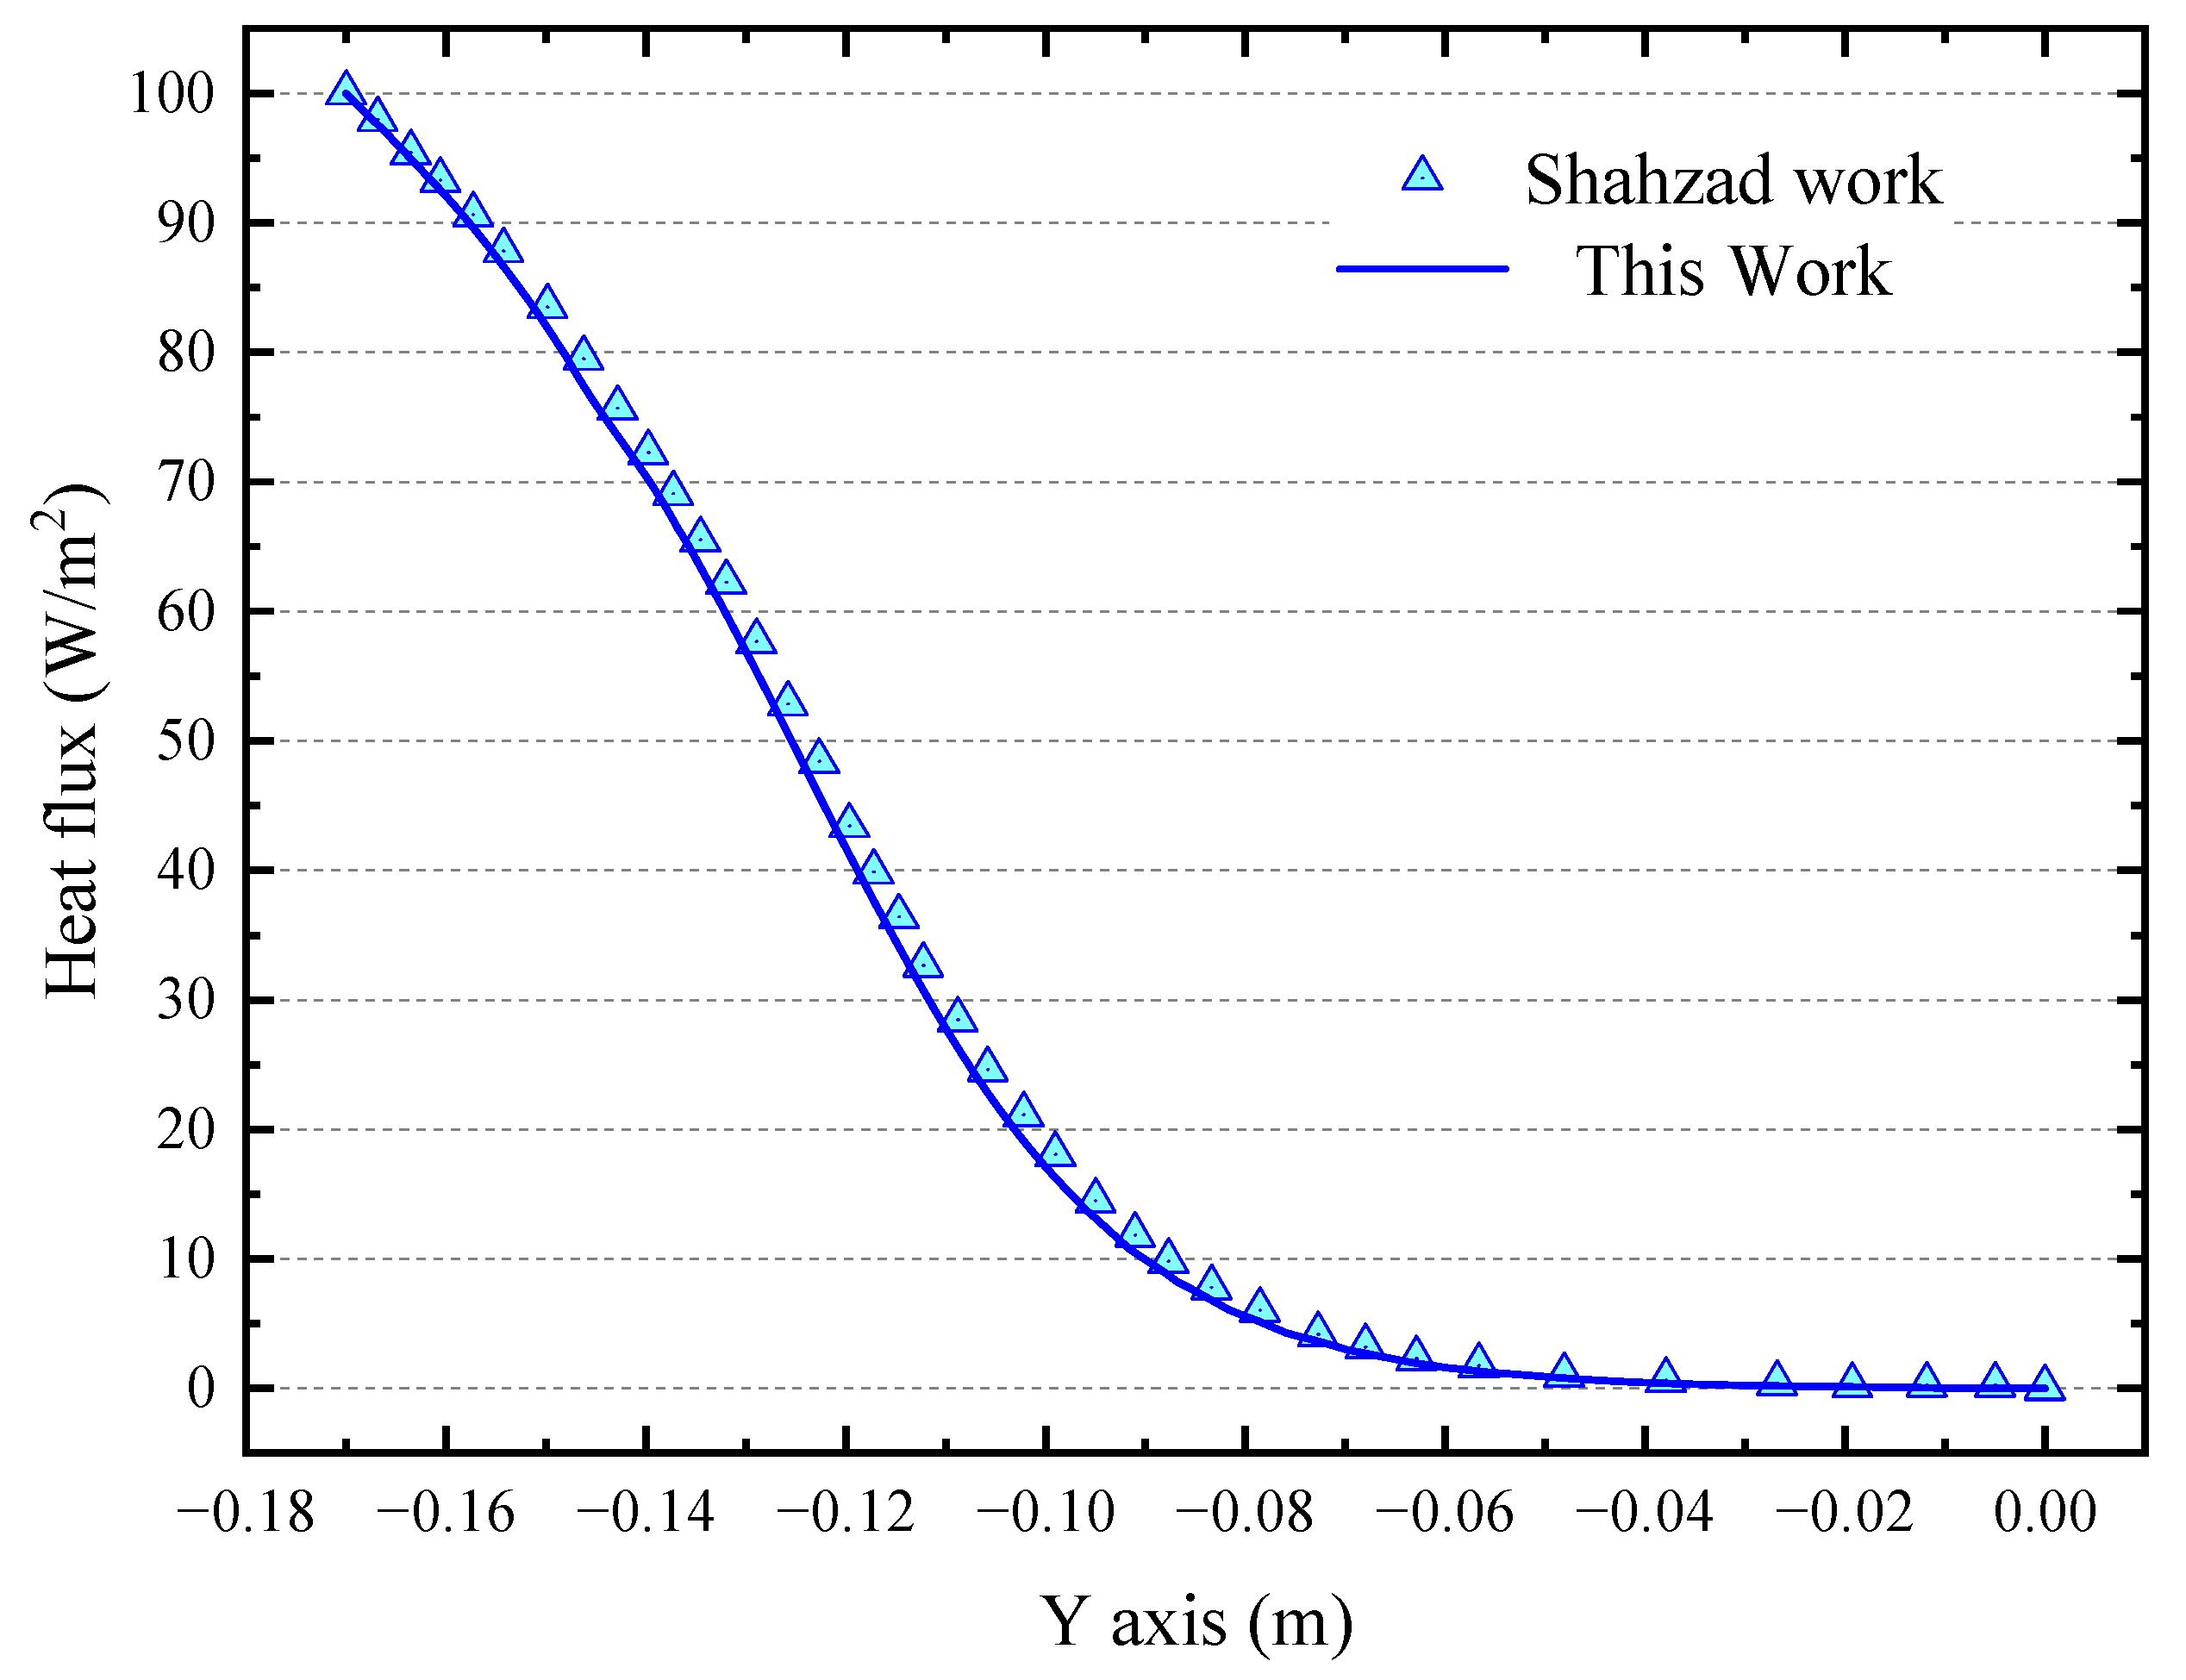
2.4. Model Validation

To ensure the reliability of the calculation process and check the validity of model assumptions, the model is validated with the data of Shahzad [4]. When validating the model, the heat flux of the ice layer and the ice surface temperature distribution are simulated and compared with the corresponding reference data under the identical conditions. The validation results of the heat flux in the vertical direction of the ice rink and the ice surface temperature fluctuation in the horizontal direction of the ice rink are presented in Figure 5 and Figure 6, respectively. It can be seen that both the simulated heat flux variations in the vertical direction of the ice rink and simulated ice surface temperature fluctuation in the horizontal direction of the ice rink all show good agreement with the data of Shahzad [4]. Thus, the heat transfer model of the ice rink in this paper is reliable.

3. Results and Discussion

The conditions for simulation in this paper are: the diameter of the cooling pipe is 25 mm, the cooling pipe spacing is 65 mm, the antifreeze pipe spacing is 600 mm, the temperature of the antifreeze pipe is 15 °C, and the temperature at 10 m underground is 14.5 °C.

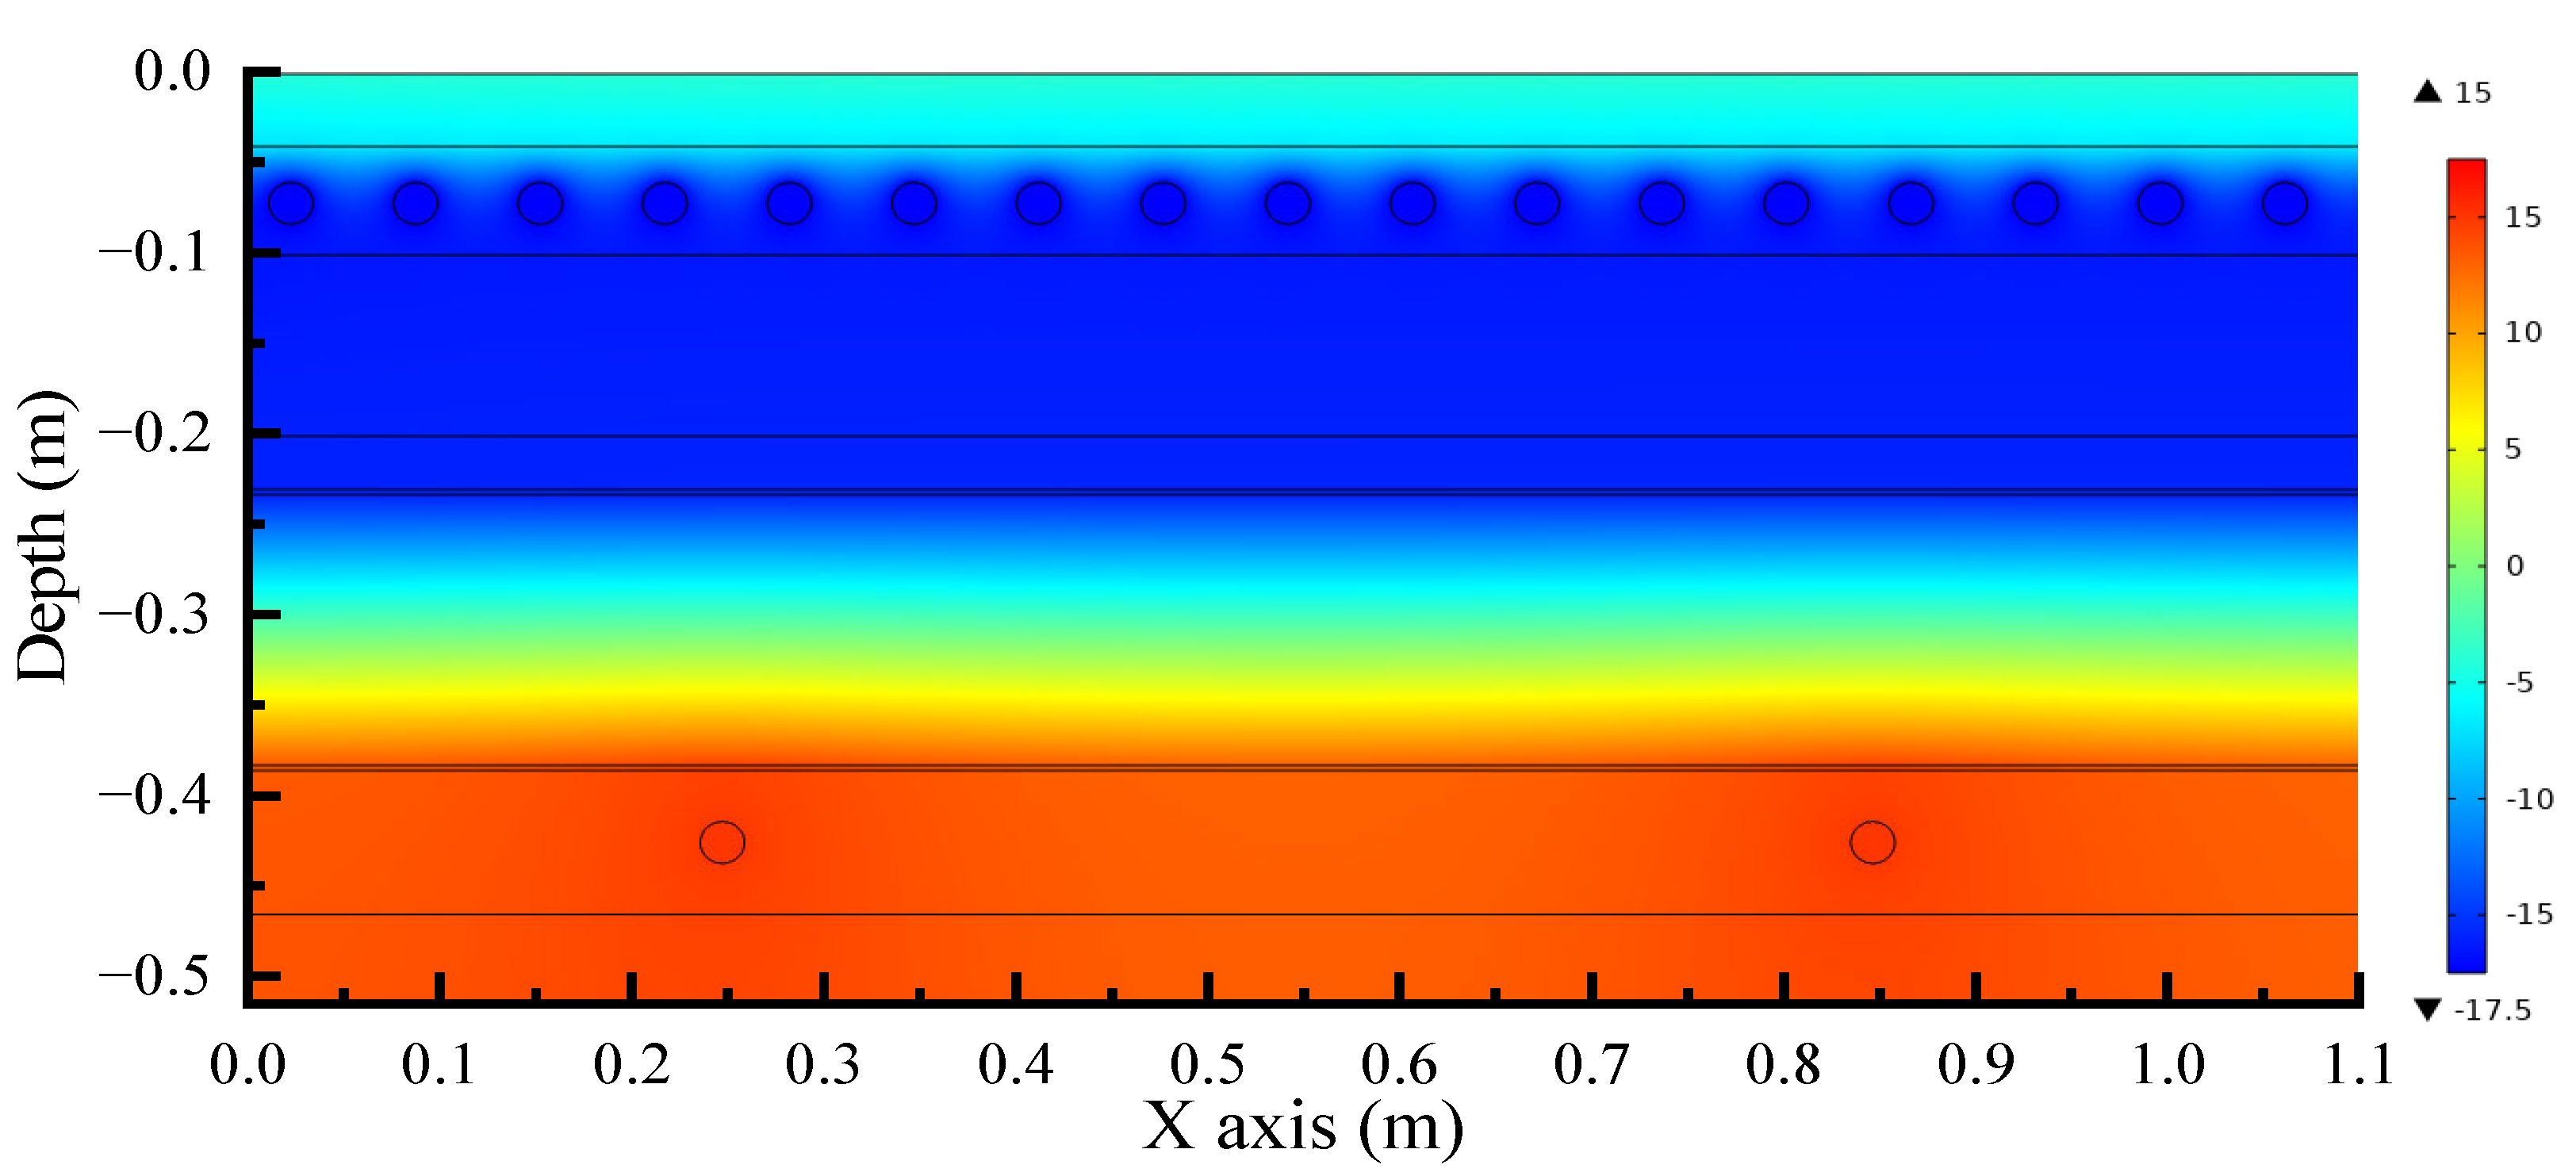
3.1. Temperature Distribution of the Ice Rink

The temperature cloud diagram of the ice rink in summer when the ice surface temperature is −4 °C is shown in Figure 7. It can be seen that the surface temperature of the cooling pipe is the lowest among the ice rink layers. Part of the refrigeration flux of the cooling pipe flows to the ice surface to maintain the temperature on the ice surface, and the other part flows to the antifreeze pipe. The heat generated by the antifreeze pipe also prevents the refrigeration flux from affecting the ice rink structure at the bottom of the ice rink. It can also be seen that the thermal resistance of the materials in the structure of the ice rink is different, resulting in different temperature gradients. It is known that in the simulated local ice rink structure, the heat flux from the ice surface to the cooling pipe is 317.2 W/m2, and the total heat flux on the surface of the cooling pipe is 328.5 W/m2. The larger the heat flux, the larger the temperature change along the direction of heat transfer. The materials above the cooling pipe are sand and ice. The thermal conductivity of ice is 2.22 W/(m∙K), and the thermal conductivity of sand is 0.335 W/(m∙K). The thermal conductivity of sand is far less than that of ice. From the simulation results, the isotherms of the sand layer are denser than that of the ice layer. Through calculation, the temperature gradient of the sand layer is about 6.6 times that of the ice layer. The thermal conductivity of concrete is 1.046 W/(m∙K), and the thermal conductivity of polystyrene is 0.035 W/(m∙K). Therefore, the isotherms of the insulation layer are very dense and the temperature changes dramatically, while the temperature of the concrete layer does not change much. The comprehensive action of the insulation layer and the antifreeze pipe makes the temperature distribution of the concrete layer and the soil layer uniform, effectively preventing the impact of freezing and swelling on the structural layer of the ice rink.

3.2. Effect of Temperature of the Working Medium in Antifreeze Pipe

When studying the influence of the temperature change in the antifreezing pipe on the ice surface temperature and the heat flux density of the cooling pipe, the ice surface heat flux is 287.0 W/m2, the evaporation temperature of the working medium in the cooling pipe is −29 °C, and the soil boundary temperature is 14.5 °C. In order to show the impact of the temperature of the antifreeze pipe more clearly on the ice surface temperature, take local positions of the ice layer to observe the impact on the ice temperature. It can be seen from Figure 8 that when the temperature of the antifreeze pipe changes from 15 °C to 35 °C, the ice surface temperature only changes by about 0.02 °C, that is, the range of change is within 0.4%. Therefore, it can be concluded that the impact of the change in the temperature of the antifreeze pipe on the ice surface temperature can be ignored. The antifreeze pipe has little influence on the ice surface temperature owing to the insulation layer, but the temperature of the antifreeze pipe has a great influence on the temperature field below the insulation layer. In order to ensure uniform temperature distribution and minimize frost heave, the temperature of the working medium in the antifreeze pipe is selected as 15 °C, which is close to the simulated ground temperature at 10 m underground [27].

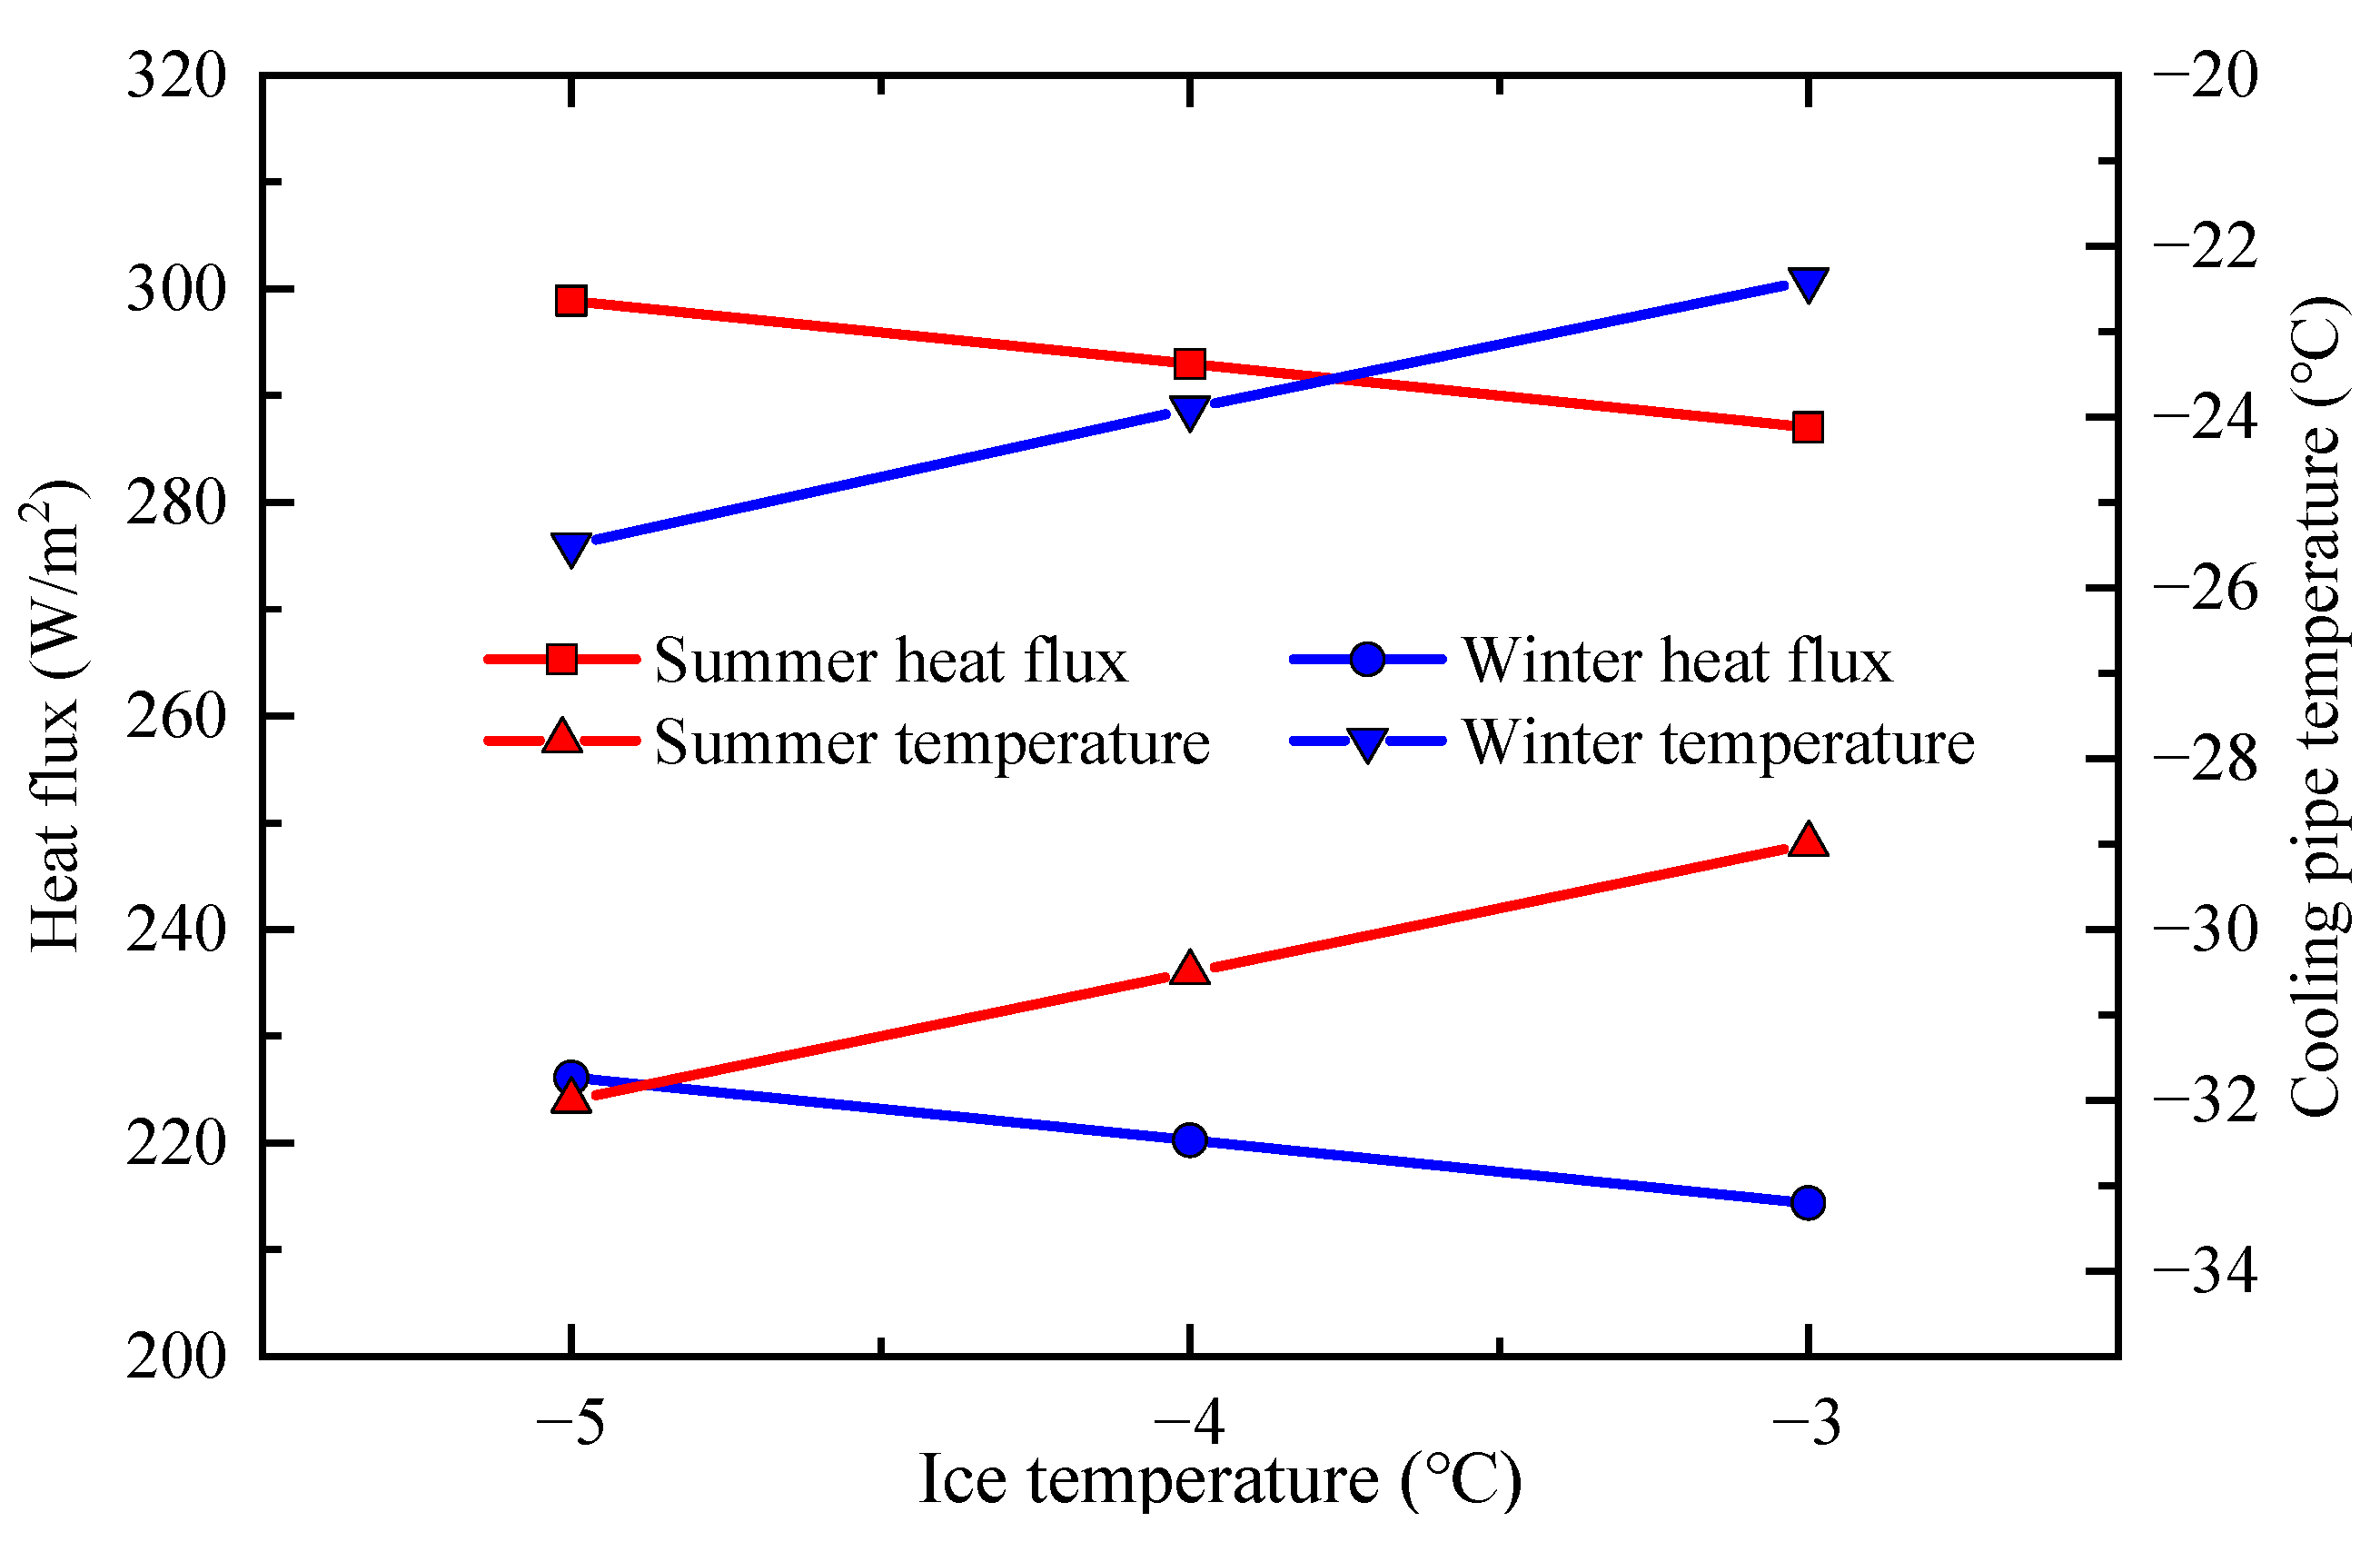
3.3. Influence of Ice Surface Temperature on Heat Flux and Cooling Pipe Temperature

Because different ice surface temperatures lead to different ice rink cooling loads, the refrigeration capacity provided by the cooling pipes is also different. Figure 9 shows the influence of ice surface temperature on the evaporation temperature of the working medium in the cooling pipes and the heat flux of the cooling pipes. It can be seen that the heat flux of the ice rink ranges from 214.4 W/m2 to 298.9 W/m2, and the evaporation temperature of the working medium in the cooling pipes ranges from −32 °C to −22.4 °C. The heat flux of the cooling pipe in summer is much higher than that in winter. The evaporation temperature of the working medium in the cooling pipe in summer is much lower than that in winter. With the decrease in the ice surface temperature, the demand for the heat flux of the cooling pipes is also increasing. If the ice surface temperature decreases by 1 °C, the heat flux of the cooling pipes increases by about 5.9 W/m2, and the required evaporation temperature of the working medium in the cooling pipe decreases by 1.5 °C.

3.4. Influence of the Cooling Pipe Spacing on Heat Flux and Temperature of the Cooling Pipes

The influence of the cooling pipe spacing on the heat flux of the cooling pipes and the evaporation temperature of the working medium in the cooling pipes are shown in Figure 10 and Figure 11, respectively. It can be seen from Figure 10 that when a certain ice surface temperature is met, the larger the cooling pipe spacing, the higher the required heat flux of the cooling pipes. This is because the increase in the cooling pipe spacing leads to the reduction of the number of cooling pipes, that is, the reduction of the heat transfer area of the cooling pipes. In order to meet the temperature requirements of the ice surface, it is necessary to increase the heat flux of the cooling pipes to meet the energy conservation of the ice rink. As can be seen from Figure 11, the larger the cooling pipe spacing, the lower the required temperature of the cooling pipes. According to the conservation of energy, under a certain cooling load, the reduction of the heat transfer area leads to the need for greater heat flux, which increases the required heat transfer temperature difference and reduces the evaporation temperature of the working medium in the cooling pipe. In summer, when the cooling pipe spacing is increased from 30 mm to 60 mm, the required heat flux of the cooling pipes will increase by 37.6 W/m2 and the evaporation temperature of the working medium in the cooling pipes will decrease by 1.5 °C for every 10 mm increase in the spacing. In winter, when the spacing increases from 30 mm to 60 mm, the required heat flux of the cooling pipe will increase by about 28.3 W/m2 and the evaporation temperature of the working medium in the cooling pipe will decrease by 1.2 °C for every 10 mm increment of spacing.
The uniformity of ice surface temperature determines the overall quality of the ice surface. In this paper, the maximum value of non-uniform temperature difference is used to represent the uniformity of ice surface temperature. The maximum value of non-uniform temperature difference refers to the difference between the maximum value and the minimum value of ice surface temperature under the same condition. Figure 12 shows the influence of the cooling pipe spacing on the non-uniform temperature difference on the ice surface. The maximum non-uniform temperature difference on the ice surface is approximately 0.111 °C and can be negligible. Thus, the chosen cooling pipe spacing is sufficient for creating ice surface of uniform temperature. With the increase in the cooling pipe spacing, the uniformity of the ice surface temperature becomes worse. Under the same ice surface temperature, the uniformity of ice surface in summer is worse than that in winter. When the cooling pipe spacing is increased from 30 mm to 60 mm, the maximum value of the ice surface temperature non-uniformity in summer increases from about 0.006 °C to 0.111 °C, and the maximum temperature difference of the ice surface temperature non-uniformity in winter increases from about 0.004 °C to 0.084 °C.

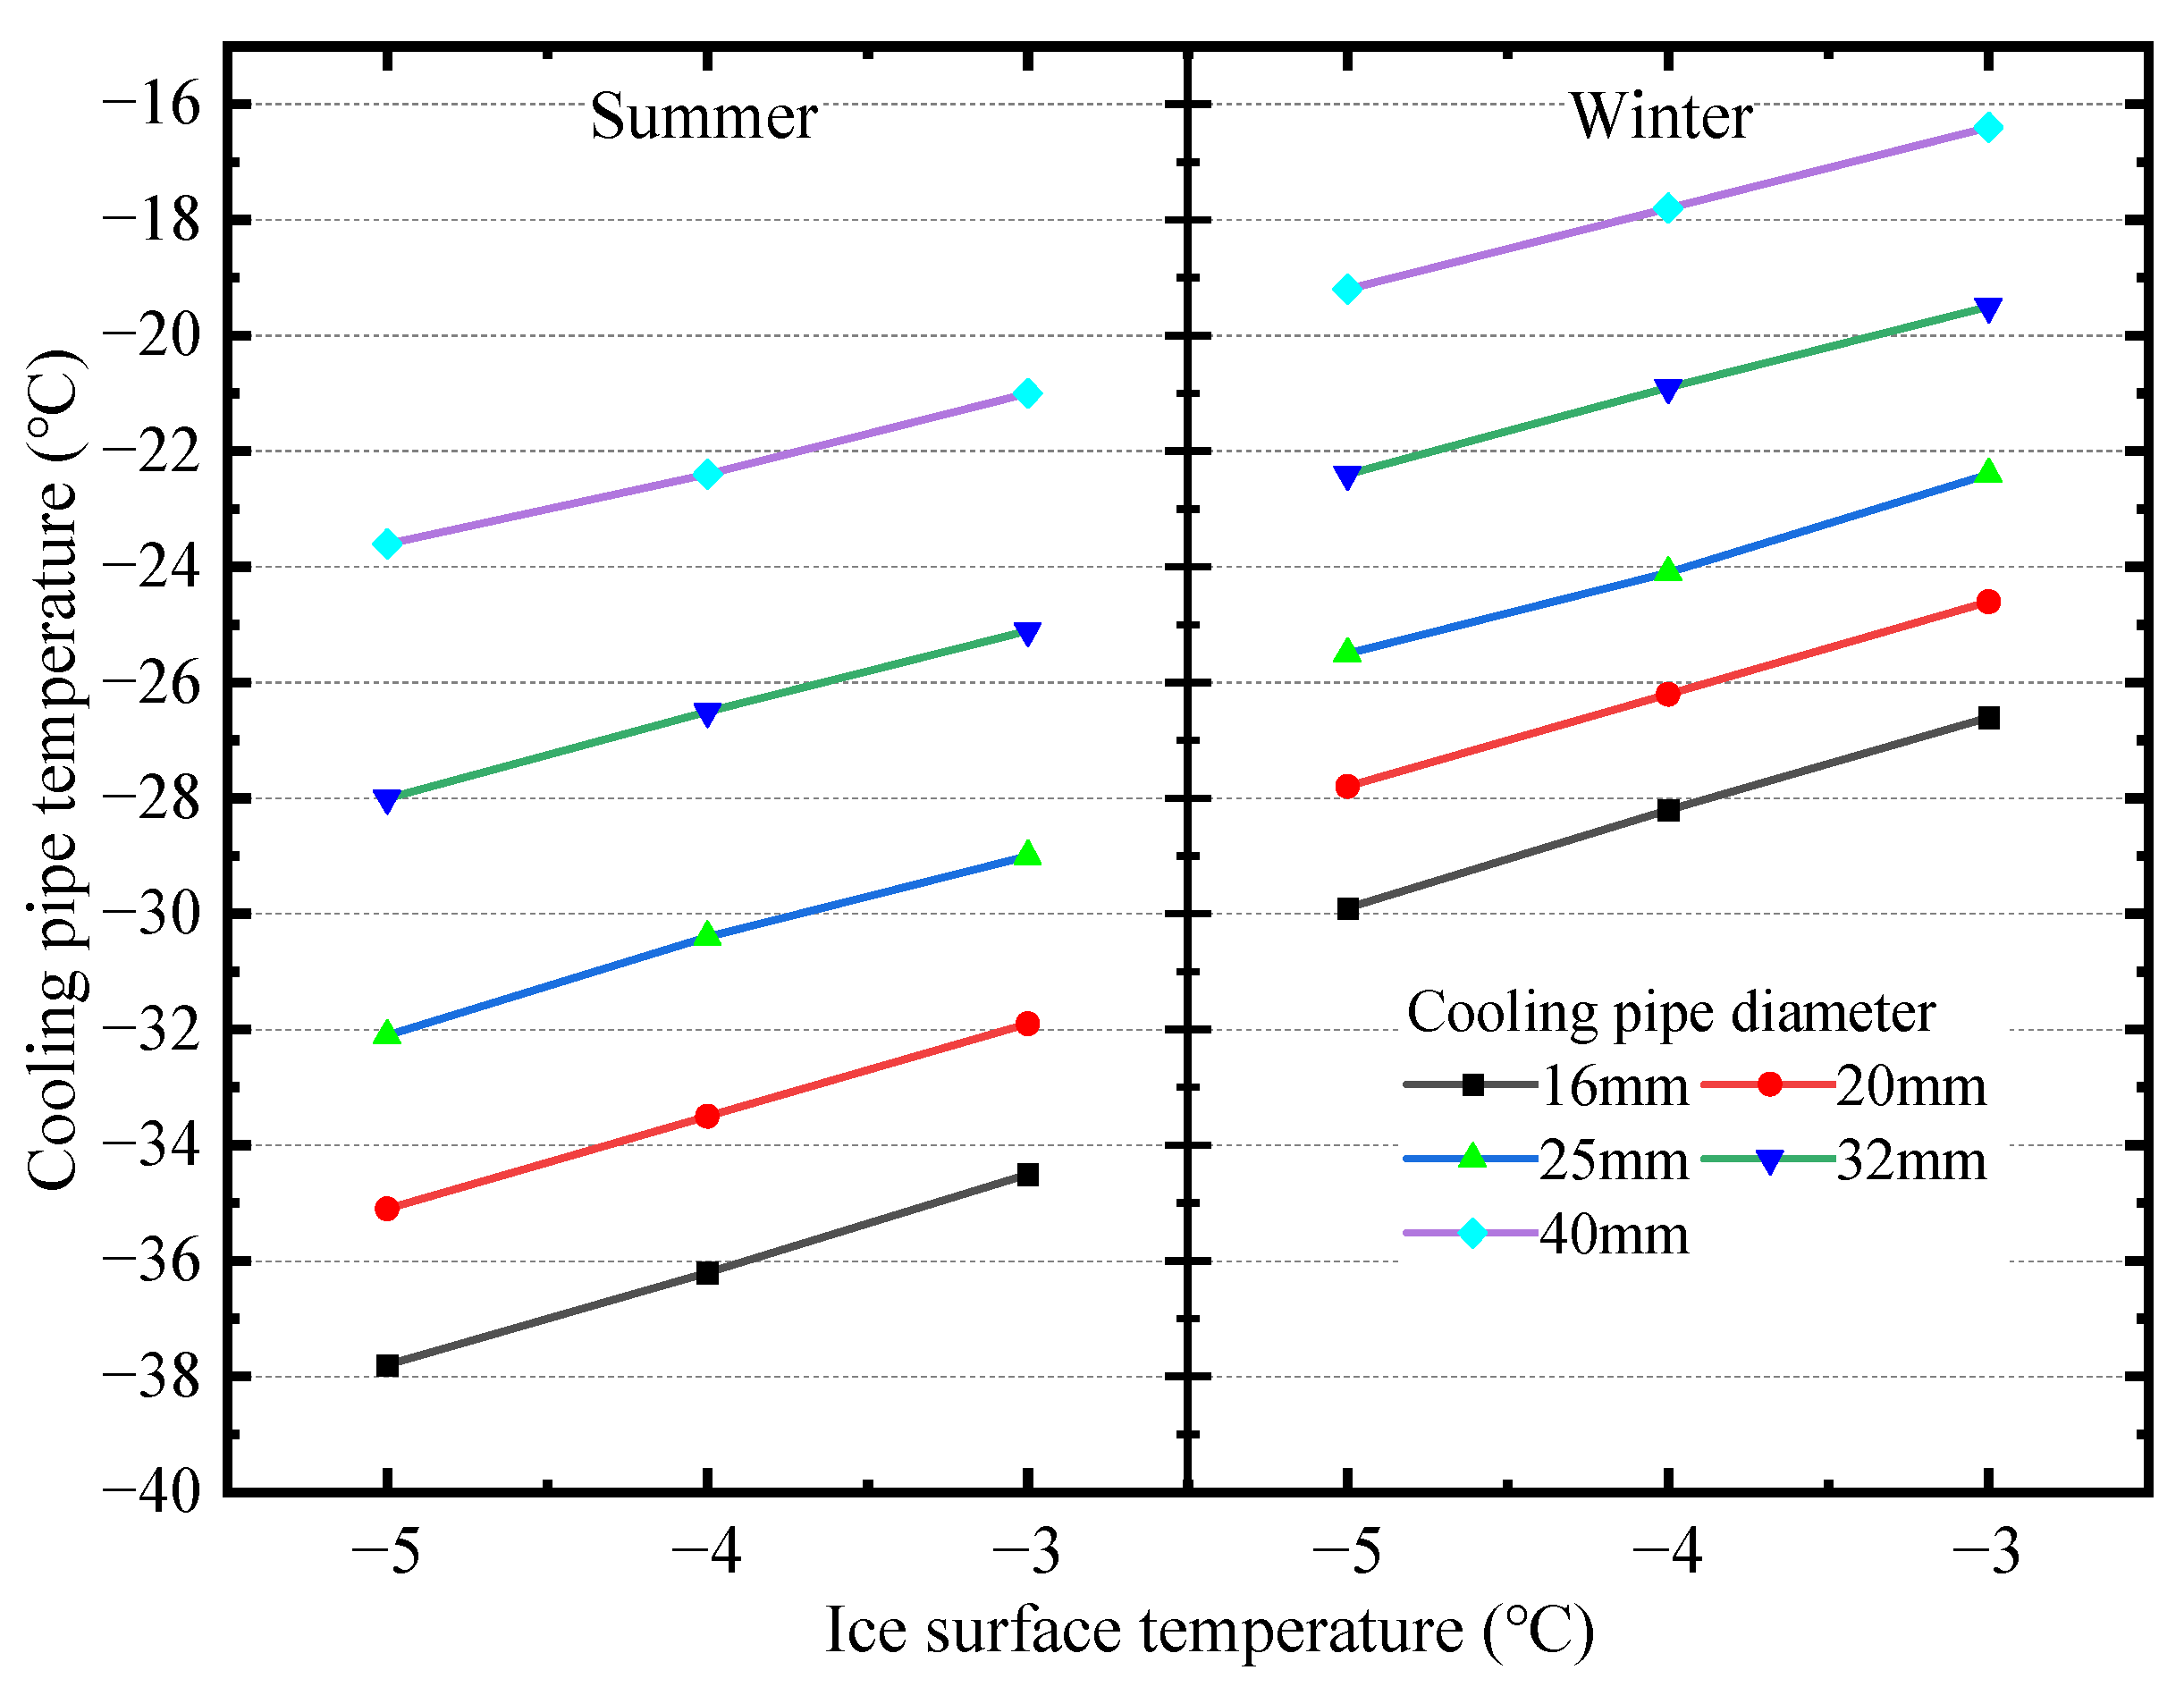
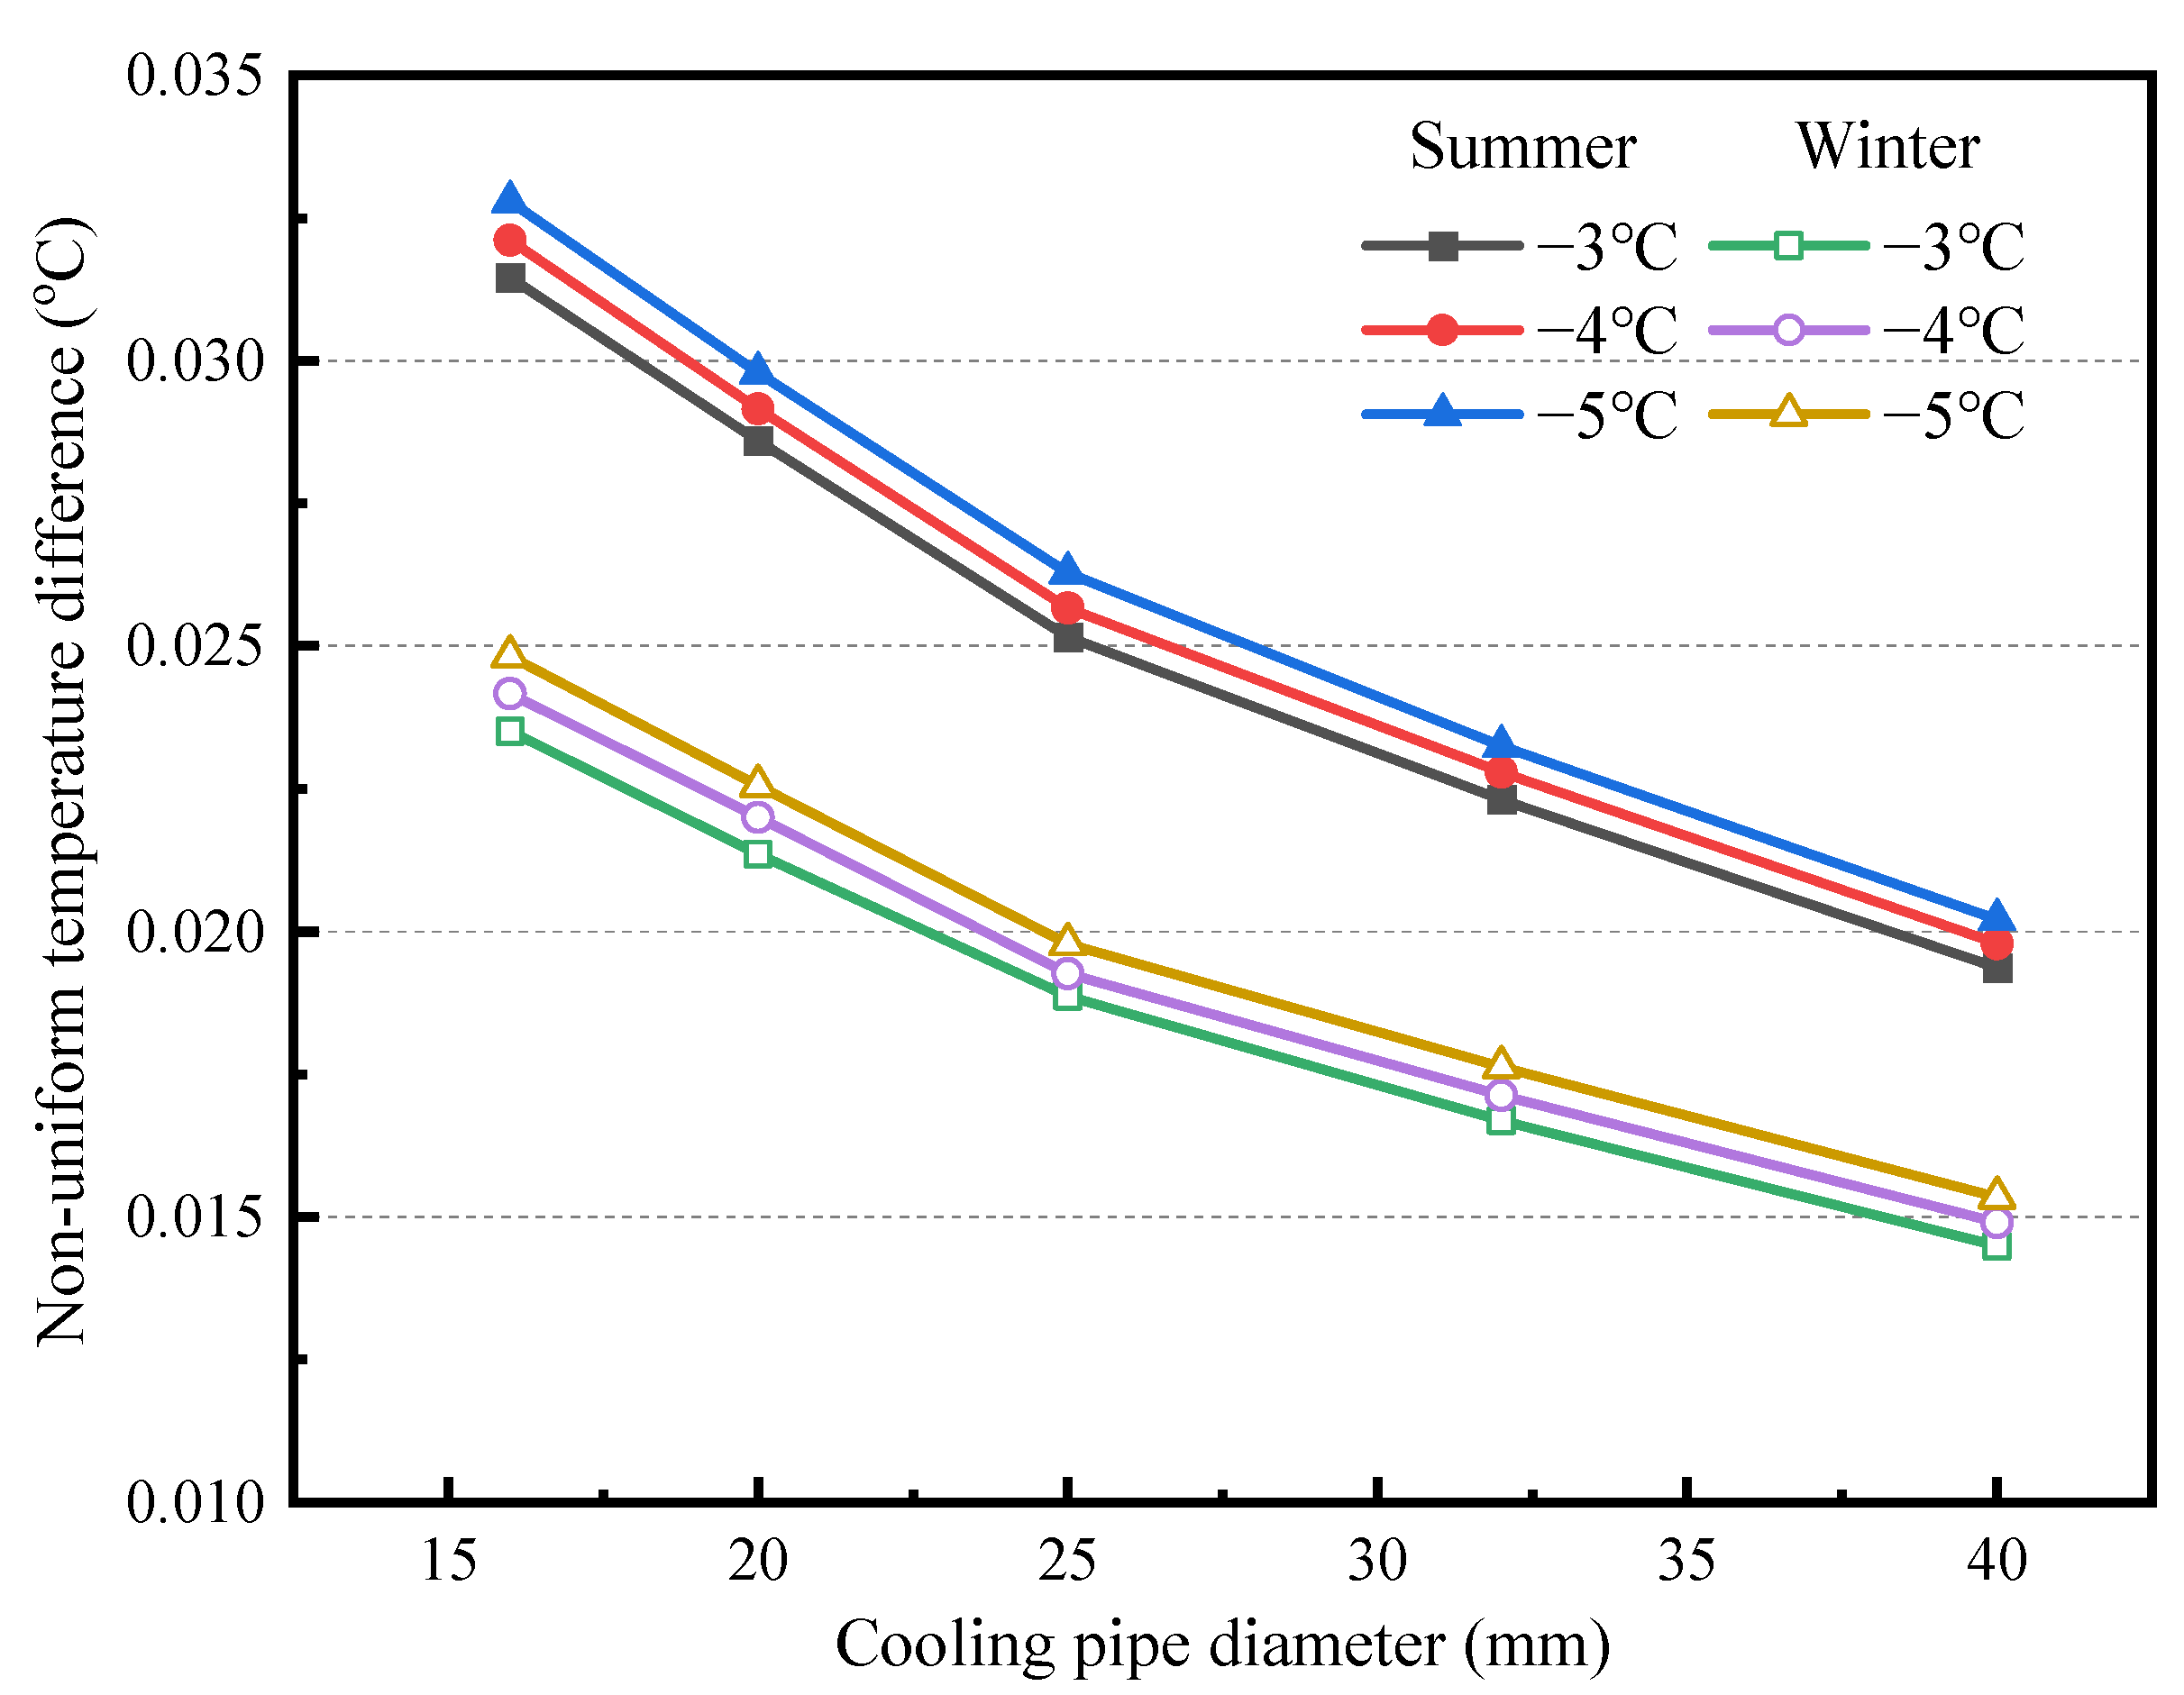
3.5. Influence of Cooling Pipe Diameter on Heat Flux and Temperature of the Cooling Pipes

The influence of the cooling pipe diameter on the heat flux of the cooling pipes and the evaporation temperature of the working medium in the cooling pipes are shown in Figure 13 and Figure 14, respectively. It can be seen that when the ice surface temperature is unchanged, the evaporation temperature of the working medium in the cooling pipes increases, and the heat flux of the cooling pipe decreases with the increase in the cooling pipe diameter. Because the number of cooling pipes is unchanged, increasing the cooling pipe diameter will increase the surface area of the cooling pipe. With the diameter of the cooling pipe from 16 mm to 40 mm, the evaporation temperature of the working medium in the cooling pipe increases by about 2.9 °C and the heat flux of the cooling pipe decreases by 49.4 W/m2 for every 5 mm increase in the cooling pipe diameter in summer. The evaporation temperature of the working medium in the cooling pipe increases by about 2.2 °C and the heat flux of the cold pipe decreases by 37.3 W/m2 for every 5 mm increase in the cooling pipe diameter in winter.
Figure 15 shows the influence of cooling pipe diameter on the temperature uniformity of the ice surface. The maximum non-uniform temperature difference on the ice surface is approximately 0.032 °C and thus negligible. Thus, the chosen cooling pipe diameters are sufficient for creating ice surfaces of uniform temperature. It can also be seen that with the increase in cooling pipe diameter, the uniformity of ice surface temperature gets better, this is because the cooling pipe spacing, ice surface temperature, and ice surface heat flux are constant, the increase in the cooling pipe diameter can result in the rise of cooling pipe temperature, which reduces the effect the temperature of the cooling pipe on the ice surface temperature. Under the same ice surface temperature, the uniformity of ice surface temperature in summer is worse than that of winter. With the cooling pipe diameter increasing from 16 mm to 40 mm, the maximum temperature difference between the ice surface temperature decreases from 0.032 °C to 0.020 °C in summer, and the maximum temperature difference between the ice surface temperature decreases from 0.024 °C to 0.015 °C in winter.

4. Conclusions

This paper selects the type of ice rink for figure skating in the recreational indoor ice rink, calculates the load of the indoor ice rink, and determines the parameters and boundary conditions in the simulation. Before the simulation, the grid independence was verified to control the ice surface temperature, and the effects of different ice surface temperatures and cooling pipe distance on the heat flux and temperature distribution in the ice rink were obtained. The results are as follows:
(1)
The influence of the temperature of the antifreeze pipe on the ice surface temperature and the heat flux of the cooling pipe can be ignored, that is, when the temperature of the antifreeze pipe changes within the range of 15–35 °C, the ice surface temperature changes within the range of 0–0.02 °C. From the temperature cloud diagram, the antifreeze pipe and the insulation layer effectively protect the impact caused by the downward transmission of cold energy, so the selection of the temperature of the antifreeze pipe can be determined according to the actual situation.
(2)
With the decrease in the ice surface temperature, the required heat flux of the cooling pipe increases, and the evaporation temperature of the working medium in the cooling pipe decreases. For example, when the ice surface temperature decreases from −3 °C to −5 °C, the heat flux and the evaporation temperature of the working medium in the cooling pipe in summer increase from 287.0 W/m2 to 298.9 W/m2 and from −29 °C to −32 °C, respectively.
(3)
When the ice surface temperature is constant, with the increase in the cooling pipe spacing, the required heat flux of the cooling pipes increases, the evaporation temperature of the working medium in the cooling pipes decreases, and the temperature non-uniformity of the ice surface increases. With the cooling pipe, spacing is increased from 30 mm to 60 mm, the heat flux of the required cooling pipes increases by about 28–39 W/m2 and the evaporation temperature of the working medium in the cooling pipes decreases by 1.2–1.5 °C for every 10 mm increment of spacing. The chosen cooling pipe spacing is sufficient for creating an ice surface of uniform temperature.
(4)
When the ice surface temperature is constant, with the increase in the cooling pipe diameter, the required heat flux of the cooling pipe decreases, the evaporation temperature of the working medium in the cooling pipes increases, and the temperature non-uniformity of the ice surface decrease. With the diameter of the cooling pipe from 16 mm to 40 mm, the evaporation temperature of the working medium in the cooling pipe increases by about 2.2–2.9 °C and the heat flux of the cooling pipe decreases by 37.3–49.4 W/m2 for every 5 mm increase in the cooling pipe diameter. The chosen cooling pipe diameters are sufficient for creating ice surfaces of uniform temperature.

Author Contributions

Z.Z., project administration, conceptualization, methodology; S.W., data curation, investigation, writing—original draft; M.Y., data curation, format analysis; K.G., review and editing, formal analysis; Y.C., format analysis, visualization. All authors have read and agreed to the published version of the manuscript.

Funding

This research was funded by S&T Program of Hebei (20474501D), Natural Science Foundation of Hebei Province (E2020209121), Tangshan Science and Technology Innovation Team (21130202D) and Tangshan Key Laboratory of Low-Carbon Built Environment (2022TS002b).

Data Availability Statement

The data can be provided on request from corresponding authors.

Acknowledgments

The authors would like to acknowledge the support of North China University of Science and Technology for expert support.

Conflicts of Interest

The authors declare no conflict of interest.

Nomenclature

qHeat flux, W/m2
cSpecific heat, W/m2
hHeat or mass transfer coefficient
vVelocity, m/s
dHumidity ratio, g/kg
rLatent heat, kJ/kg
LeLewis number
tTemperature, °C
PPower, W
EIlluminance, lx
UUtilization coefficient
KMaintenance factor
RThermal resistance, m2∙°C/W
Greek
ρDensity, kg/m3
εBlackness emissivity
σBlackness radiation coefficient
ΦLuminous flux of light source, lm/W
Subscripts
c Convective heat transfer
a Air
i Ice
s Surface
m Mass transfer
w i Water to ice
p Constant pressure
e Enclosure
r Radiant heat transfer
lg Lighting equipment
p Skaters
s Sum
sand Sand layer
ground Soil (ground)
ap Antifreeze pipe

References

  1. Lin, W.; Liu, X.; Li, S.; Zhang, T. Investigation on thermal environment and heat transfer characteristics in ice rinks with different envelopes. Build. Environ. 2022, 219, 109250. [Google Scholar] [CrossRef]
  2. Martin, T. Evolution of Ice Rinks. Ashrae J. 2004, 46, S24–S27. [Google Scholar]
  3. Liu, S. Research on Load of Outdoor Ice Rink Based on CFD Technology. Master’s Thesis, Hunan University of Technology, Zhuzhou, China, 2018. [Google Scholar]
  4. Shahzad, K. An Ice Rink Refrigeration System based on CO2 as Secondary Fluid in Copper Tubes. Master’s Thesis, Royal Institute of Technology Stockholm, Stockholm, Sweden, 2006. [Google Scholar]
  5. Wang, P.; Li, M.; Song, R.; Zhan, H.; Ma, Y. Analysis and Research on Artificial Ice Rink with CO2 Transcritical/Subcritical Cooling. J. Refrig. Technol. 2020, 40, 25–30. [Google Scholar]
  6. Ma, Y.; Wang, P. Brief Introduction of CO2 Refrigeration System in the National Speed Skating Stadium and Ammonia Refrigeration System in the National Snowmobile Sled Center for Beijing Winter Olympics in 2022. Chin. J. Refrig. Technol. 2020, 40, 2–7. [Google Scholar]
  7. Sawalha, S. Carbon Dioxide in Supermarket Refrigeration. Ph.D. Thesis, Royal Institute of Technology Stockholm, Stockholm, Sweden, 2008. [Google Scholar]
  8. Rogstam, J.; Prakash, J. Energy Analysis of Backavallen Ice Rink Refrigeration System with CO2 as Heat Transfer Liquid in Copper Tubes; Sveriges Energi & Kylcentrum: Katrineholm, Swiden, 2007. [Google Scholar]
  9. Zhang, Z.; Yuwen, Y.; Zhang, Z. Application of CO2 Refrigeration Systems in Artificial Ice Rinks. Refrigeration 2021, 40, 28–33. [Google Scholar]
  10. Momeni, H.; Keshtkar, M.M. Thermodynamic, Economic, and Environmental Comparison Between the Direct and Indirect CO2 Refrigeration Cycle With Conventional Indirect NH3 Cycle With Considering a Heat Recovery System in an Ice Rink: A Case Study. J. Energy Resour. Technol. 2019, 142, 1–7. [Google Scholar] [CrossRef]
  11. Zhang, Z.; Xu, Y.; Yin, H.; Gong, K.; Wang, K. Performance analysis of ice rink refrigeration system using natural working fluid. Cryog. Supercond. 2022, 50, 51–57. [Google Scholar]
  12. Liu, K. Application of Natural Refrigerant CO2 in Ice Rinks of Beijing Winter Olympics in 2022. Chinese J. Refrig. Technol. 2020, 40, 20–24. [Google Scholar]
  13. Wang, G.; Zhang, X. Review of CO2 Thermodynamic System for Ice Rinks. Chin. J. Refrig. Technol. 2020, 40, 31–37+45. [Google Scholar]
  14. Rogstam, J. CO2 refrigeration systems evolution for ice rinks. Ashrae J. 2016, 58, 34–48. [Google Scholar]
  15. Hou, A.; Dong, J.; Jiang, Y. The Research Progress of CO2 Used for Ice Rink Refrigeration System. Refrig. Air Cond. 2015, 29, 11–15. [Google Scholar]
  16. Bellache, O.; Ouzzane, M.; Galanis, N. Coupled Conduction, Convection, Radiation Heat Transfer with Simultaneous Mass Transfer in Ice Rinks. Numer. Heat Transf. 2005, 48, 219–238. [Google Scholar] [CrossRef]
  17. Bellache, O.; Ouzzane, M.; Galanis, N. Numerical prediction of ventilation patterns and thermal processes in ice rinks. Build. Environ. 2005, 40, 417–426. [Google Scholar] [CrossRef]
  18. Mun, J.; Krarti, M. Experimental Analysis of Heat Transfer from Ice Rink Floors. In Proceedings of the Asme International Solar Energy Conference, Denver, CO, USA, 8–13 July 2006. [Google Scholar]
  19. Zhou, W.; Gan, Z.; Han, L. Simulation of the Optimal Refrigerated Floor Design for Ice Rinks. Energies 2021, 14, 1535. [Google Scholar] [CrossRef]
  20. Wang, B. Application research on refrigeration systems of ice rink with CO2 as refrigerant. Master’s Thesis, Harbin Institute of Technology, Harbin, China, 2018. [Google Scholar]
  21. Li, L.; Liu, X.; Zhang, T. Experimental investigation of frosting process on ice surface in ice rink. Energy Build. 2022, 255, 111671. [Google Scholar] [CrossRef]
  22. International Ice Hockey Federation. Technical Guidelines of an Ice Rink; International Ice Hockey Federation: Zürich, Switzerland, 2011. [Google Scholar]
  23. Estruc, I.M. Investigation of How Insulation Affects the Pipe System in the Soil for Ice Rinks. Master’s Thesis, University of Gävle, Gavle, Sweden, 2014. [Google Scholar]
  24. Zhou, M. Analysis and Simulation of the Temperature Distribution around the Horizontal Heat Exchanger. Master’s Thesis, Hunan University, Changsha, China, 2014. [Google Scholar]
  25. Fan, A.; Liu, W.; Wang, C. Simulation on the daily change of soil temperature un-der various environment conditions. Acta Energy Sol. Sin. 2003, 24, 167–171. [Google Scholar]
  26. Li, L.; Liu, X.; Zhang, T. Investigation of heat and mass transfer characteristics in the ice rink: Ice making, maintaining and resurfacing processes. Build. Environ. 2021, 196, 107779. [Google Scholar] [CrossRef]
  27. Liu, X. Study on Heat Transfer and Refrigeration System of Ice Rink Using CO2 as Coolant. Master’s Thesis, North China University of Science and Technology, Tangshan, China, 2021. [Google Scholar]
Figure 1. Physical model of ice rink.
Energies 15 07989 g001
Figure 2. Ice surface heat transfer network diagram.
Energies 15 07989 g002
Figure 3. Computational domain grid distribution.
Energies 15 07989 g003
Figure 4. Grid independence verification.
Energies 15 07989 g004
Figure 5. Validation results of the heat flux of the ice rink model.
Energies 15 07989 g005
Figure 6. Validation results of the ice surface temperature fluctuation of the ice rink model.
Energies 15 07989 g006
Figure 7. Temperature distribution in ice rink.
Energies 15 07989 g007
Figure 8. Influence of antifreeze pipe temperature on ice surface temperature.
Energies 15 07989 g008
Figure 9. Influence of ice surface temperature on ice rink load and cooling pipe temperature.
Energies 15 07989 g009
Figure 10. Influence of cooling pipe spacing on heat flux.
Energies 15 07989 g010
Figure 11. Influence of cooling pipe spacing on cooling pipe temperature.
Energies 15 07989 g011
Figure 12. Influence of cooling pipe spacing on ice surface temperature uniformity.
Energies 15 07989 g012
Figure 13. Influence of cooling pipe diameter on heat flux.
Energies 15 07989 g013
Figure 14. Influence of cooling pipe diameter on cooling pipe temperature.
Energies 15 07989 g014
Figure 15. Influence of cooling pipe diameter on ice surface temperature uniformity.
Energies 15 07989 g015
Table 1. Geometrical and physical parameters of the ice rink.
LayersThickness (mm)Density (kg/m3)Specific Heat [J/(kg·°C)]Conductivity [W/(m·K)]
Ice409952.12.22
Sand6016000.10.335
Concrete10023000.6571.046
Cement3018600.840.72
Waterproof layer2.523300.841.15
Polystyrene150231.470.035
Soil5013001.0460.837
Table 2. Boundary conditions of ice rink.
ParameterSignificanceValue
SummerWinter
ta (°C)Air temperature2717
ti (°C)Ice surface temperature−5 to −3−5 to −3
hi [W/(m·°C)]Heat transfer coefficient between air and ice surface2.5832.583
hm [kg(m2·s)]Mass transfer coefficient between air and ice surface0.00280.0028
da (g/kg)Air moisture content2.755.5
tap (°C)Temperature of the antifreeze pipe15–35
tl=10 (°C)Temperature at 10 m underground14.5
Publisher’s Note: MDPI stays neutral with regard to jurisdictional claims in published maps and institutional affiliations.

