Article

Experimental and Numerical Study on the Explosion Dynamics of the Non-Uniform Liquefied Petroleum Gas and Air Mixture in a Channel with Mixed Obstacles

1
School of Petrochemical Engineering & Environment, Zhejiang Ocean University, Zhoushan 316022, China
2
National & Local Joint Engineering Research Center of Harbor Oil & Gas Storage and Transportation Technology, Zhoushan 316022, China
3
Zhejiang Key Laboratory of Petrochemical Environmental Pollution Control, Zhejiang Ocean University, Zhoushan 316022, China
4
Department of Oil, Army Logistical University, Chongqing 401331, China
*
Authors to whom correspondence should be addressed.
Energies 2022, 15(21), 7999; https://doi.org/10.3390/en15217999
Submission received: 26 September 2022 / Revised: 12 October 2022 / Accepted: 20 October 2022 / Published: 27 October 2022
(This article belongs to the Topic Advances in Clean Energies)

Abstract

:
Mixed obstacles have a great influence on the deflagration process of liquefied petroleum gas (LPG)-air premixed combustible gas with concentration gradient. The arrangement of mixed obstacles may further stimulate overpressure and flame propagation. In this work, based on experimental and numerical simulations, this paper analyzes the flame and overpressure, and mainly studies the coupling relationship among the explosion overpressure characteristics, the structure of flame and the speed of flame propagation. The result shows that when the rectangular obstacle is 100 mm away from the ignition source, not only the speed of flame is the fastest, but also the time required to reach the maximum over-pressure is the shortest. In this configuration, an elongated flame is formed between a rectangular obstacle and a flat obstacle, and an obvious backflow structure appears. In addition, the average growth rate of overpressure has a minimum value, reaching at −35 MPa/s. The existence of rectangular obstacles further stimulates the overpressure. When the rectangular obstacle is 400 mm away from the ignition source, the maximum overpressure value is the highest among the four configurations. Besides, the time when the maximum area of flame appears in the simulation is almost the same as the time when the maximum overpressure is obtained. In addition, the average growth rate of overpressure increases significantly after touching the rectangular obstacle, which coincides with the mutation time of the front tip of the flame, overpressure and area of flame after the flame encounters the rectangular obstacle. This research has an important theoretical guiding significance for preventing LPG leakage and explosion accidents in a long and narrow space.

1. Introduction

Explosions of combustible gas are frequent accidents in process industries, such as the chemical industry, coal mines, and oil depots [1,2,3]. Most gas explosions occur in special spatial structures called narrow spaces. In practical engineering, there are often various types of devices in the long and narrow space, which can greatly disturb the deflagration process when deflagration occurs. These devices are collectively referred to as obstacles. The physical parameters [4,5,6,7] of the obstacles become the direct factors that affect the explosion flame propagation and explosion intensity. The shape of the obstacles is the most direct disturbance to the explosion flow field, and the overpressure peak caused by triangular obstacles is 7% and 30% higher than that of square obstacles and circular obstacles, respectively [8]. Longer obstacles provide sufficient acceleration time, resulting in higher explosion overpressure and faster flame propagation [9]. Zhang et al. [10] used the perimeter of the orifice plate as the criterion for judging the sharpness of the orifice plate and found that the perimeter is positively correlated with the recoil flame intensity. In addition, the increase of the perimeter can cause the acceleration of the flame through the orifice plate. Huang et al. [11] found that the influence of obstacles on the speed of flame propagation and the growth rate of overpressure is more significant than the concentration gradient. Moreover, in the case of the same obstacle blocking rate, the opening shape of the obstacles has less influence on the critical pressure. The obstacle can only affect a limited area around it, and the pressure behind the obstacle is sensitive to the size of the obstacle. Extending the width and height of the obstacles can significantly reduce the explosion pressure behind the obstacles [12]. The relative position of obstacles, ignition sources [13], and vents [14,15] are also important factors. During the propagation of flame in H2-O2 mixtures with different blocking rates and different distances of obstacles, it is found that obstacles with irregular shapes can detonate more quickly, which depend on the relative position between the obstacle and the ignition source [16].
The existence of obstacles can disturb the flow field after the explosion to a great extent. The obstacles can not only change the size of the overpressure to a certain extent, but also have a significant impact on the shape [17,18] of the flame and the spread of flame [19]. After an explosion experiment in a closed duct with 17 different configurations of obstacles, it is found that the mixed obstacles have the greatest influence on the flame acceleration behavior when the distance is 1 to 4 times the length of the duct diameter [20]. As the angle of the obstacle increases, the time from ignition to peak overpressure decreases. Under the same obstacle angle, increasing the blocking rate can reduce the maximum speed of the flame [21]. The presence of the obstruction has no effect on the flame contacting the duct wall, but accelerates the reversal and propagation of the flame [22,23].
When the combustible gas in the narrow space explodes, the deflagration process is extremely unstable. The recombination and dissociation in the gas mixture leads to intensified convection [24]. A shock wave can be induced under the interference of obstacles, and it is easy to change from deflagration to detonation (DDT) [25,26,27]. This can not only make the destruction greatly enhanced, but can also bring huge losses. Compared with the curved channel in the staggered case, the straight channel parallel to the propagation direction of flame is more favorable to generate strong shock focusing [28]. The shape of the obstacles are closely related to the DDT process. The angles of triangular obstacles are more conducive to the stretching and convolution of the flame than circular obstacles [29]. Changes in the geometry of sharp obstacles [30] have a certain effect on vortex shedding and shock reflection, which promote flame acceleration and DDT propagation.
Under the disturbance of obstacles, the flow field becomes turbulent. Rayleigh-Taylor (R-T) [31] instability is the main cause of turbulent flow [32] and flame deformation [33] in blocked ducts. R-T instability accompanies the entire propagation process of the flame when the flame passes through the obstacle, and corresponds to the flame acceleration at each stage. The effect of Kelvin-Helmholtz (K-H) instability on tip flame propagation is more pronounced [34]. Similarly, as the number of obstacles increases, the K-H instability and R-T instability formed within the flow field become stronger. These eventually lead to a more pronounced stretching of the flame and a greater turbulent intensity of flame propagation [35]. When the explosion flame propagates, the instability leads to differences in the density gradient and pressure gradient in the duct. The interaction of density gradient and pressure gradient leads to the formation of oblique pressure moments, which is the main cause of vortices. During the propagation of flame, the amount of vortex formed at the obstacles or in the combustion gas is more pronounced. This is because when crossing the obstacles, the sudden acceleration of the flame in the duct under the effect of the R-T destabilization state generates pressure waves [36]. When the blocking rate increases, the degree of pressure wave deformation becomes greater, and the intensity of turbulence during the propagation of flame becomes larger. The obstacles with tip structures promote the generation of flow instabilities [37], which tend to form shear layers and subsequently become vortices. Cubic obstacles can produce higher overpressure and the speed of flame [38] than cylindrical obstacles. The hydrogen volume fraction in premixed combustible gas has a great incentive effect on deflagration process [39]. The effects of both diffusion thermal instability and hydrodynamic instability on flame instability are enhanced as the hydrogen content increases [40]. The coupling of obstacles and hydrogen volume fraction affects the dynamics, and leads to more drastic changes in flame structure morphology [22].
According to existing papers, the research on gas explosions in ducts mainly focus on uniform premixing. However, in the actual explosion process, the gas usually does not fill the long and narrow space uniformly, and is often non-uniformly distributed. The study of explosive overpressure characteristics and the flame behavior of premixed gases under nonuniformity has also become a focus area of research in recent years [41,42]. In channels without obstacles, concentration gradients usually lead to greater acceleration. In contrast, in the channels with obstacles, concentration gradients can enhance or delay acceleration, which depend on the average concentration of the premixed gas. In general, the speed of flame propagation and overpressure are greater in more well-mixed methane-air. In poorly mixed methane-air, the speed of flame propagation and overpressure decrease and a distinct triple flame appears. As the volume fraction gradient of the gas increases, the triple flame structure becomes more obvious. However, as the distance of the obstacle from the ignition source increases, there is a delay in the moment of triple flame appearance [43]. The speed of flame propagation increases again after the flame passes the obstacles, then the triple flame disappears and forms an incomplete mushroom-type flame downstream of the obstacles [44]. Although considerable efforts have been made on non-uniform explosion mechanisms, the details of the explosion behavior of premixed gases in blocked ducts under non-uniformity remain unclear.
Compared with previous studies on deflagration of a single obstacle, research on the deflagration of mixed obstacles is deepened further in this paper. Based on the study of deflagration with mainly flat obstacles [30], this paper focuses on the overpressure characteristics, the structure of flame and the speed of flame propagation of mixed obstacles during the deflagration process of LPG-air premixed combustible gas with concentration gradient. Based on the experimental and numerical simulation methods, the explosion experiments of non-uniform premixed gas were first conducted in a duct with flat obstacles, and then the validity of the numerical simulations is verified. For the deflagration process of gas, pressure and flame are the two most intuitive and direct research objects. The pressure and flame were studied in depth by means of simulation, such as the average growth rate of overpressure dp/dt and the area of flame. The research found that some new characteristics of flame and pressure appear in different configurations, in which a unique side branch of flame appears. The results of the study provide a theoretical basis for the prevention and management of gas explosions in a long and narrow space, such as various types of ducts. Moreover, these can greatly provide scientific guidance for the investigation of oil and gas deflagration accidents.

2. Experiment Setup

2.1. Geometrical Structure of the Square Duct with Flat Obstacles

The pipe gallery in the actual project is narrow and long, and the length-diameter ratio greater than 10/1 [45] is often regarded as the large length-diameter ratio. Therefore, we study the deflagration process in a long and narrow channel with an aspect ratio of 10/1 under the disturbance of mixed obstacles. Figure 1 shows the structural model of the experimental duct. The duct size is 100 mm × 100 mm × 1000 mm, which is mainly made of a Q235-A steel plate. The thickness of the steel plate is 5 mm. To facilitate the observation of the flame, a 20 mm thick fully transparent explosion-proof plexiglass panel is installed on the front of the duct. The ignition source is located in the center of the left side of the duct, and there is a pressure monitoring point at 30 mm from the ignition source on the left side. There are three flat obstacles with a thickness of 5 mm and a blocking rate of 0.3 inside, which are 200 mm, 500 mm and 800 mm away from the ignition source.

2.2. Experimental Methods

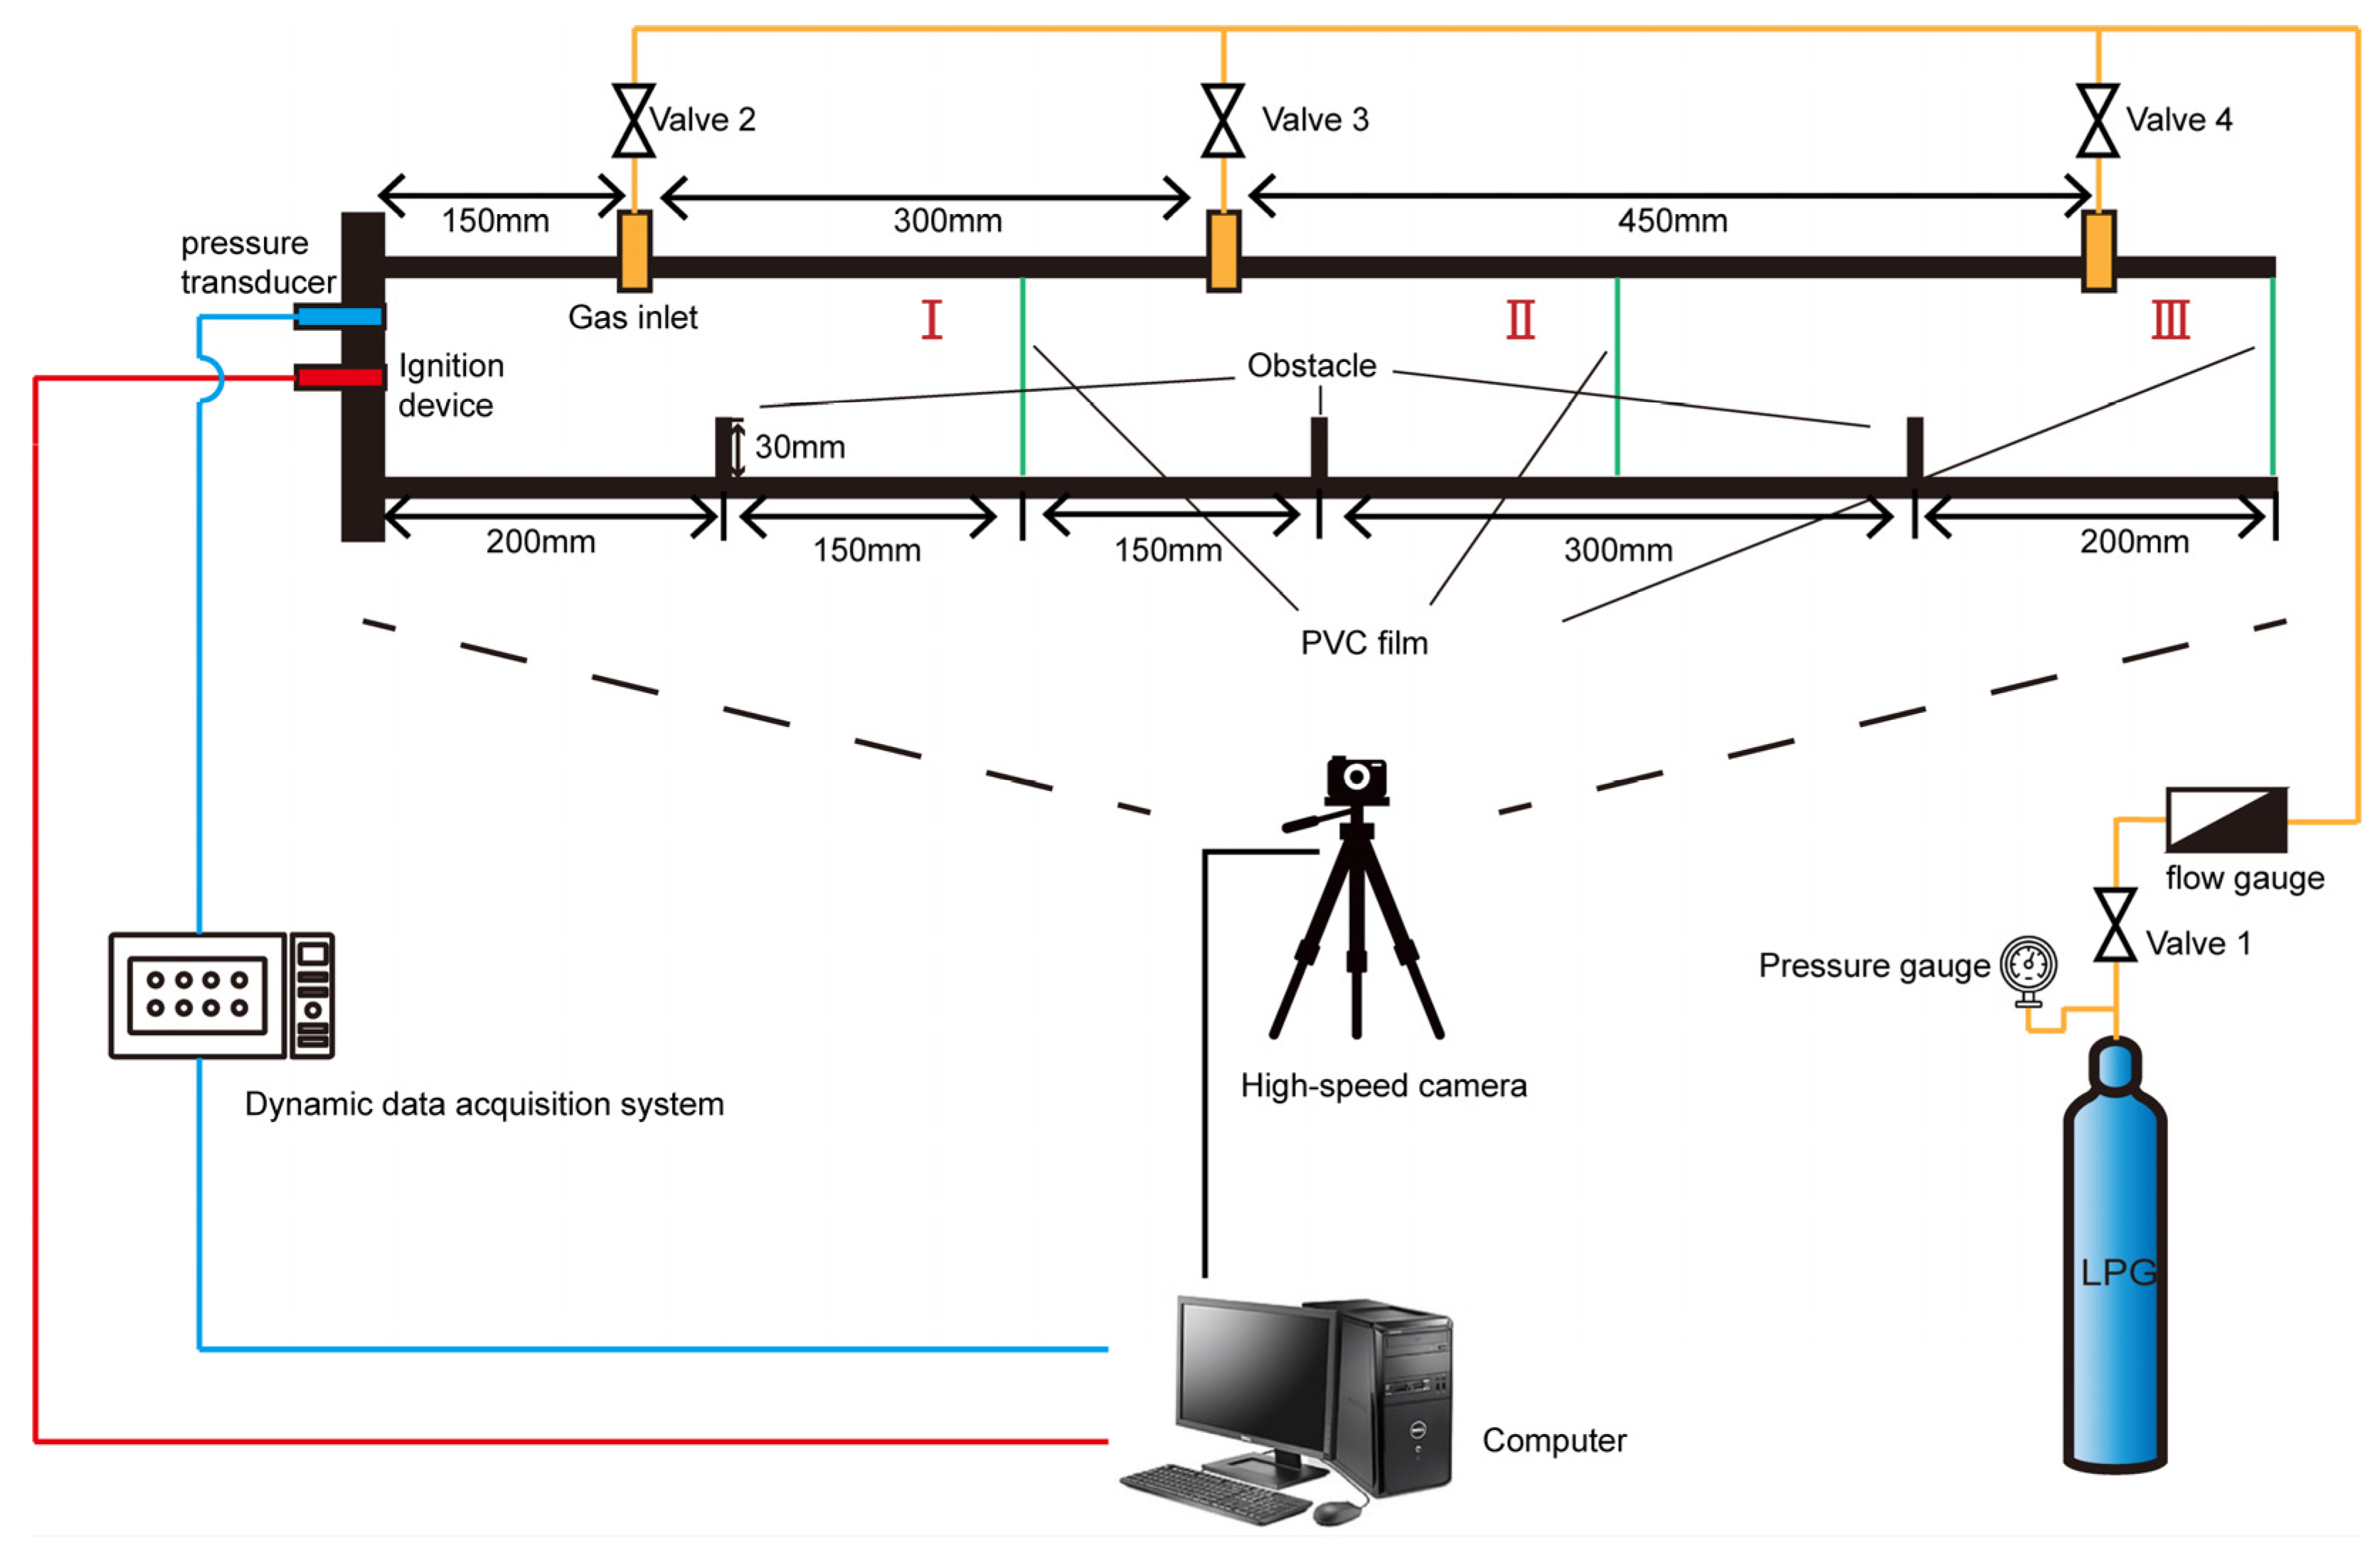
Figure 2 is a schematic diagram of the experimental system. The left end of the duct is closed. In order to prevent the premixed gas from leaking out, the outlet of the duct is sealed with a polyvinyl chloride (PVC) film. Before the experiment, in order to form three parts with different concentrations of combustible gases, PVC films are used to separate them at the distance of 350 mm and 650 mm from the ignition source, and then the three chambers in the duct were inflated separately. The concentration inside each gas chamber is uniform, and the equivalence ratios of the three regions are 1.5, 1.2 and 1, respectively. In addition, the LPG charging rate is controlled in terms of the pressure gauge and flow gauge. The high-speed camera is placed in front of the observation window with appropriate shading measures. After proper preparation, the adjustable igniter is used for ignition, which can be adjusted by knob voltage to determine the ignition energy. The model of the igniter is KTGD-B, and the ignition energy used in the experiment is 20 J. In each experiment, LPG is injected into the chamber through the upper plate of the duct. When the combustible gas is ignited and exploded, the PVC film ruptures and the combustion gas and unburned gas rush out of the duct. A CY-301 type digital pressure transducer is used to collect pressure data. The range of the pressure sensor is 0 to 5 Mpa. The accuracy of the pressure transducer is 0.1%FS, and the sampling rate is 1000 times per second. A high-speed camera with 1280 × 1024 pixels is used to record the explosion process simultaneously in the experiment, and the version of the high-speed camera is MC1362. To ensure the validity of the experimental data, the explosion experiment is repeated at least three times, and we take their average.

3. Numerical Model

In this paper, we use Fluent for numerical simulation and choose Large Eddy Simulation (LES) with the WALE model [4,46] and premixed combustion model with Non-Adiabatic and the Zimont model for simulation. The continuity equation, momentum equation, and energy equation of LES are well documented in the related literature, so they are not listed separately in this paper.
Figure 3 shows the mesh model of the experimental duct. To meet the computational requirements, ANSYS ICEM 2021R2 is used to divide the computational domain into structured meshes with a cell size of 3 mm [47] and a hexahedral mesh number of 399,976.

3.1. Materials

The LPG used in the experiment contains more than 95% propane, so the propane is used instead of LPG in the simulation [48]. A premixed gas of propane and air is considered to be the ideal gas. The constant pressure specific heat capacity of the mixture is approximated by a piecewise polynomial related to temperature, and the viscosity is calculated by Sutherland’s law [49]. Table 1 shows the non-uniform concentrations and some detailed parameters for the three parts of the experiment.

3.2. Boundary and Initial Conditions

The solution mode is selected as Pressure-Based, Transient. The effect of gas gravity on the flow field can be ignored in the explosion, so the effect of gravity is not considered. The duct outlet is set as a pressure boundary condition, and the pressure is set as a boundary condition with non-reflection [50] to ensure that it is not affected by the reflection of the pressure waves. During the simulation, the duct is in a relatively stationary state and the wall is set to a no-slip wall condition. Because the LPG explosion time is short, the changes of temperature on the wall during the explosion is negligible. Hence the wall of the duct is set to adiabatic, and the value of heat exchange with the outside is 0. Table 2 shows some set conditions.
The initial temperature is set to 300 K. The gauge pressure, the initial speed of flame propagation and the progress variable are set to 0 before the formal calculation. To simulate ignition, a hemisphere with a radius of 5 mm [51] is captured on the left side of the duct and its reaction process variable is assigned a value of 1.
To ensure the convergence of the computational results, the time step length [52,53] is set to 1 × 10⁻⁶ s in the solution, and 40 iterations are required in each time step. The convergence criterion of energy and progress variable equation is less than 1 × 10⁻⁶ and 1 × 10⁻³ respectively, and the other equations are less than 2 × 10⁻⁵.

4. Results and Discussion

4.1. Numerical Verification

Figure 4 presents the flame position with the time under various grid resolutions. To verify the grid independence, numerical simulations are applied with three different gird resolutions, 2 mm, 3 mm and 4 mm. By calculating the maximum distance between the flame and the ignition source, the tip position of the flame is obtained. The simulations are validated by the experimental results. In addition, there is no obvious difference between the simulations obtained by these three grids. Note that the smaller grid resolution can better reproduce the experimental data. Considering the limitation of laboratory computing power and computing time, this paper chooses 3 mm × 3 mm × 3 mm as the grid resolution.
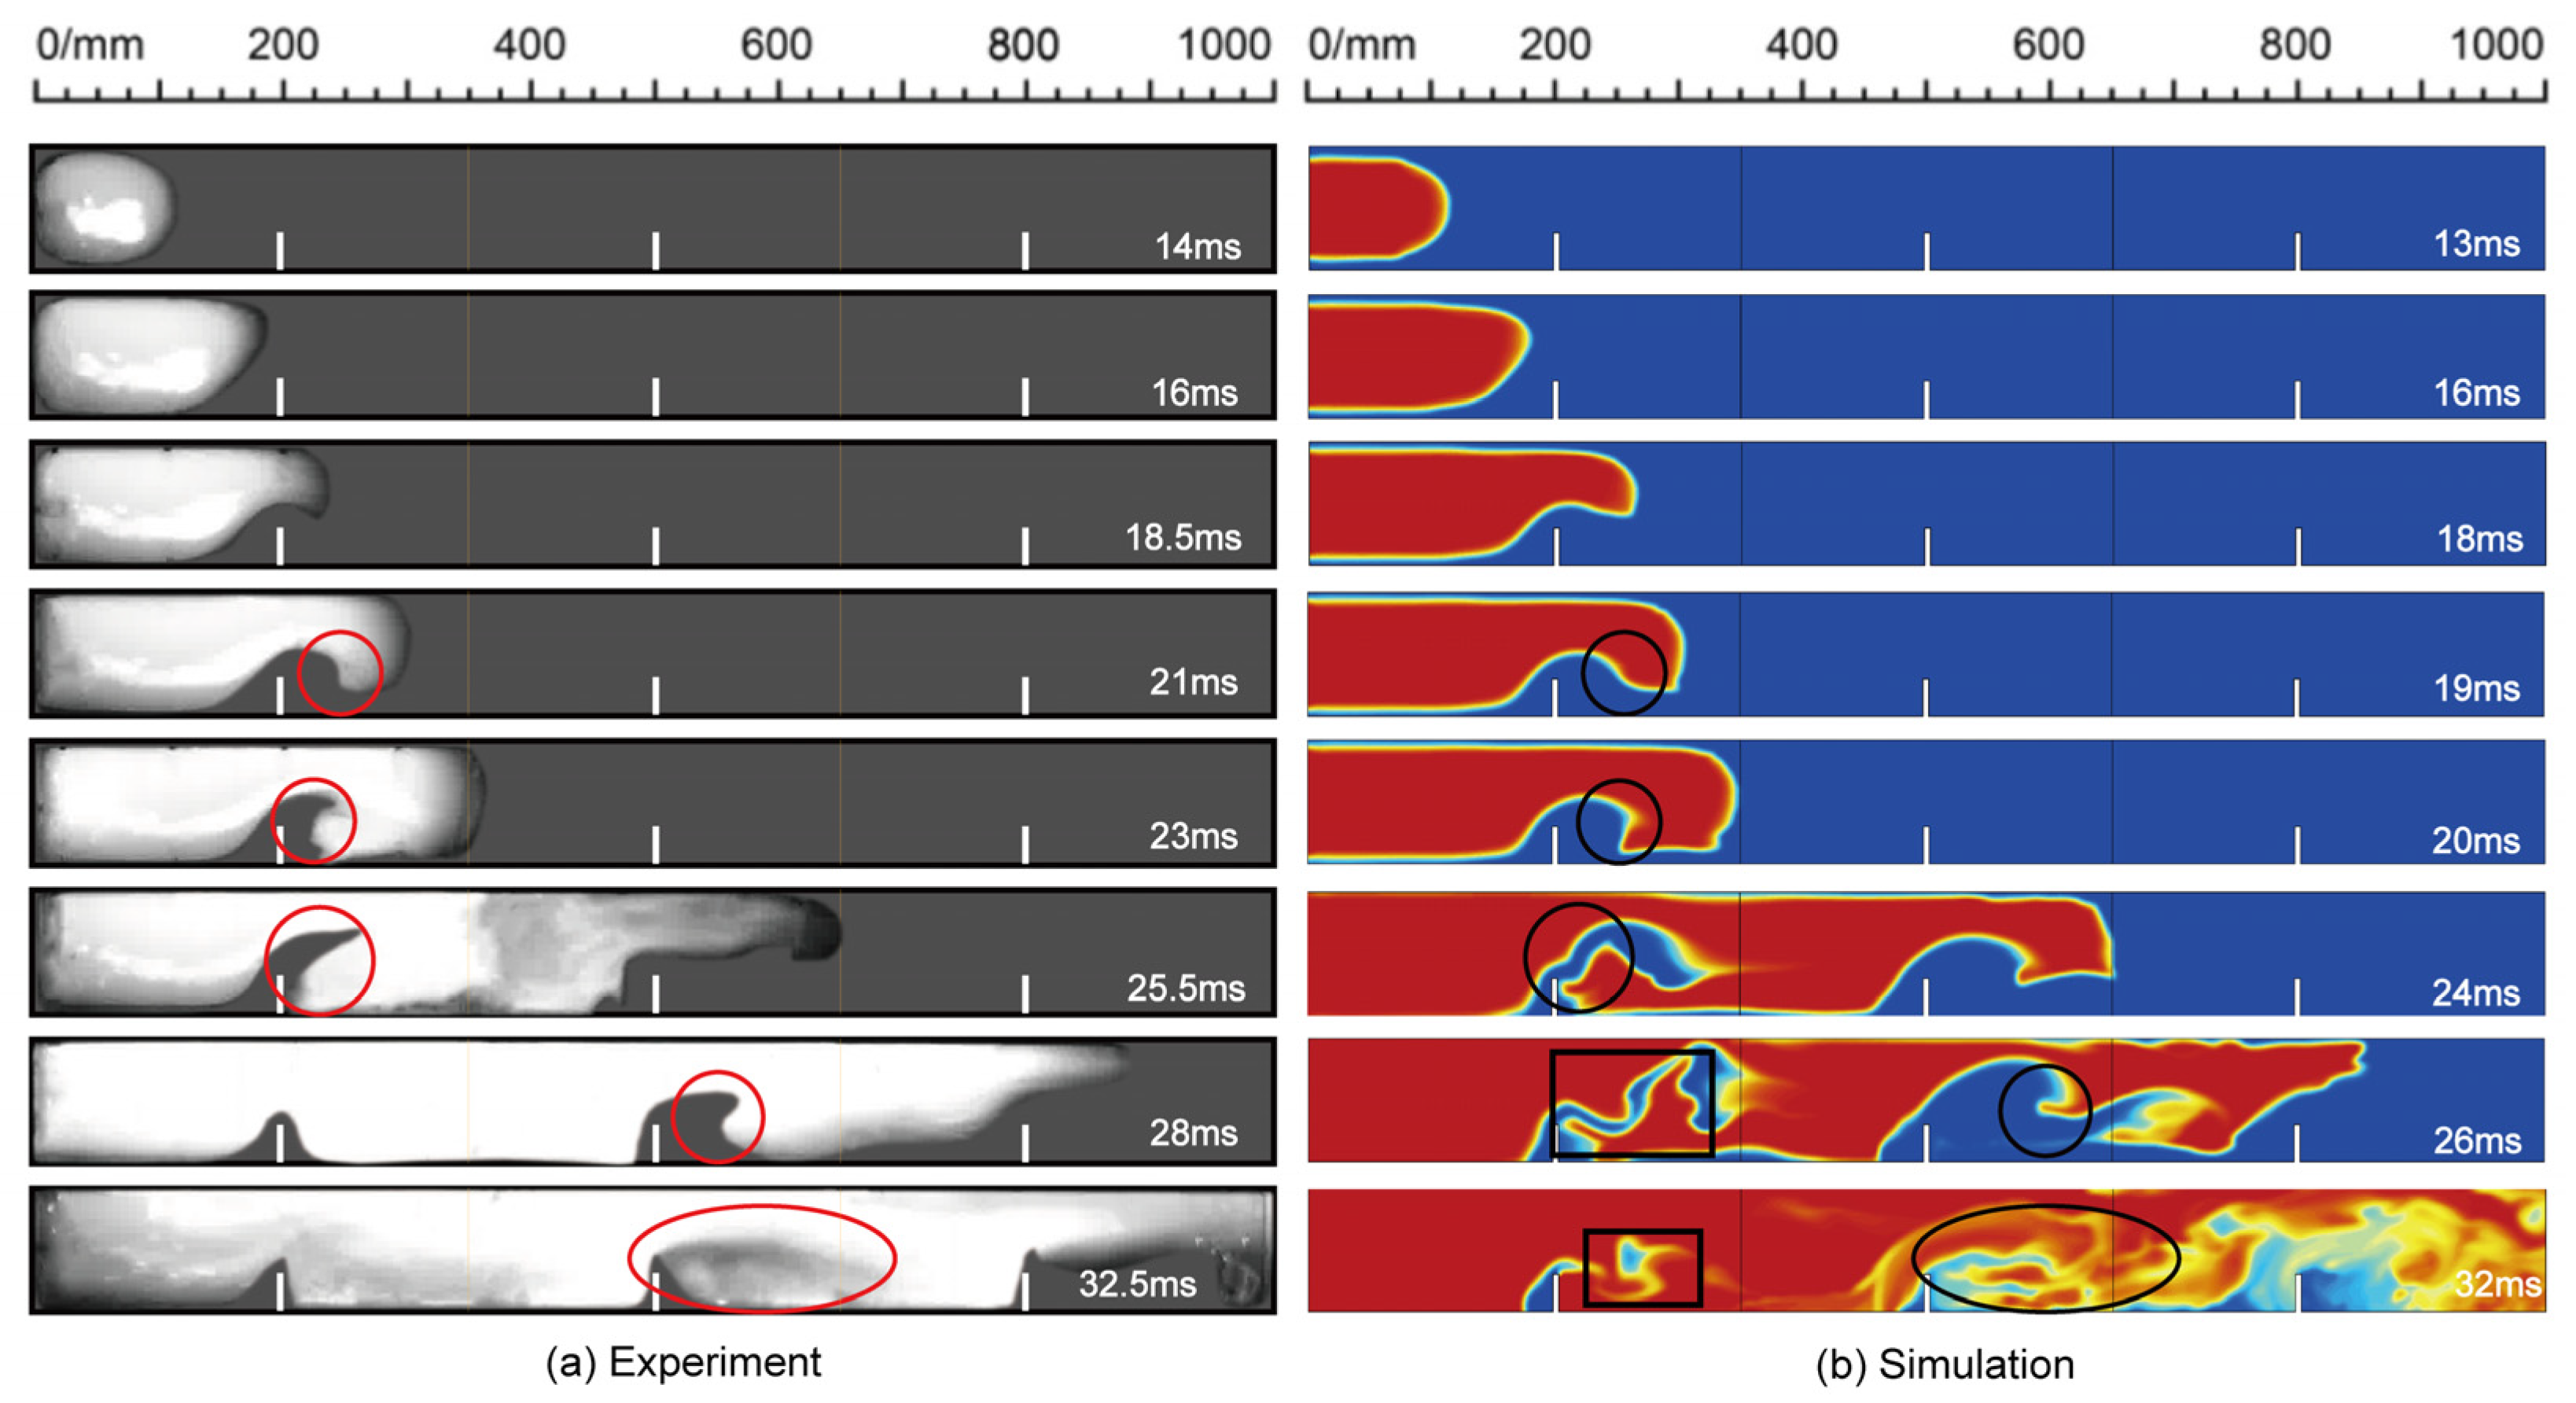
Figure 5 shows the comparison results between the experimental flame combustion process and the simulations. As can be seen in (a), in the initial stage, the front tip of the flame is very smooth and spreads to the unburned combustible gas in a relatively regular spherical flame, slowly developing into the fingertip-shaped. At 16 ms, the first flat obstacle reduces the channel area, so the front tip of the flame gradually become sharp. Then, the flame turned to the upper wall surface of the duct, this is because the pressure waves through the obstacle first; a shear flow is formed between the upper surface of the obstacle and the surface of the flame. After 21 ms, a reflux zone is formed and a clear vortex can be seen, as shown in the red marked circle in (a). The vortex increases the surface area of flame and introduces unburned gas into the area of flame. Eventually, the flame occupies the unburned area in front of the first obstacle.
Relative to the experiment, in the simulation results shown in (b), the flame structure can fit the experiment well. The same reflux structure appears in the simulation, as the black marked circle in the figure. However, there is a certain gap in the corresponding time, which may be related to the unavoidable heat dissipation during the experiment. Based on the details of the simulated flame structure, it is clear that the fold at the front of the flame is significantly enhanced due to turbulence effects and the vortex around the obstacles. Between the 24 ms and 32 ms, a large amount of unburned gas is mixed with the burned high temperature premixed gas. At the black rectangular box in (b), the area of flame is greatly increased, and various shapes of irregular flames appear, such as an S-type flame.
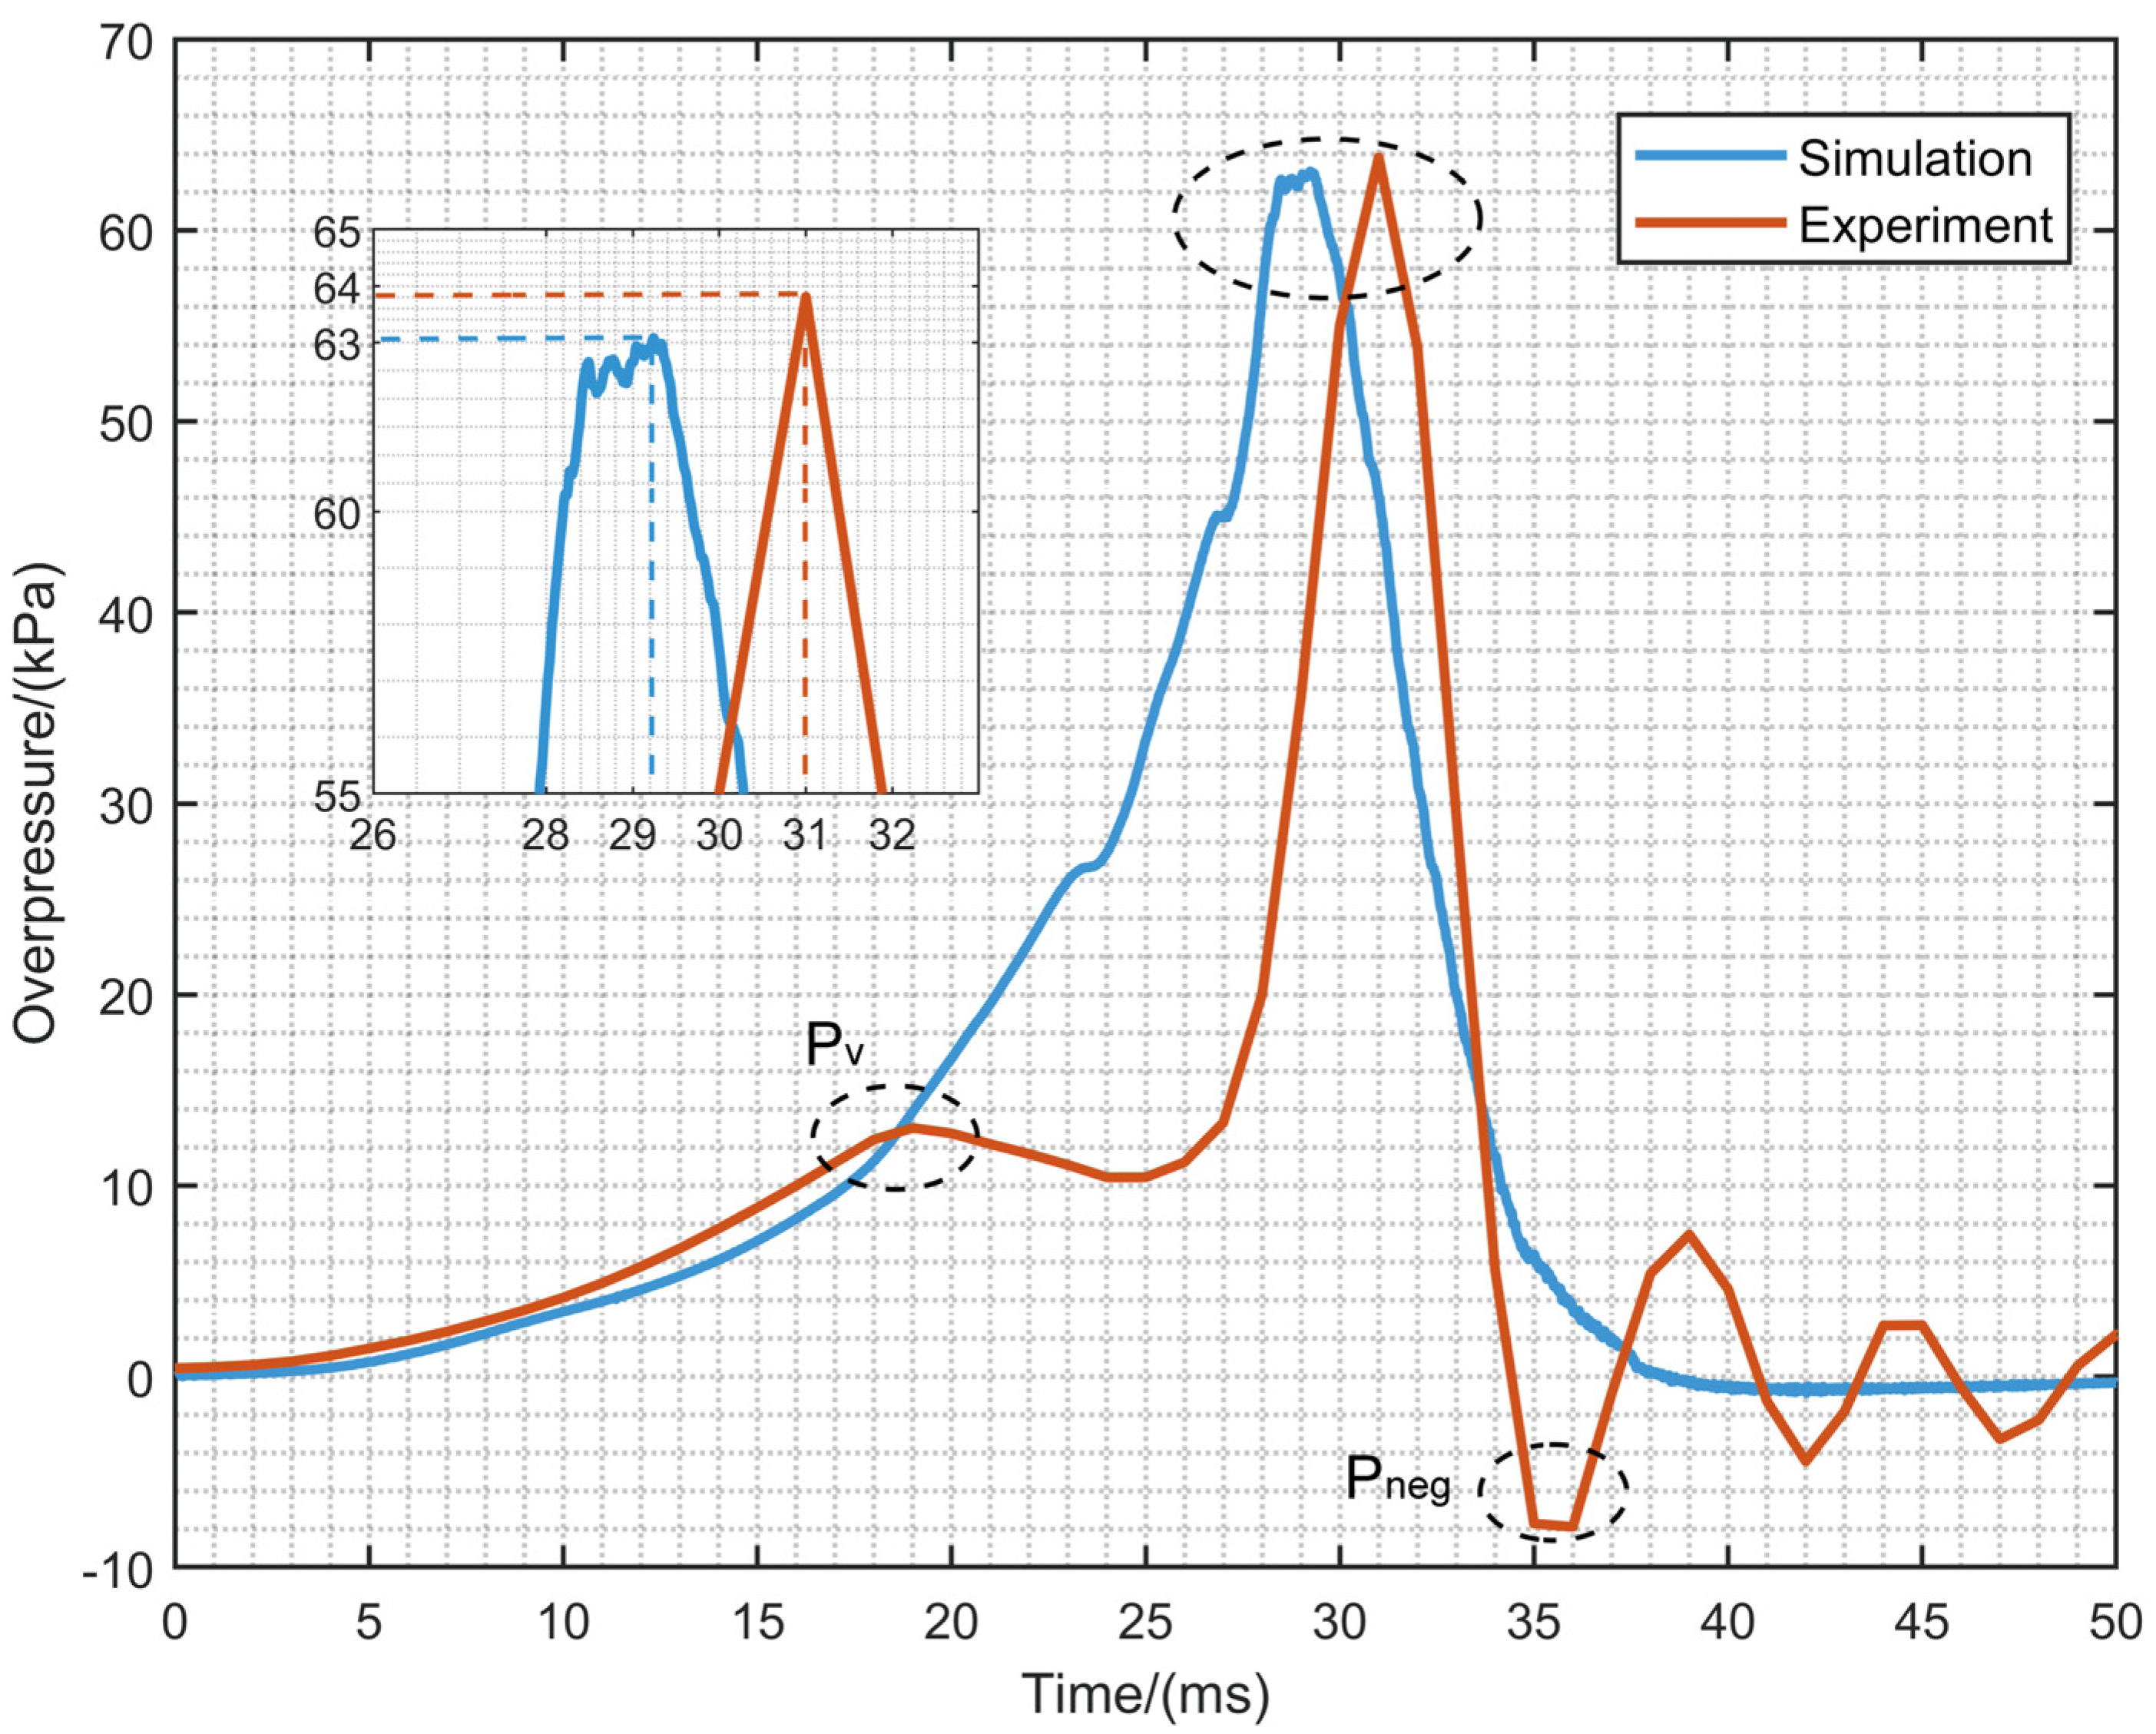
Figure 6 shows the comparison of overpressure between the experiment and simulation, at a distance of 30 mm from the ignition source. In the initial stage, the pressure profiles of both experiments and simulations change very slowly. The first peak Pv in the experimental pressure curve before the maximum overpressure is reached. This is because the PVC film installed at the outlet of the duct to prevent gas leakage during the experiment, so Pv is caused by the rupture of the PVC film. The simulation process does not utilize PVC film for sealing, so this peak does not occur. The time to reach the maximum overpressure value in the simulation is a little earlier than in the experiment, because the wall is set as adiabatic during the simulation and there is no heat exchange with the outside world. However, a certain degree of heat dissipation is inevitable during the experiment. In addition, before reaching the maximum overpressure, the simulated pressure value is larger than the experimental one.
After the flame rushes out of the duct, the experimental overpressure reaches a maximum value of 63.8 kPa. The simulated maximum overpressure value is 63.1 kPa, which is almost the same as the experiment. For the moment when the maximum overpressure is reached, the experiment is at the 31 ms, while the simulation is at the 29.2 ms. After this, the massive release of the burned and unburned gas inside the duct, the pressure inside the duct drops rapidly. Eventually, negative pressure appeared in the duct, as evidenced by the negative pressure Pneg in the figure. Afterwards, the outside air is pressed into the duct, causing the pressure to oscillate repeatedly around atmospheric pressure.
Therefore, the LES simulation in this paper is valid for the explosion simulation of LPG-air premixed combustible gas under non-uniformity.

4.2. Model with Rectangular Obstacle

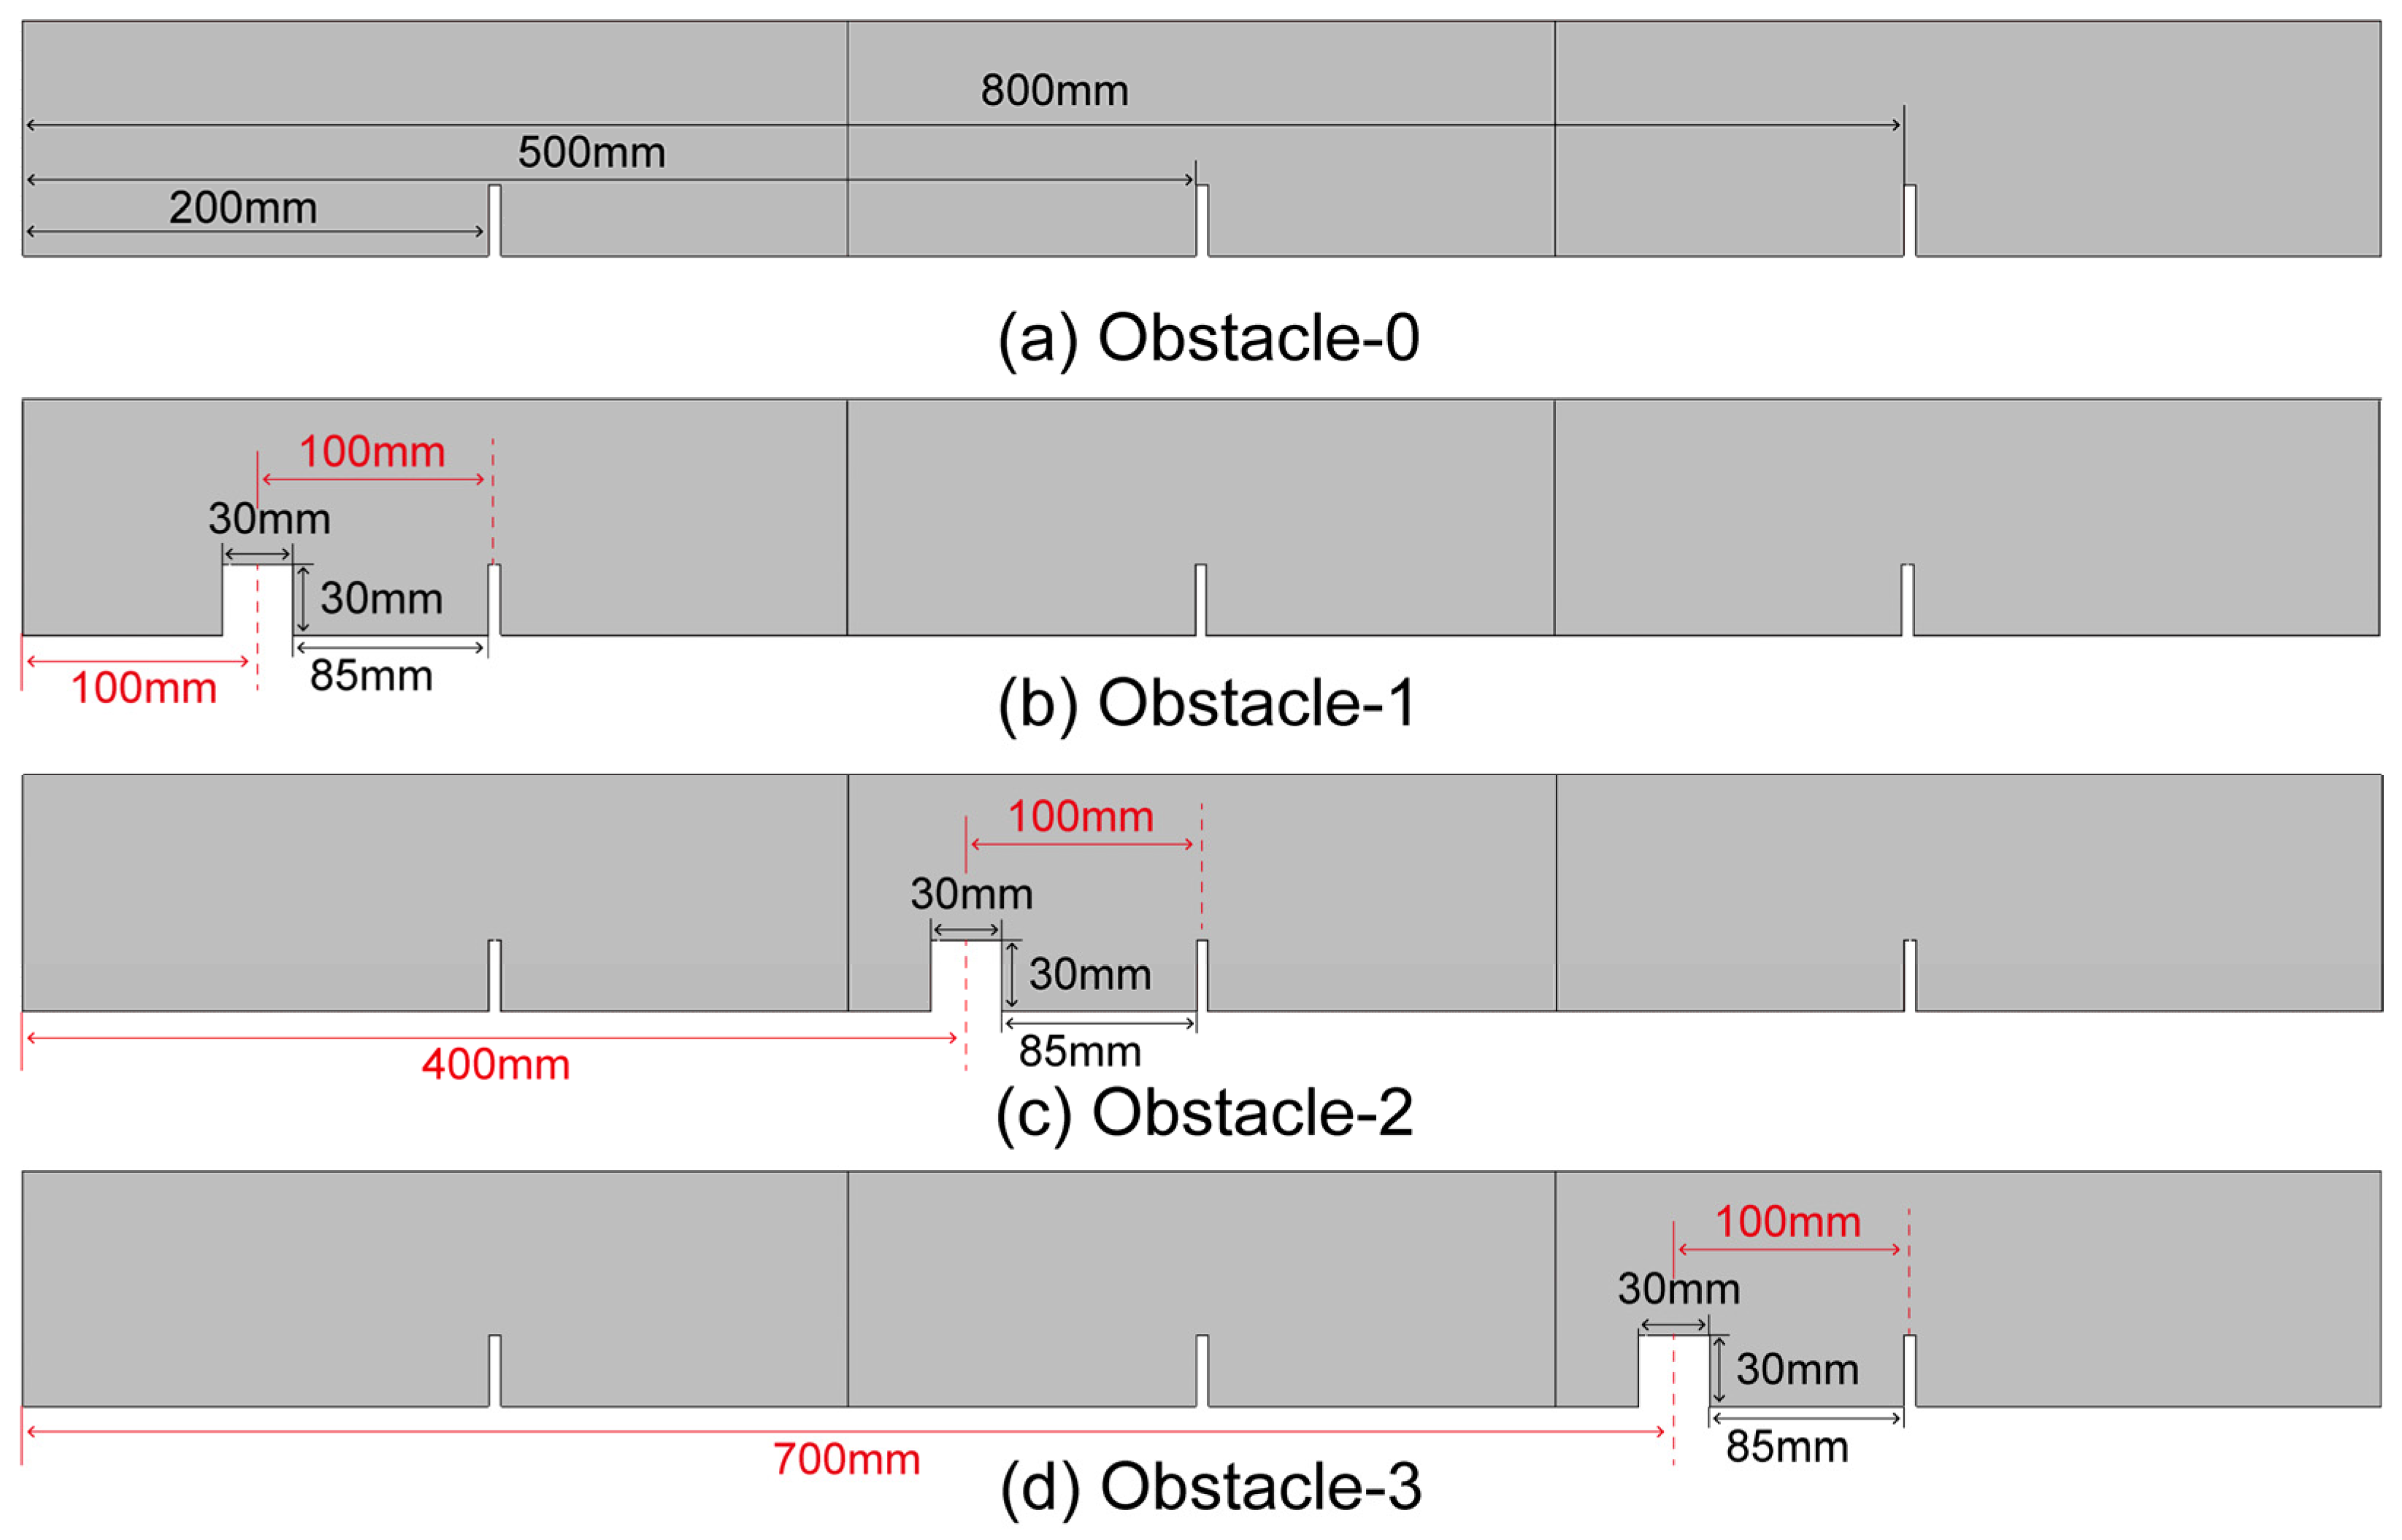
This paper focuses on the effects of mixed obstacles on the overpressure characteristics and flame behavior during the deflagration of LPG-air premixed combustible gases with concentration gradients. Figure 7 shows the duct model with mixed obstacles. With the blocking rate and number of flat obstacles unchanged, a rectangular obstacle is added. Since the total length of the pipeline is 1000 mm, the aspect ratio is 10/1 [45]. The distances between the three flat obstacles are the same. The three flat obstacles are respectively 200, 500 mm and 800 mm away from the ignition source. For Obstacle-1, a rectangular obstacle is placed in the middle of the ignition source and the first flat obstacle. In order to ensure that the distance from the rectangular obstacle to the flat obstacle in the three configurations is the same, the distance from the location of the geometric center of the rectangular obstacle to the ignition source is 100 mm, 400 mm and 700 mm. In addition, a control group without the rectangular obstacle is set up.

4.3. The Structure of Flame

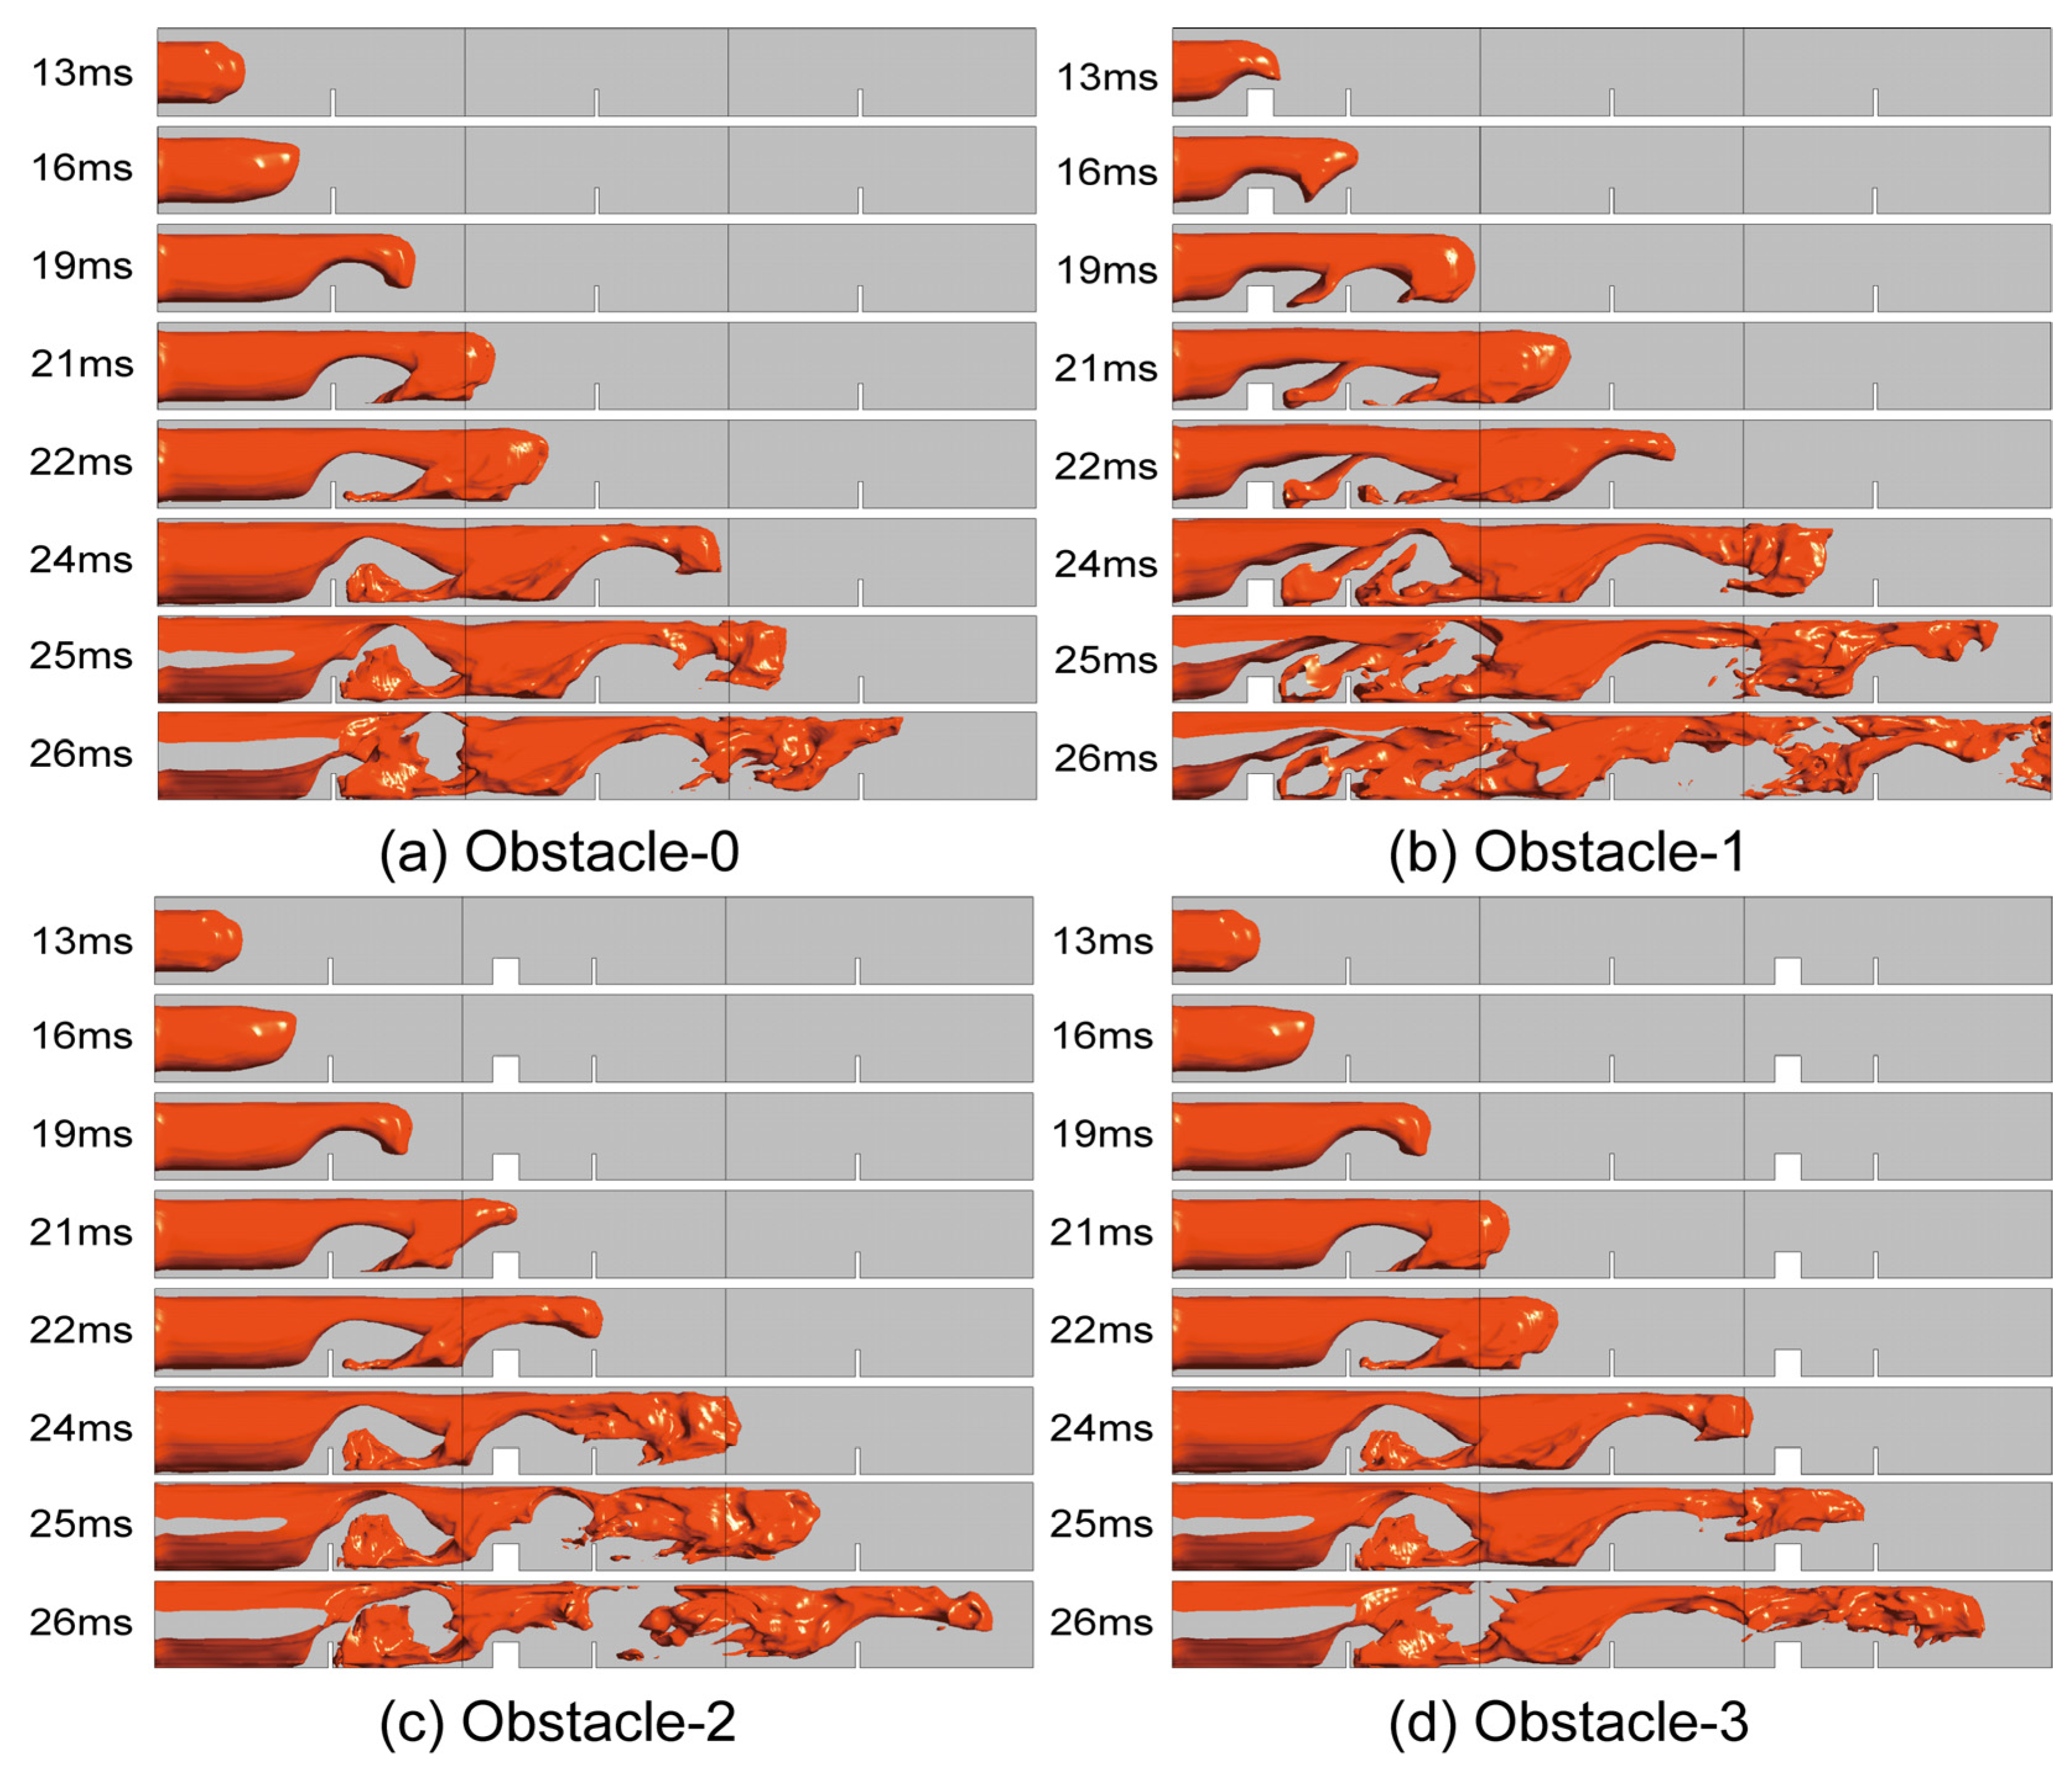
Figure 8 depicts the development of the structure of flame on the iso-surface of the reaction process variable c = 0.95. The initial flame expands spherically in all directions before contacting a rectangular obstruction. Between 13 ms and 19 ms, the development of the flame of Obstacle-2 and Obstacle-3 is the same as Obstacle-0. However, the front tip of the flame in Obstacle-1 turns sharply and passes through the passage between the obstacle and the upper side wall of the chamber. Because of the presence of the first flat obstacle, a smaller recirculation area appears behind the rectangular obstacle, and the side of the flame enters this area. The flame backflows and rolls up the surrounding gas, accelerating the burning rate of flame, which leads to a further increase in the area of flame. Between 19 ms and 24 ms, for Obstacle-2, there is no elongated flame branch between the rectangular obstacle and the second flat obstacle like in Obstacle-1. This is because the flame accelerates and passes through the second flat obstacle quickly due to the excitation of the rectangular obstacle. Although the flame in Obstacle-1 is boosted by the rectangular obstacle, the overall speed of flame propagation is still slow. There is enough time to ignite the unburned gas between the rectangular obstacle and the first flat obstacle to form a slender flame. Similarly, between 24 ms and the 26 ms, there is no flame branching between the rectangular obstacle and the third flat obstacle in Obstacle-3. In the late development of flame, Obstacle-1 shows a clear reflow structure after the rectangular obstacle. However, in Obstacle-2 and Obstacle-3, the reflux after the rectangular obstacle is not obvious, which is caused by the difference of the speed of flame propagation of the rectangular obstacle at different positions.
It can be found that the speed of flame propagation is the slowest in Obstacle-0 without a rectangular obstacle, while the speed of flame propagation in the other three configurations is faster. Especially in Obstacle-1, the flame rushed out of the duct in 26 ms. This is because the rectangular obstacles compress the flow field and greatly improve the speed of flame propagation. However, when the flame of other configurations is 26 ms, there is still a certain distance from the outlet of the duct. In addition, it can be clearly seen that the flames under the four configurations form multiple reflux zones when passing through multiple obstacles. The surface of the flame becomes more broken and turbulent. This is the result of the coupling between the high pressure areas induced by the combustion of unburned premixed gas and the vortex structure [4].
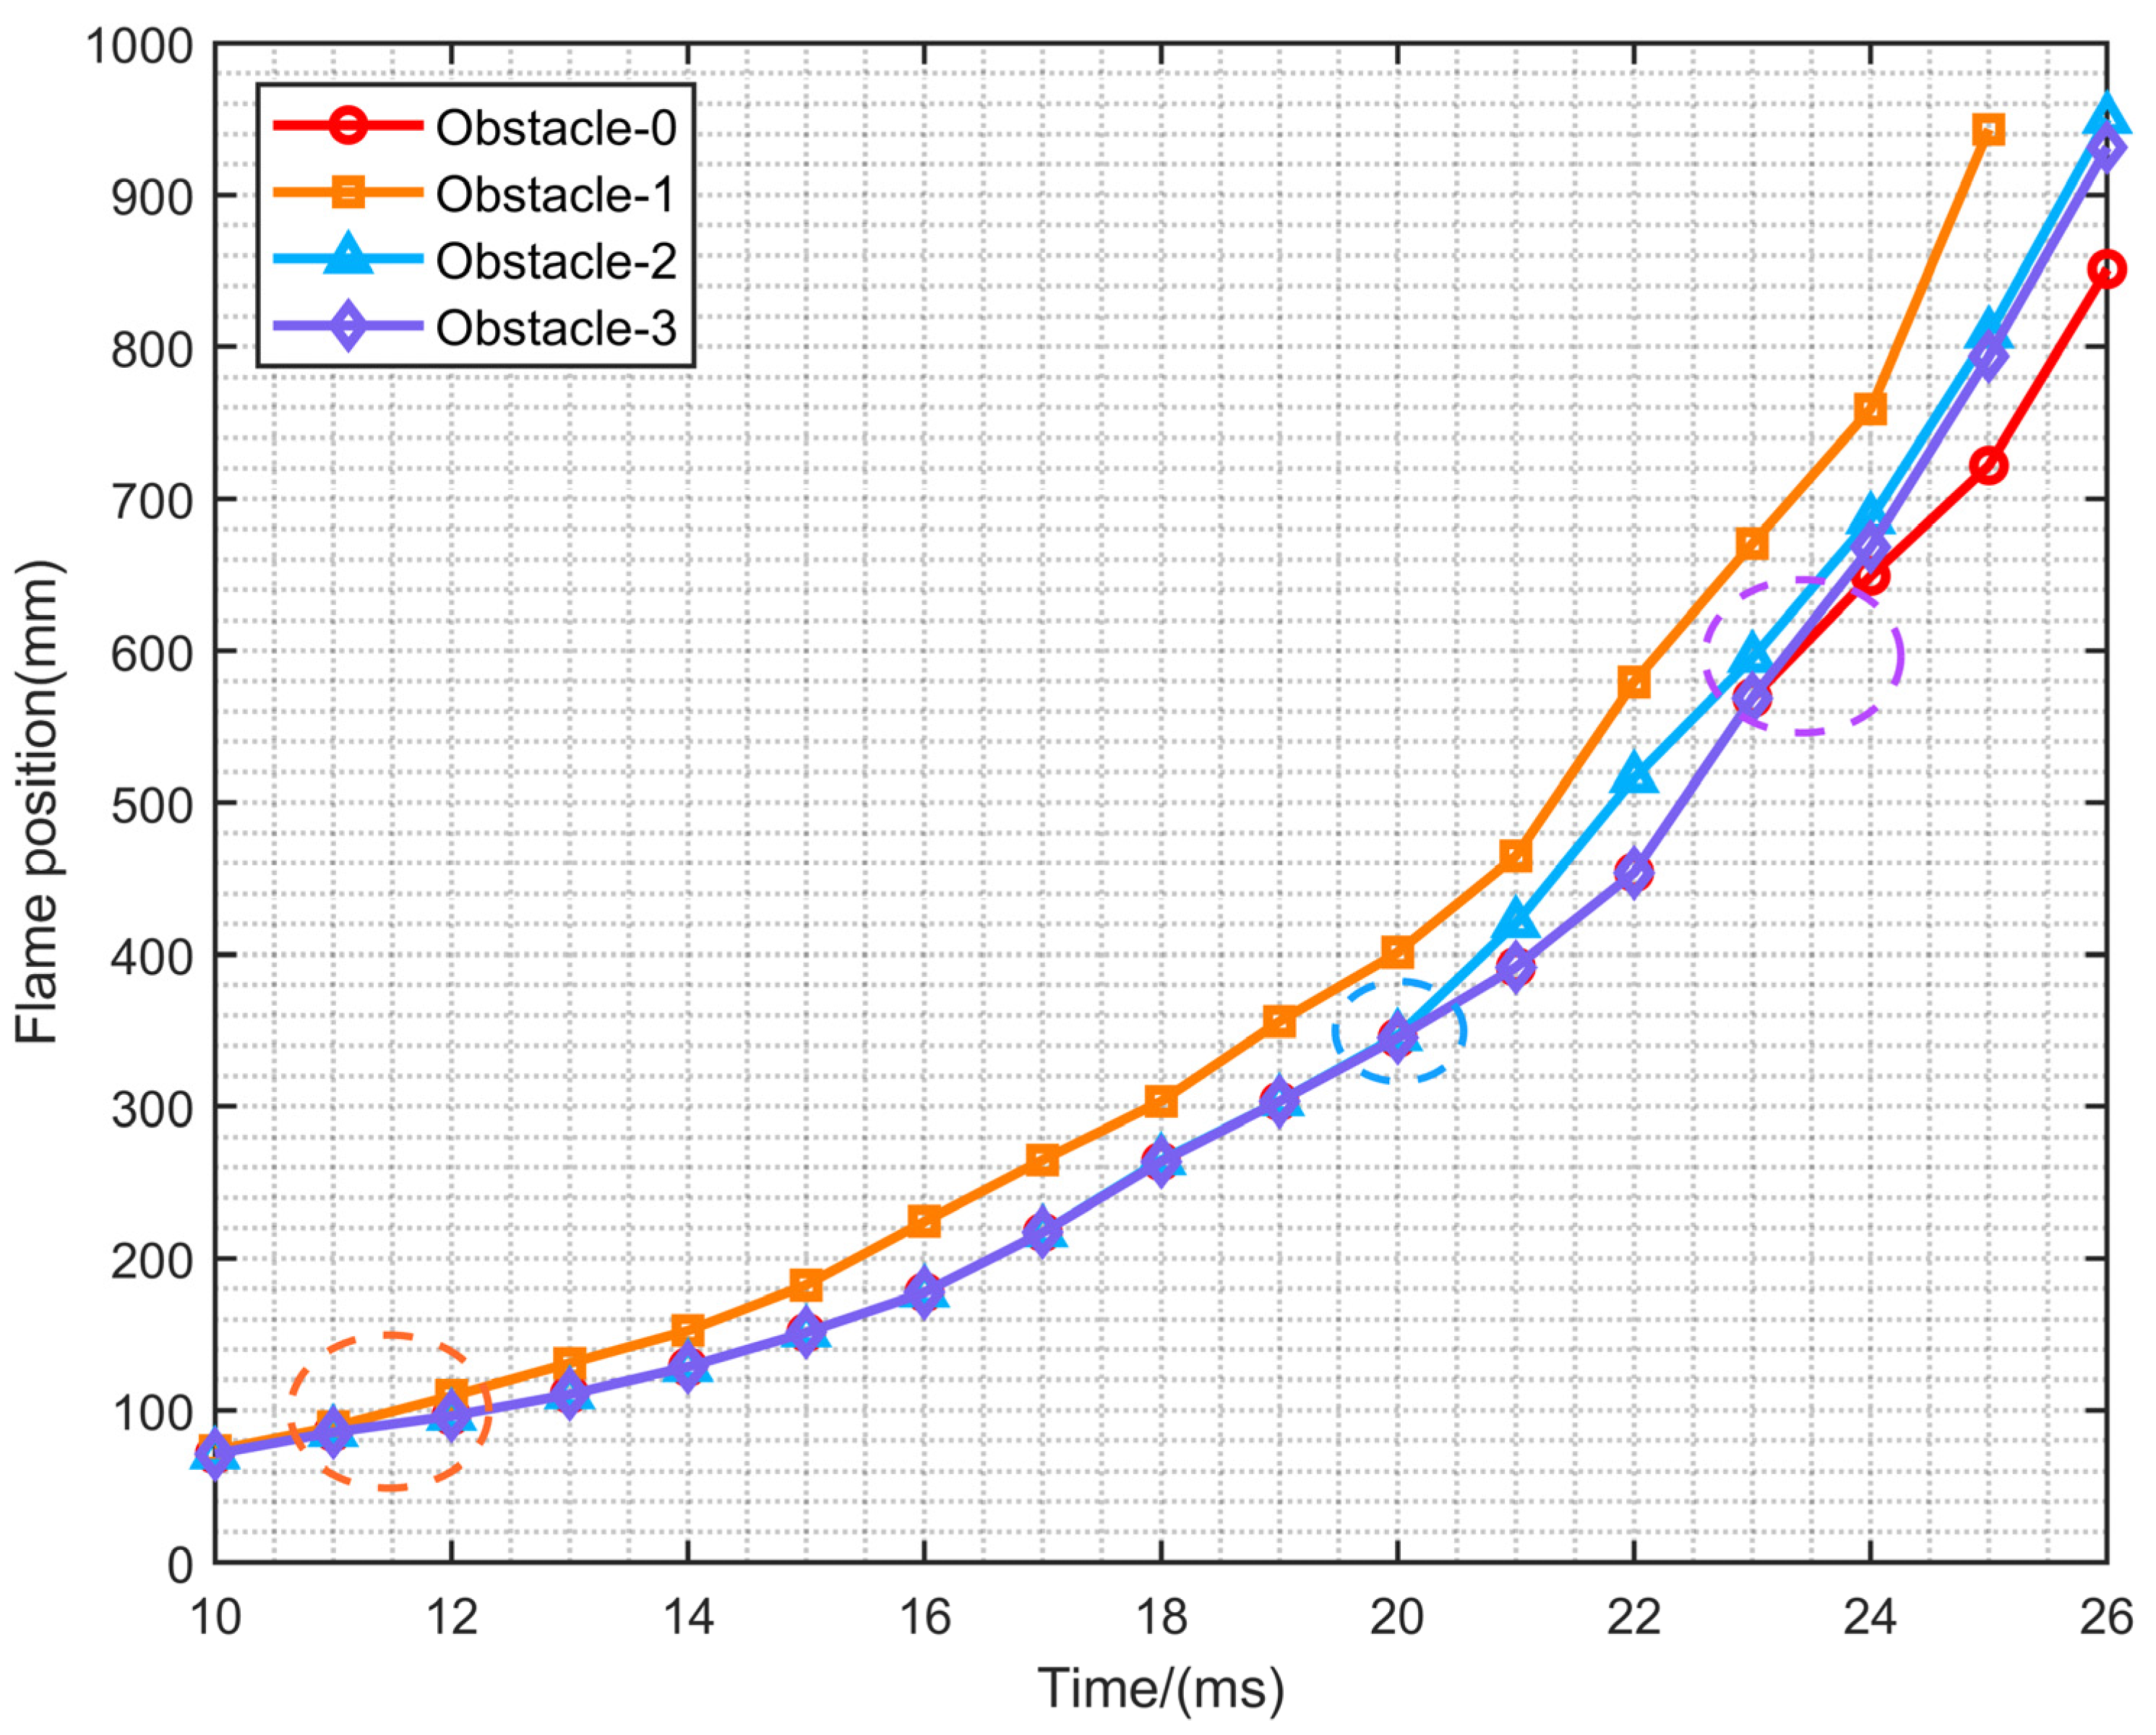
Figure 9 shows the variation of the front tip of the flame position with time for the four configurations. The time when the front tip of the flame touches the rectangular obstacle has been marked with circles in the figure. It can be seen that Obstacle-1 is the first to touch the rectangular obstacle, and the compression of the flow field by the obstacle leads to further increase of the speed of flame propagation. The front tip of the flame position has exceeded the other three models after 12 ms. At 21 ms, the flame in Obstacle-2 touches the rectangular obstacle and the speed of flame propagation starts to increase. Similarly, at around 23 ms, the flame starts to be affected by the rectangular obstacle and the flame spreads faster in Obstacle-3. After 26 ms, the front tip of the flame of Obstacle-2, Obstacle-3 and Obstacle-0 can rush out of the duct one after another. This result is consistent with the order of contact with the rectangular obstacle, which shows that the closer the rectangular obstacle is to the ignition source, the faster the speed of flame propagation rises, and the earlier the flame rushes out of the duct.

4.4. The Overpressure Dynamics

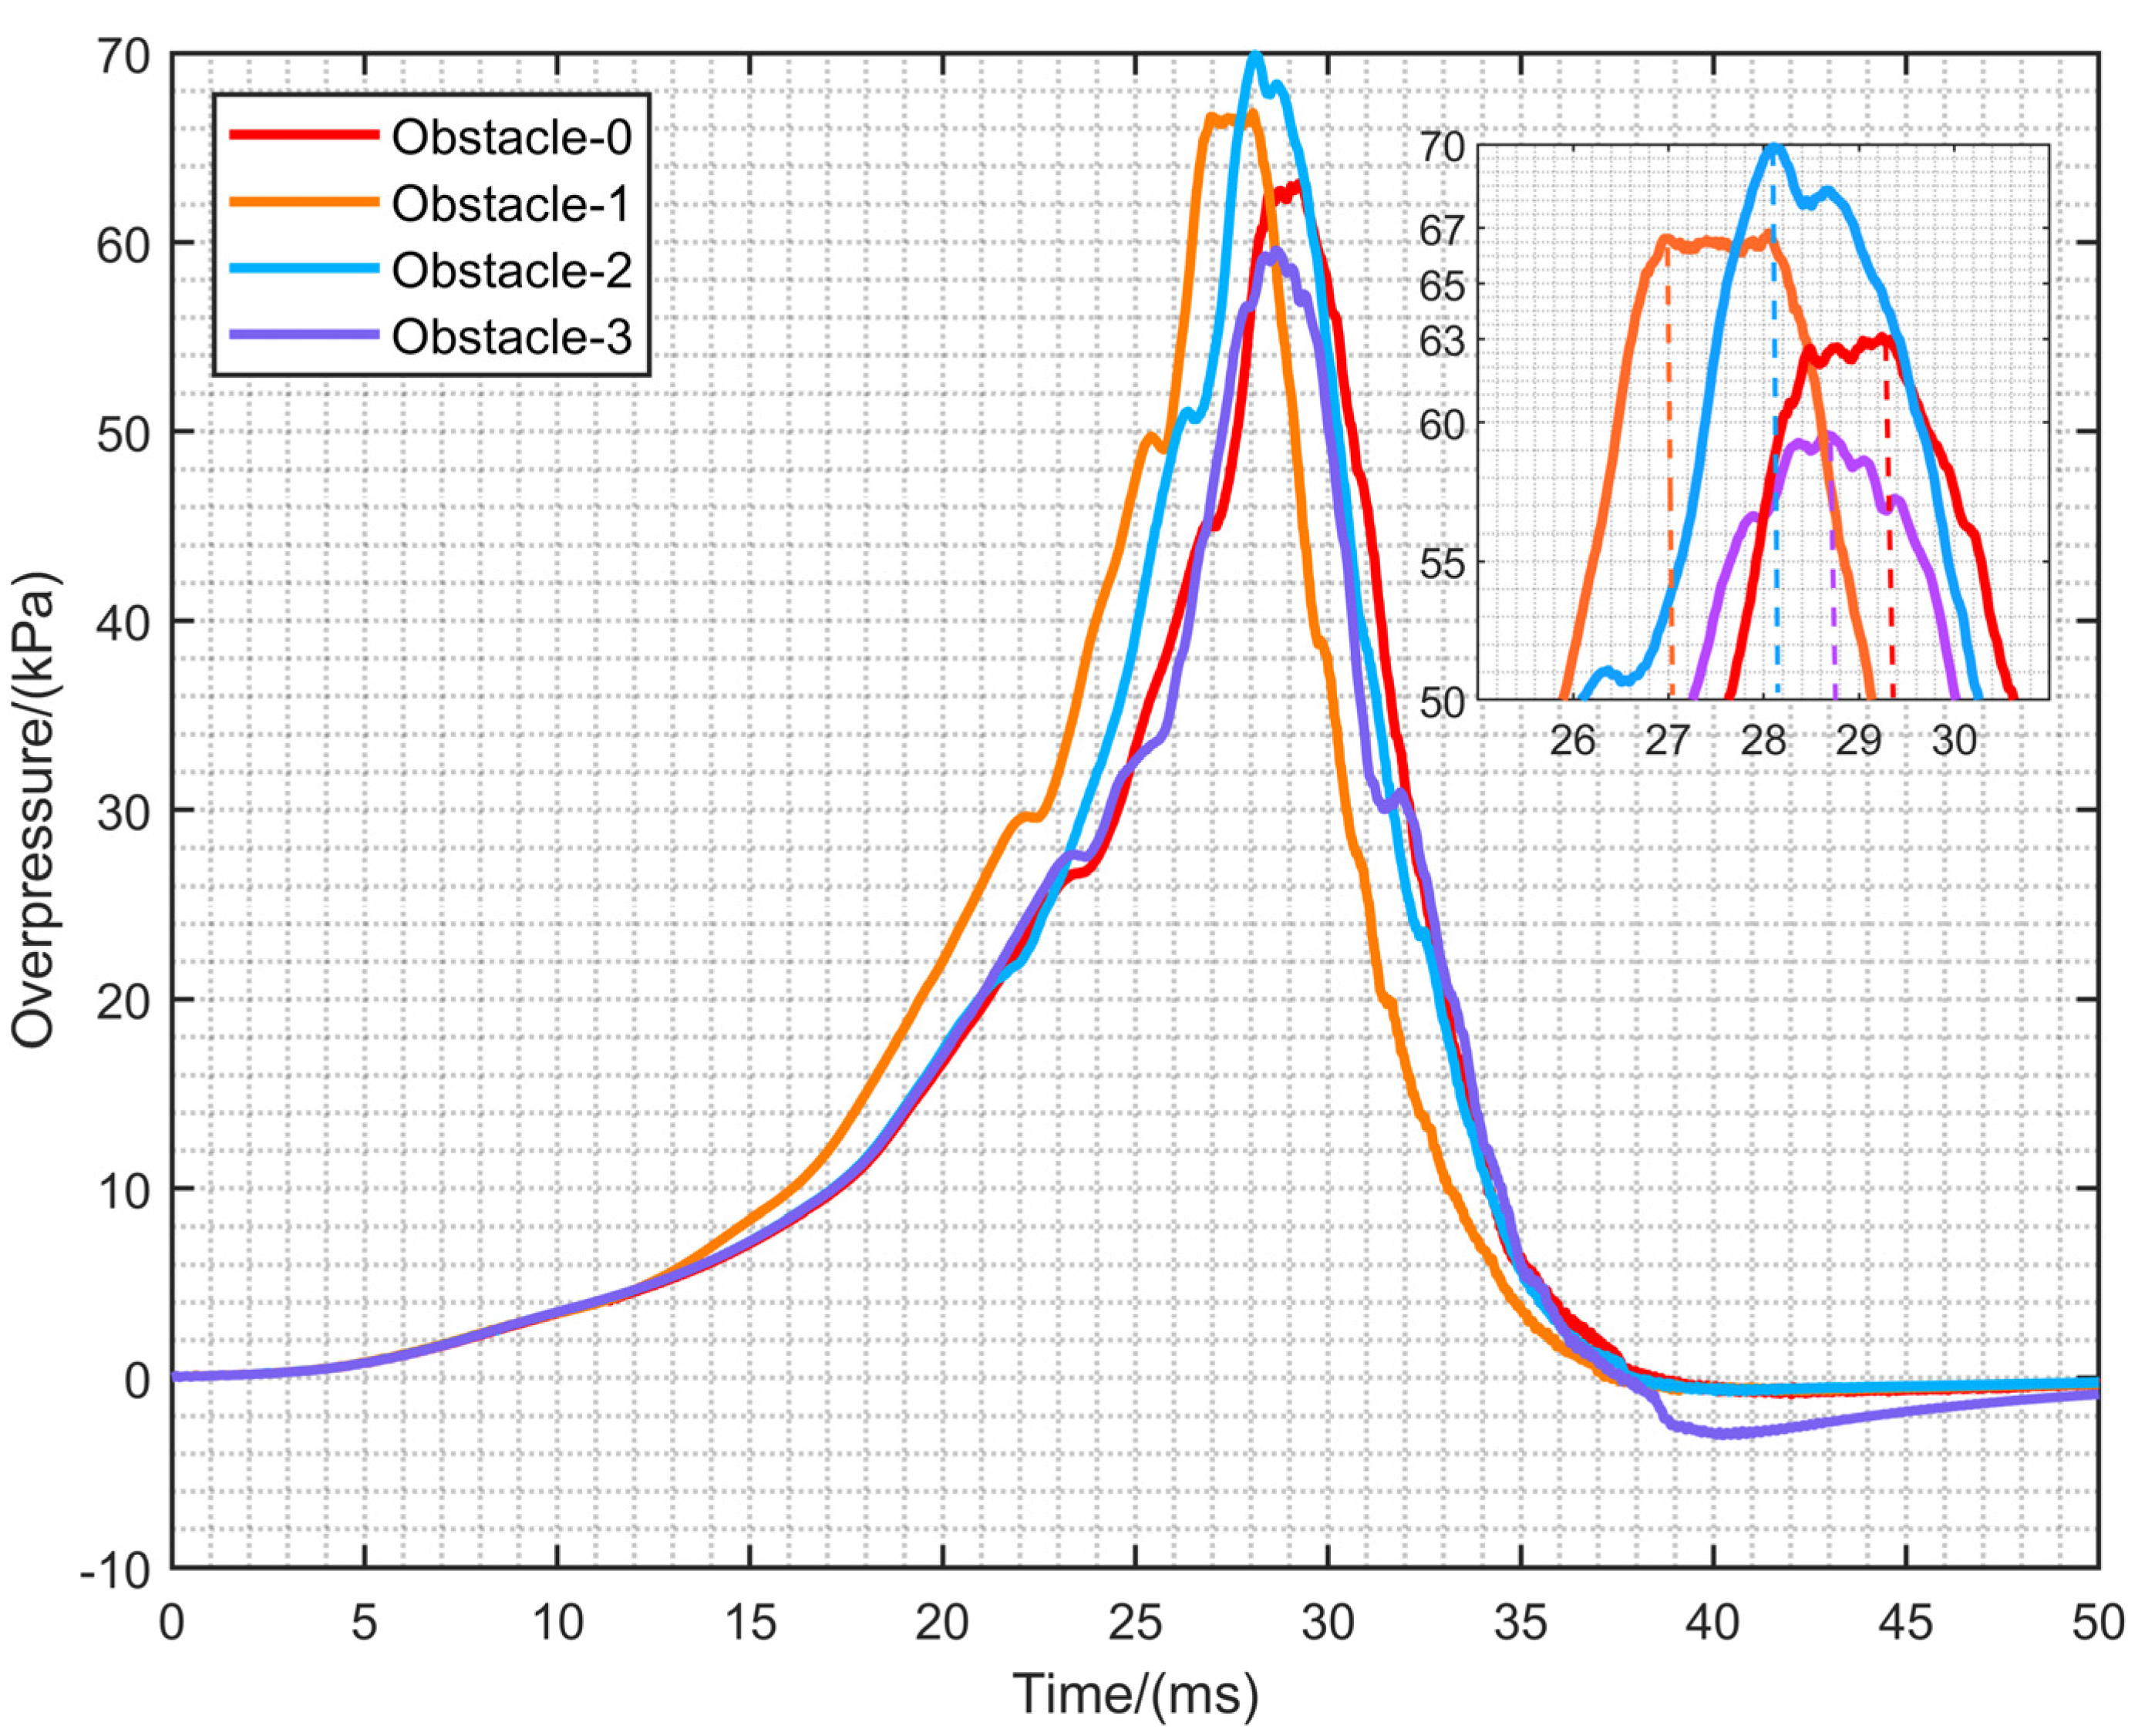
Figure 10 shows the comparison of the pressure of the rectangular obstacle at different positions during the simulation. The pressure increases slowly before the front tip of the flame touches the obstacle and the four curves almost overlap. The pressure of Obstacle-1 starts to rise sharply after 13 ms. It can be concluded from Figure 9 that this is because the flame is excited by the rectangular obstacle at this moment. In addition, the maximum overpressure value of Obstacle-2 is the highest among the four configurations, reaching 70 kPa. This is because the rectangular obstacle in Obstacle-2 is located at 400 mm and the flame is more fully developed [17] before reaching the rectangular obstacle compared to Obstacle-1. For Obstacle-3, the rectangular obstacle is closer to the outlet, and the flame rushes out of the duct after passing through the obstacle. This is detrimental to the increase in overpressure, so the maximum overpressure is lower than Obstacle-0. The maximum overpressure occurs after the flame rushes out of the duct, and it can be seen that the time to reach the maximum overpressure is about 29.2 ms, 27 ms, 28.1 ms and 28.6 ms. In four configurations, which indicates that the closer the rectangular obstruction is to the ignition source, the shorter the time required to reach the maximum overpressure. After 26 ms, the flame gradually rushes out of the duct, taking away a large number of combustion products and unburned gas. As a result, the pressure in the duct gradually decreases. Interestingly, after 30 ms, the pressure rises slightly on the way down, which is precisely because the outside air rushes into the duct and forms convection with the combustion gas in the duct. After 37 ms, the negative internal overpressure is generated. It can be clearly seen that the negative pressure of Obstacle-3 is the most obvious. This is because the rectangular obstacle is closer to the outlet of the duct and has a stimulating effect on the flame at the outlet. This allows more gas to rush out of the pipe in a short period of time, bringing a greater negative pressure. After that, due to the pressure difference, the outside air is pressed into the duct. Then, the rest of the fuel burns again, and the overpressure can rise again to a certain extent. Then, the reciprocal outflow and reverse flow of the gas mixture gradually tends to balance, and the overpressure inside the duct returns to normal atmospheric pressure finally.
Figure 11 depicts the relationship between the area of flame and the time on the iso-surface for the reaction process variable c = 0.95. After ignition, the area of flame in the duct increases slowly. The area of flames of Obstacle-1, Obstacle-2 and Obstacle-3 increased further after 12 ms, 21 ms and 23 ms, respectively. This result coincides with the time when the front tip of the flame touches the rectangular obstacle in Figure 9. After 37 ms, it can be seen that the area of flame under the four configurations has a rebound. This is due to the pressure difference causing the outside air to enter the duct, and the combustible gas is fully burned, which further increases the area of flame. Combined with Figure 10, it can be found that the variation of the area of flame with time before reaching the maximum area of flame is consistent with the variation of overpressure. Obstacle-0, Obstacle-1, Obstacle-2 and Obstacle-3 show the maximum area of flame at 29 ms, 27 ms, 28 ms and 28 ms, respectively. This result is almost the same as the time to obtain the maximum overpressure in Figure 10. This confirms that the maximum overpressure value is obtained when the area of flame is the largest. In addition, among the four configurations, Obstacle-1 has the largest peak area of flame, followed by Obstacle-2 and Obstacle-0, while Obstacle-3 is the smallest, which is also consistent with the variation of maximum overpressure. To sum up, it shows that the overpressure is closely related to the area of flame.
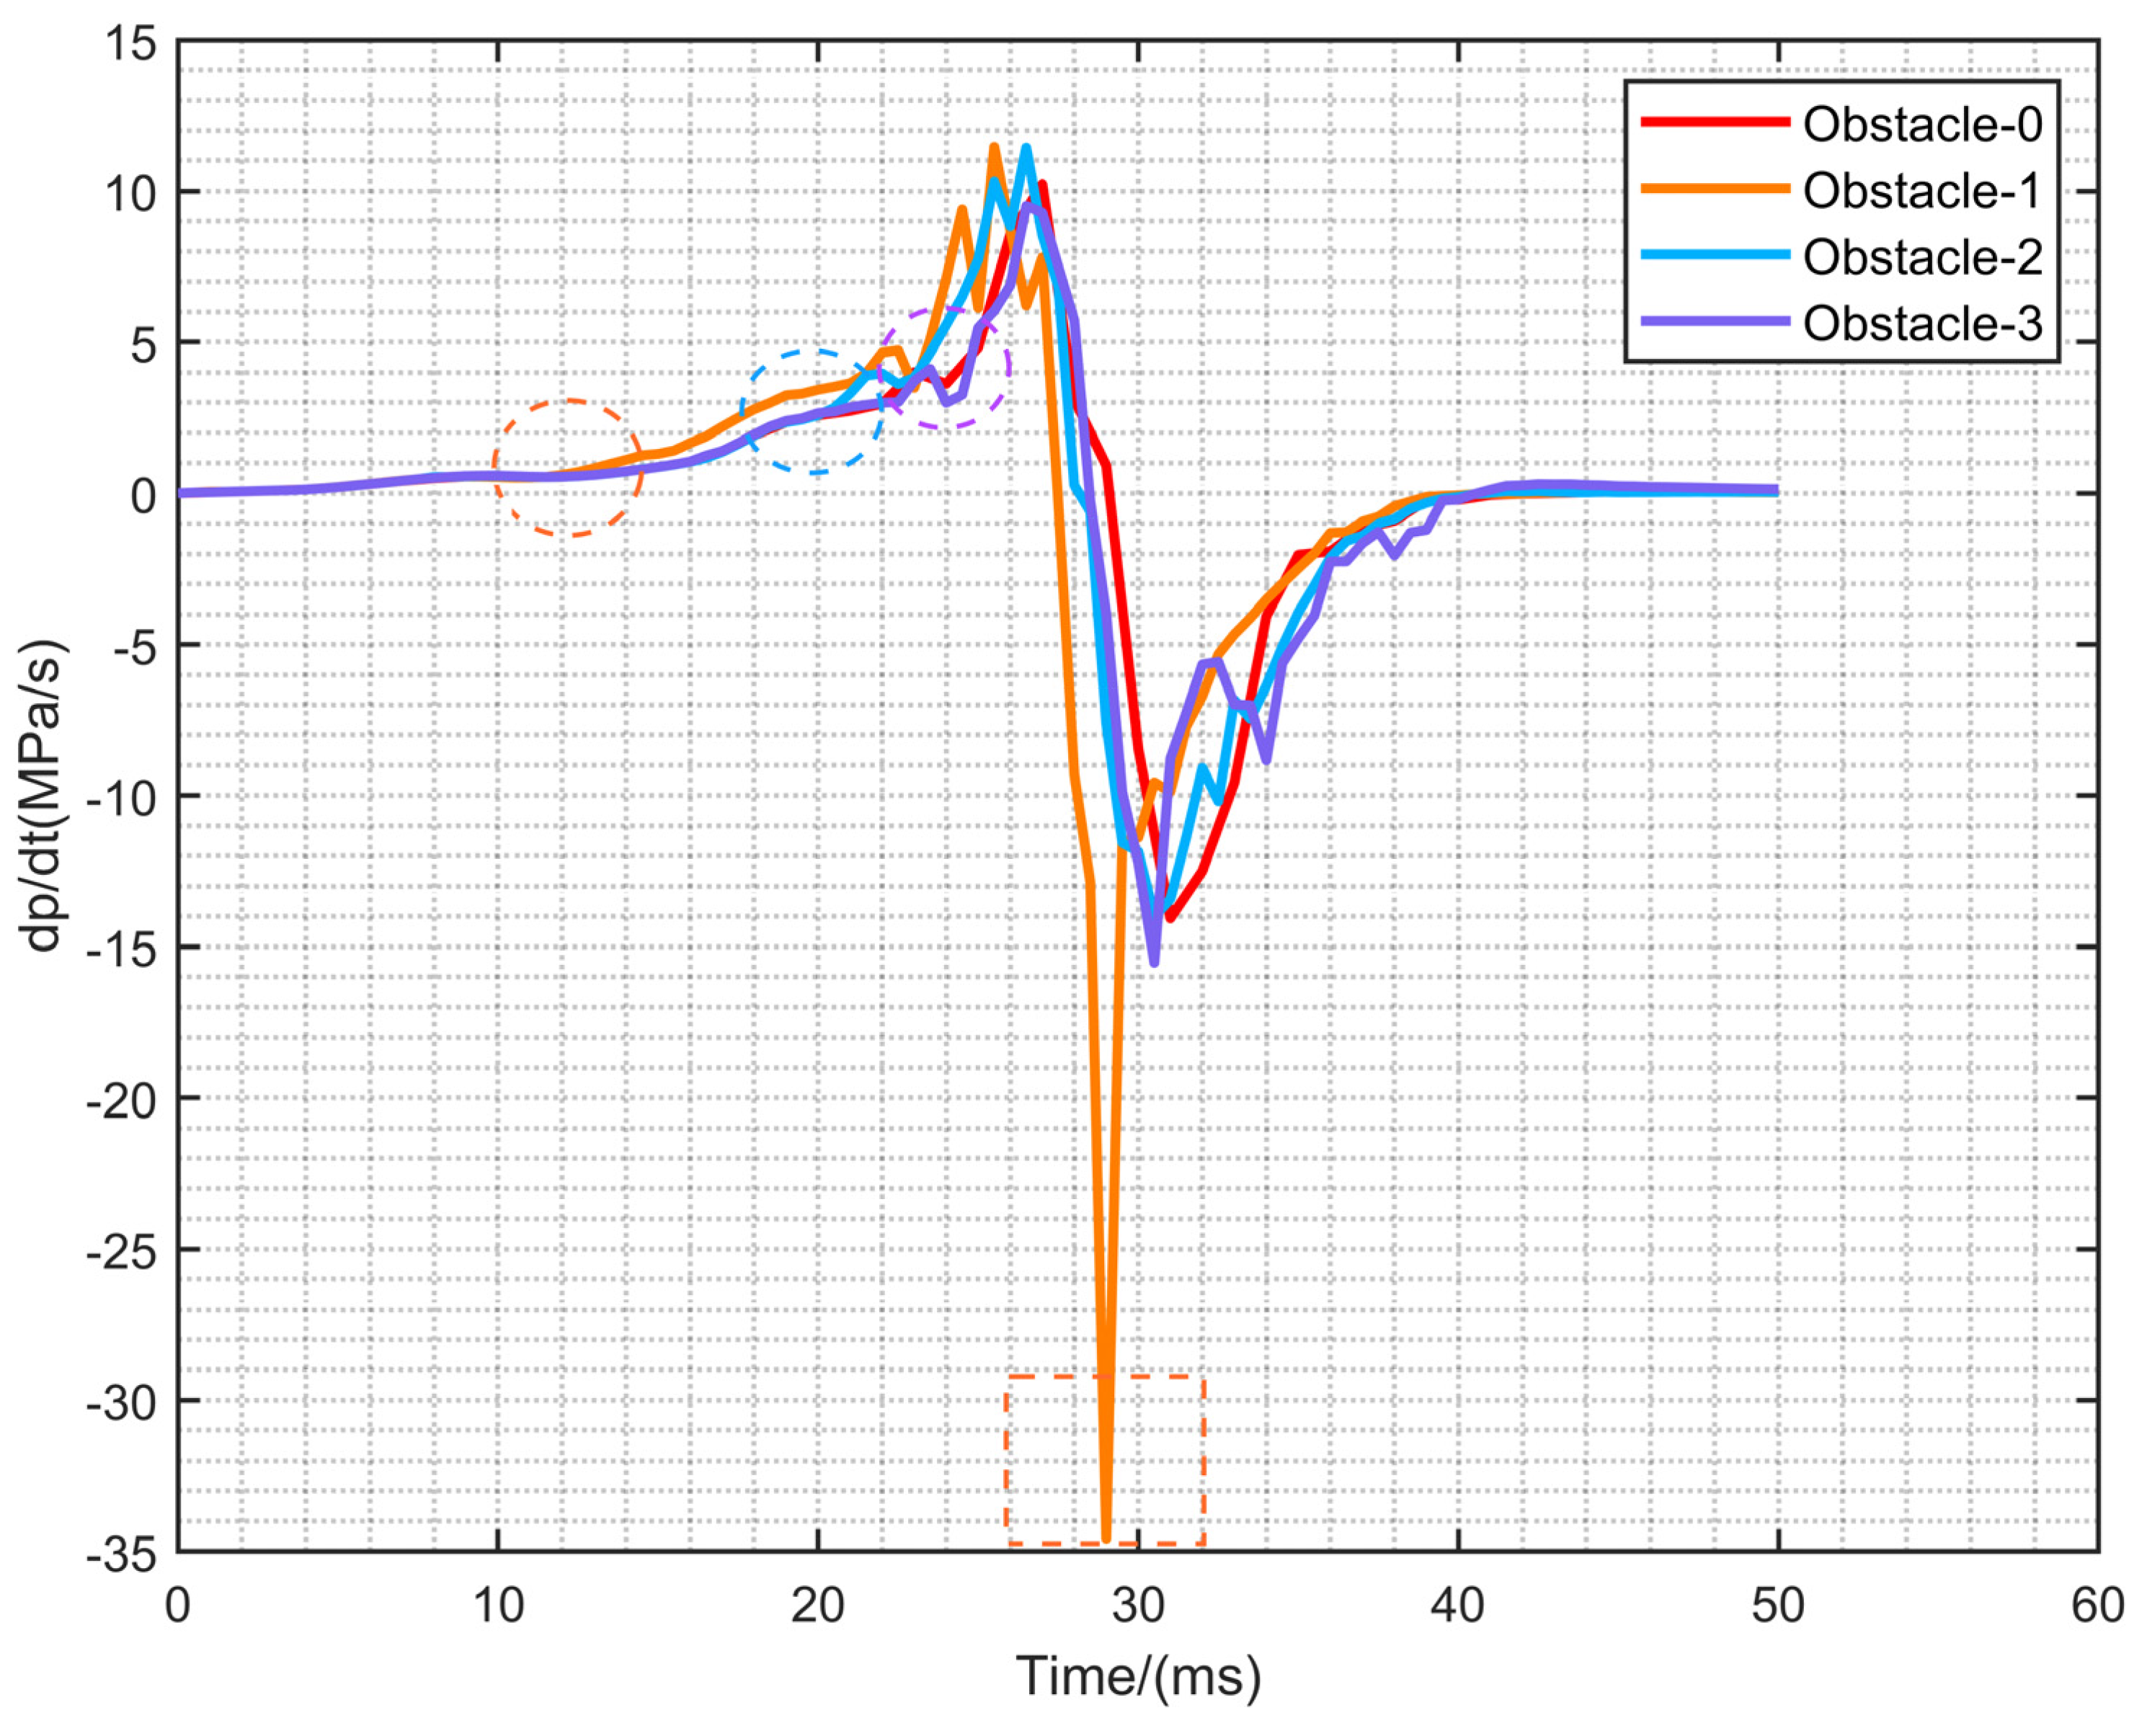
Figure 12 shows the variation curve of the average growth rate of overpressure, named dp/dt. The whole trend of the average growth rate of overpressure in four configurations is relatively similar. As marked by the circles in the figure, at the time of 12 ms, Obstacle-1 is affected by the rectangular obstacle and the average growth rate of overpressure begin to increase. However, the average growth rate of overpressure of Obstacle-2 and Obstacle-3 increased significantly at 21 ms and the 23 ms, respectively. The moment coincides with the mutation time of the front tip of the flame, overpressure and area of flame after the flame encounters the rectangular obstacle. The maximum average growth rate of overpressure occurs when the front end of the flame rushes out of the duct. Then, due to the pressure difference between inside and outside, the duct average growth rate of overpressure starts to decrease and becomes negative, as is marked by the rectangular box in the figure. When the rectangular obstacle is 100 mm away from the ignition source, the average growth rate of overpressure shows a sudden change, reaching nearly −35 MPa/s. This is because the speed of flame propagation in Obstacle-1 is much greater than the other three configurations, and it also takes away most of the gas mixture as the flame rushes out of the duct. In addition, at this time, most of the combustible gases in the duct have been burned, and the area of flame drops rapidly. These factors result in a greater pressure difference between the inside and outside of the duct, and the overpressure growth rate decreases faster.

5. Conclusions

On the basis of experimental and numerical simulations, this paper focuses on the effect of mixing obstacles on the deflagration process of LPG-air premixed combustible gas with concentration gradient. The results of the study can provide more insight into the coupling relationship among the explosion overpressure characteristics, the structure of flame and the speed of flame propagation. This further reduces the impact of oil and gas deflagration accidents caused by obstacles disturbances. This research has an important theoretical guidance for the prevention of LPG leakage and explosion accidents occurring in a narrow and long space. Based on the study, the following conclusions are obtained:
(1)
When the rectangular obstacle is 100 mm away from the ignition source, a slender flame appeared between the rectangular obstacle and the first flat obstacle, which leads to the final formation of a special reflux structure in the duct. The lateral branch of the flame between obstacles is the most unique, and appears in this configuration. The flame is the first to rush out of the duct. After that, Obstacle-2 and Obstacle-3 rush out of the duct successively. The flame of Obstacle-0 without a rectangular obstacle is the last to exit the pipe. This result is consistent with the order of contact with the rectangular obstacle.
(2)
The closer the rectangular obstruction is to the ignition source, the shorter the time required to reach the maximum overpressure. However, the maximum overpressure is obtained by rectangular obstacles in a moderate position, namely Obstacle-2. In addition, when the maximum flame area occurs, the overpressure value also reaches the maximum, and there is a close relationship between the two.
(3)
The growth rate of overpressure increases significantly after contact with the rectangular obstacle. The moment coincides with the mutation time of the front tip of the flame, overpressure and area of flame after the flame touches the rectangular obstacle. With Obstacle-1, the rectangular obstacle closest to the ignition source, the overpressure growth rate has the fastest decline, reaching −35 MPa/s, which is much less than the other three configurations.

Author Contributions

Conceptualization, B.G. and J.G.; methodology, B.G., software, X.J.; validation, B.G., formal analysis, B.G., B.H. (Bin Hao) and B.A.; writing—original draft preparation, B.G., writing—review and editing, B.G., B.H. (Bin Hao), B.A. and B.H. (Bingyuan Hong); supervision, J.G.; funding acquisition, J.G. All authors have read and agreed to the published version of the manuscript.

Funding

This research was funded by the basic public welfare research project of Zhejiang Province, grant number LGF22E040002.

Institutional Review Board Statement

Not applicable.

Informed Consent Statement

Not applicable.

Data Availability Statement

Not applicable.

Conflicts of Interest

The authors declare no conflict of interest.

References

  1. Li, G.; Hong, B.; Hu, H.; Shao, B.; Jiang, W.; Li, C.; Guo, J. Risk Management of Island Petrochemical Park: Accident Early Warning Model Based on Artificial Neural Network. Energies 2022, 15, 3278. [Google Scholar] [CrossRef]
  2. Guo, J.; Wang, J.; Zhu, B.; Hong, B.; Li, C.; He, J.; Chen, M.H. A Risk Evaluation Method of Coastal Oil Depots for Heavy Rainfall Vulnerability Assessment. Sustainability 2022, 14, 6902. [Google Scholar] [CrossRef]
  3. Biezma, M.; Andrés, M.; Agudo, D.; Briz, E. Most fatal oil & gas pipeline accidents through history: A lessons learned approach. Eng. Fail. Anal. 2020, 110, 104446. [Google Scholar] [CrossRef]
  4. Hao, B.; Gao, J.; Guo, B.; Ai, B.; Hong, B.; Jiang, X. Numerical Simulation of Premixed Methane–Air Explosion in a Closed Tube with U-Type Obstacles. Energies 2022, 15, 4909. [Google Scholar] [CrossRef]
  5. Wang, J.; Fan, Z.; Wu, Y.; Zheng, L.; Pan, R.; Wang, Y. Effect of abrupt changes in the cross-sectional area of a pipe on flame propagation characteristics of CH4/air mixtures. ACS Omega 2021, 6, 15126–15135. [Google Scholar] [CrossRef] [PubMed]
  6. Li, R.; Luo, Z.; Cheng, F.; Wang, T.; Lin, H.; Liu, H. A comparative investigation of premixed flame propagating of combustible gases-methane mixtures across an obstructed closed tube. Fuel 2020, 289, 119766. [Google Scholar] [CrossRef]
  7. Elshimy, M.; Ibrahim, S.; Malalasekera, W. Numerical studies of premixed hydrogen/air flames in a small-scale combustion chamber with varied area blockage ratio. Int. J. Hydrogen Energy 2020, 45, 14979–14990. [Google Scholar] [CrossRef]
  8. Sheng, Z.; Yang, G.; Li, S.; Shen, Q.; Sun, H.; Jiang, Z.; Liao, J.; Wang, H. Modeling of turbulent deflagration behaviors of premixed hydrogen-air in closed space with obstacles. Process Saf. Environ. Prot. 2022, 161, 506–519. [Google Scholar] [CrossRef]
  9. Luo, G.; Tu, J.-Q.; Qian, Y.-L.; Jin, K.-K.; Ye, T.-J.; Bai, Y.; Gao, S. Impacts of Rectangular Obstacle Lengths on Premixed Methane–Air Flame Propagation in a Closed Tube. Combust. Explos. Shock Waves 2022, 58, 10–21. [Google Scholar] [CrossRef]
  10. Zhang, Z.; Wang, H.; Wang, Z.; Tian, W.; Wang, Z. The effect of orifice plates with different shapes on explosion propagation of premixed methane–air in a semi-confined pipeline. J. Loss Prev. Process Ind. 2021, 71, 104498. [Google Scholar] [CrossRef]
  11. Huang, C.; Chen, X.; Liu, L.; Zhang, H.; Yuan, B.; Li, Y. The influence of opening shape of obstacles on explosion characteristics of premixed methane-air with concentration gradients. Process Saf. Environ. Prot. 2021, 150, 305–313. [Google Scholar] [CrossRef]
  12. Fang, H.; Xue, H.; Tang, W. Blast wave propagation characteristics in FPSO: Effect of cubical obstacles. Ocean Eng. 2022, 250, 111022. [Google Scholar] [CrossRef]
  13. Eduardo, F.-T.; Mario, S.-S.; Antonio, L.S.; Forman, A.W. Minimum ignition energy of methanol-air mixtures. Combust. Flame 2016, 171, 234–236. [Google Scholar]
  14. Xing, H.; Qiu, Y.; Sun, S.; Wang, M.; Li, B.; Xie, L. Experimental study of overpressure and temperature field behaviors of a methane-air mixture with different ignition positions, solid structure obstacles and initial turbulence levels. Fuel 2020, 287, 119446. [Google Scholar] [CrossRef]
  15. Zhou, N.; Mei, Y.; Li, X.; Chen, B.; Huang, W.-Q.; Zhao, H.-J.; Yuan, X.-J. Numerical simulation of the influence of vent conditions on the characteristics of hydrogen explosion in confined space. Combust. Theory Model. 2021, 26, 241–259. [Google Scholar] [CrossRef]
  16. Ahumada, C.B.; Wang, Q.; Petersen, E.L. Effects of unequal blockage ratio and obstacle spacing on wave speed and overpressure during flame propagation in stoichiometric H2/O2. Shock. Waves 2020, 30, 755–767. [Google Scholar] [CrossRef]
  17. Dai, Q.; Zhang, S.; Zhang, S.; Sun, H.; Huang, M. Large Eddy Simulation of Premixed CH4/Air Deflagration in a Duct with Obstacles at Different Heights. ACS Omega 2021, 6, 27140–27149. [Google Scholar] [CrossRef]
  18. Jia, H.; Cui, B.; Duan, Y.; Zheng, K. Study on the Influence of Vent Shape and Blockage Ratio on the Premixed Gas Explosion in the Chamber with a Small Aspect Ratio. ACS Omega 2022, 7, 22787–22796. [Google Scholar] [CrossRef]
  19. Boeck, L.; Lapointe, S.; Melguizo-Gavilanes, J.; Ciccarelli, G. Flame propagation across an obstacle: OH-PLIF and 2-D simulations with detailed chemistry. Proc. Combust. Inst. 2017, 36, 2799–2806. [Google Scholar] [CrossRef] [Green Version]
  20. Li, G.; Du, Y.; Liang, J.; Wang, S.; Wang, B.; Qi, S. Characteristics of gasoline–air mixture explosions with different obstacle configurations. J. Energy Inst. 2018, 91, 194–202. [Google Scholar] [CrossRef]
  21. Wen, X.; Ding, H.; Su, T.; Wang, F.; Deng, H.; Zheng, K. Effects of obstacle angle on methane–air deflagration characteristics in a semi-confined chamber. J. Loss Prev. Process Ind. 2017, 45, 210–216. [Google Scholar] [CrossRef]
  22. Yang, X.; Yu, M.; Zheng, K.; Luan, P.; Han, S. An experimental study on premixed syngas/air flame propagating across an obstacle in closed duct. Fuel 2020, 267, 117200. [Google Scholar] [CrossRef]
  23. Na’Inna, A.M.; Somuano, G.B.; Phylaktou, H.N.; Andrews, G.E. Flame acceleration in tube explosions with up to three flat-bar obstacles with variable obstacle separation distance. J. Loss Prev. Process Ind. 2015, 38, 119–124. [Google Scholar] [CrossRef]
  24. Palymskiy, I.B.; Fomin, P.A.; Gharehdash, S. On control of convection intensity of the reacting equilibrium gas. Comput. Therm. Sci. Int. J. 2019, 11, 297–314. [Google Scholar] [CrossRef]
  25. Heilbronn, D.; Barfuss, C.; Sattelmayer, T. Deflagration-to-detonation transition in H2-CO-Air mixtures in a partially obstructed channel. Int. J. Hydrogen Energy 2021, 46, 12372–12383. [Google Scholar] [CrossRef]
  26. Saeid, M.H.S.; Khadem, J.; Emami, S. Numerical investigation of the mechanism behind the deflagration to detonation transition in homogeneous and inhomogeneous mixtures of H2-air in an obstructed channel. Int. J. Hydrogen Energy 2021, 46, 21657–21671. [Google Scholar] [CrossRef]
  27. Rudy, W.; Teodorczyk, A. Numerical Simulations of DDT Limits in Hydrogen-Air Mixtures in Obstacle Laden Channel. Energies 2020, 14, 24. [Google Scholar] [CrossRef]
  28. Liu, D.; Liu, Z.; Xiao, H. Flame acceleration and deflagration-to-detonation transition in narrow channels filled with stoichiometric hydrogen-air mixture. Int. J. Hydrogen Energy 2022, 47, 11052–11067. [Google Scholar] [CrossRef]
  29. Xiao, H.; Oran, E.S. Flame acceleration and deflagration-to-detonation transition in hydrogen-air mixture in a channel with an array of obstacles of different shapes. Combust. Flame 2020, 220, 378–393. [Google Scholar] [CrossRef]
  30. Coates, A.M.; Mathias, D.L.; Cantwell, B.J. Numerical investigation of the effect of obstacle shape on deflagration to detonation transition in a hydrogen–air mixture. Combust. Flame 2019, 209, 278–290. [Google Scholar] [CrossRef]
  31. Leo, Y.; Zhang, B. Explosion behavior of methane-air mixtures and Rayleigh-Taylor instability in the explosion process near the flammability limits. Fuel 2022, 324, 124730. [Google Scholar] [CrossRef]
  32. Luo, Z.; Kang, X.; Wang, T.; Su, B.; Cheng, F.; Deng, J. Effects of an obstacle on the deflagration behavior of premixed liquefied petroleum gas-air mixtures in a closed duct. Energy 2021, 234, 121291. [Google Scholar] [CrossRef]
  33. Shen, X.; Zhang, C.; Xiu, G.; Zhu, H. Evolution of premixed stoichiometric hydrogen/air flame in a closed duct. Energy 2019, 176, 265–271. [Google Scholar] [CrossRef]
  34. Qin, Y.; Chen, X. Study on the dynamic process of in-duct hydrogen-air explosion flame propagation under different blocking rates. Int. J. Hydrogen Energy 2022, 47, 18857–18876. [Google Scholar] [CrossRef]
  35. Qin, Y.; Chen, X. Flame propagation of premixed hydrogen-air explosion in a closed duct with obstacles. Int. J. Hydrogen Energy 2020, 46, 2684–2701. [Google Scholar] [CrossRef]
  36. Zheng, K.; Song, C.; Yang, X.; Wu, J.; Jiang, J.; Xing, Z. Effect of obstacle location on explosion dynamics of premixed H2/CO/air mixtures in a closed duct. Fuel 2022, 324, 124703. [Google Scholar] [CrossRef]
  37. Xiao, G.; Wang, S.; Mi, H.; Khan, F. Analysis of obstacle shape on gas explosion characteristics. Process Saf. Environ. Prot. 2022, 161, 78–87. [Google Scholar] [CrossRef]
  38. Nguyen, T.; Strebinger, C.; Bogin, G.; Brune, J. A 2D CFD model investigation of the impact of obstacles and turbulence model on methane flame propagation. Process Saf. Environ. Prot. 2020, 146, 95–107. [Google Scholar] [CrossRef]
  39. Han, S.; Yu, M.; Yang, X.; Li, H.; Ma, Z. Flame propagation mode transition of premixed syngas-air mixtures in a closed duct. Fuel 2022, 318, 123649. [Google Scholar] [CrossRef]
  40. Li, Y.; Bi, M.; Li, B.; Zhou, Y.; Gao, W. Effects of hydrogen and initial pressure on flame characteristics and explosion pressure of methane/hydrogen fuels. Fuel 2018, 233, 269–282. [Google Scholar] [CrossRef]
  41. Azadboni, R.K.; Wen, J.X.; Heidari, A.; Wang, C. Numerical modeling of deflagration to detonation transition in inhomogeneous hydrogen/air mixtures. J. Loss Prev. Process Ind. 2017, 49, 722–730. [Google Scholar] [CrossRef]
  42. Gao, J.; Ai, B.; Hao, B.; Guo, B.; Hong, B.; Jiang, X. Effect of Obstacles Gradient Arrangement on Non-Uniformly Distributed LPG–Air Premixed Gas Deflagration. Energies 2022, 15, 6872. [Google Scholar] [CrossRef]
  43. Wu, Q.; Yu, M.; Zheng, K. Experimental investigation on the effect of obstacle position on the explosion behaviors of the non-uniform methane/air mixture. Fuel 2022, 320, 123989. [Google Scholar] [CrossRef]
  44. Zheng, K.; Wu, Q.; Chen, C.; Xing, Z.; Hao, Y.; Yu, M. Explosion behavior of non-uniform methane/air mixture in an obstructed duct with different blockage ratios. Energy 2022, 255, 124603. [Google Scholar] [CrossRef]
  45. Li, J.; Jiang, X.; Li, J.; YU, B.; Zhang, L.; Zhao, Y. Study on influence of length-diameter ratio on explosion characteristics and flame propagation laws of gasoline-air mixture in pipeline. J. Saf. Sci. Technol. 2020, 16, 88–94. [Google Scholar]
  46. Chen, P.; Sun, Y.; Li, Y.; Luo, G. Experimental and LES investigation of premixed methane/air flame propagating in an obstructed chamber with two slits. J. Loss Prev. Process Ind. 2017, 49, 711–721. [Google Scholar] [CrossRef]
  47. Chen, P.; Guo, S.; Li, Y.; Zhang, Y. Experimental and LES investigation of premixed methane/air flame propagating in a tube with a thin obstacle. Combust. Theory Model. 2016, 21, 274–292. [Google Scholar] [CrossRef]
  48. Zhang, Q.; Wang, Y.; Lian, Z. Explosion hazards of LPG-air mixtures in vented enclosure with obstacles. J. Hazard. Mater. 2017, 334, 59–67. [Google Scholar] [CrossRef]
  49. Chen, P.; Li, Y.; Huang, F.; Guo, S.; Liu, X. Experimental and LES investigation of premixed methane/air flame propagating in a chamber for three obstacle BR configurations. J. Loss Prev. Process Ind. 2016, 41, 48–54. [Google Scholar] [CrossRef]
  50. Gharehdash, S.; Sainsbury, B.-A.L.; Barzegar, M.; Palymskiy, I.B.; Fomin, P.A. Field Scale Modelling of Explosion-Generated Crack Densities in Granitic Rocks Using Dual-Support Smoothed Particle Hydrodynamics (DS-SPH). Rock Mech. Rock Eng. 2021, 54, 4419–4454. [Google Scholar] [CrossRef]
  51. Charlette, F.; Meneveau, C.; Veynante, D. A power-law flame wrinkling model for LES of premixed turbulent combustion Part I: Non-dynamic formulation and initial tests. Combust. Flame 2002, 131, 159–180. [Google Scholar] [CrossRef]
  52. Pan, C.; Wang, X.; Sun, H.; Zhu, X.; Zhao, J.; Fan, H.; Liu, Y. Large-eddy simulation and experimental study on effects of single-dual sparks positions on vented explosions in a channel. Fuel 2022, 322, 124282. [Google Scholar] [CrossRef]
  53. Li, G.; Du, Y.; Wang, S.; Qi, S.; Zhang, P.; Chen, W. Large eddy simulation and experimental study on vented gasoline-air mixture explosions in a semi-confined obstructed pipe. J. Hazard. Mater. 2017, 339, 131–142. [Google Scholar] [CrossRef] [PubMed]
Figure 1. Schematic diagram of the explosion duct.
Energies 15 07999 g001
Figure 2. System of experiment: I, II, III are three chambers with different concentrations, green lines are PVC film.
Energies 15 07999 g002
Figure 3. The mesh model of the experimental duct.
Energies 15 07999 g003
Figure 4. Time evolution of the flame position at varying the grid resolution.
Energies 15 07999 g004
Figure 5. The comparison of the combustion process of flames.
Energies 15 07999 g005
Figure 6. The comparison of overpressure between experiment and simulation.
Energies 15 07999 g006
Figure 7. Rectangular obstacle in different locations.
Energies 15 07999 g007
Figure 8. The 3D structure of flame propagation with c = 0.95.
Energies 15 07999 g008
Figure 9. The position of the front tip of the flame after ignition: the parts of the dashed circle are the time when the flame is affected by the rectangular obstacle.
Energies 15 07999 g009
Figure 10. The comparison of overpressure in four configurations.
Energies 15 07999 g010
Figure 11. Results of the area of flame through simulation when c = 0.95.
Energies 15 07999 g011
Figure 12. Simulation results of the average growth rate of overpressure for four configurations: the circled parts are the time when the overpressure is affected by the rectangular obstacle.
Energies 15 07999 g012
Table 1. Detailed computational conditions of propane.
Propane Concentration (%)Heat of Combustion (J/kg)Laminar Flame Speed (m/s)Unburnt Fuel Mass Fraction
4.80 6.0485 × 1070.370.0845
4.035.0375 × 1070.380.0602
3.844.7884 × 1070.360.0547
Table 2. Boundary and initial conditions.
BoundaryAcoustic Wave ModelShear ConditionThermalSpecies
Pressure-OutletNon-Reflection/300 K0
Wall/No-Slip0 W/m2/
Publisher’s Note: MDPI stays neutral with regard to jurisdictional claims in published maps and institutional affiliations.