Article

A Case Study of Field Thermal Response Test and Laboratory Test Based on Distributed Optical Fiber Temperature Sensor

1
College of Construction Engineering, Jilin University, Changchun 130026, China
2
Engineering Research Center of Geothermal Resources Development Technology and Equipment, Ministry of Education, Jilin University, Changchun 130026, China
3
Key Lab of Groundwater Resource and Environment, Ministry of Education, Jilin University, Changchun 130021, China
4
State Key Laboratory for Geomechanics and Deep Underground Engineering, China University of Mining and Technology, Xuzhou 221116, China
*
Author to whom correspondence should be addressed.
Energies 2022, 15(21), 8101; https://doi.org/10.3390/en15218101
Submission received: 26 September 2022 / Revised: 25 October 2022 / Accepted: 28 October 2022 / Published: 31 October 2022
(This article belongs to the Section H2: Geothermal)

Abstract

:
To design an efficient ground source heat pump (GSHP) system, it is important to accurately measure the thermophysical parameters of the geotechnical layer. In the current study, a borehole is tested in detail using a combined thermal response test system (CTRTS) based on a distributed optical fiber temperature sensor (DOFTS) and a laboratory test. Real-time monitoring of the stratum temperature according to depth and operation time and the geothermal profile and thermal conductivity of each stratum are obtained. The results show that the undisturbed ground temperature is 10.0 °C, and the formation temperature field within 130 m can be divided into variable temperature formation, constant temperature formation (9.13 °C), and warming formation (geothermal gradient is 3.0 °C/100 m). The comprehensive thermal conductivity of the region is 1.862 W/m·K. From top to bottom, the average thermal conductivity of silty clay, mudstone, argillaceous siltstone, and mudstone is 1.631 W/m·K, 1.888 W/m·K, 1.862 W/m·K, and 2.144 W/m·K, respectively. By comparing the measurement results, the accuracy and effectiveness of the CTRTS are verified. Therefore, it is recommended to use the thermal conductivity obtained by the CTRTS to optimize the design of the borehole heat exchanger (BHE). This study provides a case for establishing a standard distributed thermal response test (DTRT).

1. Introduction

Building heating and air conditioning lead to energy consumption and environmental pollution, which has aroused global concern. The use of clean and renewable energy can solve this problem [1]. The development and utilization of geothermal resources stored underground are not affected by climate. Therefore, geothermal resources have great potential and advantages in clean and efficient energy applications, especially for heating [2]. Depending on the temperature, geothermal resources can be divided into low-temperature (≤90 °C), medium-temperature (90–150 °C), and high-temperature (≥150 °C) sources, which occur in the shallow, middle, and deep layers of the Earth, respectively [3]. Shallow geothermal energy is renewable and clean energy stored within 0–200 m underground, which has the advantages of small environmental impact, good stability, large reserves, and wide distribution [4,5].
Ground source heat pumps (GSHPs) use the shallow geothermal energy of the Earth’s surface as a cold or heat source, through energy exchange, to heat or cool buildings. They have been recognized as having economic and environmental benefits [6]. A GSHP heating and air conditioning system is mainly composed of three parts: a ground source heat pump machine room system, an outdoor ground source heat exchange system, and an indoor heating or cooling system. The outdoor ground source heat exchange system is mainly composed of a ground heat exchanger (GHE), which exchanges heat with the ground to extract or discharge heat [7]. A borehole heat exchanger (BHE), which consists of a vertical borehole in which one or two U-Tubes are connected to a heat pump and circulate water or a water-antifreeze combination as the heat exchange medium, is the most commonly utilized type of GHE [8]. In addition to the traditional U-Tube BHE, the coaxial borehole heat exchanger (CBHE) has also been used in engineering in recent years [9]. The CBHE is composed of a concentric inner tube and an outer tube. Cold and hot fluids flow in the annulus of the inner tube and outer tube, respectively, and conduct heat transfer at the same time [10]. BHEs not only directly affect the operational performance of GSHPs, but together with drilling, they take up the majority of the initial investment [11]. Overengineered systems result in high initial costs, while under-engineered systems require additional heat sources, and incorrect designs can also create systemic doubts and hinder the growth of the ground source heat pump system market [12]. Because of this, designing the size of the BHE is the primary task in building a ground source heat pump system. It determines not only the system load but also the system’s initial cost; a 10% variation in ground thermal conductivity results in a variation of 4.5–5.8% in BHE design length [13,14]. BHE design is based on the thermal properties of the ground. To effectively use geothermal energy in green buildings, the reliable testing of soil thermal parameters, such as thermal conductivity and undisturbed ground temperature, is required [15,16].
At present, the methods used to obtain the ground thermal properties mainly include laboratory tests (LTs) and thermal response tests (TRTs). Laboratory tests are tests of rock and soil samples taken from field formations to obtain thermal conductivity using steady-state or unsteady heat flow and temperature gradients, such as using the probe and plate method [17,18,19]. The characteristics determined by laboratory tests are simply approximations of the formation heat capacity because of the soil sample isolation from the drilling site, which might cause changes in temperature and humidity throughout the transfer procedure. Mogensen [20] is credited with coming up with the idea for the TRT, and according to its basic working theory, heated fluid circulates in a ground-heating element while also transferring heat to the surrounding soil. The identification model is used to examine the soil thermal response parameters (often the average temperature at the BHE inlet and outlet), and the soil thermal parameters are then derived in reverse. TRT technology continues to develop and progress; bulky instruments have been improved into portable test equipment, and the current instruments are small and easy to operate [21,22,23]. Traditional TRTs can measure the total thermal conductivity of an entire borehole, but due to the influence of underground heterogeneity and groundwater flow, they are not able to quantify the thermal conductivity of each formation [21]. The technology of distributed temperature sensing (DTS) has advanced quickly in recent years. Throughout the measurement process, a DTS unit emits laser pulses into the fiber and compares the scattered laser signal intensity ratio (a signal is made up of two independent components, Stokes–Raman scattering and inverse Stokes–Raman scattering) to determine the temperature at the signal source [24]. A distributed optical fiber temperature sensor (DOFTS) has been successfully applied to ground temperature monitoring as a means to obtain thermal conductivity in different formations. DOFTSs use corrosion-resistant and electromagnetic-resistant optical fibers as sensors [25,26]. By using distributed temperature sensors to estimate the surface temperature history in a high lake region, Freifeld [27] calculated the thermal conductivity of the formation. Fujii [28] obtained a vertical temperature distribution using a retrievable fiber optic sensor and estimated the ground thermal conductivity distribution for a 60 m U-Tube BHE using a polyhedral nonlinear regression method. Acuña and Palm [29] used the results of three heat injection distributed thermal response tests (DTRTs) at different flow rates on two coaxial BHEs to study the subsurface heat transfer performance of coaxial borehole heat exchangers during DTRT tests. A ground-based 1D numerical heat transfer model was used by Beier [30,31] to estimate the vertical temperature of coaxial and U-Tube BHEs during DTRTs and the heat transfer that occurs within them. Sakata [32] predicted a DTRT using a line-source model and estimated the layered thermal conductivity and heat flow for different vertical sections. To establish the general features of ground thermal conductivity in Harbin city based on overall distribution, Gao [33] chose 11 representative TRT locations. In situ comprehensive geotechnical thermal conductivity and layered rock thermal conductivity experiments on boreholes in Jixi city were performed by Zhang [34] using 26 temperature sensors. Zhao [35] used sensors inserted inside borehole heat exchangers at various depths to detect temperature and determine the virtual thermal conductivity of each formation. Liu [36] investigated a novel fiber-optic dual-probe thermal pulse method, which utilizes an optical fiber to monitor the temperature response at a certain distance from a heat source to obtain thermal conductivity and volumetric heat capacity. Zhang [37] studied the thermal response based on actively heated optical fibers using a copper mesh heating cable (CMHC) as the heat source and temperature sensing cable and applied it in situ in drilling holes. However, most studies on distributed thermal response testing use two relatively small heat loads that are close to each other and first use the smaller heat load and then use the relatively large heat load. In addition, although distributed temperature measurement fibers can be used to obtain the thermal conductivity of each formation and to map formation temperature profiles, inlet and outlet temperature test assemblies and flow test assemblies are still needed. The majority of test sets are documented in a small number of places; therefore, DTRTs lack a uniform standard and still contain numerous uncertainties [38].
The undisturbed geothermal profile serves as the foundation for studying geothermal properties, which is essential for effective BHE design. However, there is a lack of a unified standard for the measurement of undisturbed geothermal data, and many measurement methods exist. Installing a temperature probe in the borehole is advised by Austin [39] to take periodic readings of the temperature and determine the average value to determine the undisturbed ground temperature. Using the recorded average fluid temperature at the intake and outlet as the undisturbed ground temperature, Pahud [40] and Kyoungbin [41] advised circulating the heat carrier without heating before turning on the heater during a thermal response test. There will be some systems on the pipe between the site of the temperature probe and the inlet or outlet of the borehole; however, they receive heat from the pump’s operation even if the heater does not emit any heat for 10 to 30 min. As a result, Kavanaugh [42] suggested turning on the pump and taking note of the minimum temperature as a reliable indicator of the temperature of undisturbed soil. As soon as the pump is turned on, the American Society of Heating, Refrigerating, and Air-Conditioning Engineers (ASHRAE) suggests taking note of the liquid’s temperature as it leaves the circuit [26]. The thermocouple should be placed in a U-Tube filled with water before the measurement begins, and the temperature should be measured every few meters along the U-Tube. The readings are then used to calculate the arithmetic mean borehole temperature, which is the temperature of the undisturbed soil, according to the Chinese GCHPs Technical Specification [43]. Lhendup [44] inserted three thermistors into a borehole at depths of 2, 21, and 40 m. He then started recording temperatures after the borehole was grouted and continued for 20 months. At a depth of 21 m, the observed ground temperature was 17.2 °C, and at a depth of 40 m, it was 17.4 °C. Both readings were within the measurement uncertainty. Zhang [34] arranged 26 digital temperature sensors along the wellbore in the borehole depth range of 120 m to monitor the temperature change of the ground along the depth and then calculated the average borehole temperature as the initial formation temperature. Zhao [35] measured the undisturbed ground temperature at different depths with a temperature sensor and obtained the distribution of ground temperature and average temperature of the borehole. To record the stratification of static water on the supply and return sides of the U-Tube, Herrera [45] used a distributed fiber-optic sensing system that was run deeply into the tube to measure the undisturbed ground temperature. Therefore, a consistent standard for thermal response test procedures needs to be defined.
In this paper, thermal response field tests and laboratory tests of rock and soil samples from a borehole in Changchun city, Northeast China, were carried out. The distribution characteristics of the formation temperature field, the effective thermal conductivity of the borehole, and the thermal conductivity of each formation were identified during the field test using the combined thermal response test system (CTRTS), which was used to continuously monitor the inlet and outlet temperature as well as the stratum temperature in the pipe. Different methods for measuring the undisturbed ground temperature were compared and analyzed. During the test, a set of relatively large heat loads was used; the high-load condition was measured first and then the lower-load condition, and the formation temperature changes during the entire heating and thermal recovery period were observed. To identify the key elements that cause variations in measurement findings, the outcomes of laboratory and field tests were compared. A comparison and analysis of laboratory trial and field measurement results demonstrated the dependability and precision of distributed temperature measurement fiber technology. It is advised to use the CTRTS to obtain thermal parameters for BHE design. To improve the exploitation of shallow geothermal energy, this study makes a case for the DTRT approach becoming a standard TRT.

2. Materials and Methods

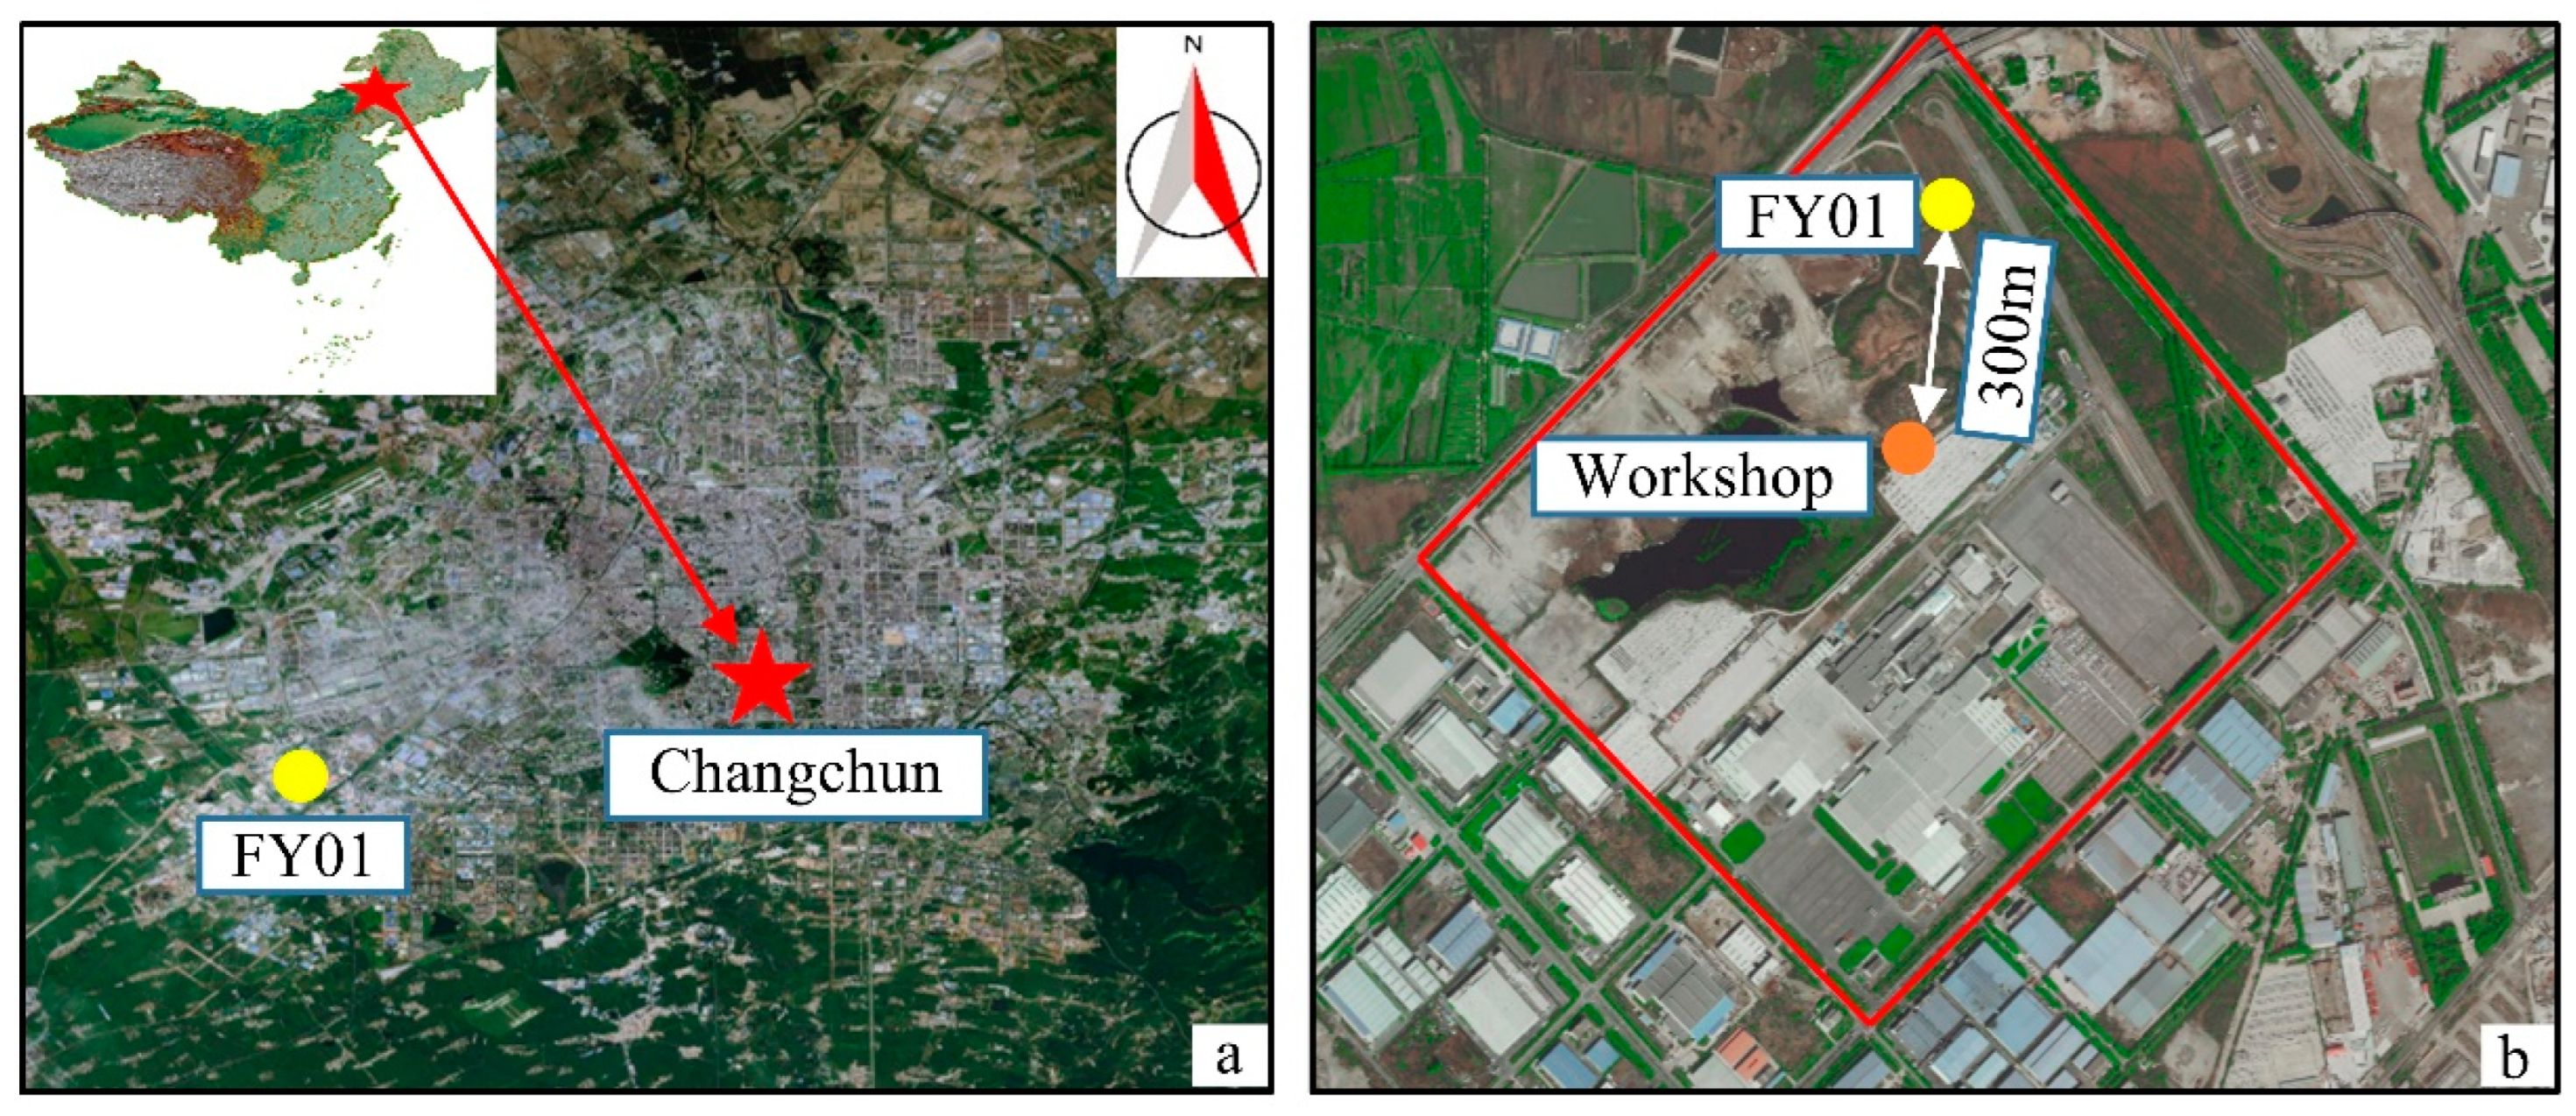
2.1. Background of the Study Area

Jilin Province’s capital, Changchun city, is situated in the northwest of China. The locational coordinates are latitude 43°05′ N to 45°15′ N and longitude 124°18′ E to 127°05′ E. Changchun city has four distinct seasons and a north temperate continental monsoon climate. The climate in this area is chilly. The maximum yearly temperature is 39.5 °C, the lowest is −39.8 °C, and the average is 4.8 °C [46].
The field test region for this study is indicated in yellow in Figure 1a and is situated in the Lvyuan District, which is southwest of Changchun city (a). The thermal response test is performed in borehole FY01 in the research area of the Feng Yue Motor Company. As seen in Figure 1b, the business intends to construct a ground source heat pump to heat its workshop. The workshop will be 300 m from the heat pump and will be heated by the heat extracted from the rock and soil through buried insulation pipes.
According to the drilling lithology data, the geological layers within 130 m underground are mainly divided into 4 layers, which are composed of silty clay, upper mudstone, argillaceous siltstone, and lower mudstone from top to bottom: 0–20 m is the silty clay layer, 20–78 m is the upper mudstone layer, 78–94 m is the argillaceous siltstone layer, and 94–130 m is the lower mudstone layer. The groundwater level measured during the exploration period was 5.5 m. Based on the existing engineering experience in Changchun city, the permeability coefficient of the clay layer is 0.2–0.4 m/d, and the permeability coefficient of the sandstone layer is 1.5–3.8 m/d [46]. With an average annual temperature of 4.5 °C, the study region is in the medium-temperate zone. Since it gets so cold in the winter, heating is needed 180 days a year. The workshop must therefore be heated throughout the winter, and before installing ground source heat pumps, thermal response tests are performed to ascertain the thermal conductivity of the rock and soil.

2.2. Laboratory Test

The test instrument used to measure the thermal conductivity in this laboratory test is a thermal conductivity scanning (TCS) tester [47]. The TCS tester is a direct-reading instrument equipped with a microcomputer. The test equipment offers high precision, a fast test speed, minimal damage to the test sample, and a low cost. The device has high adaptability to the shape and size of the test sample and does not require excessive processing, so the samples collected in the field can be tested with simple processing. Irregular rock samples need to be pretreated into a plane with a size of no less than 40 × 20 mm, and the height difference on its surface can be no more than 2 mm. Round rock samples can be tested directly on both sides and undersides as long as they meet the size requirements. During the test, the instrument probe reads the temperature difference before and after the rock sample is heated by the laser point heat source and calculates the thermal conductivity of the rock and soil sample through the built-in software at the terminal. To ensure the accuracy of the experiment and eliminate accidental errors, each sample is measured three times during the testing process, and the average value is taken after eliminating obvious error values.
At the same time, the physical parameters of the samples, such as density, water content, and porosity, are measured in the laboratory.

2.3. Field Test

The field test part of this work includes the thermal response testing of a borehole at the Feng Yue Motor Company in Changchun city using the combined thermal response test system (CTRTS). Figure 2 shows a schematic diagram of this experimental system. The system includes not only common TRT sensing elements but also a distributed fiber-optic temperature measurement module, which can monitor the temperature at discrete locations along the wellbore and the transient temperature in the return pipe in real time while measuring the inlet and outlet temperatures. This is equivalent to conventional TRTs and DTRTs of the borehole at the same time.

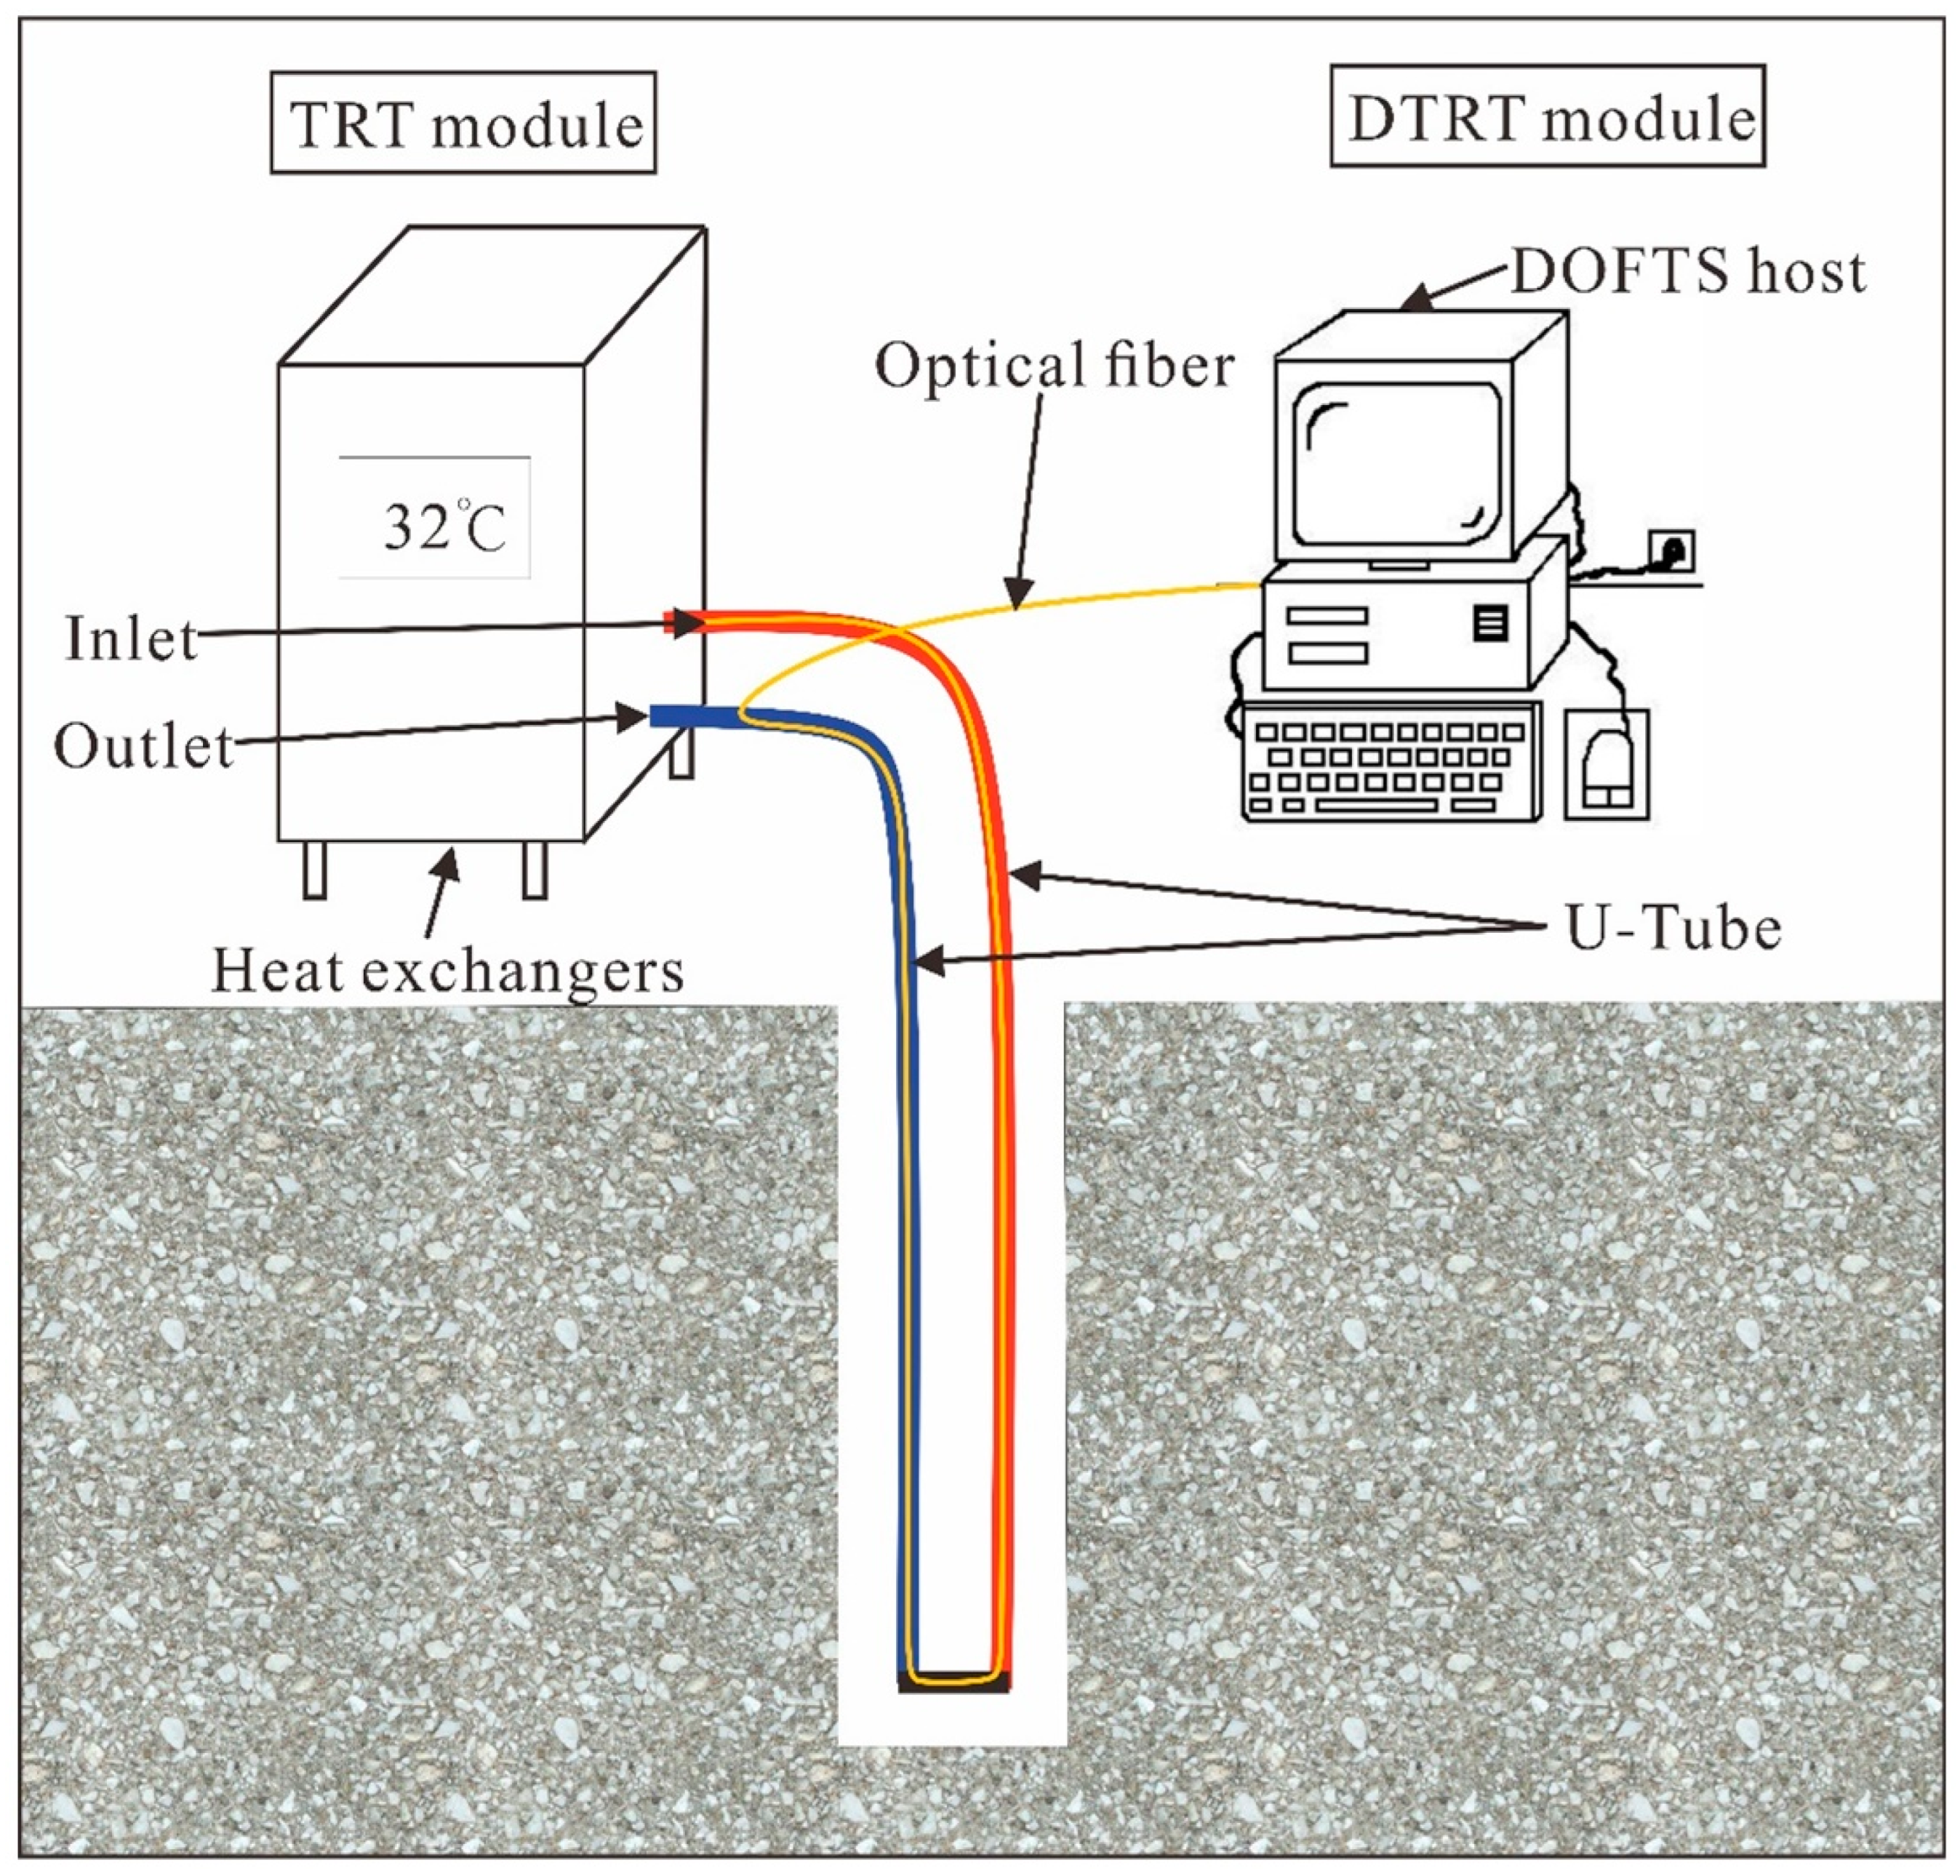
2.3.1. In Situ Test Principle

The line source model is the most frequently applied in TRTs for determining thermal conductivity. On the basis of Kelvin’s line source theory, the theoretical model of an infinite line source for a line heat source was presented. After that, Mogensen [20] proposed a thermal response test method based on this theoretical model, which led to the widespread use of the theoretical model. At present, most of the buried pipe heat transfer models are designed and calculated based on this theoretical model. The basic idea is to regard the buried tube heat exchanger and the borehole as an infinitely long line heat source with a sufficiently small diameter and regard the surrounding rock and soil mass as an infinite medium body. A constant heat load is maintained during the test phase, and it is assumed that the heat transfer of the rock and soil around the heat exchange hole is a pure thermal conduction mode. Assuming that the rock and soil mass is an isotropic homogenous material, the vertical component of heat flow is disregarded, and only the one-dimensional heat transfer in the horizontal radial direction is considered.
When the thermal response test time satisfies Equation (1),
t > 5 r b 2 a = 5 r b 2 C V λ s
Equation (2) can be used to express the difference between the initial average temperature of the rock mass and the average temperature of the heat transfer medium in the buried pipe over time,
T s T 0 = q c 4 π λ s [ ln ( 4 a t r b 2 ) γ ] + q c R b = q c 4 π λ s ln t + q c { R b + 1 4 π λ s [ ln ( 4 λ s C V r b 2 ) γ ] }
In Equations (1) and (2), T is the heating time when the heater is turned on, (s); rb is the borehole radius, (m); a is the thermal diffusivity, (m2/s); CV is the mean unit volume heat capacity of rock and soil mass, (J/(m3∙K)); λs is the average thermal conductivity of rock and soil mass, (W/(m∙K)); Ts is the average temperature of the heat transfer medium, (K); T0 is the average initial temperature of rock and soil mass, (K); qc is the heat added per unit length of heat exchange hole, (W/m); γ is the Euler constant, 0.5772; Rb is the borehole thermal resistance, (m∙K/W).
Equation (2) can be simplified as a linear equation of the logarithmic change in the average temperature of the heat transfer medium over time:
T s = k ln t + b
Among them,
k = q c 4 π λ s
b = q c { R b + 1 4 π λ s [ ln ( 4 λ s C V r b 2 ) γ ] } + T 0
According to Equations (4) and (5), the following can be obtained:
λ s = q c 4 π k
R b = b T 0 q c 1 4 π λ s [ ln ( 4 λ s C V r b 2 ) γ ]
The thermal data from the thermal response test are utilized to create the TS-ln t curve, and the intercept and slope of the fitting line can be used to determine the thermal conductivity of the soil and rock mass and the thermal resistance of the borehole in accordance with Equations (6) and (7).

2.3.2. CTRTS Materials

The CTRTS is placed in a well-insulated experimental box on site, as shown in Figure 3a. The system primarily consists of two modules, corresponding to the TRT module and the DTRT module, as shown in Figure 3b. The TRT module consists of temperature test components, flow test components, water tank components, electric heaters, circulating pumps, heat pump units (including heat exchangers, compressors and other components, air coolers), control and recording components, heat load control, pipes, and other components, as shown in Figure 3c. To facilitate on-site manual handling, the equipment is divided into relatively independent devices for the main machine and the auxiliary machine. The circulation system, heating system, control system, temperature, and test system comprise the host equipment, which can independently complete non-heating tests and heating constant load tests. The auxiliary equipment is mainly a refrigeration unit, which is connected in series with the main equipment to complete the refrigeration constant temperature test. The DOFTS, based on optical time domain reflectometry (OTDR) and Raman backscattering (RB) principles, can measure temperature effectively and accurately. Processing radiation allows for the determination of temperature because of the significant link between temperature, and Raman scattered radiation. As a result, the entire fiber can be thought of as a thermometer, and the distribution of temperatures along the fiber can be seen. One temperature data value can be obtained per meter using the DTRT module, which yields 130 readings in the depth direction. As shown in Figure 3d, the optical fiber has a diameter of 62.5 μm, a metal armor layer to protect it from breaking in the downhole, and an outermost layer of polyvinyl chloride and acrylic paint. The main technical parameters of the DOFTS with an integrated fiber diameter of 3 mm are shown in Table 1. After the DTRT system is connected to the U-Tube, it is placed in the heat-gaining physical property laboratory with a good thermal insulation effect to ensure that the measurement process of the instrument is not affected by weather factors such as wind and rain.

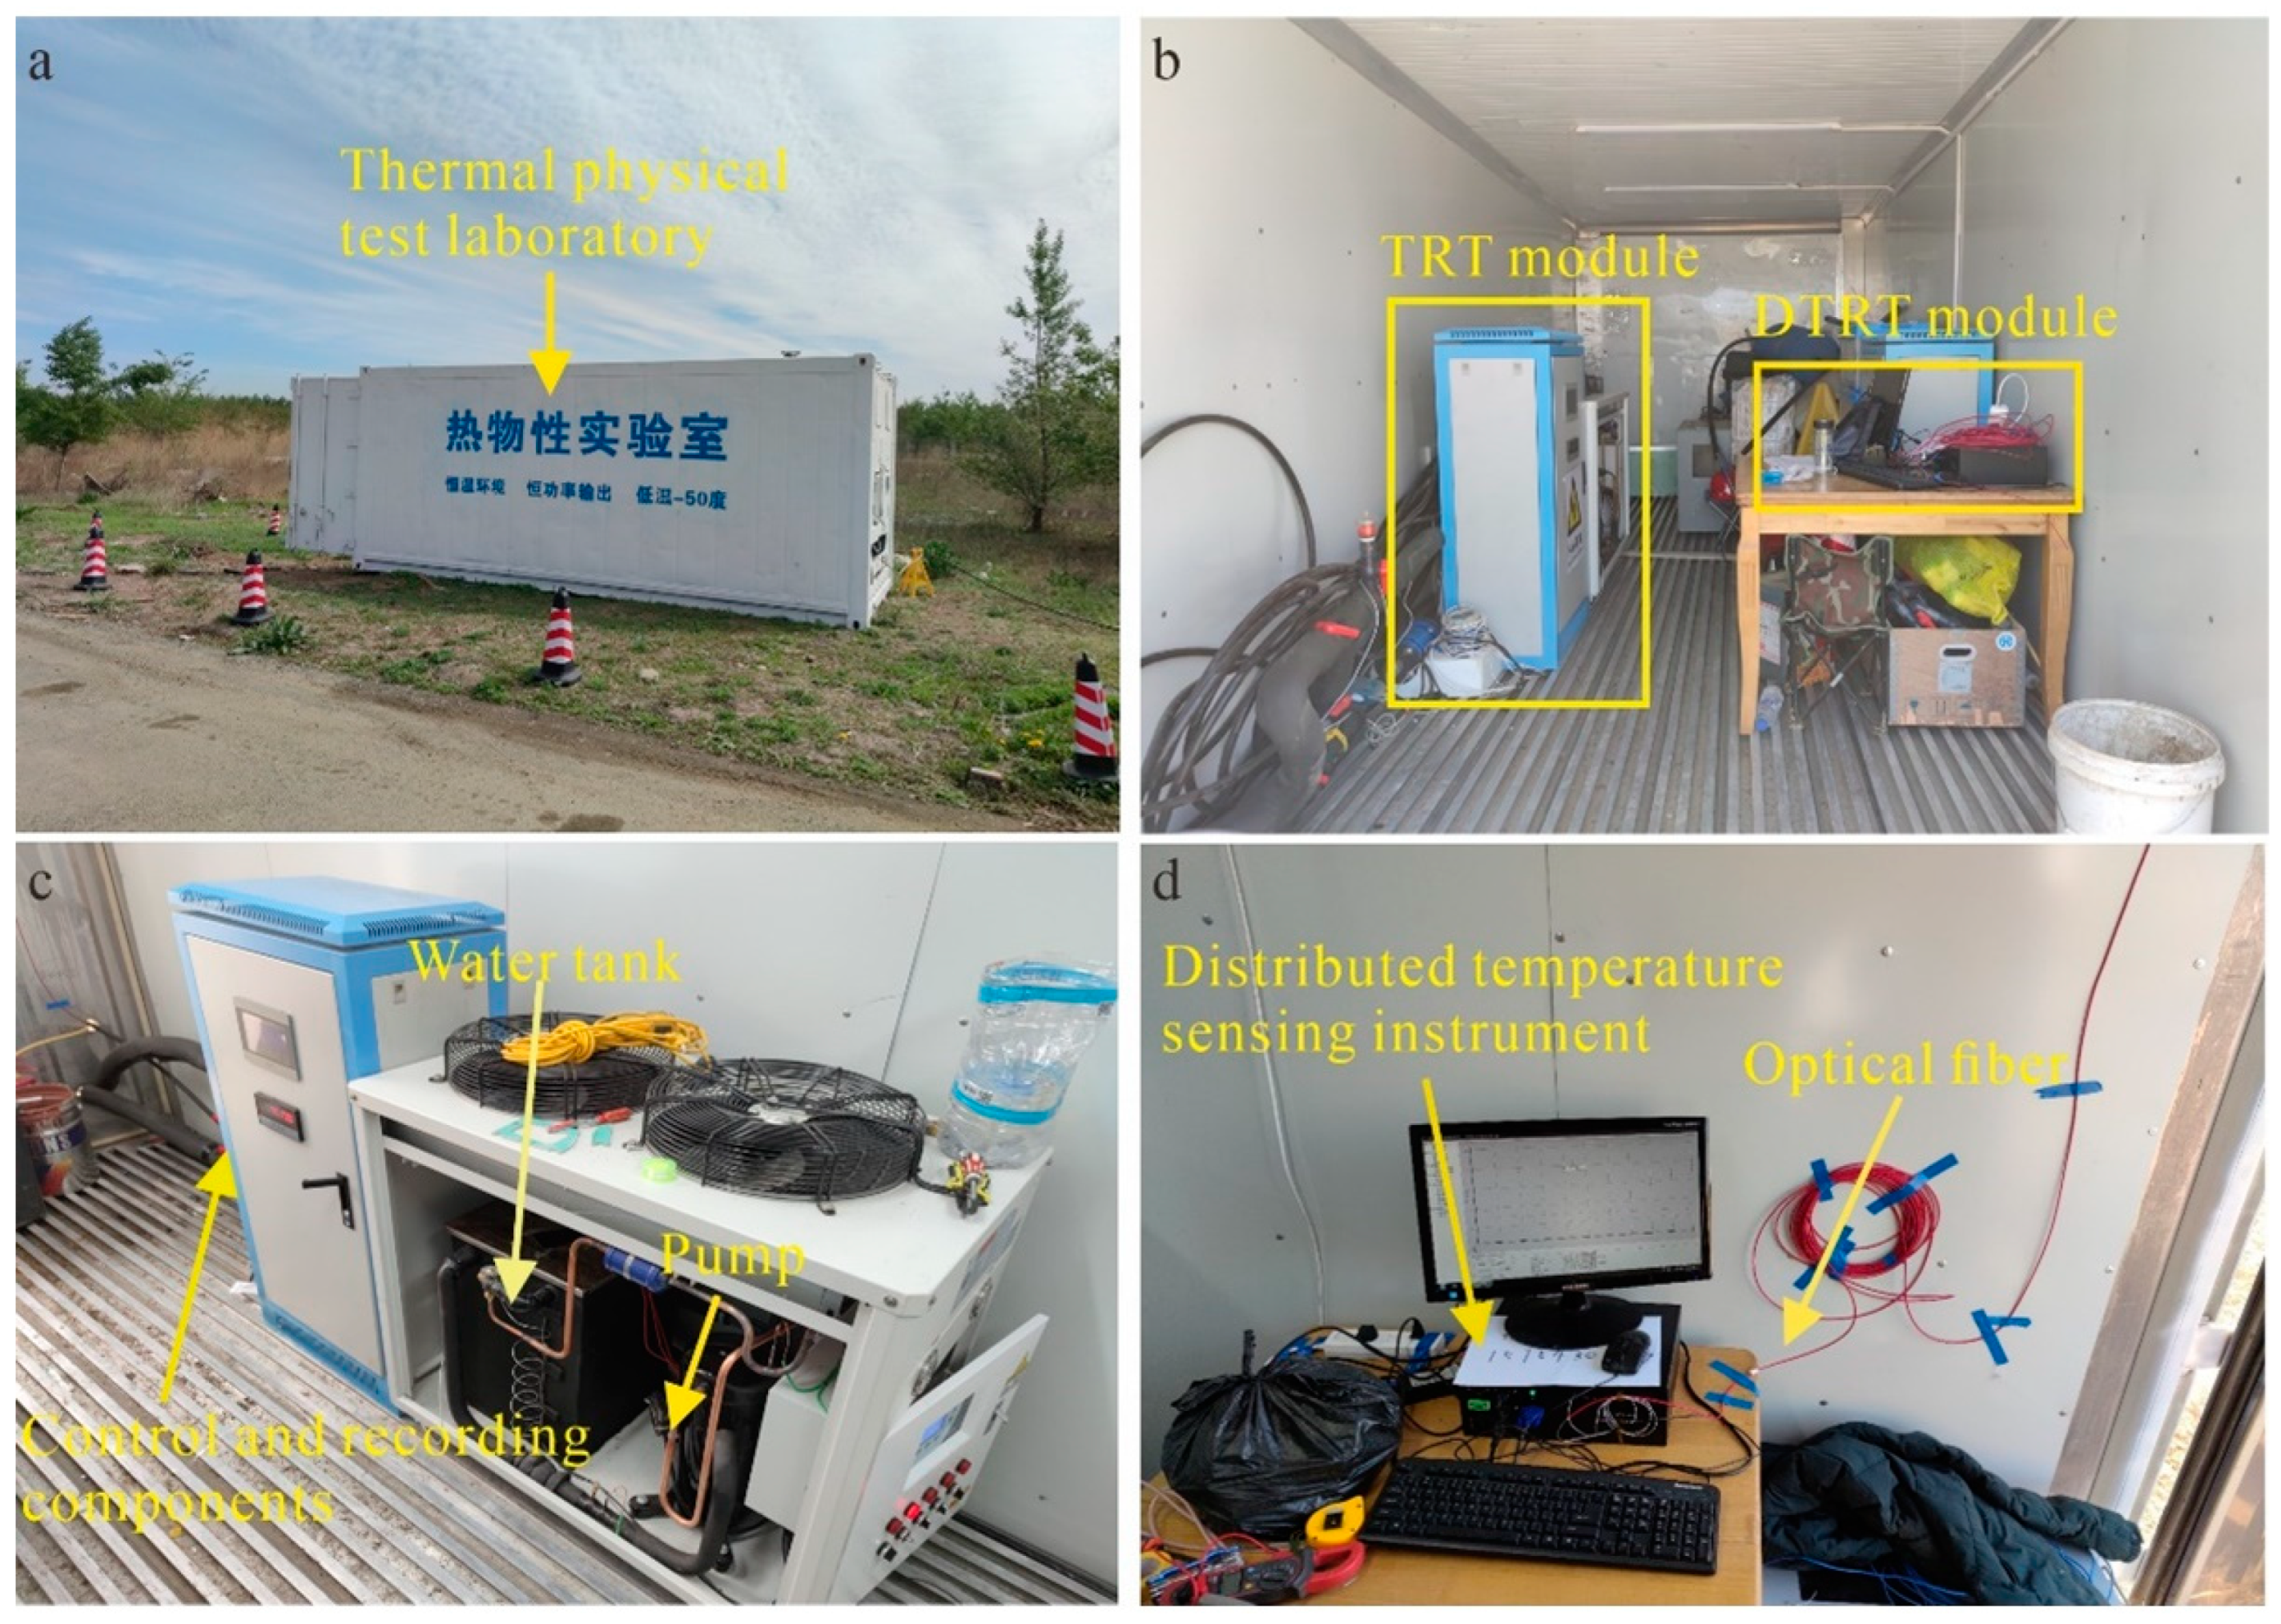
2.3.3. Experimental Apparatus and Procedures

The whole thermal response test is divided into two stages: installation and testing.
In the installation stage, after the test hole is constructed to 130 m, the DN32 high-density PE pipe (double U) is placed. Before the U-Tube is lowered, the PE pipe is subjected to a pressure stabilization test with a pressure of 1.6 MPa. To ensure that the fiber is secured during the backfill and testing phases, the downhole fiber is secured to the U-Tube with high temperature-resistant cable ties (every 0.2 m). The temperature-measuring fiber is arranged along the full size of the U-Tube (260 m). To ensure that the optical fiber is not broken at the bottom fold of the U-Tube, a length of temperature-resistant and the wear-resistant hose is used to wrap the optical fiber. Because the curvature of the optical fiber at the folded part is too large, the temperature of the temperature measurement point 130 m from the bottom of the well is abnormal, and the temperature measurement of the other temperature measurement points is normal. The backfill is made of bentonite and fine sand mixed with paddle material after lowering the tube. Bentonite accounts for 4–6%, and fine sand accounts for 95%. After the filling is completed, it is left to stand for 48 h. The drilling and U-Tube parameters are shown in Table 2 and Table 3. Two sets of temperature cables protected by metal hoses were used to connect different temperature probes and recorders. A pair of bendable stainless steel braided hoses are linked to the circulating pump and the U-Tube to create a closed loop. The end connections of the U-Tube are insulated to prevent heat loss or gain from the surrounding environment. The instrument automatically records the heat load of the heater, flow, and inlet and outlet water temperature. The temperature measurement of optical fiber is connected to the distributed optical fiber temperature measurement monitor. Finally, the CTRTS is placed in the thermal response test laboratory on site to maintain a constant temperature of the test environment and avoid weather effects such as wind and rain. After the instrument was installed, the constant room temperature in the container was measured to calibrate the distributed optical fiber temperature measurement monitor.
The test stage is divided into three stages, and brief information on the various working conditions is shown in Table 4.
The measurement of the undisturbed ground temperature is the first step. Before the test, the U-Tube inserted into the borehole was filled with water in advance, and it was waited for more than 48 h according to the relevant technical requirements. The water temperature and ground temperature in the U-Tube reached equilibrium with each other, but the temperature varied with depth. First, the distributed temperature measuring fiber is used to read the temperature at each depth. Then, the circulation pump is opened, the air mixed in the pipeline is first removed when the pipeline is connected, and the water circulation is maintained without the heater until the water temperature in the circulating pipeline tends to be constant. In the second stage, a constant heat flow experiment in condition A (12 kW) was conducted. After the initial average temperature was obtained, a 12 kW load was used to heat the heat transfer medium in the U-Tube. During the testing process, the flow and heat load should be basically kept constant (within a fluctuation range of ±5%), the TRT module records the flow rate and inlet and outlet temperature of the heat transfer medium in the U-Tube, and the DTRT module records the temperature at each depth of the formation. After the temperature stabilized (the temperature change was less than 0.5 °C every day), the observation time was not less than 24 h. After observation, heating was stopped for more than 48 h to restore the ground temperature. In the third stage, working condition B (8 kW) was the constant heat flow experiment; after the initial average temperature was restored, the heat transfer medium in the loop was heated with an 8 kW load. After observation, heating was stopped for more than 48 h to restore the ground temperature.

3. Results and Discussion

3.1. Laboratory Test

In this test, 65 rock and soil samples from the FY01 borehole were chosen to test the water content, density, porosity, and thermal conductivity. These samples were taken at depths ranging from 0 to 130 m. As soon as the sample was removed from the borehole, it was sealed to preserve the natural water content as much as possible. To ensure accuracy, each sample should be tested at least three times, and the results are shown in Figure 4.
It can be observed that the water content of rock and soil samples generally decreases with increasing depth (Figure 4a), the density of the rock and soil samples generally increases with increasing depth (Figure 4b), and the porosity of the rock and soil samples generally increases gradually with increasing depth (Figure 4c). The thermal conductivity of the rock and soil samples showed an overall increasing trend with increasing depth (Figure 4d). The thermal conductivity of rock and soil taken out of the FY01 borehole measured by TCS is in the range of 0.867–1.965 W/m·K, of which the average thermal conductivity of silty clay is 1.166 W/m·K, the average thermal conductivity of the upper mudstone is 1.653 W/m·K, the average thermal conductivity of argillaceous siltstone is 1.798 W/m·K, and the average thermal conductivity of the lower mudstone is 2.001 W/m·K. Considering the thickness of each layer, the comprehensive thermal conductivity of the FY01 borehole measured by laboratory measurements is 1.692 W/m·K.
Combined with the borehole lithology data and test results, the variation in the thermal conductivity of rock and soil is mostly influenced by porosity, water content, and density. In general, the more tightly packed the particles are, the larger the contact surface between the particles, the higher the rock density, the more solid particles, and less gas there are per unit volume of the rock, and the higher the heat conductivity. Thermal conductivity, which is dependent on porosity, is a property of rock that is significantly influenced by its water content. The air is gradually forced out of the pores as the amount of water with higher thermal conductivity grows, which is equivalent to expanding the thermal conductivity channel to improve the thermal conductivity of rock.

3.2. Field Test

3.2.1. Undisturbed Ground Temperature

After the installation phase, the temperature-measuring optical fiber was fixed on the U-Tube through the high-temperature-resistant rolling belt and buried in the drill hole together with the pipe. Before the test, the U-Tube embedded in the borehole is filled with water in advance. After the U-Tube is buried, 48 h is needed according to the relevant technical requirements to ensure that the water temperature in the U-Tube and the ground temperature have reached a balanced state. The distributed optical fiber temperature sensor has now recorded temperature data for each depth. Since there is no water circulation, there is no frictional or pump-related heat generated throughout the operation. According to DTRT module measurement data, the surface temperature field within 130 m can be divided into three layers, A, B, and C, namely, the variable temperature stratum, constant temperature stratum, and increasing temperature stratum, respectively, as shown in Figure 5a according to the temperature field changes from shallow to deep. The distribution range of variable temperature strata is 0–25 m. The surface cover layer, atmosphere, and solar radiation all have a significant impact on this layer’s temperature, and the fluctuation varies significantly throughout seasons and geographical areas. The distribution range of the constant temperature stratum is 25–50 m, and the formation temperature is basically stable at 9.13 °C. The constant temperature stratum refers to the interface where the reduction of solar radiant heat to the surface and the conduction and release of heat from the Earth’s internal heat to the surface reach equilibrium at a certain depth and temperature, where the annual variation range of ground temperature is nearly zero. The depth and temperature of the thermostatic layer are mainly influenced by regional structural and geotechnical properties. The lithology of this formation is mudstone, which is stable in nature. The groundwater depth of the study area is 5.5 m, and the groundwater type is mainly loose pore water. The distribution range of the increasing temperature stratum is 50–130 m, and the geothermal gradient is approximately 3.0 °C/100 m. In the range of 50–130 m, the lithology is mainly mudstone, including 16 m of argillaceous siltstone, but the overall thermal conductivity and heat capacity have little change after laboratory measurement. Therefore, the temperature rise in this layer is due to heat transfer from the Earth’s interior. Without considering the variable temperature layer greatly affected by the atmosphere and environment, the average temperature within the research depth range of 130 m, namely, the undistributed ground temperature, was 10.0 °C by using the temperature data measured by a distributed temperature optical fiber.
After measuring the initial ground temperature of the mixture of the still water and the formation, the TRT device was attached to the U-Tube in the borehole, the circulating pump was turned on to remove air from the pipe when it was connected, and the water was kept circulating without turning on the heater until the temperature of water in the circulating pipe became constant. This temperature was considered the initial average temperature of the rock and soil mass within the buried depth of the underground heat exchanger. When the pump was opened and the circulation maintained for more than 12 h, the temperature at the water inlet and output holes, as recorded by the TRT module, tended to remain consistent. The temperature at the water inlet and output was constantly monitored for 24 h after it stabilized, as shown in Figure 5b. The undistributed ground temperature obtained by this method is 10.1 °C, which is consistent with the temperature data obtained by measuring the formation temperature.
At the same time, the temperature data captured by the fiber optic temperature sensor were read after maintaining the water circulation stability for 24 h. The temperature information for the whole intake and output pipes received by the temperature-measuring fiber is shown in Figure 5c. The temperatures of the water inlet pipe and the water outflow pipe largely remain consistent after a period of stable operation. The average temperature of the water inlet pipe is 10.83 °C, and the average temperature of the water outlet pipe is 10.66 °C, which is approximately 0.7 °C higher than the initial formation temperature and the temperature at the inlet and outlet holes. It is impossible to avoid heat exchange between the upper and bottom portions of the U-Tube once the water begins to circulate, neither heating nor chilling. Gradually, the difference in water temperature disappears, and the wellbore eventually tends to reach a constant temperature. In this test, the water velocity in the U-Tube was 0.68 m/s, and the water was in a turbulent state in the pipe, so the friction of the water in the pipe also caused the temperature to rise. The temperature of the inlet pipe is slightly lower than that of the outlet pipe by 0.1 °C because there is a small loss of heat in the circulating water along the way.
As a result, the standard TRT is unable to make precise measurements of the temperature variations over time at different depths and can only provide an estimate of the average borehole temperature. The application of DOFTS technology to measure the initial ground temperature is reliable. The undisturbed ground temperature may be precisely measured using DOFTS technology, as can the temperature changes of each layer and the distribution of temperatures with depth during heating and cooling. Therefore, this paper adopts the temperature of 10.0 °C measured by the DOFTS as the undistributed ground temperature.

3.2.2. Comprehensive Thermal Conductivity

Two working conditions, A and B, were tested on the borehole. The heating load was 12 kW and 8 kW, respectively, and the water velocity in the pipe was 0.68 m/s during the test. After the undistributed ground temperature was measured, the working condition test went through a total of 168 h, including 48 h of heating under working condition A, 72 h of recovery time, and 48 h of heating under working condition B. Every 60 s, the TRT module’s data-collecting system automatically records the temperature at the inlet and outlet. After the test, the recorded time and temperature data are read, and the temperature variation curves under the two working conditions are made shown in Figure 6.
According to the theoretical content of the line source in Section 2 and the time and temperature data of the inlet and outlet received from the thermal response test, logarithmic fitting of the average inlet and outlet temperature and time curves is carried out for the two working conditions. According to the slope and intercept of the fitted straight line, the average thermal conductivity of the rock and soil mass within the borehole range under the two working Conditions A and B was calculated according to Equation (6), and the results were 1.864 W/m·K and 1.859 W/m·K, respectively. The calculation results of the thermal conductivity of the drilled holes under the two working conditions are shown in Table 5. The entire test underwent two 48-hour heating periods and a 72-hour recovery period between the two heating periods. When variables such as the flow rate of the circulating medium and operating time in the pipe remain unchanged, the thermal conductivity of the larger heat load test is not much different from, the smaller heat load test results, so considering the economic factor, the smaller heat load can be used for the thermal response test. The average thermal conductivity at the two heat load values represented the total thermal conductivity of the test boreholes, according to Zhang’s [33] analysis of two heat load TRTs of 11 boreholes in Harbin city, China. As a result, it is calculated that the FY01 borehole has an integrated thermal conductivity of 1.862 W/m·K.

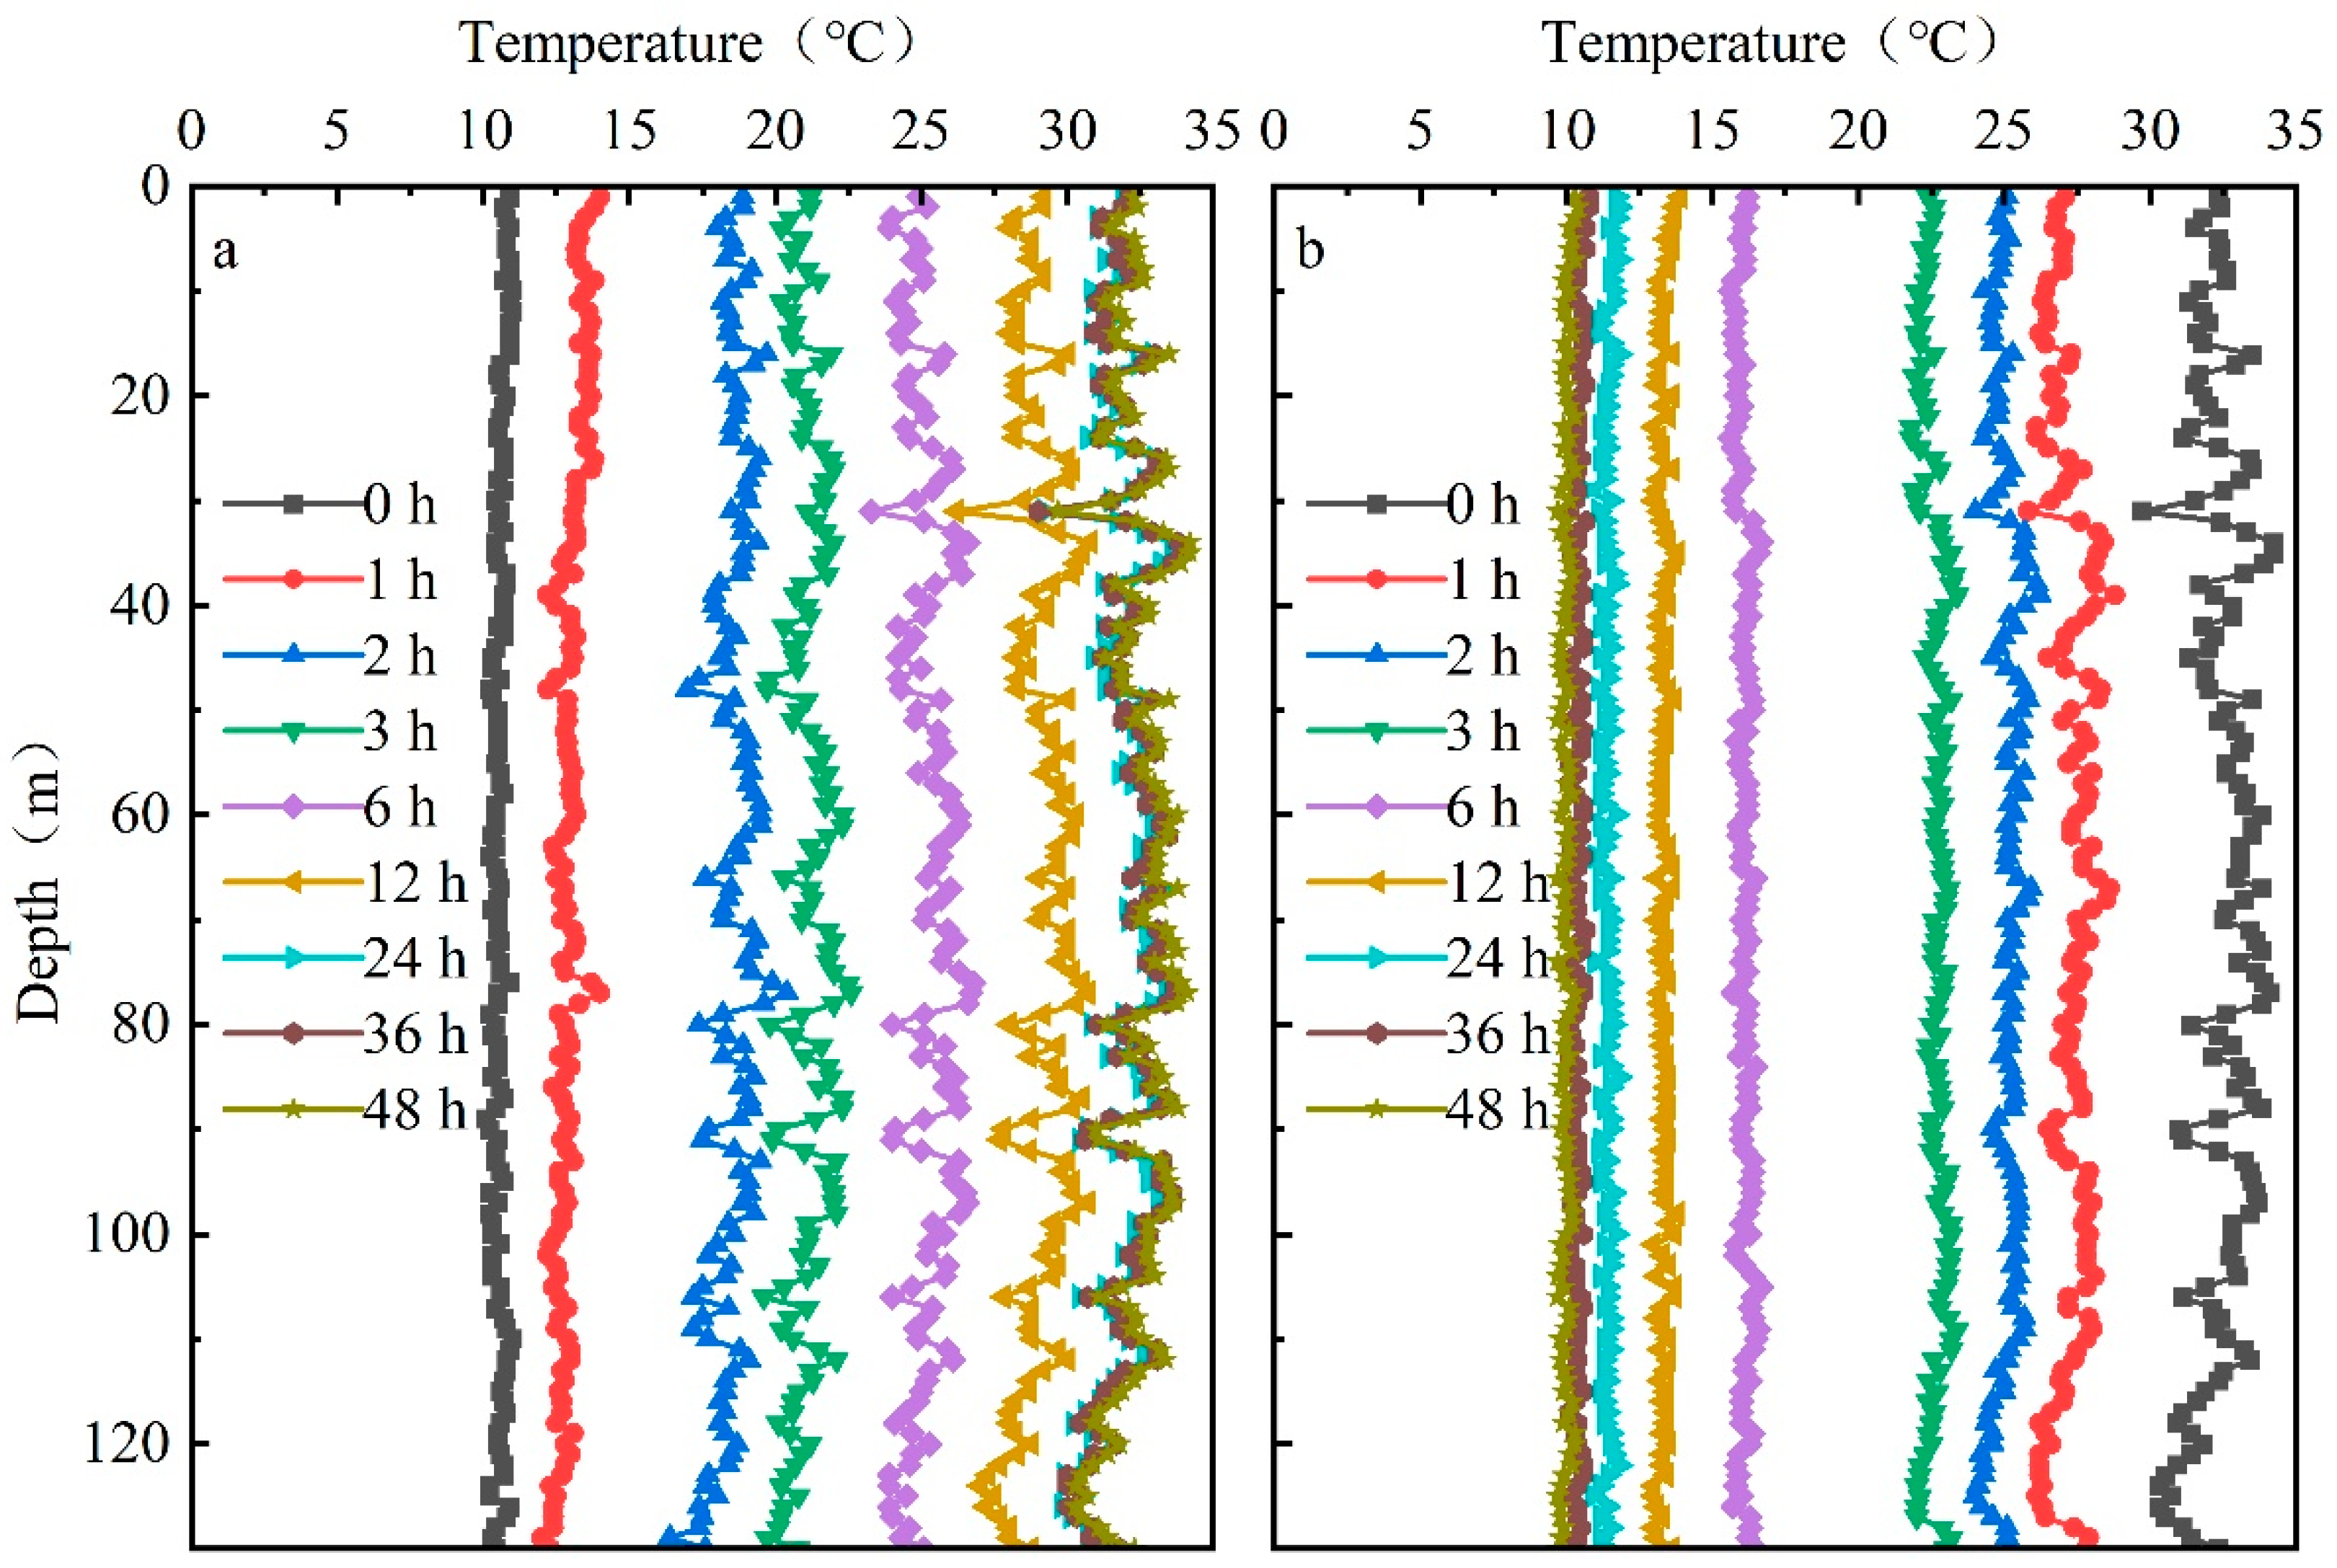
3.2.3. Ground Temperature Variation

The temperature measurement range of the DTRT module is −50–150 °C, the positioning accuracy can reach 1 m, and the temperature accuracy can reach 1 °C. Therefore, the DOFTS can obtain one temperature data value per meter in the vertical direction at the same time. The temperature sensor is mounted to the outside wall of the U-Tube at a depth of 130 m and runs through four layers of silty clay, mudstone, argillaceous siltstone, and mudstone, recording a total of 130 temperature data points in the vertical direction of the four layers at any time point.
According to the data obtained by the temperature measuring optical fiber, the temperature data at each depth at the nine representative time nodes of 0, 1, 2, 3, 6, 12, 24, 36, and 48 during the heating period of working condition A and ground temperature recovery period after working condition A are selected and plotted as shown in Figure 7. As shown in Figure 7a, 0 h is the undisturbed ground temperature, and the temperature curve is smooth and approximately straight. The temperature at each depth is essentially the same. Faster heat dissipation is associated with the increased thermal conductivity of the formation. As a result, the formation with high thermal conductivity has a comparatively low temperature. Additionally, it is evident that the temperature increase range between 36 h and 48 h is very small and basically tended to be stable. As shown in Figure 7b, after stopping the heat load, the temperature at each depth decreases with time, and the temperature gap between different strata gradually decreases and finally tends to smooth back to the undisturbed ground temperature. The time to recover to the undisturbed ground temperature is less than the set recovery time, which can ensure that the test under condition B still starts from the initial ground temperature.

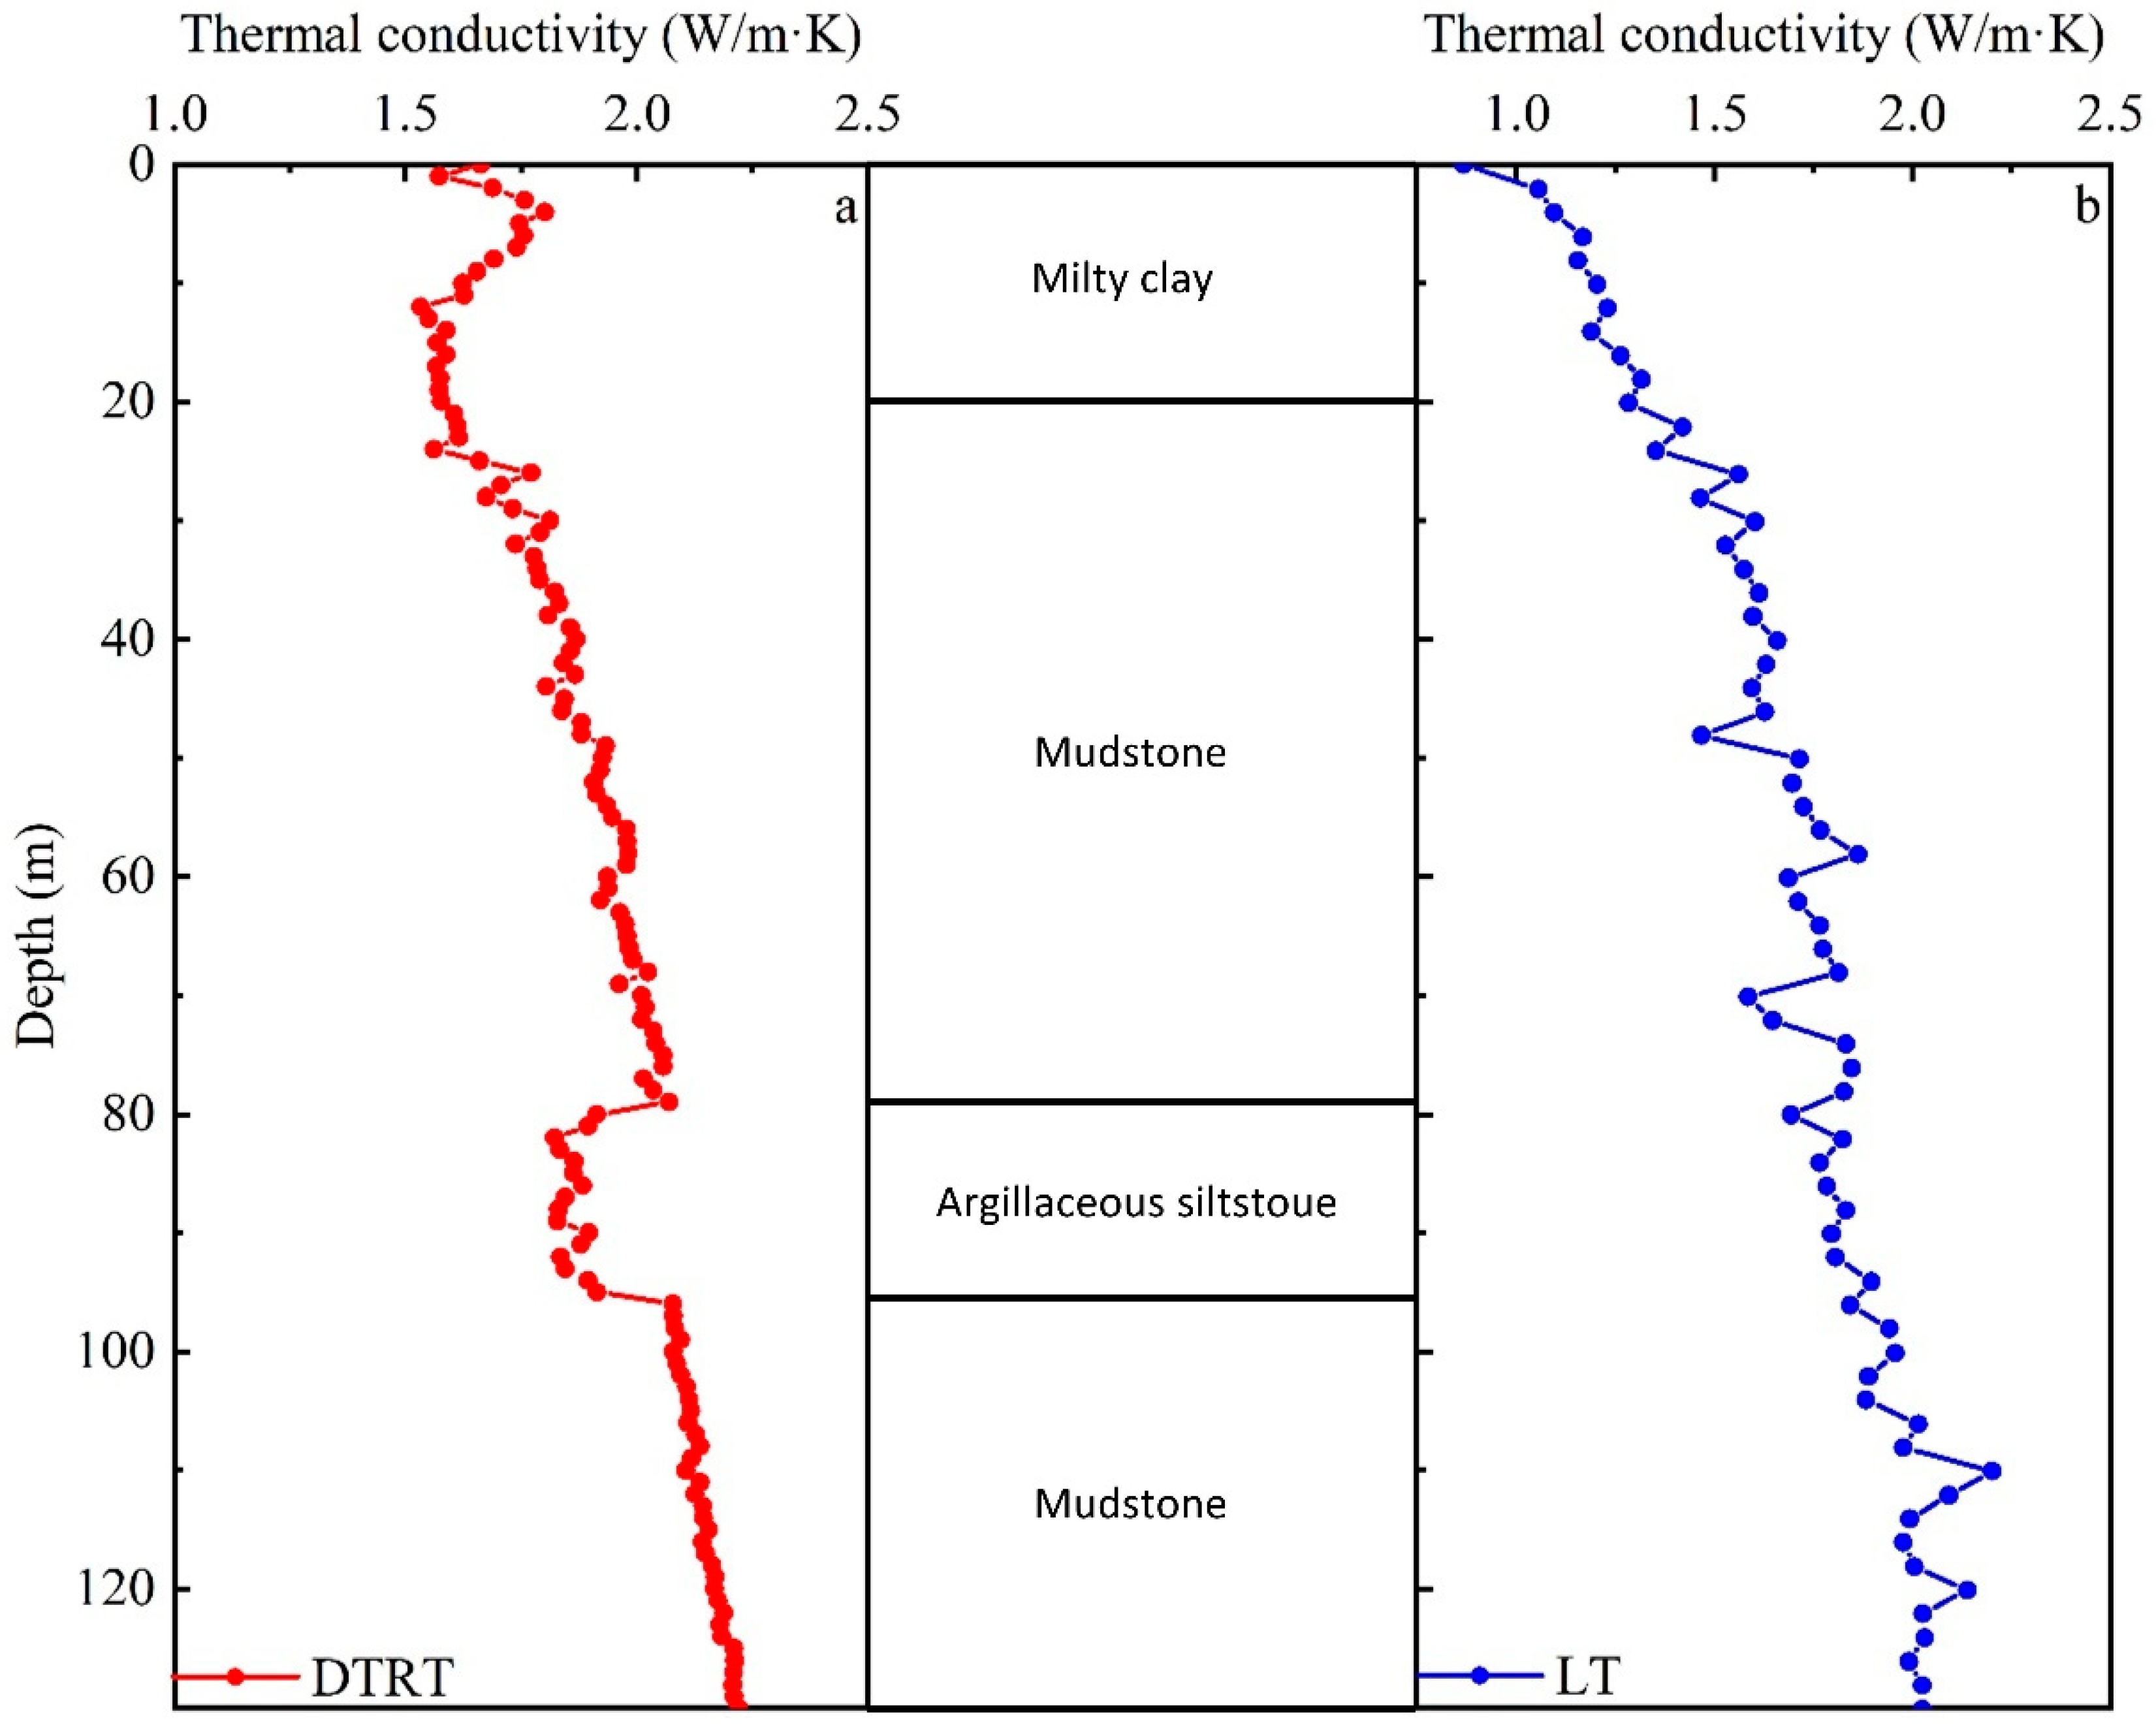
3.2.4. Stratified Thermal Conductivity

The temperature data recorded for 48 h at each temperature measuring point at 130 m depth in working condition B are read, the time–temperature curve at each temperature measuring point is created, and the thermal conductivity at each depth is calculated, as shown in Figure 8a. It can be determined from the thermal conductivity curve that the thermal conductivity of rock and soil mass at the same level has the same heat transfer characteristics in the heating process and is positively correlated with depth. Considering the weighting coefficient of each section thickness, the layered thermal conductivity of each layer is determined, as shown in Figure 9. The average thermal conductivities of silty clay, upper mudstone, argillaceous siltstone, and lower mudstone are 1.631 W/m·K, 1.888 W/m·K, 1.862 W/m·K, and 2.144 W/m·K, respectively.

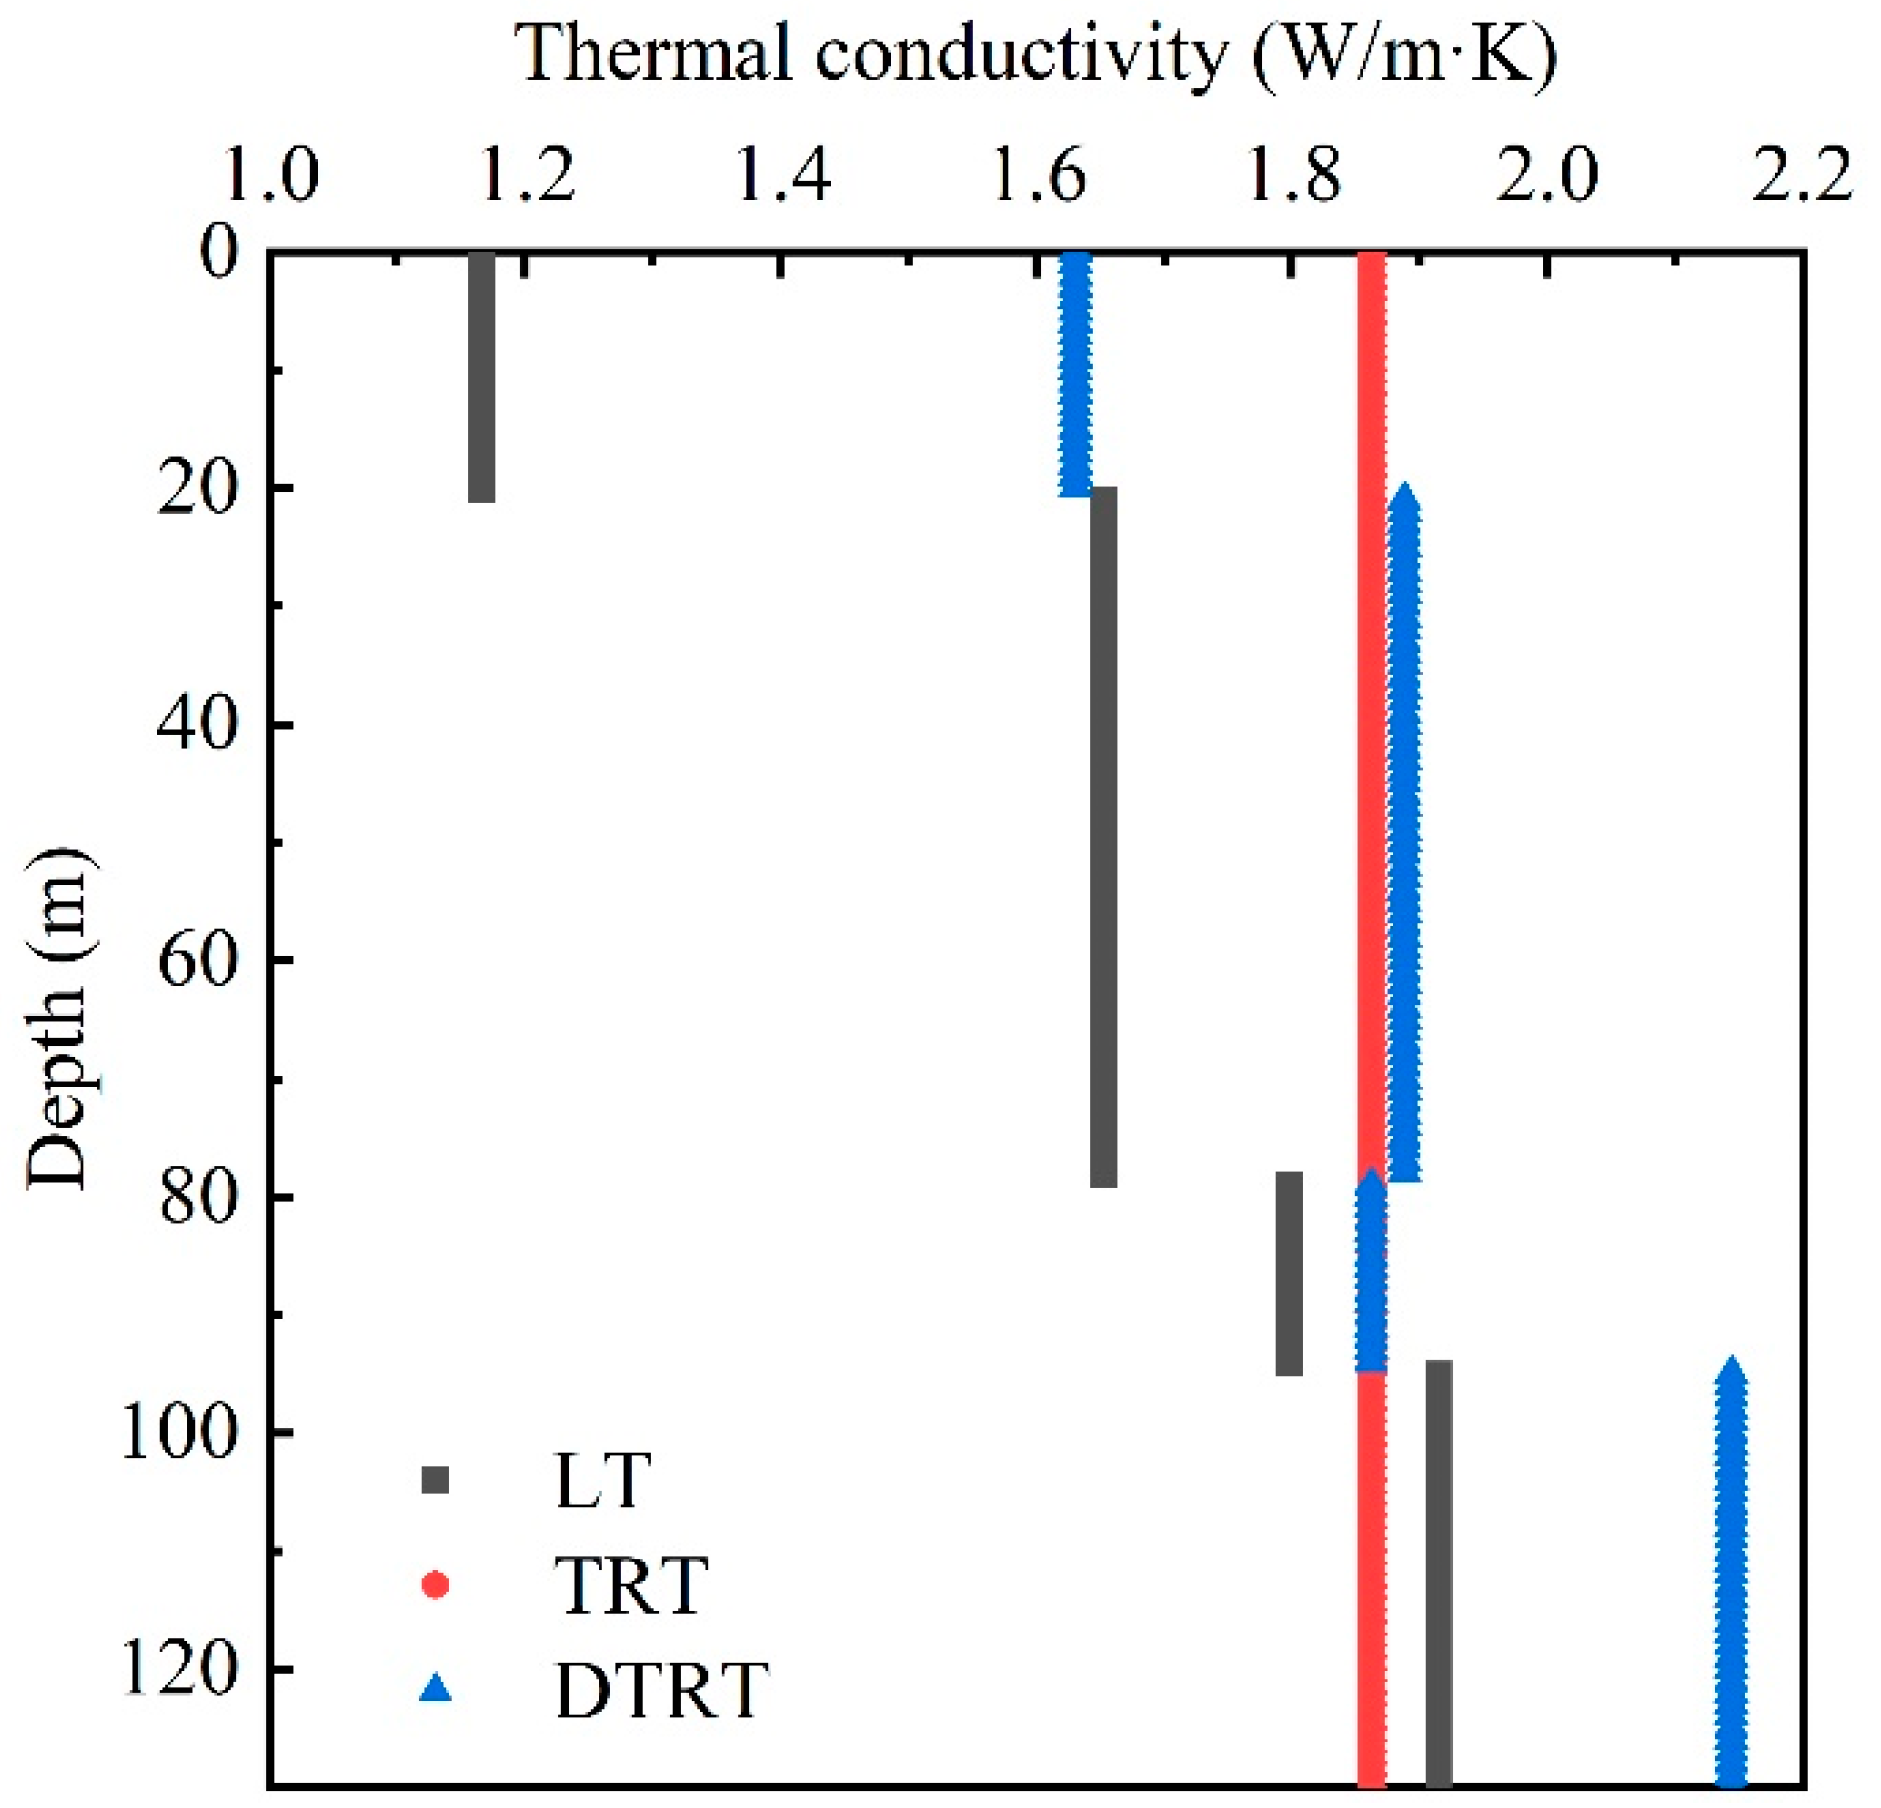
3.2.5. Comparison of Thermal Conductivity Test Methods

In Section 3.1, 65 samples were selected every 2 m in the 0–130 m depth range of the FY01 borehole for laboratory testing to determine the thermal conductivity. Figure 8 illustrates the contrast between the outcomes of the lab tests and the outcomes of the DTRT. The DTRT results cannot reflect the actual heat transfer capacity of the 0–3 m stratum at the site because it is susceptible to weather and diurnal temperature differences. Although the amount of data is different, it can be shown that the change trend of thermal conductivity acquired by the two methods is the same, which increases with increasing depth. The DTRT results can reflect the variation law of the thermal conductivity of each formation within the range of drilling depths.
As opposed to an optical fiber temperature sensor, which can measure the thermal conductivity of rock and soil throughout an entire depth range of 130 m, a finite number of rock and soil samples can be collected on site. The thermal conductivity of rock and soil between the same strata has regularity, so the average thermal conductivity of each stratum obtained by the laboratory test (LT) and distributed thermal response test (DTRT) module are calculated. The comprehensive thermal conductivity of the borehole is obtained by the thermal response test (TRT) module. The calculation results are shown in Table 6. The thermal conductivity comparison is shown in Figure 9.
The comprehensive thermal conductivity of the borehole is 1.862 W/m·K. The 0–20 m formation is silty clay, and the average thermal conductivities of LT and DTRT are 1.166 W/m·K and 1.631 W/m·K, respectively. Differences in laboratory and field test results are estimated to be due to the presence of groundwater flow. According to engineering experience in the Changchun area, the permeability coefficient of the clay layer is 0.2–0.4 m/d. Groundwater flow creates thermal convection, which results in greater thermal conductivity through the DTRT for this formation. The average thermal conductivity of the natural flow field is higher than the weighted results of experimental laboratory measurements because accelerating groundwater flow can promote heat transfer. For mudstone and silty mudstone, the difference between the two test results is small, and it is estimated that the main factor causing the difference is the water content change during the sampling process. Changes in water content and groundwater flow resulted in much smaller LT results than DTRT results. The 20–78 m formation is mudstone, and the average thermal conductivities of LT and DTRT are 1.653 W/m·K and 1.888 W/m·K, respectively. The difference between the three test results of the mudstone layer is smaller than that of the soil layer, but the changes in groundwater flow and water content still affect the measurement results. In addition, the interbedded mudstone that may exist in this layer will reduce the pore connectivity, which will affect the test results. The 78–94 m formation is argillaceous siltstone, and the average thermal conductivities of LT and DTRT are 1.798 W/m·K and 1.862 W/m·K, respectively. The results of the three tests in this layer have the smallest difference. The rock in this layer is hard, and the water loss during the sampling process is small. The 94–130 m formation is mudstone, and the average thermal conductivities of LT and DTRT are 2.001 W/m·K and 2.144 W/m·K, respectively. The layer has a high degree of consolidation, and the density leads to greater DTRT results than LT results.
The differences in thermal conductivity between the laboratory test and field test under different strata are caused by a variety of reasons. First, the analysis of the tests in this paper and previous studies [48,49] shows that the main influencing factors of indoor conductivity and field conductivity of aquifers are porosity and water content, while the main influencing factor of non-aquifer indoor conductivity is porosity, water content and density. Given that rock density and porosity are closely related, it may be considered that the interaction of water content, porosity, and density is what causes the main variance in conductivity between the laboratory and the field. First of all, the LT cannot be performed immediately after sampling. Although the sample is sealed and packaged to avoid the loss of water as much as possible, changes in water content, porosity and density will occur during transportation and experimentation. Second, LT was measured from a small cylindrical sample over a short period of time, while groundwater flow and the presence of certain discontinuities and interlayers within the in situ formation would lead to a discrepancy between the two results. Finally, the variation in ambient temperature and the heterogeneity and anisotropy of samples will cause differences in test results. The laboratory test cannot measure every depth of the formation. The thermal conductivity distributions calculated by the DTRT take geological and groundwater conditions into account and are free of physical and chemical changes caused by sample transportation, making the measurements more realistic and comprehensive and reflecting formation conditions. The TRT results represent the comprehensive thermal conductivity of the ground along the entire length of the vertical borehole. Due to the local geology, this technique has a potentially important restriction in that it cannot provide any information regarding the spatial variation of ground conductivity along the length of the borehole. In this test, the comprehensive thermal conductivity of the TRT is 1.862 W/m·K, and the average thermal conductivity of the DTRT in the FY01 borehole is 1.897 W/m·K, with an error of only 2%. The average thermal conductivity of DTRT is consistent with that obtained by the traditional TRT, which verifies the reliability and accuracy of the DTRT. Therefore, the DTRT based on a distributed optical fiber temperature sensor is recommended to test the thermal conductivity.
For the thermal response test, the TRT tester and the borehole took up most of the initial investment. Generally, the price of a traditional TRT tester is CNY 150,000–200,000. At present, according to the engineering design experience of soil source heat pumps, the buried depth of BHEs is generally 100–200 m. In Changchun city, the average market price of 0–200 m boreholes is 500–600 CNY/m. A DOFTS host with a single channel (that is, one optical fiber can be connected) usually costs CNY 50,000. If a large number of temperature-measuring optical fibers are purchased, the price of optical fibers can be as low as CNY 3 per meter. The cost of adding the DTRT module on the basis of the TRT is less than 20%.
When the heating demand is fixed, the longer the length of the BHE is, the fewer the number of drilling holes needed. The cost of BHEs increases with increasing length, the cost of drilling holes increases with decreasing burial depth, and more underground space is needed to place BHEs. For this site, the mudstone layer has a high thermal conductivity. If enough drilling depth is allowed, the proposed length is more than 100 m. If more space is allowed, the proposed length is less than 80 m to obtain the lowest cost. If we want to increase other buried pipe methods, such as horizontal buried pipe and spiral buried pipe, to increase the heat transfer capacity in engineering, it is recommended to design and construct a mudstone layer. The thermal response test results of the CTRTS can optimize the design of the BHE and reduce many costs in subsequent ground source heat pump system projects.

4. Conclusions

In this paper, based on laboratory tests and the CTRTS, the undisturbed ground temperature, ground temperature distribution, ground temperature variation characteristics, and thermal conductivity of the FY01 borehole in Changchun city, Northeast China, are analyzed and discussed. The main conclusions are as follows:
  • The undisturbed ground temperature of the borehole is 10.0 °C, as provided by the DOFTS. The stratum temperature field within 130 m can be divided into a variable temperature stratum, a constant temperature stratum (9.13 °C), and an increasing temperature stratum (geothermal gradient 3.0 °C/100 m). DOFTS technology can achieve the goal of continuous acquisition of geothermal profiles.
  • The comprehensive thermal conductivity calculated based on the test results of the TRT module in this area is 1.862 W/m·K, and the influence of a high heat load on the test results of thermal conductivity is relatively small. Based on the DTRT results, the average thermal conductivities of silty clay, upper mudstone, argillaceous siltstone, and lower mudstone are 1.631 W/m·K, 1.888 W/m·K, 1.862 W/m·K, and 2.144 W/m·K, respectively.
  • The variation trend of thermal conductivity of rock and soil mass measured by the DTRT and LT is consistent, and the comprehensive thermal conductivity calculated by the DTRT and TRT is consistent. The thermal conductivity of the rock and soil mass in each layer should be more accurate using the field test results. The field groundwater conditions, moisture content, porosity, and density changes, and the properties of the samples lead to errors in the LT test results.
  • The DTRT module based on DOFTS technology can draw the geothermal profile, learn the change trend of thermal conductivity with time and the distribution of thermal conductivity along the depth, and reflect the actual heat transfer capacity of different strata. The TRT module can determine the comprehensive thermal conductivity and monitor the real-time flow rate and heat load. The CTRTS can effectively conduct thermal response tests and obtain thermal parameters and rules, which provides a case for establishing a standard DTRT.
  • Using the layered thermal conductivity test based on the distributed fiber temperature sensor DTRT module to optimize the design of the heat exchanger can obtain better heat transfer capacity and reduce the cost.

Author Contributions

Conceptualization, Y.M.; Data curation, Y.M.; Formal analysis, Y.Z. (Yu Zhang), X.G. and K.S.; Funding acquisition, Y.Z. (Yanjun Zhang); Methodology, Y.M.; Project administration, Y.Z. (Yanjun Zhang); Resources, Y.Z. (Yanjun Zhang); Validation, Y.C.; Writing—original draft, Y.M.; Writing—review & editing, Y.M. All authors have read and agreed to the published version of the manuscript.

Funding

This research has been funded by the National Key Research and Development Program of China (NO. 2019YFC0604905), China Postdoctoral Science Foundation (Grant No. 2022M711291), and the Engineering Research Center of Geothermal Resources Development Technology and Equipment, Ministry of Education, Jilin University.

Conflicts of Interest

No conflict of interest exists in the submission of this manuscript, and the manuscript is approved by all authors for publication. I would like to declare on behalf of my co-authors that the work described was original research that has not been published previously and not under consideration for publication elsewhere, in whole or in part. All the authors listed have approved the manuscript that is enclosed.

References

  1. Olabi, A.G. Circular economy and renewable energy. Energy 2019, 181, 450–454. [Google Scholar] [CrossRef]
  2. Moya, D.; Aldás, C.; Kaparaju, P. Geothermal energy: Power plant technology and direct heat applications. Renew. Sustain. Energy Rev. 2018, 94, 889–901. [Google Scholar] [CrossRef]
  3. Huang, Y.; Zhang, Y.; Xie, Y.; Zhang, Y.; Gao, X.; Ma, J. Field test and numerical investigation on deep coaxial borehole heat exchanger based on distributed optical fiber temperature sensor. Energy 2020, 210, 118643. [Google Scholar] [CrossRef]
  4. Kharseh, M.; Al-Khawaja, M.; Suleiman, M.T. Potential of ground source heat pump systems in cooling-dominated environments: Residential buildings. Geothermics 2015, 57, 104–110. [Google Scholar] [CrossRef]
  5. Dehkordi, S.E.; Schincariol, R.A.; Reitsma, S. Thermal performance of a tight borehole heat exchanger. Renew. Energy 2015, 83, 698–704. [Google Scholar] [CrossRef]
  6. Capozza, A.; De Carli, M.; Zarrella, A. Design of borehole heat exchangers for ground-source heat pumps: A literature review, methodology comparison and analysis on the penalty temperature. Energy Build. 2012, 55, 369–379. [Google Scholar] [CrossRef]
  7. Liang, B.; Chen, M.; Orooji, Y. Effective parameters on the performance of ground heat exchangers: A review of latest advances. Geothermics 2022, 98, 102283. [Google Scholar] [CrossRef]
  8. Yang, H.; Cui, P.; Fang, Z. Vertical-borehole ground-coupled heat pumps: A review of models and systems. Appl. Energy 2010, 87, 16–27. [Google Scholar] [CrossRef]
  9. Chen, K.; Zheng, J.; Li, J.; Shao, J.; Zhang, Q. Numerical study on the heat performance of enhanced coaxial borehole heat exchanger and double U borehole heat exchanger. Appl. Therm. Eng. 2022, 203, 117916. [Google Scholar] [CrossRef]
  10. Huang, Y.; Zhang, Y.; Xie, Y.; Zhang, Y.; Gao, X. Thermal performance analysis on the composition attributes of deep coaxial borehole heat exchanger for building heating. Energy Build. 2020, 221, 110019. [Google Scholar] [CrossRef]
  11. Robert, F.; Gosselin, L. New methodology to design ground coupled heat pump systems based on total cost minimization. Appl. Therm. Eng. 2014, 62, 481–491. [Google Scholar] [CrossRef]
  12. Nian, Y.; Wang, X.; Deng, Z.; Cheng, W. Estimation method for layered ground thermal conductivity using genetic algorithm based on a 2-D heat transfer model. Energy Build. 2022, 258, 111841. [Google Scholar] [CrossRef]
  13. Hakala, P.; Vallin, S.; Arola, T.; Martinkauppi, I. Novel use of the enhanced thermal response test in crystalline bedrock. Renew. Energy 2022, 182, 467–482. [Google Scholar] [CrossRef]
  14. Zhang, C.; Lu, J.; Wang, X.; Xu, H.; Sun, S. Effect of geological stratification on estimated accuracy of ground thermal parameters in thermal response test. Renew. Energy 2022, 186, 585–595. [Google Scholar] [CrossRef]
  15. Esen, H.; Inalli, M. In-situ thermal response test for ground source heat pump system in Elazığ, Turkey. Energy Build. 2009, 41, 395–401. [Google Scholar] [CrossRef]
  16. Luo, J.; Zhao, H.; Huang, W.; Zhu, Y.; Xiang, W.; Rohn, J. Determination of ground thermal properties for energy piles by thermal response tests. Environ. Earth Sci. 2018, 77, 152. [Google Scholar] [CrossRef]
  17. Hammerschmidt, U. A Quasi-Steady State Technique to Measure the Thermal Conductivity. Int. J. Thermophys. 2003, 24, 5. [Google Scholar]
  18. Bristow, K.; Kluitenberg, G.; Horton, R. Measurement of Soil Thermal Propertieswith a Dual-Probe Heat-PulseTechnique. Adv. Resilient Agric. Syst. Adapt. Mitigating Clim. Chang. 1994, 58, 1288–1294. [Google Scholar]
  19. Luo, J.; Rohn, J.; Xiang, W.; Bertermann, D.; Blum, P. A review of ground investigations for ground source heat pump (GSHP) systems. Energy Build. 2016, 117, 160–175. [Google Scholar] [CrossRef]
  20. Mogensen, P. Fluid to duct wall heat transfer in duct system heat storages. In Proceedings of the International Conference on Subsurface Heat Storage in Theory and Practice, Swedish Council for Building Research, Stockholm, Sweden, 6–8 June 1983. [Google Scholar]
  21. Spitler, J.D.; Gehlin, S.E.A. Thermal response testing for ground source heat pump systems—An historical review. Renew. Sustain. Energy Rev. 2015, 50, 1125–1137. [Google Scholar] [CrossRef]
  22. Li, M.; Lai, A.C.K. Parameter estimation of in-situ thermal response tests for borehole ground heat exchangers. Int. J. Heat Mass Transf. 2012, 55, 2615–2624. [Google Scholar] [CrossRef]
  23. Shim, B.O.; Park, C.H. Ground thermal conductivity for (ground source heat pumps) GSHPs in Korea. Energy 2013, 56, 167–174. [Google Scholar] [CrossRef]
  24. Hausner, M.B.; Suarez, F.; Glander, K.E.; van de Giesen, N.; Selker, J.S.; Tyler, S.W. Calibrating single-ended fiber-optic Raman spectra distributed temperature sensing data. Sensors 2011, 11, 10859–10879. [Google Scholar] [CrossRef] [PubMed]
  25. Roth, P.; Georgiev, A.; Busso, A.; Barraza, E. First in situ determination of ground and borehole thermal properties in Latin America. Renew. Energy 2004, 29, 1947–1963. [Google Scholar] [CrossRef]
  26. Zhang, C.; Guo, Z.; Liu, Y.; Cong, X.; Peng, D. A review on thermal response test of ground-coupled heat pump systems. Renew. Sustain. Energy Rev. 2014, 40, 851–867. [Google Scholar] [CrossRef]
  27. Freifeld, B.M.; Finsterle, S.; Onstott, T.C.; Toole, P.; Pratt, L.M. Ground surface temperature reconstructions: Using in situ estimates for thermal conductivity acquired with a fiber-optic distributed thermal perturbation sensor. Geophys. Res. Lett. 2008, 35. [Google Scholar] [CrossRef] [Green Version]
  28. Fujii, H.; Okubo, H.; Nishi, K.; Itoi, R.; Ohyama, K.; Shibata, K. An improved thermal response test for U-tube ground heat exchanger based on optical fiber thermometers. Geothermics 2009, 38, 399–406. [Google Scholar] [CrossRef]
  29. Acuña, J.; Palm, B. Distributed thermal response tests on pipe-in-pipe borehole heat exchangers. Appl. Energy 2013, 109, 312–320. [Google Scholar] [CrossRef]
  30. Beier, R.A. Vertical temperature profile in ground heat exchanger during in-situ test. Renew. Energy 2011, 36, 1578–1587. [Google Scholar] [CrossRef]
  31. Beier, R.A.; Acuña, J.; Mogensen, P.; Palm, B. Vertical temperature profiles and borehole resistance in a U-tube borehole heat exchanger. Geothermics 2012, 44, 23–32. [Google Scholar] [CrossRef]
  32. Sakata, Y.; Katsura, T.; Nagano, K. Multilayer-concept thermal response test: Measurement and analysis methodologies with a case study. Geothermics 2018, 71, 178–186. [Google Scholar] [CrossRef]
  33. Zhang, Y.; Gao, P.; Yu, Z.; Fang, J.; Li, C. Characteristics of ground thermal properties in Harbin, China. Energy Build. 2014, 69, 251–259. [Google Scholar] [CrossRef]
  34. Zhang, Y.; Hao, S.; Yu, Z.; Fang, J.; Zhang, J.; Yu, X. Comparison of test methods for shallow layered rock thermal conductivity between in situ distributed thermal response tests and laboratory test based on drilling in northeast China. Energy Build. 2018, 173, 634–648. [Google Scholar] [CrossRef]
  35. Zhao, P.; Li, X.; Zhang, Y.; Liu, K.; Lu, M. Stratified thermal response test measurement and analysis. Energy Build. 2020, 215, 109865. [Google Scholar] [CrossRef]
  36. Liu, J.; Shi, B.; Sun, M.-Y.; Yao, J.-C.; Fang, K. A Dual-Probe Heat Pulse Approach using Heated Fiber-Optic Temperature Sensing. IOP Conf. Ser. Earth Environ. Sci. 2021, 861, 022070. [Google Scholar] [CrossRef]
  37. Zhang, B.; Gu, K.; Shi, B.; Liu, C.; Bayer, P.; Wei, G.; Gong, X.; Yang, L. Actively heated fiber optics based thermal response test: A field demonstration. Renew. Sustain. Energy Rev. 2020, 134, 110336. [Google Scholar] [CrossRef]
  38. Wilke, S.; Menberg, K.; Steger, H.; Blum, P. Advanced thermal response tests: A review. Renew. Sustain. Energy Rev. 2020, 119, 109575. [Google Scholar] [CrossRef]
  39. Austin, W.A., III. Development of an In Situ System for Measuring Ground Thermal Properties. Master’s Thesis, Oklahoma State University, Stillwater, OK, USA, 1998. [Google Scholar]
  40. Pahud, D.; Matthey, B. Comparison of the thermal performance of double u-pipe borehole heat exchangers measured in situ. Energy Build 2001, 33, 503–507. [Google Scholar] [CrossRef]
  41. Kyoungbin, L.; Sanghoon, L.; Changhee, L. An experimental study on the thermal performance of ground heat exchanger. Exp. Therm. Fluid. Sci. 2007, 31, 985–990. [Google Scholar]
  42. Kavanaugh, S.P.; Rafferty, K. Ground-Source Heat Pumps: Design of Geothermal Systems for Commercial and Institutional Buildings; American Society of Heating, Refrigerating and Air-Conditioning Engineers: Atlanta, GA, USA, 1997. [Google Scholar]
  43. The Ministry of Housing and Urban-Rural Construction of China. Technical Code for GCHPs. GB 50366-2005; Chinese Building Industrial Press: Beijing, China, 2009.
  44. Lhendup, T.; Aye, L.; Fuller, R.J. In-situ measurement of borehole thermal properties in Melbourne. Appl. Therm. Eng. 2014, 73, 287–295. [Google Scholar] [CrossRef]
  45. Herrera, C.; Nellis, G.; Reindl, D.; Klein, S.; Tinjum, J.M.; McDaniel, A. Use of a fiber optic distributed temperature sensing system for thermal response testing of ground-coupled heat exchangers. Geothermics 2018, 71, 331–338. [Google Scholar] [CrossRef]
  46. Zhang, Y.; Zhou, L.; Hu, Z.; Yu, Z.; Hao, S.; Lei, Z.; Xie, Y. Prediction of Layered Thermal Conductivity Using Artificial Neural Network in Order to Have Better Design of Ground Source Heat Pump System. Energies 2018, 11, 1896. [Google Scholar] [CrossRef] [Green Version]
  47. Gao, P.; Zhang, Y.; Yu, Z.; Fang, J.; Zhang, Q. Correlation study of shallow layer rock and soil thermal physical tests in laboratory and field. Geothermics 2015, 53, 508–516. [Google Scholar] [CrossRef]
  48. Wagner, V.; Bayer, P.; Kübert, M.; Blum, P. Numerical sensitivity study of thermal response tests. Renew. Energy 2012, 41, 245–253. [Google Scholar] [CrossRef]
  49. Gao, P. Analysis of Rock Thermal Physical Parameters and Research on Multi-Field Thermal Effect Coupled Model. Ph.D. Thesis, Jilin University, Changchun, China, 2015. (In Chinese). [Google Scholar]
Figure 1. (a) Study region location. (b) Well position and heating goal on a satellite map.
Energies 15 08101 g001
Figure 2. Combined thermal response test system.
Energies 15 08101 g002
Figure 3. Field thermal response test system. (a) Field testing laboratory. (b) Inside the laboratory. (c) TRT module. (d) DTRT module.
Energies 15 08101 g003
Figure 4. Laboratory test results. (a) Water content. (b) Density. (c) Porosity. (d) Thermal conductivity.
Energies 15 08101 g004
Figure 5. Evolution of the formation temperature with depth. (a) Temperature profile with drilling depth before water circulation. (b) Inlet and outlet temperatures after stable water circulation without a heater. (c) Formation temperature profile after water circulation.
Energies 15 08101 g005
Figure 6. Inlet and outlet time-temperature curves. (a) Condition A. (b) Condition B.
Energies 15 08101 g006
Figure 7. Temperature distribution in the borehole under different time nodes. (a) Working condition A. (b) Ground temperature recovery after working condition A.
Energies 15 08101 g007
Figure 8. Thermal conductivity with depth. (a) Thermal conductivity of the DTRT module. (b) Thermal conductivity of LT.
Energies 15 08101 g008
Figure 9. Average thermal conductivity obtained by three test methods.
Energies 15 08101 g009
Table 1. Main technical parameters of the DOFTS.
ParameterSymbolValue
Measuring range°C−50–150
Resolution of temperature°C0.1
Temperature accuracy°C±1
Spatial resolutionm±0.5
Positioning accuracym1
Input voltageVAC 220 V
Ambient temperature°C−5–40
Table 2. Specific properties of the borehole.
ItemParameterU-Tube
BoreholeVertical depth (m)130
Backfill materialsFine sand, bentonite
Wellhead diameter (mm)150
Table 3. Specific properties of the U-Tube.
ItemParameterU-Tube
PE-pipeOutside diameter (mm)32
Inside diameter (mm)26
Table 4. Test working condition information.
Working ConditionDuration (h)Heat Load (kW)
Undisturbed ground temperature960
A4812
Recovery of ground temperature720
B488
Table 5. TRT results.
TypePipe Depth
(m)
Initial Temperature
(°C)
Working
Condition
Heat Load
(kW)
Thermal Conductivity
(W/(m∙K))
Double-U13010A121.864
B81.859
Table 6. Results of three test methods.
FormationDepth
(m)
LT
(W/(m·K))
TRT
(W/(m·K))
DTRT
(W/(m·K))
Milty clay0–201.166-1.631
Mudstone20–781.653-1.888
Argillaceous siltstone78–941.798-1.862
Mudstone94–1302.001-2.144
Weighted average0–1301.6921.8621.897
Publisher’s Note: MDPI stays neutral with regard to jurisdictional claims in published maps and institutional affiliations.

