Article

Possible Ways of Extending the Biogas Plants Lifespan after the Feed-In Tariff Expiration

1
Department of Industrial Engineering, University of Padova, Via Venezia 1, 35131 Padova, Italy
2
Department of Civil, Environmental and Architectural Engineering, University of Padova, Via Venezia 1, 35131 Padova, Italy
3
Department of Engineering and Management, University of Padova, Stradella San Nicola 3, 36100 Vicenza, Italy
*
Author to whom correspondence should be addressed.
Energies 2022, 15(21), 8113; https://doi.org/10.3390/en15218113
Submission received: 27 September 2022 / Revised: 21 October 2022 / Accepted: 25 October 2022 / Published: 31 October 2022
(This article belongs to the Section A4: Bio-Energy)

Abstract

:
Energy production from biogas can play a pivotal role in many European countries, and specifically in Italy, for three main reasons: (i) fossil fuels are scarce, (ii) imports cover large shares of internal demand, and (iii) electricity and heat production from biogas is already a consolidated business. Nonetheless, in Italy, current legislation and incentive policies on electricity generation from biogas are causing a stagnation of the entire sector, which may lead to the shutting down of many in-operation plants in the years 2027–2028 and the consequent loss of 573 MWel over a total of 1400 MWel. This work aims to investigate the potential of revamping biogas power plants in prolonging operation until the end of the plants’ useful life, regardless of the implementation of a new government’s incentive schemes. Based on the time-series analysis of electricity prices in Italy and a case study representative of the vast set of in-operation power plants, our findings show that 700 plants will likely shut down between 2027 and 2028 unless the government adequately rewards electricity produced and fed into the grid via incentive schemes. In detail, our results show that the investment to revamp the plant exhibits a highly negative Net Present Value.

1. Introduction

The socioeconomic development of humankind is strongly connected to the availability of energy and, consequently, to the access to a number of energy sources at the lowest prices possible. This condition, at the time being, is guaranteed by fossil fuels.
Nonetheless, the ever-increasing population growth is boosting energy demand and, specifically, the request for fossil fuels. This demand is driving up their usage and, consequently, is boosting human-caused carbon dioxide (CO2) emissions at a yearly rate of up to 2%. This trend is unsustainable as greenhouse gas (GHG) emissions are well-known drivers of global climate change.
Therefore, there is an urgent need for strong and effective actions targeted to change how energy is generated and natural resources are managed in order to build a sustainable, decarbonized and digitalized power generation system.
In this view, two worldwide treaties have been signed in the past years (the Kyoto Protocol [1] and the Paris Agreement [2]), but only the member states of the European Union (EU) agreed to set stringent and binding targets for 2020 [3], 2030 [4] and 2050 [5] in order to push the energy transition toward a carbon-neutral economy.
Despite the great efforts set in place by EU members and the achievement of the 2020 targets [3], more than 77% of the EU GHG emissions still derive from the production and use of energy [6], thus making it difficult to achieve the climate targets set for 2030 and the ambitious goal of climate neutrality by 2050.
Consequently, to make a breakthrough in terms of (i) CO2 and GHG emissions abatement, (ii) climate change mitigation, (iii) distributed generation spread, and (iv) jumpstarting the economy after the devastating waves of the COVID-19 pandemic, in 2021, the EU designed the ’European Green Deal’ strategy [7] in response to climate change.
The EU plan is ambitious and challenging because, compared to climate targets set in 2015 under the Paris agreement, which established to cut GHG emissions by at least 40% (compared to 1990 levels) by 2030, the EU has uplifted this target from 40% to at least 55% by 2030 and has made legally binding the achievement of the climate neutrality by 2050.
The above targets are highly demanding. Nevertheless, although the EU set in 2008 to cut emissions by 20% by 2020 (compared to 1990 levels), in 2019, the reduction of emissions reached 24%. In 2020, this favorable trend was further stressed by the COVID-19 outbreak which, due to lockdowns, limited energy consumption in the industrial and tertiary sectors. Consequently, the registered drop reached 31%. The achievement of climate neutrality in less than 30 years is hard but, if realized, it can:
  • guarantee secure and cost-effective energy supplies to EU members;
  • build an integrated, interconnected, and digitalized energy market;
  • spread the energy efficiency concept, enhance the energy performance of buildings and implement a power sector based on renewable energy sources (RES).
Whether implemented, the three latter actions might contribute to increasing the share of renewable energy consumption by up to 32% and spur energy users to switch from consumers to prosumers and self-generate green energy [6].
In this respect, the authors refer to Italy as an illustrative example to prove the exceptionality of the ongoing paradigm change. To comply with the planned targets, Italy is requested to invest in an additional 10 GW of wind (of which 0.9 GW offshore) and 30 GW of solar (of which 0.88 GW of concentrated solar power) by 2030 [8]. It is worth mentioning that at the end of 2020, the total installed power of wind and solar was 10.90 GW and 21.65 GW [9]. Consequently, wind and solar installed power capacity are expected to increase to 23.23 GW and 52 GW, respectively.
The requested investments can likely push the production of RES electricity from 41.7% up to 55% with significant benefits in terms of GHG emissions reduction and improved security in energy supplies. Nonetheless, the intermittent and unpredictable nature of wind and solar demands, in conjunction with their installation, the development of a series of actions to match supply and the demand without incurring strong and unexpected power fluctuations that may generate problems for grid management and control, devices faults and local to global blackouts.
To this end, projections indicate the need for installing approximately 6 GW of centered storage and 4 GW of distributed storage to compensate for the variable and unpredictable RES over-generation [8]. Therefore, a large number of variable RES distributed power plants needs to be paired with the installation of large-capacity cost-effective utility-scale energy storage units to decouple the energy production from its consumption, compensate the power fluctuations, and provide a more regular and predictable power profile [10,11].
As 2030 is approaching fast, there is the need for optimally designing and locating new strategic facilities. In addition, the EU is determined to move an epochal step forward in the energy transition from fossil fuels to renewables, so it is important to ensure both environmental preservation and security of energy supply.
The EU energy security was an under-control and manageable problem until 24 February 2022. After that date, it became a critical issue with the highest priority. On 24 February 2022, Russia started military action against Ukraine. The consequent war has contributed to disrupting the global energy sector and economy and has induced the EU authorities to impose economic sanctions on Russia. This policy move has provoked a cut in Russia’s natural gas export which, in turn, forced the European Commission to act rapidly to prevent and mitigate the effect of an unprecedented energy crisis [12]. The result is the REPowerEU [13]: A plan to rapidly reduce dependence on Russian fossil fuels and fast forward the green transition.
Apart from speeding up the implementation of the European Green Deal [7], the REPowerEU plan aims to reduce the dependence on Russian gas imports by (i) strengthening the imports of liquefied natural gas (LNG), (ii) enlarging the existing gas storage facilities, and (iii) stimulating the production of biomethane.
To this latter is dedicated the ‘biomethane action plan’, which is a series of actions to stimulate the renewable gas value chain and increase biomethane production up to 35 bcm by 2030, including the targets set in the Common Agricultural Policy.
The ‘biomethane action plan’ is a stepping stone to achieving the climate targets, securing the EU supplies, and boosting both the circular economy and job creation. In fact, at the time of writing, the European production of biogas and biomethane has already generated 210,000 jobs and has avoided 60 MtCO2,eq per year of GHG emissions [14]. In addition, biogas power plants guarantee the generation of green electricity and heat, whereas biomethane allows reducing the dependence of EU Member States on fossil fuels in the transport sector. These aspects are fundamental and should be taken into account when designing strategies and energy policies to boost RES installations. In a nutshell, what follows presents the status quo in Italy.
Italy is currently suffering from a severe energy crisis. In light that natural gas imports from Russia reached 40% of the total in 2021, the ‘biomethane action plan’ represents a challenging investment and growth opportunity for the Italian biogas industry because it can give new rise to the investors’ interest in the sector after years of stagnation.
The rapid shrink in the number of biogas installations after an exceptional initial penetration has been caused by two primary reasons. On the one hand, although the incentive scheme, which was set in 2008, had initially favored investments as it guaranteed generous Feed-in Tariffs (FiTs) for fifteen years from the plant’s installation (namely until 2027 for plants starting operating in 2012), its dramatic cut in 2013 made it no longer profitable to invest in biogas plants for producing electricity. On the other hand, (i) the cost of revamping a biogas plant into a biomethane one, (ii) the management complexity and operating costs of the biomethane unit, (iii) legislation which assigns incentives only to biomethane use in transport [15], (iv) a lack of support scheme and a standard gap for biomethane and hydrogen-enriched natural gas injection into the natural gas grid [16,17], and (v) a longly waited for ‘new’ Government decree on biomethane that has been continually postponed have prevented the further development of the Italian biomethane sector. In addition, current legislation puts many limitations to revamping existing or end-of-life biogas plants.
Consequently, there is prominent risk that at the end of the biogas incentive scheme set in 2012, a vast number of biogas plants will be switched off. Their closure, in turn, will likely cause in the period December 2027–June 2028 the loss of more than 570 MWel of biogas installed power over 1400 MWel today in operation. On the one hand, this power loss will half the electricity production from biogas. On the other hand, it will likely be impossible to comply with the power target set for 2020 by the National Renewable Energy Action Plan (NREAP) [18].
For the above reasons, there is an urgent need for alternative solutions to prolonging biogas plants’ operation. These alternatives should address both the issues of preserving the in-operation 573 MWel biogas units after the phasing out of FiT incentives and making a step forward in improving energy efficiency. To this end, this work aims to provide a methodological valuation framework to assess the cost-effectiveness of different options for potentially extending the operational life of existing biogas plants. In detail, to investigate the profitability of investments and determine the cost–revenue trade-offs, the authors analyze a real case study and perform scenario analyses in which they consider the sole plant renovation or the plant revamping combined with installing an organic Rankine cycle (ORC) unit to increase electricity production. Firstly, to estimate the plant’s installment and operating costs, the authors use data obtained from the market analysis they conducted and the surveys they administered to plants’ managers and owners. Secondly, in order to account for the effects of the planned end of the current FiT incentive scheme and estimate the revenues generated by feeding electricity produced into the grid at market prices, they model the stochastic process underlying energy prices by implementing a time-series analysis. To verify the robustness of the results obtained via the scenario analyses and evaluate the impacts of the recent dramatic jump in energy prices on the biogas sector and the whole economy, the authors perform a sensitivity analysis. Finally, as the plant under investigation is representative of a vast set of Italian facilities, to highlight the novelty of this study and support policymakers, the authors provide some insights on potential policy implications of the scenarios under investigation and determine the minimum monetary reward requested for prolonging the operation of existing power plants and making the plants’ revamping. To the author’s best knowledge, this is the first contribution to conducting such an analysis. The remainder of the work is organized as follows. To better highlight the novelty of this work and its contribution to the existing literature, Section 2 briefly reviews the existing literature focusing on both biogas and biomethane, whereas Section 3 draws a picture of the Italian biogas sector accounting for both the number and typology of installations and legislation. In Section 4, the layout of the existing Italian biogas production plant is illustrated. In Section 5, materials and methods are presented, whereas in Section 6, results are reported and discussed. Finally, Section 7 offers the concluding remarks.

2. Literature Review

To the authors’ best knowledge, in the literature, no contribution has proposed and conducted a similar study, not in the biogas sector nor the biomethane one.
The published works on biogas mainly focus on the following:
  • Sector’s status. For example, Benato and Macor [19] provided an analysis of the Italian biogas sector’s trend of development by comparing current incentives to installment and operating costs. A similar investigation was conducted by Ferreira et al. [20] for Portugal, whereas Igliński et al. [21], Kim et al. [22] and Nevzorova [23] analyzed the Polish, Sud Korean, and Russian Federation biogas sectors. Contrary to other authors, Brémond et al. [24] presented a vision for the European biogas sector, whereas Kemausuor et al. [25] described and discussed barriers to biogas development in Africa.
  • Biogas production maximization through the selection of the feedstock type and quantity. For example, Lee et al. [26] analyzed how the pretreatment and the share of organic wastes influence biogas production. Then, to maximize production, they optimized the mixture ratio. A similar study was conducted by Ghouali et al. [27], Song et al. [28] and Asadi and McPhedran [29], while Sarker et al. [30] investigated the critical parameters and their role in the design and operation of biogas production plants.
  • Biogas engines’ performance improvement and emissions reduction. Several works have analyzed the use of biogas in Internal Combustion (IC) engines in combination with other fuels. The scope of such investigations is to reduce fuel consumption and emissions. For example, Nathan et al. [31], Barik and Murugan [32], and Yilmaz and Gumus [33] investigated the effects of adding biogas to diesel on IC engine performance and emissions, whereas Bui et al. [34], Benaissa et al. [35], and Sharma et al. [36] conducted a similar analysis but considering the enrichment of biogas with hydrogen. Contrary to others, Deheri et al. [37] focused their attention on reviewing the available literature on IC dual-fuel engines working with biogas and hydrogen. Finally, Macor and Benato [38,39,40] measured the biogas IC engine regulated and unregulated emissions, performed a risk and human health toxicity assessment and computed the cost to reduce the emissions’ toxicity on human health.
  • Life Cycle Assessment (LCA). In this research field, there are researchers that conducted LCA analysis of the entire industrial scale co-digestion biogas plants (e.g., Bartocci et al. [41]) or others that focused on a specific bio-product; as an example, Rehl and Müller [42] analyzed the digestate. Reviews are numerous also. As an example, the review by Hijazi et al. [43] is centered on LCA for biogas production in Europe, while Aziz et al. [44] focused on Malaysia. Esteves et al. [45] reviewed the works dealing with LCA and manure for biogas production, and Starr et al. [46] focused on the LCA of biogas upgrading technologies.
  • Economic aspects. O’Connor et al. [47] analyzed the economic feasibility of small-scale biogas plants located in Europe, and Trypolska et al. [48] performed a similar analysis but centered on agricultural biogas production by Ukrainian farms. Barbera et al. [49] explored the techno-economic feasibility of a micro-scale biogas plant integrated with microalgae cultivation for treating the organic part of the municipal waste. Winquist et al. [50] evaluated the business opportunities for the Finish market offered by biogas.
Biomethane is a deeply investigated fuel as well, and several works can be found in the literature. The research on biomethene mainly covers the following topics:
  • Potential production. As an example, Sun et al. [51] firstly evaluated the potential production of biomethane from crop residues in China. Then, they analyzed how this fuel could contribute to the achievement of carbon neutrality. Zhu et al. [52] investigated the effects in different countries of promoting biomethane production by upgrading from agricultural biogas. Xue et al. [53] compared the European with the Chinese experience in the biomethane sector and the potential of their acquired knowledge exchange. Dale et al. [54] analyzed how to expand biomethane production sustainably and considered its potential impacts in different countries. There are also some contributions in the literature dealing with the estimation of the biomethane potential for transport purposes (see, e.g., Argalis and Vegere [55]) and studies that specifically focused on the design of strategies and support policies to boost biomethane production (see, e.g., Schmid et al. [56]).
  • Upgrading technologies. This is a really hot topic, because there is an urgent need for efficient and cost-effective technologies for upgrading biogas into biomethane. In fact, several review papers in the literature address this issue. As an example, Rodero et al. [57] presented a review of biogas’ purification-and-upgrading technologies. In addition, Khan et al. [58] focused on the available technologies for direct biomethane use, and Angelidaki et al. [59] provided an analysis of the currently available technologies and investigated the emerging ones. By contrast, Zhao et al. [60] concentrated their attention on the recent technological advancements in biogas upgrading. Ahmed et al. [61] reviewed upgrading technologies and examined their utilization and related economic aspects. The latter issue is also addressed by Lombardi and Francini [62]. Nonetheless, in their work, the attention is posed on both economic and environmental concerns and drivers. Differently from the others, Kapoor et al. [63] and Golmakani et al. [64] analyzed the future perspectives of biogas upgrading. Nevertherless, Golmakani et al. [64], to clarify the current situation and suggest a future outlook, expanded the study to biogas cleaning and biomethane utilization, computing the global warming potential of various biogas upgrading technologies.
  • Economic and socioeconomic aspects. Apart from the economic analyses conducted on biogas upgrading technologies, it is important to highlight that there are studies that compare the profitability of (i) biogas upgrading with its use for electricity generation (see, e.g., Budzianowski and Budzianowska [65]), (ii) biomethane grid injection with biomethane liquefaction (e.g., Ref. [66]), and (iii) biomethane production conditional to the presence or the absence of incentive schemes (e.g., Ref. [67]). There are also investigations devoted to assessing the economic viability of biogas–biomethane from animal residues supply chain (e.g., Ref. [68]) or focused on the socioeconomics of biomethane use in the transport sector (e.g., Ref. [69]).
  • Life Cycle Assessment. The studies embeddable in this research branch are numerous. They range from LCA of biomethane [70] to comparison based on LCA analysis of biowaste-to-biomethane and biowaste-to-energy [71]. There are also investigations focused on analyzing from the LCA perspective (i) the upgrading of biogas into biomethane [72], (ii) the production of biomethane from lignocellulosic biomass [73], or (iii) microalgae grown in municipal wastewater [74].
The above-mentioned works represent only a small quota of the contributions in the literature focusing on biogas and biomethane. Nonetheless, they clearly show that biogas is a hot topic. The review conducted reveals indeed that no contribution so far has evaluated the techno-economic feasibility of extending the biogas plants’ life after the phasing out of incentives without revamping the existing plant into a biomethane unit but rather implementing plants’ modifications targeted to improve the overall efficiency. The novelty of this contribution resides in that the authors show that existing biogas plants can be revamped cost-effectively to improve their efficiency and prolong operation for up to 30 years. This work focuses on Italian biogas production plants. Nonetheless, the proposed valuation framework can be adopted and implemented in the evaluation of alternative investment strategies in other countries.

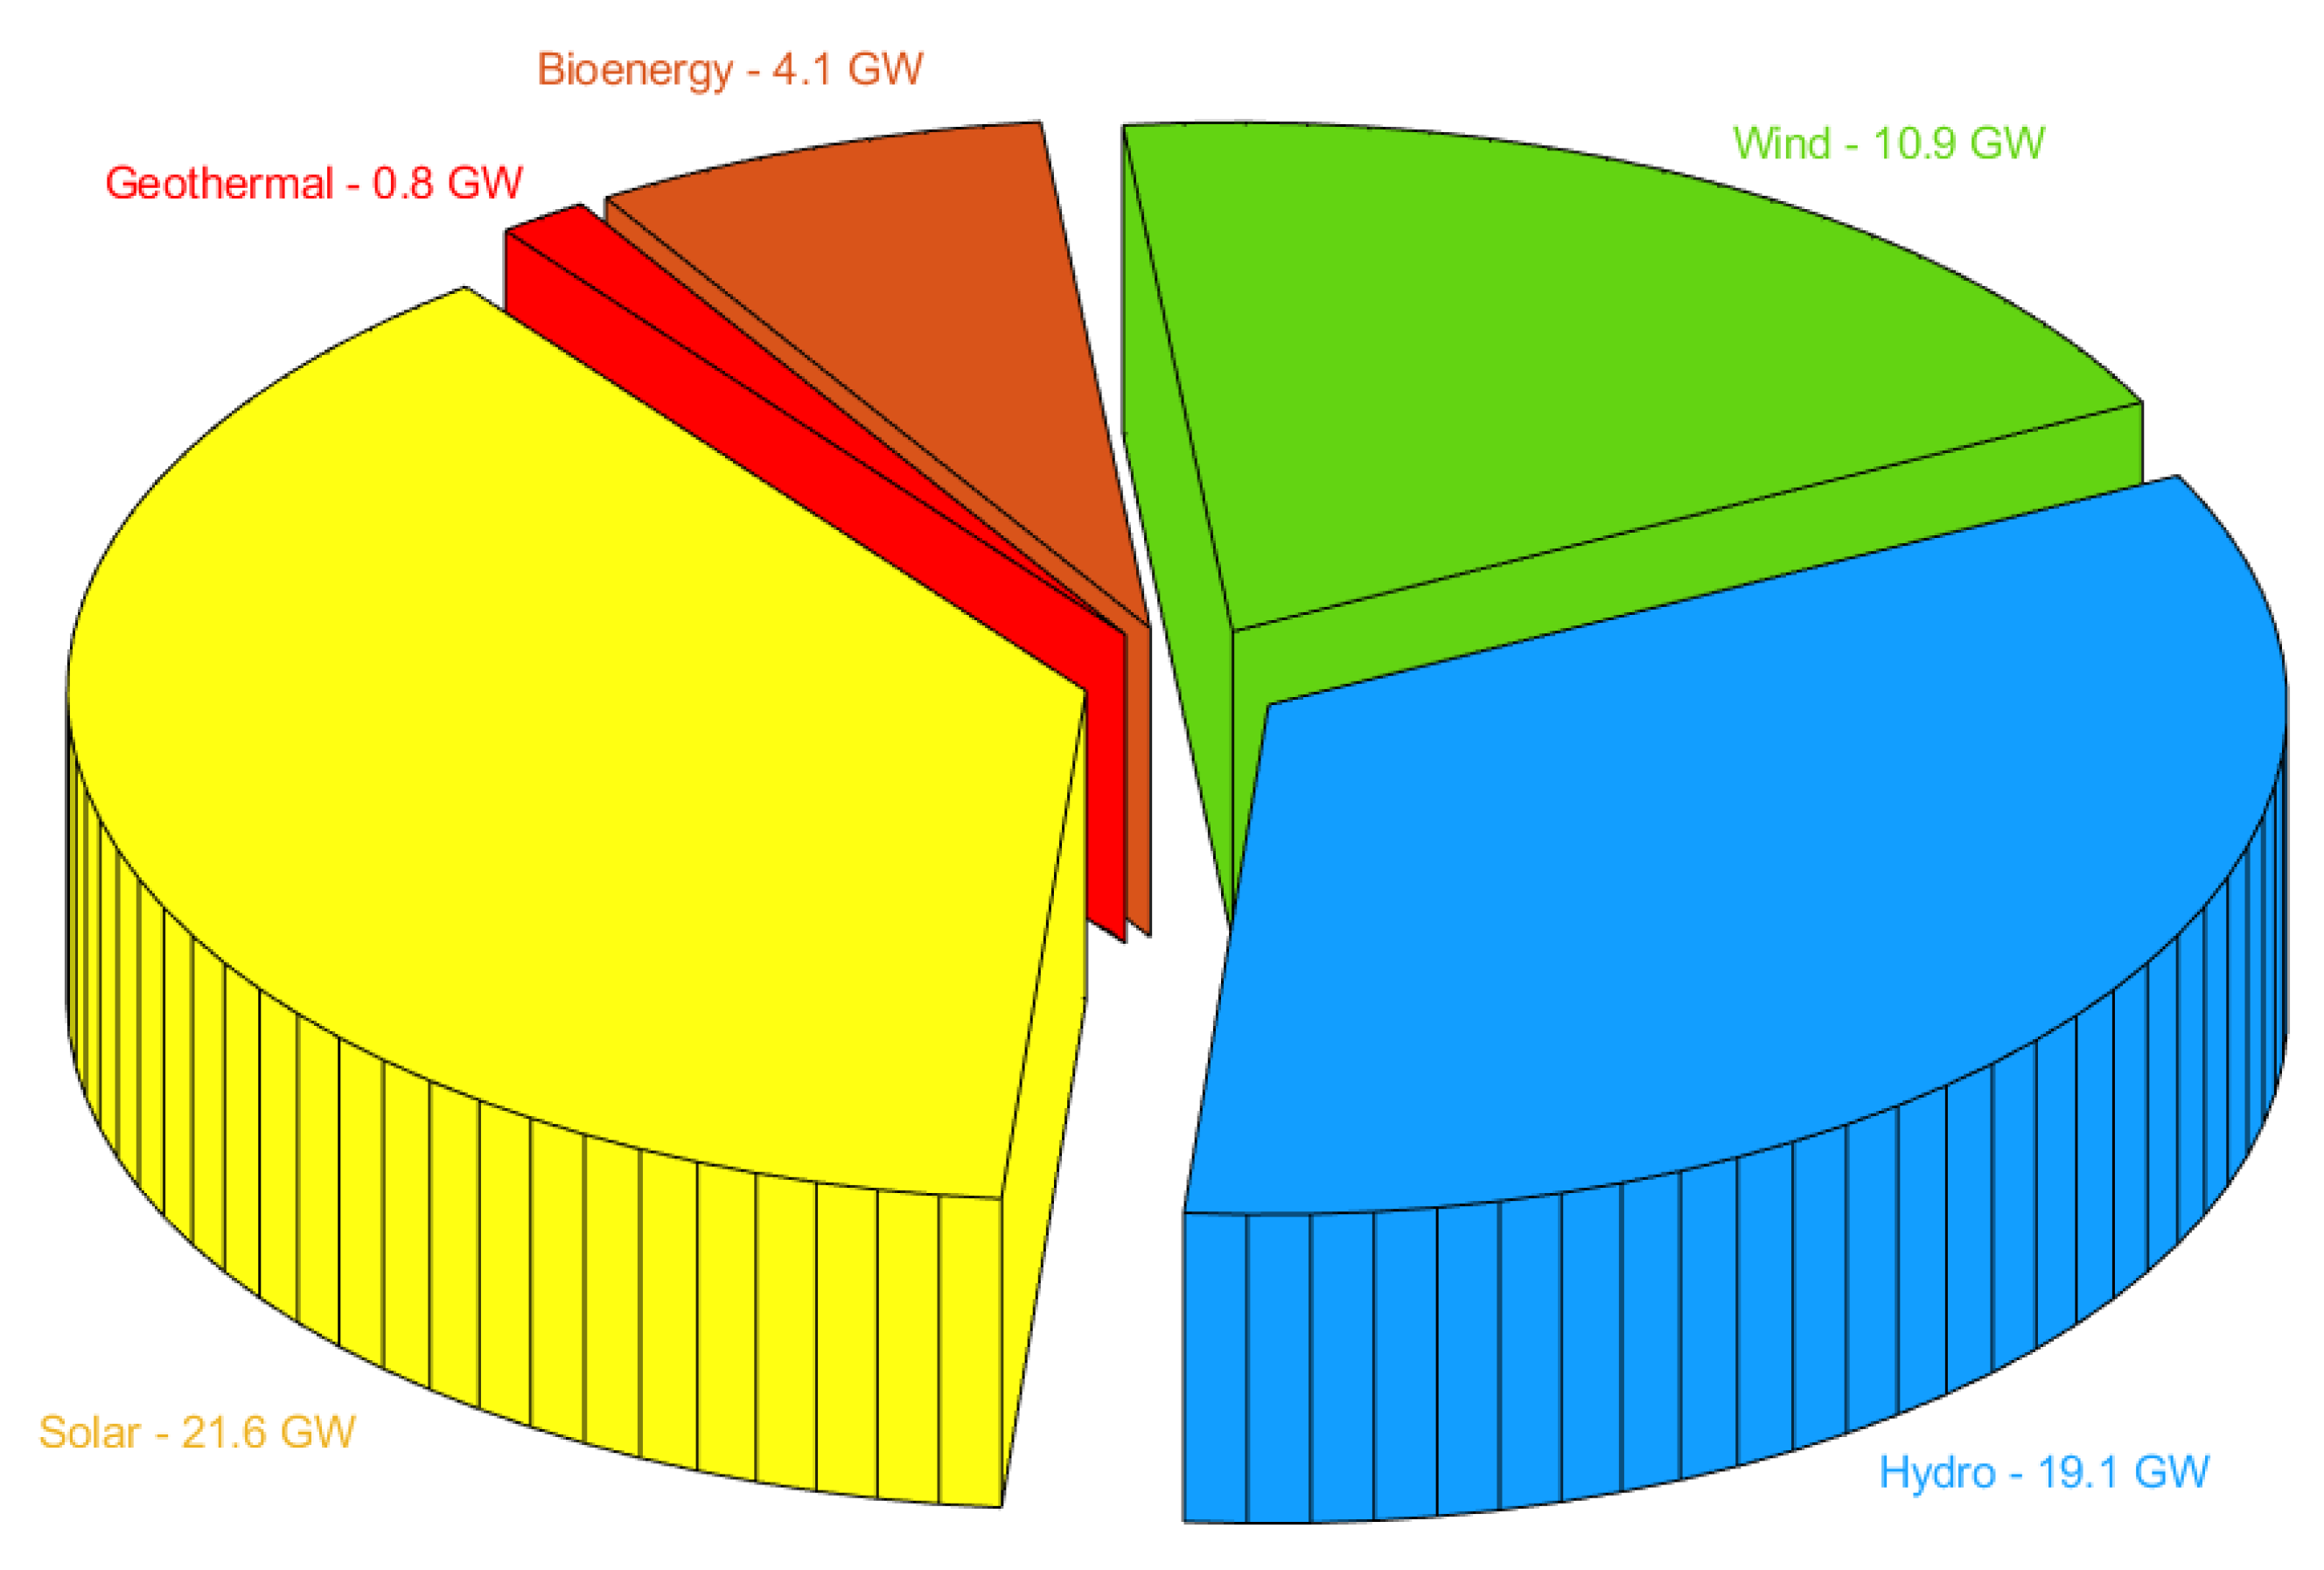
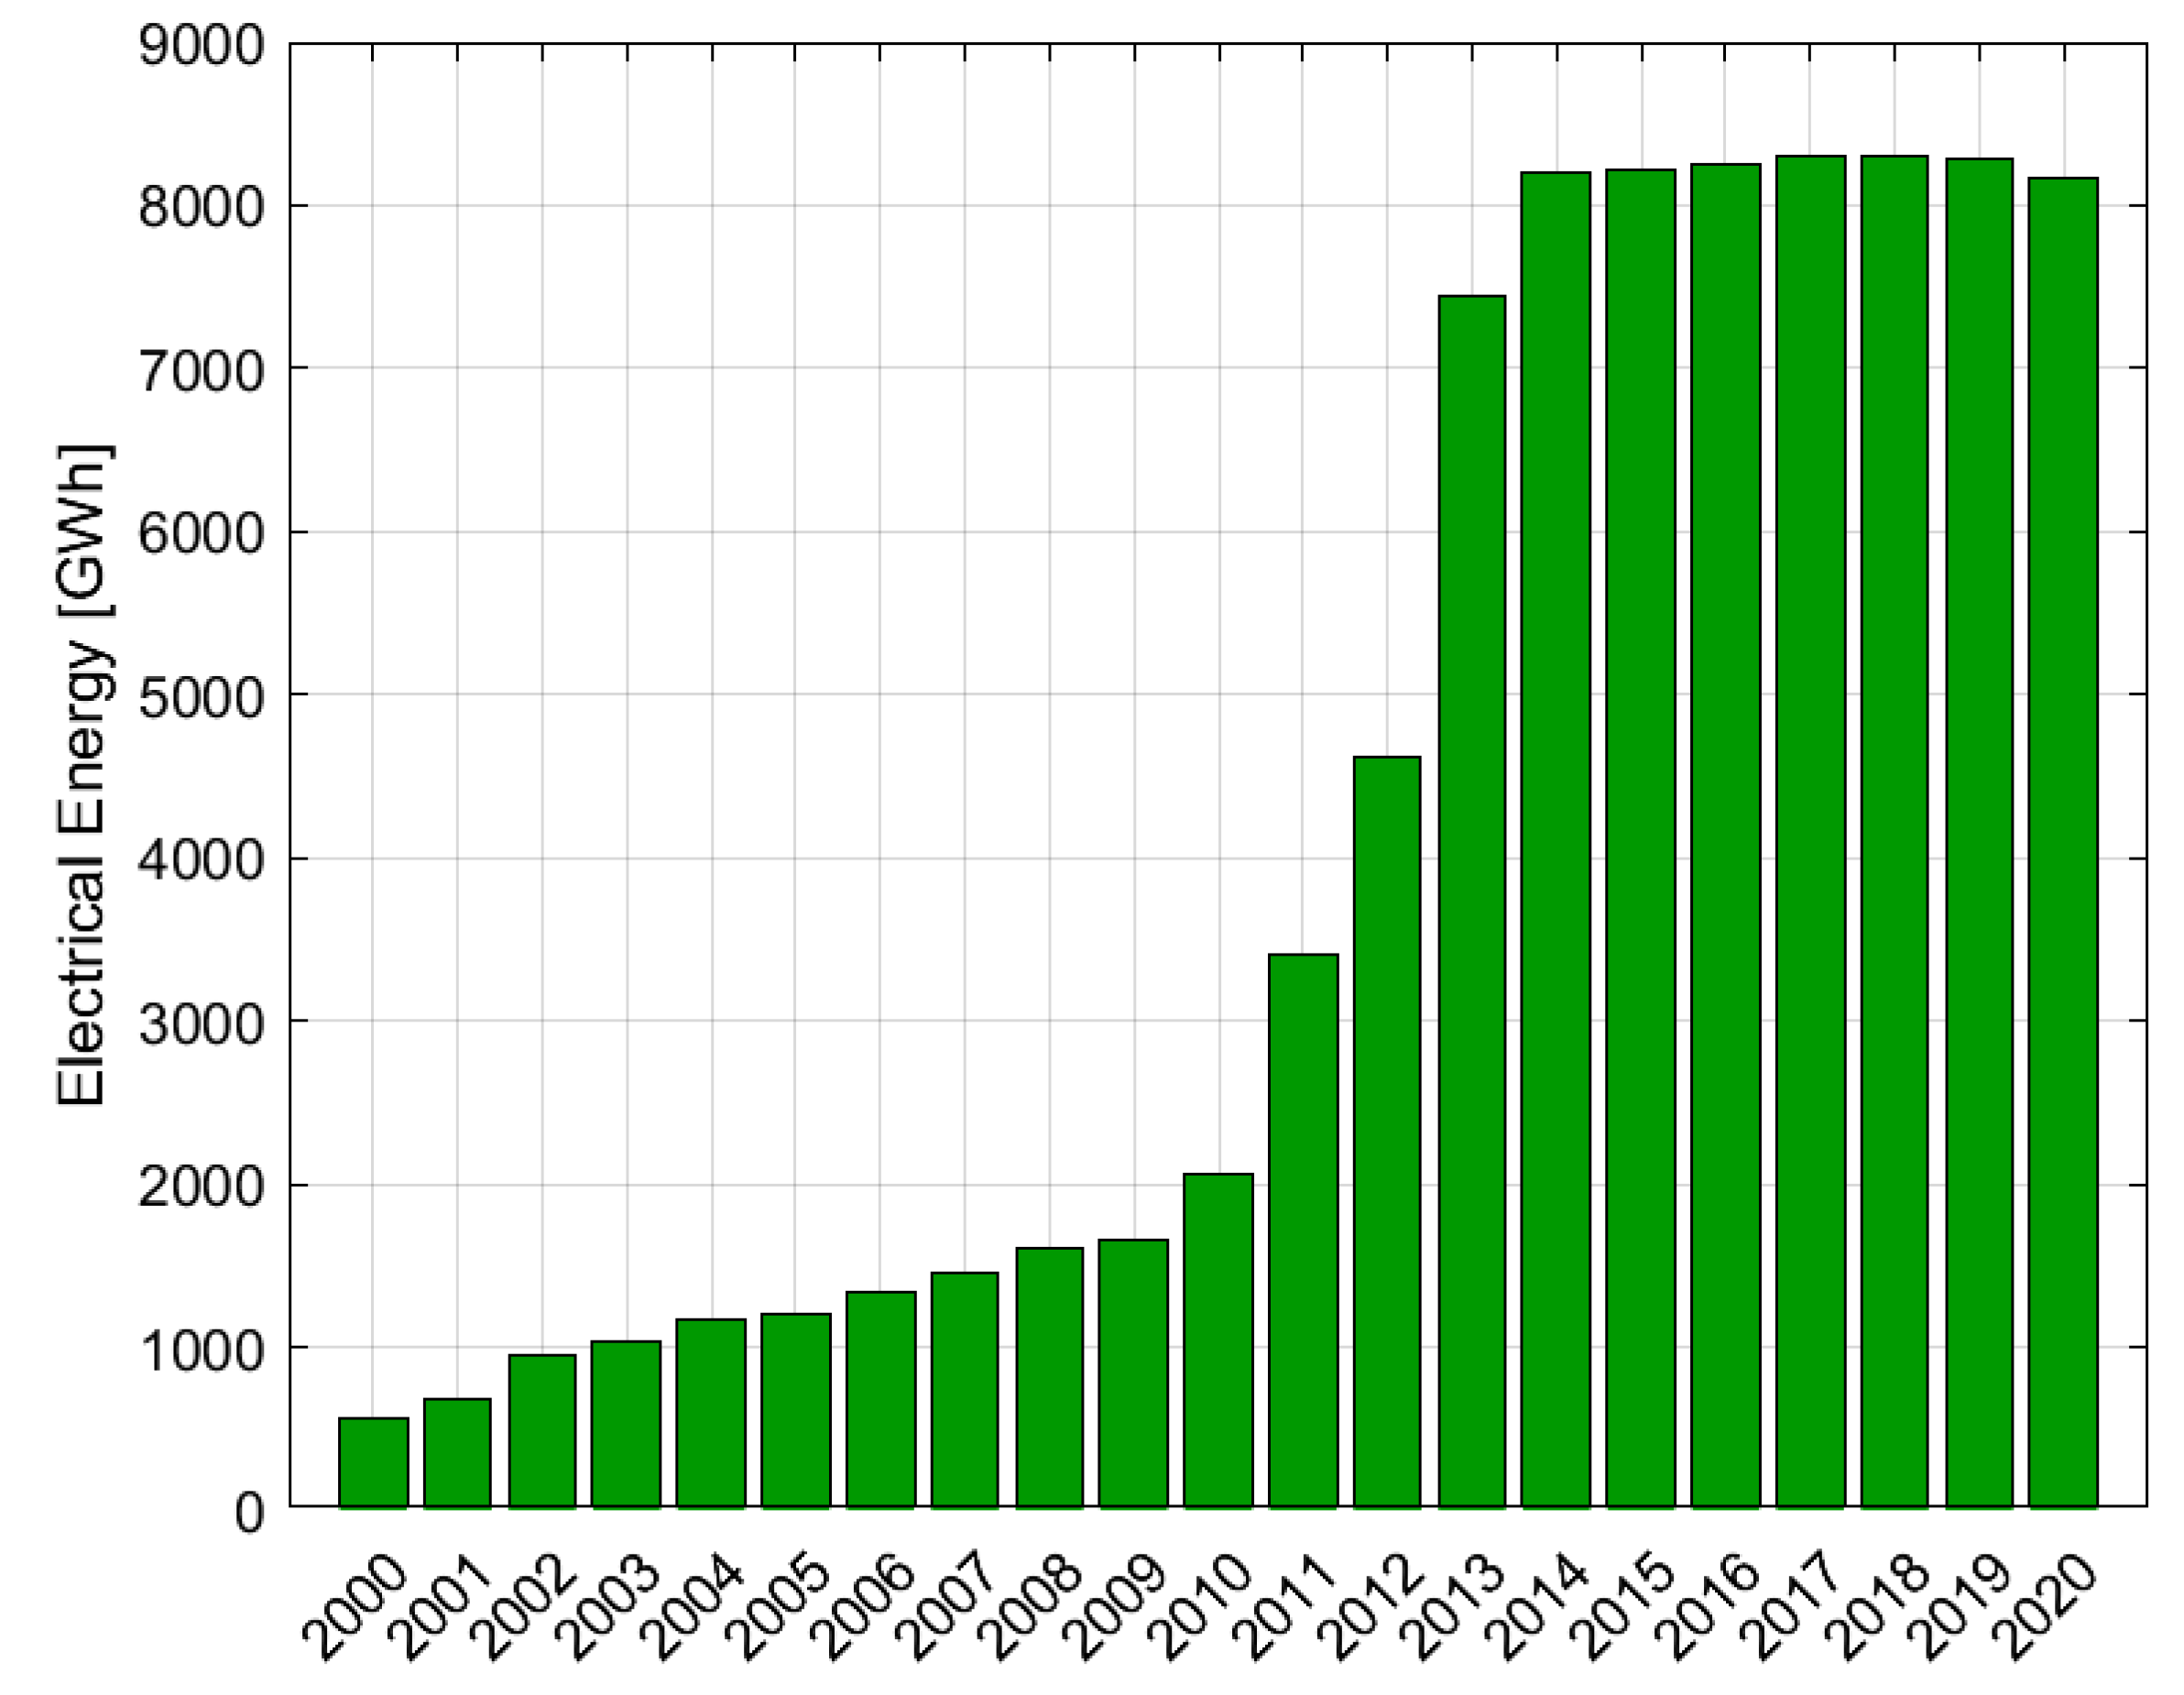
3. The Biogas Sector in the Italian Renewable Energy Context: Trend, Legislation and Subsidies

In 2020, the gross installed power of the Italian generation units reached the 119.108 GW [75]. As shown in Figure 1, 10.907 GW and 21.650 GW derive from wind and solar energy, respectively, whereas 19.106 GW are produced by hydroelectric power. The geothermal quota accounted for 0.817 GW, while bioenergy amounted to 4.106 GW. Therefore, the 47.5% of the Italian gross installed power (56.586 GW) is of renewable origin [9].
Despite the consistent RES installed power, fossil fuels are the main contributors to domestic electricity production with 53.5% of the total (150 TWh over 280 TWh) and, among them, natural gas is the leader. As depicted in Figure 2, electricity generated via natural gas combustion amounted to 47.8% of the total (134 TWh over 280 TWh), whereas the contribution of coal and oil was less than 6% as a whole. This context reveals, on the one hand, the policy target of switching to less polluting fossil fuels (i.e., natural gas) and, on the other hand, a lack of diversification that puts at risk the country’s energy supplies and, subsequently, its economic growth. The war in Ukraine (24 February 2022) and the cut in Russian natural gas exports to Europe in response to the imposed international sanctions have exacerbated concerns about the country’s energy security and the energy crisis.
Electricity generation from RES is universally viewed as the solution to cut GHG emissions and secure the energy supply. In 2020, RES energy produced was 41.8% of the total: More than 40% came from hydropower, whereas the contribution of wind and solar was equal to 21.3% and 16%, respectively.
Despite the solar and wind installed power being 5 and 2.6 times higher than bioenergy (Figure 1), the latter generated 19.6 TWh: 5% more than wind and solely 25% less than solar. Therefore, as the contribution of solar and wind was 6.7% and 8.9%, respectively, bioenergy contribution to Italian electricity production was indeed comparable (i.e., 7%).
Figure 2 shows that biogas production plants generated 8.1 TWh. In other words, 41.6% of the electricity produced by bioenergy came from biogas. Consequently, it is crystal clear that biogas has a pivotal role in the Italian electricity generation sector. In light of the above consideration, there is an urgent need for a strategy to prevent the shutdown of existing biogas units and, in turn, of their green electricity production share. To this end, it is fundamental to investigate either the evolution of the biogas sector over the years or the factors that pushed or blocked biogas installations.
Within the EU biogas sector, Italy is one of the leading countries thanks to 2201 plants, generating 1452 MWel of installed power and 8166 GWh of generated electricity [76].
The biogas sector represents a leading sector in Italy also; among the existing 2944 bioenergy plants, 2201 are biogas facilities. Although biogas ranks second (1452 MWel) after solid biomass (1688 MWel) and before bioliquids (965 MWel) if the installed power is assumed as a benchmark [9], biogas is prominent in terms of electricity production. As depicted in Figure 3, since 2013, biogas has been the major contributor to bioenergy electricity generation: on average, starting from 2014, it has generated yearly more than 41% of the bioenergy-based electricity (8.16 TWh over 19.5 TWh), which is immediately followed by solid biomass (6.5 TWh) and bioliquids (4.6 TWh).
Apart from 2010–2014, the Italian biogas sector boasts a complex evolution over the years. The first biogas installations dated back to the early 1990s to produce electricity by cogeneration, i.e., by burning biogas produced in an internal combustion engine.
Despite efficient technology, the number of biogas plants did not register a significant increase in the 1990s. From 1995 to 1999, electricity production from biogas rose by 45–50 GWh per year. This low growth induced the Italian Government to design an incentive scheme (i.e., the green certificate system) to support the sector development [77]. Nonetheless, regardless of the efforts made by the government and the funds that it made available, the increase in average electricity annual production from biogas was 110 GWh between 2000 and 2008 (Figure 4).
Regardless of green certificates, though, the registered small biogas growth forced the Italian government to implement a challenging set of actions. In the Budget Act of 2008 [78] and in the ARG/elt 1/09 [79], electricity generators of an installed power of 1–999 kW (0.2 MW for wind energy) were entitled to a so-called ’All-inclusive Feed-in Tariff’ as an alternative to green certificates. The incentive policy introduced in 2008 guaranteed both FiT and green certificate payments for 15 years to any plant which would have started operation before 31 December 2012 (deadline postponed to 30 June 2013).
In a nutshell, the biogas plants with a design electric power of 1–999 kWel were eligible to receive (i) 0.18 € kWh−1 for landfill waste as feedstock or (ii) 0.28 € kWh−1 for biomass substrate such as agricultural, livestock, or forestry bio-products collected in an area of 70 km around the biogas unit.
Comparing the Italian incentive policy with the EU Member States’ policy, it emerges that the Italian government set a very generous incentive scheme, which finally shook the sector.
Figure 5 highlights how in five years (2008–2012), the number of plants and the installed power rose from 107 to 1548 and from 55 MWel to 1343 MWel, respectively. Due to these new installations, biogas electricity production increased from 1000 to 4620 GWh (Figure 4).
The incentive scheme introduced by the government, which differentiated FiTs based on both the feedstock substrates and the plant’s size, generated a rapid increase in the number of biogas facilities fed via agricultural feedstock such as energy crops (Figure 6). As the vast majority of energy crop production is located in northern Italy, biogas power plants are, in turn, preferably located in this geographical area.
Consequently, as shown in Figure 7, in 2020, more than 77% of electricity production from biogas was indeed concentrated in northern Italy, namely in Lombardia, Veneto, Emilia Romagna, and Piemonte. In addition, the generous FiT paid to plants of design power lower than 1 MWel favored the market penetration of biogas plants of an IC engine nameplate power of 999 kWel, producing heat and electricity. This type of plant represented the best alternative from a techno-economic perspective. The electricity produced by co-generation is fed into the grid at a fixed price of 0.28 € kWh−1 with dispatching priority, whereas the heat is used to control the temperature of the anaerobic digestion process.
In a nutshell, the unprecedented growth of biogas production over the years 2012–2013 contributed definitively to the development of the biogas sector and, specifically, of agricultural biogas in Italy. The combustion of biogas in IC engines (preferably of 999 kWel of nameplate power) to generate heat and electricity was ripe to become the more prominent and profitable solution to comply with the EU 2020 climate targets in terms of installed power (Figure 8).
It is worth noting that the 2020 annual target for RES set in the Italian NREAP [18], which transposed Directive 2009/28/EC [3], was already achieved in 2012 (i.e., eight years in advance of the deadline). It is, therefore, evident that the incentive policy set by the Italian government was effective in reaching the objective, although it was not cost-effective, as widely debated in academia.
A new incentive policy entered into force on 1 January 2013 [80] and introduced a dramatic cut on FiTs, especially for plants of design power lower than 1 MWel. As described in detail in Ref. [19], this action shocked the sector and practically blocked the construction of new biogas power plants (Figure 8). Consequently, energy production from biogas registered an abrupt decrease starting in 2014 (Figure 4).
Finally, in 2016, a revision of the above incentive policy introduced an additional reduction of FiT incentives, thus definitively interrupting the sector growth ( Figure 4 and Figure 5). Unfortunately, neither EU nor national sector regulations succeeded in overcoming this persistent stagnation state.
The situation is becoming more critical due to the near expiration of FiTs, which were initially guaranteed to plants built before the end of 2012 (deadline updated to June 2013).
According to recent projections, between the second semester of 2027 and the first semester of 2028, approximately 700 in-operation biogas plants will shut down. Figure 9 illustrates the expected share of plants and the relative installed power that might be potentially foregone in 2028, thus causing a reduction by approximately 40% of the total installed power (573 MWel over 1452 MWel). There is indeed consensus on the need for incentive schemes to prevent this loss in power installation and overcome the existing structural barriers to both biogas plant revamping for electricity production and biogas upgrading to biomethane.
Nonetheless, it is worth noting that the loss of over 570 MWel would imply a loss of approximately 4 TWh (over 8 TWh) of renewable electricity. It might be of utmost importance, though, to investigate whether the revamping of biogas plants to generate electricity represents a sustainable alternative to biogas upgrading to biomethane. The advantages of undertaking this investment strategy are multiple:
  • a PV plant of 50 MWp design power occupies approximately 95–105 hectares and costs 60–65 M€ [83]. The replacement of energy production from biogas plants, potentially switched off in 2027–2028, would require an investment cost of about 650–700 M€ and an area of about 1100–1200 hectares. The latter is a decent amount of land hard to find in Italy, especially considering that PV power should increase from 23 to 52 GWp by 2030 to comply with national climate targets.
  • Biogas production is programmable and predictable, wheras PV production is intermittent and depend on seasonality. Indeed, a biogas plant can operate for over 8000 h per year. By contrast, PV power plants function for approximately 1200–1250 h annually.
  • To make PV energy production more flexible and increase self-consumed energy quotas, storage units are necessary. Storage increases investment costs and may generate management issues.
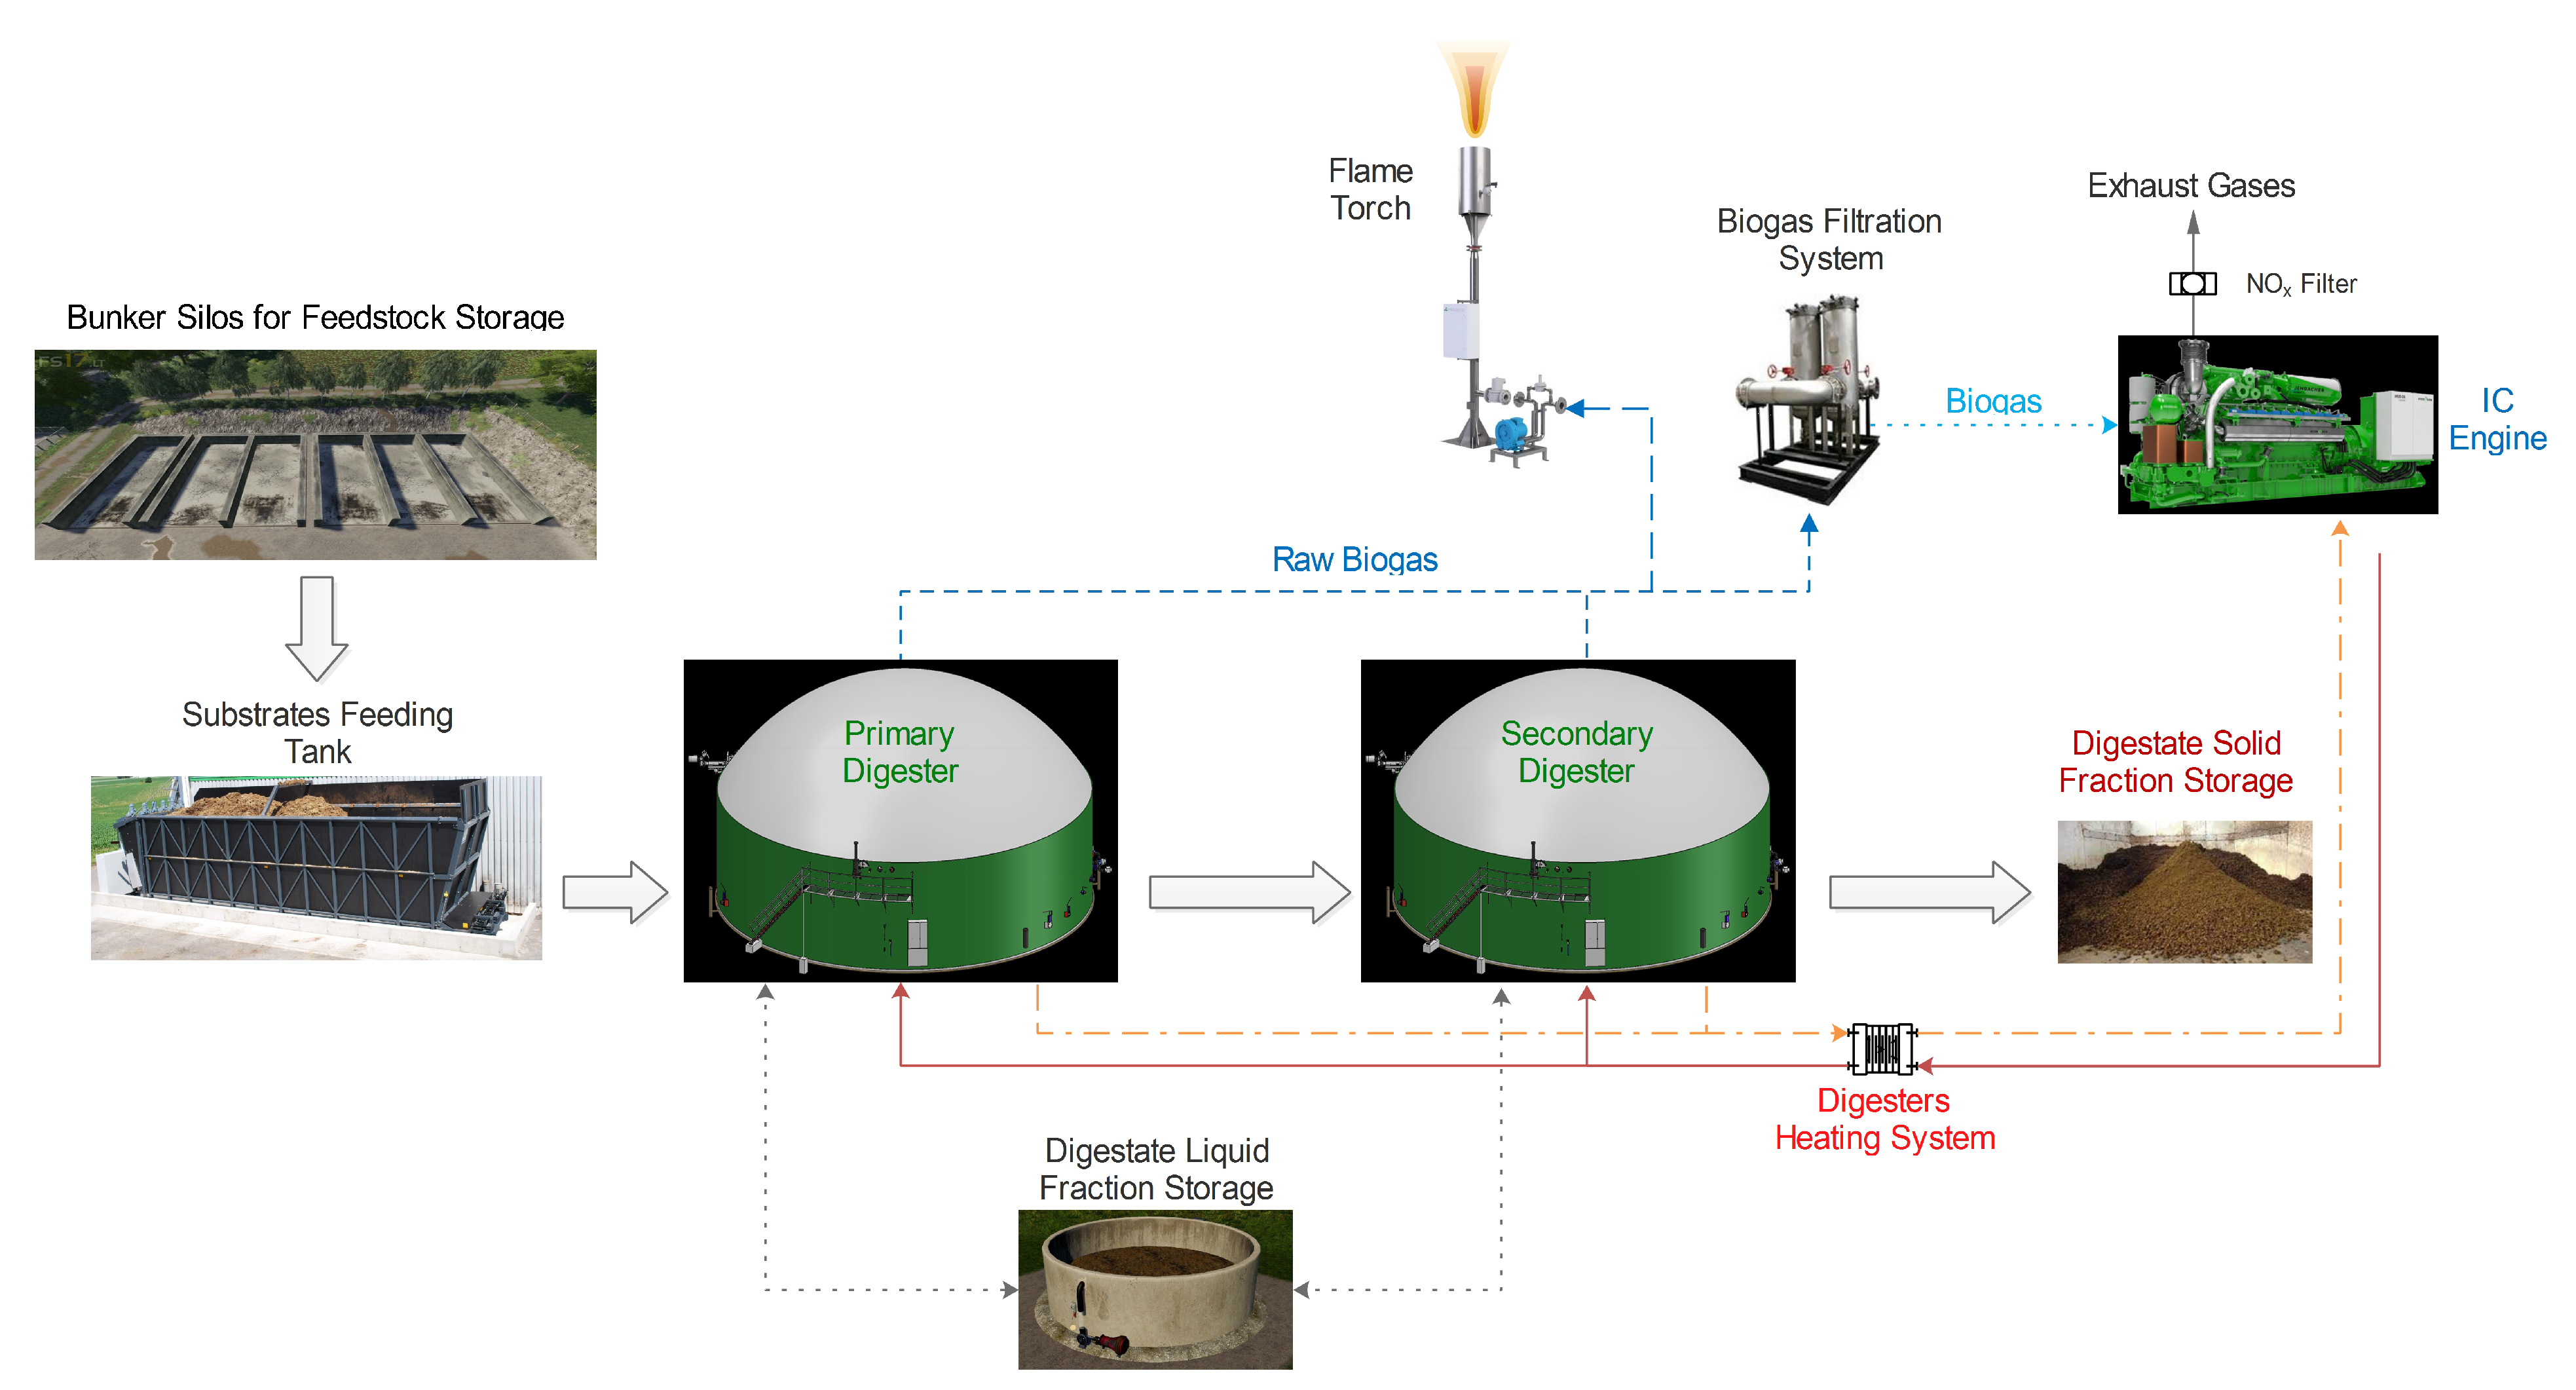
Therefore, the preservation of installed biogas power via a repowering process and by adding waste heat recovery units (WHRUs) to increase electricity production will definitely contribute to: (i) avoiding the installation of over 570 MW of PV facilities, thus reducing land consumption; (ii) bypassing the need for energy storage, being biogas programmable and characterized by a high load factor; (iii) improving the energy efficiency of biogas facilities, though not increasing fuel and feedstock consumption; (iv) reducing CO2 emissions per unit of generated electricity; (v) cutting down installation costs, and (vi) guaranteeing biogas economic sustainability.

4. Plant Structure

Figure 10 depicts the structure of a 999 kWel biogas facility in which different feedstocks such as energy crops and manure are co-digested. As previously said, 999 kWel is the most widespread design power for biogas power plants in Italy because of the incentive policy established for the period 2008–2012, which assigned very generous FiTs that made this plant’s nameplate power the most profitable.
The 999 kWel biogas facility is made up of the following: a series of bunker silos for storing the feedstock, a substrate feeding tank, two primary digesters, two secondary digesters, a digestate solid fraction storage and a liquid one, a biogas filtration system, a flame torch, and an IC engine.
Maize and wheat silage, triticale, corn flour, sugar beets, chicken dung, and cattle manure are typical feedstock used in Italian biogas facilities. These substrates are generally stored in bunker silos. If the plant adopts cattle and pig sewage in addition to energy crops and manure, this feedstock is stored in underground sealed tanks to avoid any unpleasant odor.
The daily quantity of feedstock necessary to feed the plant is loaded in the substrates feeding tank and, after being mixed, it is sent to the primary digesters. After a certain amount of time, the digestate is sent to the secondary digesters. Inside the primary and secondary digesters, the feedstock and digestate are continuously mixed with mechanical stirrers. The mixing promotes the anaerobic digestion process.
Generally, both primary and secondary digesters are cylinders. The cylinders’ walls are characterized by a height of 6 m (green part in Figure 10). The internal diameter of primary digesters is 23 m, whereas that of secondary digesters is 26 m. The roof of both primary and secondary digesters is a semi-flexible dome that has the scope of collecting the raw biogas produced by the anaerobic co-digestion of energy crops and manure.
To guarantee a stable and continuous anaerobic digestion process, it is necessary to maintain the temperature inside the digesters in the range 35–40 °C. In order to keep the inside temperature and accommodate both heating tubes and a set of multiple layers of non-conductive materials, the digesters’ walls present a thickness of 0.7 m.
As shown in Figure 10, the hot water circulating into the above tubes is heated up with the IC engine waste heat. Thanks to the recovery of the engine’s cooling water and lubricating oil, it is possible to produce hot water to heat the digesters and, in turn, guarantee stable and continuous biogas production.
The liquid part of the digestate is continuously recirculated between primary and secondary digesters thanks to the digestate liquid fraction collecting tank, whereas the digestate solid fraction is collected into storage silos after being squeezed. Usually, this substrate is spread to make the soil fertile and usable for energy crop production.
Raw biogas is firstly collected into the digesters’ domes and, subsequently, it is filtered. Finally, biogas is sent to the IC engine to be burnt. In the event of an emergency or an IC engine fault, raw biogas is burnt directly in the flame torch.
The IC engine nameplate thermal power is 2.4 MW, whereas the electric one is 0.999 MWel. The engine rotates at a constant speed equal to 1500 rpm and is coupled directly with the electric generator. The generated electricity is mainly delivered to the national grid apart from the amount needed to maintain the facility in operation (the so-called plant self-consumption). The IC engine usually runs at least 8000 h per year at full load. In terms of service, the lubricating oil is changed every 3000–4000 h of operation depending on the biogas quality, whereas significant maintenance works are necessary after 60,000 h.
As said, a portion of the engine’s heat is recovered to heat the digesters, while the exhaust gases’ heat content is generally wasted. The heat released to the environment is not negligible considering that the exhaust gases temperature ranges between 460 and 500 °C, while the mass flow rate exceeds 5300 kg h−1.
To maintain the nitrogen oxides (NOx) below limits imposed by regulation, the exhaust gases flow through a nitrogen dioxide filtration system (NOx filter in Figure 10) before being released into the environment.
Only rarely is the exhaust gas heat content recovered through a WHRU. This device is a gas-to-liquid heat exchanger. As described in Ref. [19], the WHRU can be used to produce:
  • Hot water or steam that can be directly delivered to a thermal user;
  • Hot water used as heat source for an organic Rankine cycle turbogenerator. In this case, the ORC presents a design power of 70 kWel and, to obtain the maximum incentive possible, the engine is operated at 929 kWel instead of 999 kWel. This configuration is adopted to reduce the engine biogas consumption and, subsequently, the feedstock quantity (up to 10%). However, as demonstrated by Benato and Macor [84], the direct recovery of the exhaust gases heat content operated at full load allows the installation of an ORC with a design power up to 137.8 kWel. The ORC installation, in turn, guarantees an additional “green” electricity production without consuming the land. In addition, waste heat recovery reduces thermal pollution and permits cutting emissions per unit of generated electricity.
It is important to note that both solutions are rarely adopted due to the absence of a thermal user (biogas plants are generally located in remote areas) or because of mistrust in the ORC technology. In particular, the installation of an ORC complicates plant management as it requests specialized technicians, thus increasing operating and maintenance costs.
Nonetheless, it must be stressed that the ORC technology has enormously advanced compared to 10 years ago and, subsequently, the advantages introduced by its maturity are higher than the drawbacks. In addition, a massive spread of ORCs in the biogas sector will allow a standardization of the unit (as it has occured for IC engines) and a reduction in investment and operating and maintenance costs. Based on the above considerations, the authors propose ORC technology as a strategic system to favor biogas plants’ revamping, increase production and improve their efficiency.

5. Materials and Methods

In this study, the biogas facility under investigation is an in-operation 999 kWel plant located in the northern part of Italy. The layout of the plant is described in Section 4 and depicted in Figure 10. The facility is one of the 20 units monitored by the authors since 2016. This plant is representative of the majority of biogas plants installed in Italy since 2010. Consequently, the valuation framework here proposed can be adopted for a wealth of similar case studies and provide valuable indications to both the owners of existing plants and policy implications to the government for the design of optimal incentive policies.
To support the plant’s owner in the decision of whether to shut down its plants or to continue operation, the authors consider different scenarios and assess their profitability based on the Net Present Value (NPV) rule. According to the NPV rule, an investment opportunity is worthwhile whenever the present value of its future payoffs PV is greater than the investments costs I, that is:
N P V = P V I > 0
where P V is defined as
P V = i = 1 T ( Π i ) ( 1 + r ) i = i = 1 T ( R i C i ) ( 1 + r ) i
while Π i is the net revenues at year i, R i is the revenues at year i, C i is the operating costs at year i, T is the investment lifespan and r is the discount rate.
In detail, the useful life of the plant under investigation is 30 years. In accordance with data collected from plants’ managers in Italy, which report for analogous biogas plants an average number of operating hours per year ranging from 8440 to 8554 h, the average annual operating time for the plant is equal to 8510 h. Consequently, the electricity produced is about 8500 MWh per year. Note that it is here assumed that the thermal energy produced during the cogeneration process and not self-consumed for heating is dispersed in the atmosphere [85]. Nonetheless, because of the plant’s self-consumption, which amounts to 8.45% of the energy produced, the electricity fed into the grid is approximately 7840 MWh. This is equivalent to assume that the IC engine runs for 7848 h per year. It is worth noticing that the number of hours of operation reduces when the plant’s manufacturer recommends the IC engine substitution (i.e., every 7–7.5 years). In this latter case, the operation time is 7752 h.
To investigate the profitability of the opportunity to revamp the plant and better inform the plant-owner decision, three different scenarios are compared. We start from the baseline scenario, namely SC-1, which mimics the decision to invest taken in 2012 by the investor (the plant’s owner). According to which, in 2012, the owner decided to invest in the above-described biogas plant and cease operation in 2027. We then consider scenario SC-2, in which the plant’s owner decide to revamp the plant in 2028 and shut down the plant in 2042, i.e., at the end of its useful life. In this scenario, the electricity produced is fed into the grid at the electricity market price. Finally, we conclude our investigation by analyzing scenario SC-3, in which the plant’s owner in 2018 will revamp the plant and install an ORC and in 2042 will definitively shut down the plant.
In what follows, estimates of cost and revenues are provided and discussed. In detail, cost estimates derive from statistical and performance analyses conducted on the set of biogas plants that have been monitored by the authors. The results of these analysis reveal a low variability of costs over the observation period. Consequently, costs are assumed to be constant over time.
  • Investment costs. According to an analysis conducted on the 20 plants monitored by the authors, the investment costs range from 4 M to 5 M€, depending on the feedstock used as the production input. The surveyed costs are in line with Ref. [19] and Ref. [86]. In detail, the investment costs of the plant under investigation amounted to 4.8 M€.
  • Operating costs. Operating costs vary according to the plant’s operating time, the cost of the feedstock and its harvesting. They include input costs, the opportunity cost of digestate, labor costs, maintenance and insurance costs [85,86,87]. Based on the market analysis the authors conducted and the survey they administered to plants’ owners and managers, the feedstock production costs range from 1.0 to 1.2 M€, depending on the digester diet. The plant under observation co-digestes maize silage, pig sewage and chicken dung, and it exhibits annual average costs equal to 1.2 M€. Operating and ordinary maintenance costs amount amount to about 180 k€ per year. This is a standard cost observed in the set of monitored production units and is in line with results by D’Alpaos [85], Barbera et al. [86] and Benato and Macor [19]. The results of the analysis conducted on the 20 monitored plants show that estimated annual labor costs are equal to 19.5 k€. Indeed, there is usually a significant integration between the operation of the plant and livestock farming. The estimated annual costs for digestate disposal are about 80 k€. This estimate falls in the range of estimates provided in the literature [19,85].
  • Revenues. As to revenues and their estimate, some comments are in order. Revenues vary linearly with produced electricity. Nonetheless, it is worth noting that plants that started operation in 2012, according to the Budget Act of 2008 [78] and in the ARG/elt 296 1/09 [79], will benefit from the government incentive scheme until 2027 (i.e., for 15 years). During this timespan, revenues coincide with the generous FiT set by the Italian government that corresponds to 280 € for any MWh of electricity produced. After the phasing out of the current incentive scheme, the plant’s owner has the opportunity to feed electricity into the grid at the current market price. In accordance with recent contributions in the literature focusing on the Italian electricity market [88,89,90], the authors assume the Single National Price (PUN) as a proxy for the electricity price. The PUN is set in the Italian Power Exchange and calculated as the average of hourly prices in the different market zones into which the Italian electricity market is divided into. The price of electricity is stochastic, and to estimate the underlying discrete-time stochastic process, PUN hourly prices in the time period April 2004–May 2020 [91] are considered and processed according to Menoncin [92] for forecasting future energy prices. The main assumption in considering the time series of past energy prices for price forecasts resides is that the stochastic process underlying the price dynamics is Markovian (i.e., memory less). In fact, it can be demonstrated that the PUN evolves over time according to a Geometric Brownian Motion [88,90,93].

6. Results and Discussion

The authors considered for their analysis the following three scenarios.
  • Scenario 1 (SC-1) represents the existing situation in which the plant started operating in 2012, it will be receiving the FiT (i.e., 280 € MWh−1) for 15 years, and it will be switched off in 2027. In 2019, the IC-engine was repowered, and the cost paid was equal to 275 k€. In this scenario, as revenues are of a deterministic nature thanks to the FiTs, the investment is low risk, and consequently, the discount rate is assumed as a risk-free discount rate, i.e., r = 3%. In 2012, the plants’ owner based his/her decision to invest on the project’s NPV, which is significantly positive:
    N P V ( t 0 = 2012 ) + 3954 k
  • Scenario 2 (SC-2). In this scenario, SC-1 conditions will persist until 2027. Nonetheless, in 2028, the plant’s owner has to decide whether to maintain in operation the plant until 2042 and then shut down the plant and cease operation. To prolong operation and continue to produce electricity, the plant’s owner would pay an estimated additional cost of 675 k€, which includes the costs for repowering the IC-engine and the costs to revamp the biological section of the facility (e.g., the digesters, the pumping sections, etc.). If the plant’s owner decided to invest, in 2035, the IC-engine would require again a repowering intervention at the cost of 275 k€. As the FiT will be cancelled out in 2027, starting from 2028, the plant’s owner would be paid the PUN (which, as previously said, is a proxy of the electricity market price) for the electricity fed into the grid. To make this decision (in 2028), the plants’ owner should consider the cost–benefit trade-offs of this additional investment. In detail, the plant’s owner should take into consideration from an economic perspective the additional investment costs paid for repowering the IC-engine and revamping the facility biological section, the plant’s operating costs (e.g., labor costs, feedstock costs, etc.) and the revenues gained by selling the electricity fed into the grid. In this scenario, due to the uncertainty over electricity prices, the discount rate is the adjusted rate of return. The discount rate is equal to r = 6% and has been calculated according to the Capital Asset Pricing Model [90]. In 2028, the investment NPV in 2028 would be highly negative:
    N P V ( t 0 = 2028 ) 11 , 497 k
    Consequently, according to data reported in Section 5, in 2028, the plant’s owner would be better off by not investing and, by contrast, shutting down the plant, as annual average costs would be indeed higher than average annual revenues.
  • Scenario 3 (SC-3). This scenario’s conditions are similar to those of scenario SC-2, with an exception made for the additional installation of an ORC in 2028 to increase the power generation of the existing biogas plant. Following the guidelines reported in Ref. [84] and considering a commercially available unit, if the plant’s owner decided to install an ORC labeled for a design power of 100 kWel, the annual electricity production would increase by 500 MWh. The ORC self-consumption is usually equal to 8% of the generated electricity. Consequently, the additional electricity quota produced via the ORC and fed into the grid would be of 457.5 MWh per year. At the time of the ORC repowering, the expected electricity quota fed into the grid would be equal to 366 MWh. Based on the market analysis conducted among the main European ORC manufacturers, the ORC installation costs are equal to 400 k€, whereas annual maintenance costs are about 4% of installation costs (i.e., 16 k€). Maintenance costs pertain to organic fluid refilling, heat exchanger cleaning and checking the turbine. The ORC manufacturer recommends a repowering of the ORC every 5 years. The cost of this repowering is estimated in 45 k€. Regardless of the ORC installation, analogously to scenario SC-2, the investment NPV in 2028 would be negative:
    N P V ( t 0 = 2028 ) 11 , 852 k
    where r is equal to 6%.
By comparing the NPV in scenario SC-2 with the NPV in scenario SC-3, it emerges that the revenues generated by the additional quota of energy produced via the ORC and fed into the grid do not off-set the ORC investment and maintenance costs at the forecasted market prices. Nonetheless, in a cost–benefit perspective, electricity market prices do not properly reflect the social value of renewable energy. Indeed, this value is evermore increasing when the positive externalities of renewable production are the driving force of the energy transition, and both energy providers and end-users are requested to take bold steps to align with the EU climate targets and put forward the transformation of the global economy from fossil-based to zero-carbon. Previous to the COVID-19 outbreak and the beginning of the war in Ukraine, it was widely acknowledged that to make prolonging the operation of existing biogas plants profitable, the introduction of a new incentive policy would have been necessary [94]. Our findings indeed confirm this sentiment. To prolong operation in scenario SC-3, the minimum incentive in the form of FiT, which annuled the NPV, should be set at about 197 € MWh−1.
It is worth noting that the time series of prices here considered extends to May 2020; therefore, it does not account for the effects of the COVID-19 outbreak, the war in Ukraine and the current political and economic context, which represent a shock in the whole economy. This shock may affect the robustness of the estimates here provided. Nonetheless, it can be considered an exceptional event whose mid and long-term effects are not predictable at the current time. Figure 11 shows the monthly average of PUN over the last two years. From direct inspection of Figure 11, it emerges the substantial increasing trend of PUN and the peak registered in August 2022. The average price in the period August 2021–August 2022 is about 272 € MWh−1 and is substantially comparable to the FiT amount set by the Budget Act of 2008 [78] and the ARG/elt 296 1/09 [79] (i.e., 280 € MWh−1).
If the PUN price will be equal to 272 € MWh−1 over the period 2028–2042, the investment’s NPV in scenario SC-3 would be highly positive:
N P V ( t 0 = 2028 ) + 6250 k
It is likely that energy prices will remain higher than the recent average for some time in the mid-term. A concurrence of events determined the recent energy price increase. Firstly, the global demand for natural gas in the post-COVID-19 economic recovery stimulated the increase of energy prices and, secondly, current uncertainties about Russian natural gas supplies aggravate market instability, thus further augmenting volatility and prices. This is obviously reflected in electricity prices.
The European Commission has estimated that the gas price is expected to stand at 100 € MWh−1 until the end of 2023 and turn down to 75 € MWh−1 [13].

7. Conclusions

In this work, the authors investigated whether, after the pushing out of FiT incentives, existing biogas power plants in Italy will remain in operation or shut down. In detail, they provided a theoretical and methodological framework to assess the profitability of prolonging plants’ operation after the cancellation of FITs. Based on a real-world case study and the analysis of the time series of PUN prices registered in the period April 2004–May 2020, our findings reveal that the owner will be better off by shutting down the plant. The present value of future operating and maintenance costs offsets, indeed, the present value of future revenues gained by feeding electricity into the grid at market prices. The opportunity to improve the plant’s efficiency by installing an ORC is not profitable also. As the plant under investigation is representative of a large set of existing biogas power plants, the decision to cease operation will likely be made by the majority of the plant’s owners and managers. Recent projections estimate that in the period June 2027–June 2028, about 700 in-operation biogas plants will be shut down. This will cause a loss of approximately 570 MWel, representing 40% of the total installed power (i.e., 1400 MWel), which, in turn, will reduce by about 50% (4000 GWh over 8000 GWh) the production of electricity from renewable energy sources. These projections are alarming per se, but due to the recent sharp rise of energy prices arising from the post-COVID-19 economic recovery and worsened by the war in Ukraine, they are even more alarming.
In addition, to accelerate the energy transition and reach carbon neutrality by 2050, Italy is requested to install an additional 30 GW of solar and 10 GW of wind by 2030. This estimate includes current power production from renewables, which in 2028 will likely reduce by about 0.5 GW because of the shutting down of in-operation biogas plants. By contrast, if adequately rewarded by FiTs or other market incentives, the revamping of existing biogas power plants via the ORC installation would contribute to increasing the share of renewable energy production at a relatively limited cost. In this respect, it is worth mentioning that the installation of 50 MW of PV might increase significantly soil consumption and request a conspicuous capital expenditure. Indeed, according to recent estimates, the Levelized Cost Of Electricity for solar PV is equal to 0.048 USD kWh−1 [95] and installing 50 GW of PV power requires an area of about 500 km2 [96]. It may be questionable that this area is negligible compared to the Italian territory. Nevertheless, soil consumption is a crucial issue in Italy, and limiting it represents a top priority policy target.
In light of the above considerations, the biogas sector can become strategic in achieving the challenging targets imposed by the energy transition. Consequently, there is an urgent need for a mid and long-term management strategy for existing biogas power plants. Indeed, the valuation framework here proposed can provide useful insights to support policymakers in the design of this management strategy. Future research may include a comparative analysis of investments in upgrading biogas to biomethane to be fed into the grid for transport purposes. This further development will be conditional on the enactment of standards on the characteristics of injected biomethane, which are currently lacking and prevent accelerating the energy transition.

Author Contributions

Conceptualization, A.B. and C.D.; Data curation, A.B., C.D. and A.M.; Formal analysis, A.B., C.D. and A.M.; Methodology, A.B. and C.D.; Validation, A.B., C.D. and A.M.; Writing—original draft, A.B. and C.D.; Writing—review and editing, A.B., C.D. and A.M. All authors have read and agreed to the published version of the manuscript.

Funding

This research received no external funding.

Institutional Review Board Statement

Not applicable.

Informed Consent Statement

Not applicable.

Data Availability Statement

Not applicable.

Conflicts of Interest

The authors declare no conflict of interest.

Abbreviations

The following abbreviations are used in this manuscript:
bcmBillion Cubic Meter
CIBConsorzio Italiano Biogas
CO2Carbon Dioxide
EUEuropean Union
FiTFeed-in Tariff
GHGGreenhouse Gases
GME         Gestore dei Mercati Energetici
GSEGestore dei Servizi Energetici
ICInternal Combustion
LNGLiquid Natural Gas
NOxNitrogen Oxide
NPVNet Present Value
NREAPNational Renewable Action Plan
ORC         Organic Rankine Cycle
PUNSingle National Price
RESRenewable Energy Sources
SCScenario

References

  1. The United Nations Framework Convention on Climate Change. The Kyoto Protocol. UNFCCC Website 1997. Available online: http://unfccc.int/kyoto_protocol/items/2830.php (accessed on 25 September 2022).
  2. The United Nations Framework Convention on Climate Change. The Paris Agreement. UNFCCC Website 2015. Available online: https://unfccc.int/documents/184656 (accessed on 25 September 2022).
  3. European Parliament and of the Council. Directive 2009/28/EC of the European Parliament and of the Council of 23 April 2009 on the promotion of the use of energy from renewable sources and amending and subsequently repealing Directives 2001/77/EC and 2003/30/EC. Off. J. Eur. Union 2009, 5, 2009. Available online: https://eur-lex.europa.eu/legal-content/en/ALL/?uri=CELEX%3A32009L0028 (accessed on 25 September 2022).
  4. The European Commission. The EU 2030 Climate and Energy Framework. Off. J. Eur. Union 2014, 140, 16–62. Available online: https://ec.europa.eu/clima/eu-action/climate-strategies-targets/2030-climate-energy-framework_it (accessed on 25 September 2022).
  5. The European Commission. Roadmap 2050: Roadmap for moving to a competitive low-carbon economy in 2050. Off. J. Eur. Union 2011. Available online: https://www.roadmap2050.eu/ (accessed on 25 September 2022).
  6. The European Parliament. EU Responses to Climate Change. Official Website of the European Parliament 2022. Available online: https://www.europarl.europa.eu/news/en/headlines/society/20180703STO07129/eu-responses-to-climate-change (accessed on 25 September 2022).
  7. The European Commission. The European Green Deal. Off. J. Eur. Union 2020. Available online: https://www.europarl.europa.eu/news/en/headlines/society/20200618STO81513/green-deal-key-to-a-climate-neutral-and-sustainable-eu (accessed on 25 September 2022).
  8. Ministero dello Sviluppo Economico. Piano Nazionale Integrato per l’Energia e il Clima 2030. Gazz. Uff. Della Repubb. Ital. 2020. Available online: https://www.mise.gov.it/index.php/it/energia/energia-e-clima-2030 (accessed on 25 September 2022).
  9. GSE–Gestore dei Servizi Energetici S.p.A. Rapporto Statistico 2020 Energia e Fonti Rinnovabili in Italia al 2020. GSE Official Website 2020. Available online: https://www.gse.it/documenti_site/Documenti%20GSE/Rapporti%20statistici/Rapporto%20Statistico%20GSE%20-%20FER%202020.pdf (accessed on 25 September 2022).
  10. Benato, A.; Stoppato, A. Energy and cost analysis of an Air Cycle used as prime mover of a Thermal Electricity Storage. J. Energy Storage 2018, 17, 29–46. [Google Scholar] [CrossRef]
  11. Cavazzini, G.; Benato, A.; Pavesi, G.; Ardizzon, G. Techno-economic benefits deriving from optimal scheduling of a Virtual Power Plant: Pumped hydro combined with wind farms. J. Energy Storage 2021, 37, 102461. [Google Scholar] [CrossRef]
  12. Mbah, R.E.; Wasum, D.F. Russian-Ukraine 2022 War: A review of the economic impact of Russian-Ukraine crisis on the USA, UK, Canada, and Europe. Adv. Soc. Sci. Res. J. 2022, 9, 144–153. [Google Scholar] [CrossRef]
  13. The European Commission. RePowerEU: A plan to rapidly reduce dependence on Russian fossil fuels and fast forward the green transition. Off. J. Eur. Union 2022. Available online: https://eur-lex.europa.eu/resource.html?uri=cellar:fc930f14-d7ae-11ec-a95f-01aa75ed71a1.0001.02/DOC_1&format=PDF (accessed on 25 September 2022).
  14. European Biogas Association. The REPowerEU Puts forward a Biomethane Action Plan to Scale-Up the Sector by 2030. Web Source 2022. Available online: https://www.europeanbiogas.eu/the-repowereu-puts-forward-a-biomethane-action-plan-to-scale-up-the-sector-by-2030/ (accessed on 25 September 2022).
  15. Ministero dello Sviluppo Economico. Decreto Interministeriale 2 Marzo 2018–Promozione Dell’uso del Biometano nel Settore dei Trasporti. Web Source 2018. Available online: https://www.mise.gov.it/index.php/it/normativa/decreti-interministeriali/decreto-interministeriale-2-marzo-2018-promozione-dell-uso-del-biometano-nel-settore-dei-trasporti (accessed on 25 September 2022).
  16. Ministero della Transizione Ecologica. Decreto 5 Agosto 2022. Attuazione del PNRR: M2C2 I.1.4-Sviluppo del biometano Secondo Criteri per la Promozione Dell’economia Circolare-Produzione di Biometano Secondo Quanto Previsto dal Decreto 2 Marzo 2018. (22A04725) (GU Serie Generale n.192 del 18-08-2022). Web Source 2022. Available online: https://www.mise.gov.it/index.php/it/normativa/decreti-interministeriali/decreto-interministeriale-2-marzo-2018-promozione-dell-uso-del-biometano-nel-settore-dei-trasporti (accessed on 25 September 2022).
  17. Schiro, F.; Stoppato, A.; Benato, A. Modelling and analyzing the impact of hydrogen enriched natural gas on domestic gas boilers in a decarbonization perspective. Carbon Resour. Convers. 2020, 3, 122–129. [Google Scholar] [CrossRef]
  18. Italian Government. National Renewable Energy Action Plan. Web Source 2010. Available online: https://ec.europa.eu/energy/en/topics/renewable-energy/national-action-plans (accessed on 25 September 2022).
  19. Benato, A.; Macor, A. Italian biogas plants: Trend, subsidies, cost, biogas composition and engine emissions. Energies 2019, 12, 979. [Google Scholar] [CrossRef] [Green Version]
  20. Ferreira, M.; Marques, I.P.; Malico, I. Biogas in Portugal: Status and public policies in a European context. Energy Policy 2012, 43, 267–274. [Google Scholar] [CrossRef] [Green Version]
  21. Igliński, B.; Piechota, G.; Iwański, P.; Skarzatek, M.; Pilarski, G. 15 Years of the Polish agricultural biogas plants: Their history, current status, biogas potential and perspectives. Clean Technol. Environ. Policy 2020, 22, 281–307. [Google Scholar] [CrossRef]
  22. Kim, Y.S.; Yoon, Y.M.; Kim, C.H.; Giersdorf, J. Status of biogas technologies and policies in South Korea. Renew. Sustain. Energy Rev. 2012, 16, 3430–3438. [Google Scholar] [CrossRef]
  23. Nevzorova, T. Biogas production in the Russian federation: Current status, potential, and barriers. Energies 2020, 13, 3620. [Google Scholar] [CrossRef]
  24. Brémond, U.; Bertrandias, A.; Steyer, J.P.; Bernet, N.; Carrere, H. A vision of European biogas sector development towards 2030: Trends and challenges. J. Clean. Prod. 2021, 287, 125065. [Google Scholar] [CrossRef]
  25. Kemausuor, F.; Adaramola, M.S.; Morken, J. A review of commercial biogas systems and lessons for Africa. Energies 2018, 11, 2984. [Google Scholar] [CrossRef] [Green Version]
  26. Lee, B.; Park, J.G.; Shin, W.B.; Kim, B.S.; Byun, B.s.; Jun, H.B. Maximizing biogas production by pretreatment and by optimizing the mixture ratio of co-digestion with organic wastes. Environ. Eng. Res. 2019, 24, 662–669. [Google Scholar] [CrossRef] [Green Version]
  27. Ghouali, A.; Sari, T.; Harmand, J. Maximizing biogas production from the anaerobic digestion. J. Process. Control. 2015, 36, 79–88. [Google Scholar] [CrossRef] [Green Version]
  28. Song, Y.J.; Oh, K.S.; Lee, B.; Pak, D.W.; Cha, J.H.; Park, J.G. Characteristics of biogas production from organic wastes mixed at optimal ratios in an anaerobic co-digestion reactor. Energies 2021, 14, 6812. [Google Scholar] [CrossRef]
  29. Asadi, M.; McPhedran, K. Biogas maximization using data-driven modelling with uncertainty analysis and genetic algorithm for municipal wastewater anaerobic digestion. J. Environ. Manag. 2021, 293, 112875. [Google Scholar] [CrossRef]
  30. Sarker, S.; Lamb, J.J.; Hjelme, D.R.; Lien, K.M. A review of the role of critical parameters in the design and operation of biogas production plants. Appl. Sci. 2019, 9, 1915. [Google Scholar] [CrossRef] [Green Version]
  31. Nathan, S.S.; Mallikarjuna, J.; Ramesh, A. An experimental study of the biogas–diesel HCCI mode of engine operation. Energy Convers. Manag. 2010, 51, 1347–1353. [Google Scholar] [CrossRef]
  32. Barik, D.; Murugan, S. Investigation on combustion performance and emission characteristics of a DI (direct injection) diesel engine fueled with biogas–diesel in dual fuel mode. Energy 2014, 72, 760–771. [Google Scholar] [CrossRef]
  33. Yilmaz, I.; Gumus, M. Investigation of the effect of biogas on combustion and emissions of TBC diesel engine. Fuel 2017, 188, 69–78. [Google Scholar] [CrossRef]
  34. Bui, V.G.; Bui, T.M.T.; Hoang, A.T.; Nižetić, S.; Nguyen Thi, T.X.; Vo, A.V. Hydrogen-enriched biogas premixed charge combustion and emissions in direct injection and indirect injection diesel dual fueled engines: A comparative study. J. Energy Resour. Technol. 2021, 143, 120907. [Google Scholar] [CrossRef]
  35. Benaissa, S.; Adouane, B.; Ali, S.M.; Rashwan, S.S.; Aouachria, Z. Investigation on combustion characteristics and emissions of biogas/hydrogen blends in gas turbine combustors. Therm. Sci. Eng. Prog. 2022, 27, 101178. [Google Scholar] [CrossRef]
  36. Sharma, H.; Mahla, S.K.; Dhir, A. Effect of utilization of hydrogen-rich reformed biogas on the performance and emission characteristics of common rail diesel engine. Int. J. Hydrogen Energy 2022, 47, 10409–10419. [Google Scholar] [CrossRef]
  37. Deheri, C.; Acharya, S.K.; Thatoi, D.N.; Mohanty, A.P. A review on performance of biogas and hydrogen on diesel engine in dual fuel mode. Fuel 2020, 260, 116337. [Google Scholar] [CrossRef]
  38. Macor, A.; Benato, A. Regulated emissions of biogas engines–On site experimental measurements and damage assessment on human health. Energies 2020, 13, 1044. [Google Scholar] [CrossRef] [Green Version]
  39. Macor, A.; Benato, A. A Human Health Toxicity Assessment of Biogas Engines Regulated and Unregulated Emissions. Appl. Sci. 2020, 10, 7048. [Google Scholar] [CrossRef]
  40. Benato, A.; Macor, A. Costs to reduce the human health toxicity of biogas engine emissions. Energies 2021, 14, 6360. [Google Scholar] [CrossRef]
  41. Bartocci, P.; Zampilli, M.; Liberti, F.; Pistolesi, V.; Massoli, S.; Bidini, G.; Fantozzi, F. LCA analysis of food waste co-digestion. Sci. Total. Environ. 2020, 709, 136187. [Google Scholar] [CrossRef] [PubMed]
  42. Rehl, T.; Müller, J. Life cycle assessment of biogas digestate processing technologies. Resour. Conserv. Recycl. 2011, 56, 92–104. [Google Scholar] [CrossRef]
  43. Hijazi, O.; Munro, S.; Zerhusen, B.; Effenberger, M. Review of life cycle assessment for biogas production in Europe. Renew. Sustain. Energy Rev. 2016, 54, 1291–1300. [Google Scholar] [CrossRef]
  44. Aziz, N.I.H.A.; Hanafiah, M.M.; Gheewala, S.H. A review on life cycle assessment of biogas production: Challenges and future perspectives in Malaysia. Biomass Bioenergy 2019, 122, 361–374. [Google Scholar] [CrossRef]
  45. Esteves, E.M.M.; Herrera, A.M.N.; Esteves, V.P.P.; do Rosário Vaz Morgado, C. Life cycle assessment of manure biogas production: A review. J. Clean. Prod. 2019, 219, 411–423. [Google Scholar] [CrossRef]
  46. Starr, K.; Gabarrell, X.; Villalba, G.; Talens, L.; Lombardi, L. Life cycle assessment of biogas upgrading technologies. Waste Manag. 2012, 32, 991–999. [Google Scholar] [CrossRef]
  47. O’Connor, S.; Ehimen, E.; Pillai, S.; Black, A.; Tormey, D.; Bartlett, J. Biogas production from small-scale anaerobic digestion plants on European farms. Renew. Sustain. Energy Rev. 2021, 139, 110580. [Google Scholar] [CrossRef]
  48. Trypolska, G.; Kyryziuk, S.; Krupin, V.; Wąs, A.; Podolets, R. Economic Feasibility of Agricultural Biogas Production by Farms in Ukraine. Energies 2021, 15, 87. [Google Scholar] [CrossRef]
  49. Barbera, E.; Bertucco, A.; Nigam, K.D.; Kumar, S. Techno-economic analysis of a micro-scale biogas plant integrated with microalgae cultivation for the treatment of organic municipal waste. Chem. Eng. J. 2022, 450, 138323. [Google Scholar] [CrossRef]
  50. Winquist, E.; Rikkonen, P.; Pyysiäinen, J.; Varho, V. Is biogas an energy or a sustainability product?-Business opportunities in the Finnish biogas branch. J. Clean. Prod. 2019, 233, 1344–1354. [Google Scholar] [CrossRef]
  51. Sun, H.; Wang, E.; Li, X.; Cui, X.; Guo, J.; Dong, R. Potential biomethane production from crop residues in China: Contributions to carbon neutrality. Renew. Sustain. Energy Rev. 2021, 148, 111360. [Google Scholar] [CrossRef]
  52. Zhu, T.; Curtis, J.; Clancy, M. Promoting agricultural biogas and biomethane production: Lessons from cross-country studies. Renew. Sustain. Energy Rev. 2019, 114, 109332. [Google Scholar] [CrossRef]
  53. Xue, S.; Zhang, S.; Wang, Y.; Wang, Y.; Song, J.; Lyu, X.; Wang, X.; Yang, G. What can we learn from the experience of European countries in biomethane industry: Taking China as an example? Renew. Sustain. Energy Rev. 2022, 157, 112049. [Google Scholar] [CrossRef]
  54. Dale, B.E.; Bozzetto, S.; Couturier, C.; Fabbri, C.; Hilbert, J.A.; Ong, R.; Richard, T.; Rossi, L.; Thelen, K.D.; Woods, J. The potential for expanding sustainable biogas production and some possible impacts in specific countries. Biofuels Bioprod. Biorefining 2020, 14, 1335–1347. [Google Scholar] [CrossRef]
  55. Argalis, P.P.; Vegere, K. Perspective Biomethane Potential and Its Utilization in the Transport Sector in the Current Situation of Latvia. Sustainability 2021, 13, 7827. [Google Scholar] [CrossRef]
  56. Schmid, C.; Horschig, T.; Pfeiffer, A.; Szarka, N.; Thrän, D. Biogas Upgrading: A Review of National Biomethane Strategies and Support Policies in Selected Countries. Energies 2019, 12, 3803. [Google Scholar] [CrossRef] [Green Version]
  57. Rodero, M.R.; Ángeles, R.; Marín, D.; Díaz, I.; Colzi, A.; Posadas, E.; Lebrero, R.; Muñoz, R. Biogas purification and upgrading technologies. Biogas 2018, 6, 239–276. [Google Scholar]
  58. Khan, M.U.; Lee, J.T.E.; Bashir, M.A.; Dissanayake, P.D.; Ok, Y.S.; Tong, Y.W.; Shariati, M.A.; Wu, S.; Ahring, B.K. Current status of biogas upgrading for direct biomethane use: A review. Renew. Sustain. Energy Rev. 2021, 149, 111343. [Google Scholar] [CrossRef]
  59. Angelidaki, I.; Xie, L.; Luo, G.; Zhang, Y.; Oechsner, H.; Lemmer, A.; Munoz, R.; Kougias, P.G. Biogas upgrading: Current and emerging technologies. In Biofuels: Alternative Feedstocks and Conversion Processes for the Production of Liquid and Gaseous Biofuels; Acaemic Press: Cambridge, MA, USA, 2019; pp. 817–843. [Google Scholar]
  60. Zhao, J.; Li, Y.; Dong, R. Recent progress towards in-situ biogas upgrading technologies. Sci. Total. Environ. 2021, 800, 149667. [Google Scholar] [CrossRef]
  61. Ahmed, S.F.; Mofijur, M.; Tarannum, K.; Chowdhury, A.T.; Rafa, N.; Nuzhat, S.; Kumar, P.S.; Vo, D.V.N.; Lichtfouse, E.; Mahlia, T. Biogas upgrading, economy and utilization: A review. Environ. Chem. Lett. 2021, 19, 4137–4164. [Google Scholar] [CrossRef]
  62. Lombardi, L.; Francini, G. Techno-economic and environmental assessment of the main biogas upgrading technologies. Renew. Energy 2020, 156, 440–458. [Google Scholar] [CrossRef]
  63. Kapoor, R.; Ghosh, P.; Kumar, M.; Vijay, V.K. Evaluation of biogas upgrading technologies and future perspectives: A review. Environ. Sci. Pollut. Res. 2019, 26, 11631–11661. [Google Scholar] [CrossRef]
  64. Golmakani, A.; Nabavi, S.A.; Wadi, B.; Manovic, V. Advances, challenges, and perspectives of biogas cleaning, upgrading, and utilisation. Fuel 2022, 317, 123085. [Google Scholar] [CrossRef]
  65. Budzianowski, W.M.; Budzianowska, D.A. Economic analysis of biomethane and bioelectricity generation from biogas using different support schemes and plant configurations. Energy 2015, 88, 658–666. [Google Scholar] [CrossRef]
  66. Pasini, G.; Baccioli, A.; Ferrari, L.; Antonelli, M.; Frigo, S.; Desideri, U. Biomethane grid injection or biomethane liquefaction: A technical-economic analysis. Biomass Bioenergy 2019, 127, 105264. [Google Scholar] [CrossRef]
  67. Cucchiella, F.; D’Adamo, I. Technical and economic analysis of biomethane: A focus on the role of subsidies. Energy Convers. Manag. 2016, 119, 338–351. [Google Scholar] [CrossRef]
  68. Cucchiella, F.; D’Adamo, I.; Gastaldi, M. An economic analysis of biogas-biomethane chain from animal residues in Italy. J. Clean. Prod. 2019, 230, 888–897. [Google Scholar] [CrossRef]
  69. D’Adamo, I.; Falcone, P.M.; Ferella, F. A socio-economic analysis of biomethane in the transport sector: The case of Italy. Waste Manag. 2019, 95, 102–115. [Google Scholar] [CrossRef]
  70. Greco, C.; Comparetti, A.; Febo, P.; Navickas, K.; Orlando, S.; Venslauskas, K. LCA applied to an anaerobic digestion plant for biomethane and digestate production. In Proceedings of the International Scientific Conference “Rural Development”, Yogyakarta, Indonesia, 20–21 August 2019; pp. 126–132. [Google Scholar]
  71. Ardolino, F.; Parrillo, F.; Arena, U. Biowaste-to-biomethane or biowaste-to-energy? An LCA study on anaerobic digestion of organic waste. J. Clean. Prod. 2018, 174, 462–476. [Google Scholar] [CrossRef]
  72. Ardolino, F.; Cardamone, G.; Parrillo, F.; Arena, U. Biogas-to-biomethane upgrading: A comparative review and assessment in a life cycle perspective. Renew. Sustain. Energy Rev. 2021, 139, 110588. [Google Scholar] [CrossRef]
  73. Nizami, A.S.; Ismail, I.M. Life-cycle assessment of biomethane from lignocellulosic biomass. Life Cycle Assess. Renew. Energy Sources 2013, 1, 79–94. [Google Scholar]
  74. Maga, D. Life cycle assessment of biomethane produced from microalgae grown in municipal waste water. Biomass Convers. Biorefinery 2017, 7, 1–10. [Google Scholar] [CrossRef]
  75. TERNA S.p.A. Impianti di Generazione. TERNA Official Website 2021. Available online: https://download.terna.it/terna/3-IMPIANTI%20DI%20GENERAZIONE_8d9cece9d7e2a7d.pdf (accessed on 25 September 2022).
  76. European Biogas Association. EBA Statistical Report 2020. EBA Official Website 2020. Available online: https://www.europeanbiogas.eu/eba-statistical-report-2020/ (accessed on 25 September 2022).
  77. Presidente del Consiglio dei Ministri. Decreto Legislativo 16 Marzo 1999, n. 79. Attuazione Della Direttiva 96/92/CE Recante Norme Comuni per il Mercato Interno Dell’energia Elettrica. Gazzetta Ufficiale delle Repubblica Italiana 1999. Available online: https://web.camera.it/parlam/leggi/deleghe/99079dl.htm (accessed on 25 September 2022).
  78. Ministero dello sviluppo economico. D.M. 18 Dicembre 2008. Incentivazione Della Produzione di Energia Elettrica da Fonti Rinnovabili, ai Sensi Dell’articolo 2, Comma 150, Della Legge 24 Dicembre 2007, n. 244. Gazzetta Ufficiale delle Repubblica Italiana 2008. Available online: http://www.energia.provincia.tn.it/binary/pat_agenzia_energia/normativa/Min.svil.econ._DM%2018.12.08.1233048510.pdf (accessed on 25 September 2022).
  79. Autoritá per l’Energia Elettrica e il Gas. Delibera ARG/elt 1/09. Attuazione Dell’articolo 2, Comma 153, Della Legge n. 244/07 e Dell’articolo 20 del Decreto Ministeriale 18 Dicembre 2008, in Materia di incentivazione Dell’energia Elettrica Prodotta da Fonti Rinnovabili Tramite la Tariffa Fissa Onnicomprensiva e di Scambio sul Posto. Official Website 2009. Available online: https://www.arera.it/it/docs/09/001-09arg.htm# (accessed on 25 September 2022).
  80. Ministero dello Sviluppo Economico. Decreto Ministeriale 6 Luglio 2012 ed Allegati–Incentivi per Energia da Fonti Rinnovabili Elettriche Non Fotovoltaiche. Official Website 2012. Available online: https://www.mise.gov.it/index.php/it/normativa/decreti-ministeriali/decreto-ministeriale-6-luglio-2012-ed-allegati-incentivi-per-energia-da-fonti-rinnovabili-elettriche-non-fotovoltaiche (accessed on 25 September 2022).
  81. GSE–Gestore dei Servizi Energetici S.p.A. Rapporti Statistici. GSE Official Website 2022. Available online: https://www.gse.it/dati-e-scenari/statistiche (accessed on 25 September 2022).
  82. CIB–Consorzio Italiano Biogas. CIB Official Website 2022. Available online: https://www.consorziobiogas.it (accessed on 25 September 2022).
  83. Bellini, Emiliano, j.y.n. Work Begins on 50 MW Solar Park in Malawi. Available online: https://www.pv-magazine.com/2022/02/04/work-begins-on-50-mw-solar-park-in-malawi/ (accessed on 25 September 2022).
  84. Benato, A.; Macor, A. Biogas engine waste heat recovery using organic Rankine cycle. Energies 2017, 10, 327. [Google Scholar] [CrossRef]
  85. D’Alpaos, C. Methodological approaches to the valuation of investments in biogas production plants: Incentives vs market prices in Italy. Valori Valutazioni 2017, 53–63. Available online: https://siev.org/wp-content/uploads/2020/02/19_05_DAlpaos_Eng.pdf (accessed on 25 September 2022).
  86. Barbera, E.; Menegon, S.; Banzato, D.; D’Alpaos, C.; Bertucco, A. From biogas to biomethane: A process simulation-based techno-economic comparison of different upgrading technologies in the Italian context. Renew. Energy 2019, 135, 663–673. [Google Scholar] [CrossRef]
  87. Sibilio, S.; Rosato, A.; Ciampi, G.; Scorpio, M.; Akisawa, A. Building-integrated trigeneration system: Energy, environmental and economic dynamic performance assessment for Italian residential applications. Renew. Sustain. Energy Rev. 2017, 68, 920–933. [Google Scholar] [CrossRef]
  88. Bertolini, M.; D’Alpaos, C.; Moretto, M. Do Smart Grids boost investments in domestic PV plants? Evidence from the Italian electricity market. Energy 2018, 149, 890–902. [Google Scholar] [CrossRef]
  89. Castellini, M.; Di Corato, L.; Moretto, M.; Vergalli, S. Energy exchange among heterogeneous prosumers under price uncertainty. Energy Econ. 2021, 104, 105647. [Google Scholar] [CrossRef]
  90. Andreolli, F.; D’Alpaos, C.; Moretto, M. Valuing investments in domestic PV-Battery Systems under uncertainty. Energy Econ. 2022, 106, 105721. [Google Scholar] [CrossRef]
  91. Gestore Mercati Energetici. Esiti dei Mercati e Statistiche. Web Source 2022. Available online: https://www.mercatoelettrico.org/It/Tools/Accessodati.aspx?ReturnUrl=%2fit%2fStatistiche%2fME%2fDatiSintesi.aspx (accessed on 25 September 2022).
  92. Menoncin, F. Misurare il rischio. In Misurare e Gestire il Rischio Finanziario; Springer: Berlin/Heidelberg, Germany, 2009; pp. 161–193. [Google Scholar]
  93. Biondi, T.; Moretto, M. Solar Grid Parity dynamics in Italy: A real option approach. Energy 2015, 80, 293–302. [Google Scholar] [CrossRef] [Green Version]
  94. Banzato, D.; Canesi, R.; D’Alpaos, C. Biogas and biomethane technologies: An AHP model to support the policy maker in incentive design in Italy. In Smart and Sustainable Planning for Cities and Regions; Springer: Berlin/Heidelberg, Germany, 2017; pp. 319–331. [Google Scholar]
  95. International Renewable Energy Agency. Renewable Power Generation Costs in 2021. International Renewable Energy Agency, Abu Dhabi. Web Source 2022. Available online: https://irena.org/-/media/Files/IRENA/Agency/Publication/2022/Jul/IRENA_Renewable_Power_Generation_Costs_2021.pdf (accessed on 25 September 2022).
  96. Van de Ven, D.J.; Capellan-Peréz, I.; Arto, I.; Cazcarro, I.; de Castro, C.; Patel, P.; Gonzalez-Eguino, M. The potential land requirements and related land use change emissions of solar energy. Sci. Rep. 2021, 11, 2907. [Google Scholar] [CrossRef] [PubMed]
Figure 1. Installed power from RES in Italy in 2020. Authors’ elaboration based on Gestore dei Servizi Energetici (GSE) data [9].
Energies 15 08113 g001
Figure 2. Gross electricity production by fuel in Italy in 2020. Authors’ elaboration based on GSE data [9].
Energies 15 08113 g002
Figure 3. Trend of the electricity production from solid biomass, biogas, bioliquis and bioenergy (sum of the three above-mentioned fuels). Italy, period 2010–2020. Authors’ elaboration based on GSE data [9].
Energies 15 08113 g003
Figure 4. Trend of the electricity production from biogas. Italy, period 2000–2020. Authors’ elaboration based on GSE data [9].
Energies 15 08113 g004
Figure 5. Trend of the biogas installations in terms of both number of plants and installed power. Italy, period 2008–2020. Authors’ elaboration starting from GSE data [9].
Energies 15 08113 g005
Figure 6. (a) Number of biogas plants, (b) Installed electricity capacity, and (c) Electricity generation of each feedstock used in biogas plants. Italy, year 2020. Authors’ elaboration based on GSE data [9].
Energies 15 08113 g006
Figure 7. Regional distribution of the biogas electricity production in 2020 in Italy. Authors’ elaboration based on GSE data [9].
Energies 15 08113 g007
Figure 8. Trend of the biogas installations in terms of installed power vs. the NREAP target. Italy, period 2008–2020. Authors’ elaboration based on GSE and NREAP data [9,18].
Energies 15 08113 g008
Figure 9. Main regional loss of biogas plant and installed power in 2028. Authors’ elaboration starting from data make available from GSE [81] and Consorzio Italiano Biogas [82].
Energies 15 08113 g009
Figure 10. Structure of the analysed biogas facility.
Energies 15 08113 g010
Figure 11. Monthly average of PUN in the period September 2020–August 2022. Authors’ elaboration starting from Gestore Mercati Energetici (GME) data.
Energies 15 08113 g011
Publisher’s Note: MDPI stays neutral with regard to jurisdictional claims in published maps and institutional affiliations.

