Article

Computational Fluid Dynamics of Influence of Process Parameters and the Geometry of Catalyst Wires on the Ammonia Oxidation Process and Degradation of the Catalyst Gauze

by
Mariusz Tyrański
1,
Izabela Pasik
1,
Jakub Michał Bujalski
2,
Wojciech Orciuch
1 and
Łukasz Makowski
1,*
1
Faculty of Chemical and Process Engineering, Warsaw University of Technology, Waryńskiego 1, 00-645 Warsaw, Poland
2
Yara International ASA, Yara Technology and Projects, 3936 Porsgrunn, Norway
*
Author to whom correspondence should be addressed.
Energies 2022, 15(21), 8123; https://doi.org/10.3390/en15218123
Submission received: 1 October 2022 / Revised: 24 October 2022 / Accepted: 27 October 2022 / Published: 31 October 2022
(This article belongs to the Special Issue Practical and Scientific Aspects of Multiphase Systems)

Abstract

:
The ammonia oxidation reaction on solid platinum–rhodium gauze is a critical step in nitric acid production. As the global demand for food and fertilisers keeps steadily growing, this remains an essential reaction in the chemical industry. However, harsh conditions inside ammonia burners lead to the degradation of catalytic meshes, severely hindering this process. This manuscript is focused on two issues. The first is the influence of catalyst gauze geometry and process parameters on the efficiency of ammonia oxidation on platinum–rhodium gauze. The second investigated problem is the influence of geometry on catalyst fibre degradation and the movement and deposition of entrained platinum particles. Computational Fluid Dynamics was utilised in this work for calculations. Different catalyst gauze geometries were chosen to examine the relationship between wire geometry and heat and mass transfer by analysing temperature and flow fields. Significantly, the analysis of the temperature gradient on the catalyst surface allowed us to estimate the spots of highest wire degradation and to track lifted platinum particles. The Discrete Phase Model was used to calculate entrained platinum particle trajectories and their deposition’s localisation and efficiency.

1. Introduction

The fertiliser industry is one of the most crucial branches of the chemical industry, and it is critical in agriculture and food production. However, fertiliser production and application are not neutral to human health and the environment, so they are controversial [1,2]. Nevertheless, the constantly increasing demand for food and ongoing degradation of the habitats of many animal species has required increases in food production efficiency without constant increases in agricultural lands. Despite continuous economic growth, food insecurity and undernourishment are still significant problems [3]. This situation is even more critical in 2022 due to geopolitical instabilities. One of the essential stages of fertiliser production is the Ostwald process, in which ammonia is catalytically oxidised to NO at short contact times on platinum–rhodium gauzes [4]. Besides NO as the main product, N2 and N2O are also produced. Motivated by its considerable industrial importance, substantial fundamental research has been directed towards the mechanistic understanding of the Ostwald process.
Numerous surface science studies have considered the individual steps of the overall reaction, including several mechanistic kinetic models based on surface science information. Warner [4] developed mechanistic models for kinetics and temperatures in industrial conditions. Aparicio and Dumesic [5] studied the microkinetic surface chemistry of ammonia oxidation over the iron catalyst. Kraehnert and Baerns [6] investigated ammonia oxidation in a microstructured quartz reactor. Rafti et al. [7] performed numerical simulations using mean field equations. Otomo et al. [8] applied an improved reaction mechanism. Scheuer et al. [9] compared mechanistic modelling with experimental data. Hickman et al. [10] modelled an ammonia burner with catalytic gauzes using rate equations obtained from surface experiments. Novell-Leruth et al. [11] applied Density Functional Theory calculations to study the microkineticts of ammonia oxidation. Despite this research, few published works have utilised Computational Fluid Dynamics (CFD) methods to simulate a platinum gauze reactor. Haas et al. [12] focused mainly on N2O selectivity. In earlier work, Haas et al. [13] used CFD methods to model an ammonia burner with a simplified catalyst gauze. Pottbacker et al. [14] conducted combined experimental and CFD research on temperature and concentration gradients. Wiser [15] applied detailed surface mechanisms in CFD simulations of ammonia oxidation. According to Wiser [15], CFD allows for an accurate model of the ammonia oxidation on platinum–rhodium gauze because this reaction is firmly heat- and mass-transfer-controlled, and the combined treatment of surface chemistry, flow, diffusion, and heat conduction should be considered.
Catalyst gauze degradation is a severe problem in the ammonia oxidation process because the morphology of the catalytic wire changes during the campaign. The restructuration occurs due to high temperature, pressure, and interactions with reactants. This process, called “catalytic etching” in the literature, is observed during other catalytic reactions such as hydrogen, ethane, and propene oxidation. In the beginning, the formation of parallel facets on the catalyst’s surface is observed after a few hours [15]. This step is followed by the growth of so-called “cauliflower structures” on the wire surface [4,16], which increases the catalyst’s surface area and enlarges the wire diameter. Continuous loss of platinum in the form of volatile platinum oxide is accompanied by the formation of such cauliflower structures. Generally, the platinum loss is caused by abrasion and vaporisation, though the latter is predominant. In the case of a Pt–Rh catalytic wire, platinum oxide is more volatile than rhodium oxide [4].
Pura et al. [17,18] conducted extensive research on catalyst degradation during the ammonia oxidation process, and Wiser [15] applied CFD methods to investigate the influence of degraded mesh on the process. However, there seems to be no published work for which the researchers utilised CFD methods to model the trajectories of platinum particles and investigate the influence of the geometry of gauze on the loss and recapturing of entrained platinum. This issue is significant due to the stagnation and recirculation areas after wires. This work was focused on determining the temperature gradient on a catalyst surface, which allowed us to designate zones of increased platinum release. Then, the trajectories of the catalyst particles were calculated to estimate the platinum losses on their basis. This methodology allowed us to compare the work of different variants of gases with varying diameters and altered arrangements of layers of catalytic grids.

2. Materials and Methods

2.1. Materials

Un the present work, the gas mixture (Table 1) used in the industry [19,20] was considered a continuous phase. The catalyst was in the form of gauze comprising an alloy of 95% platinum and 5% rhodium that maximises the NO conversion rate and reduces catalyst loss [20,21]. The last stage of this work comprised the modelling of trajectories of platinum particles (dispersed phase) entrained in the process due to the degradation of gauze. In the calculations, we assumed that the catalytic gauze and entrained particles consisted of pure platinum due to the dominant share of this element in the solid and dispersed phases.

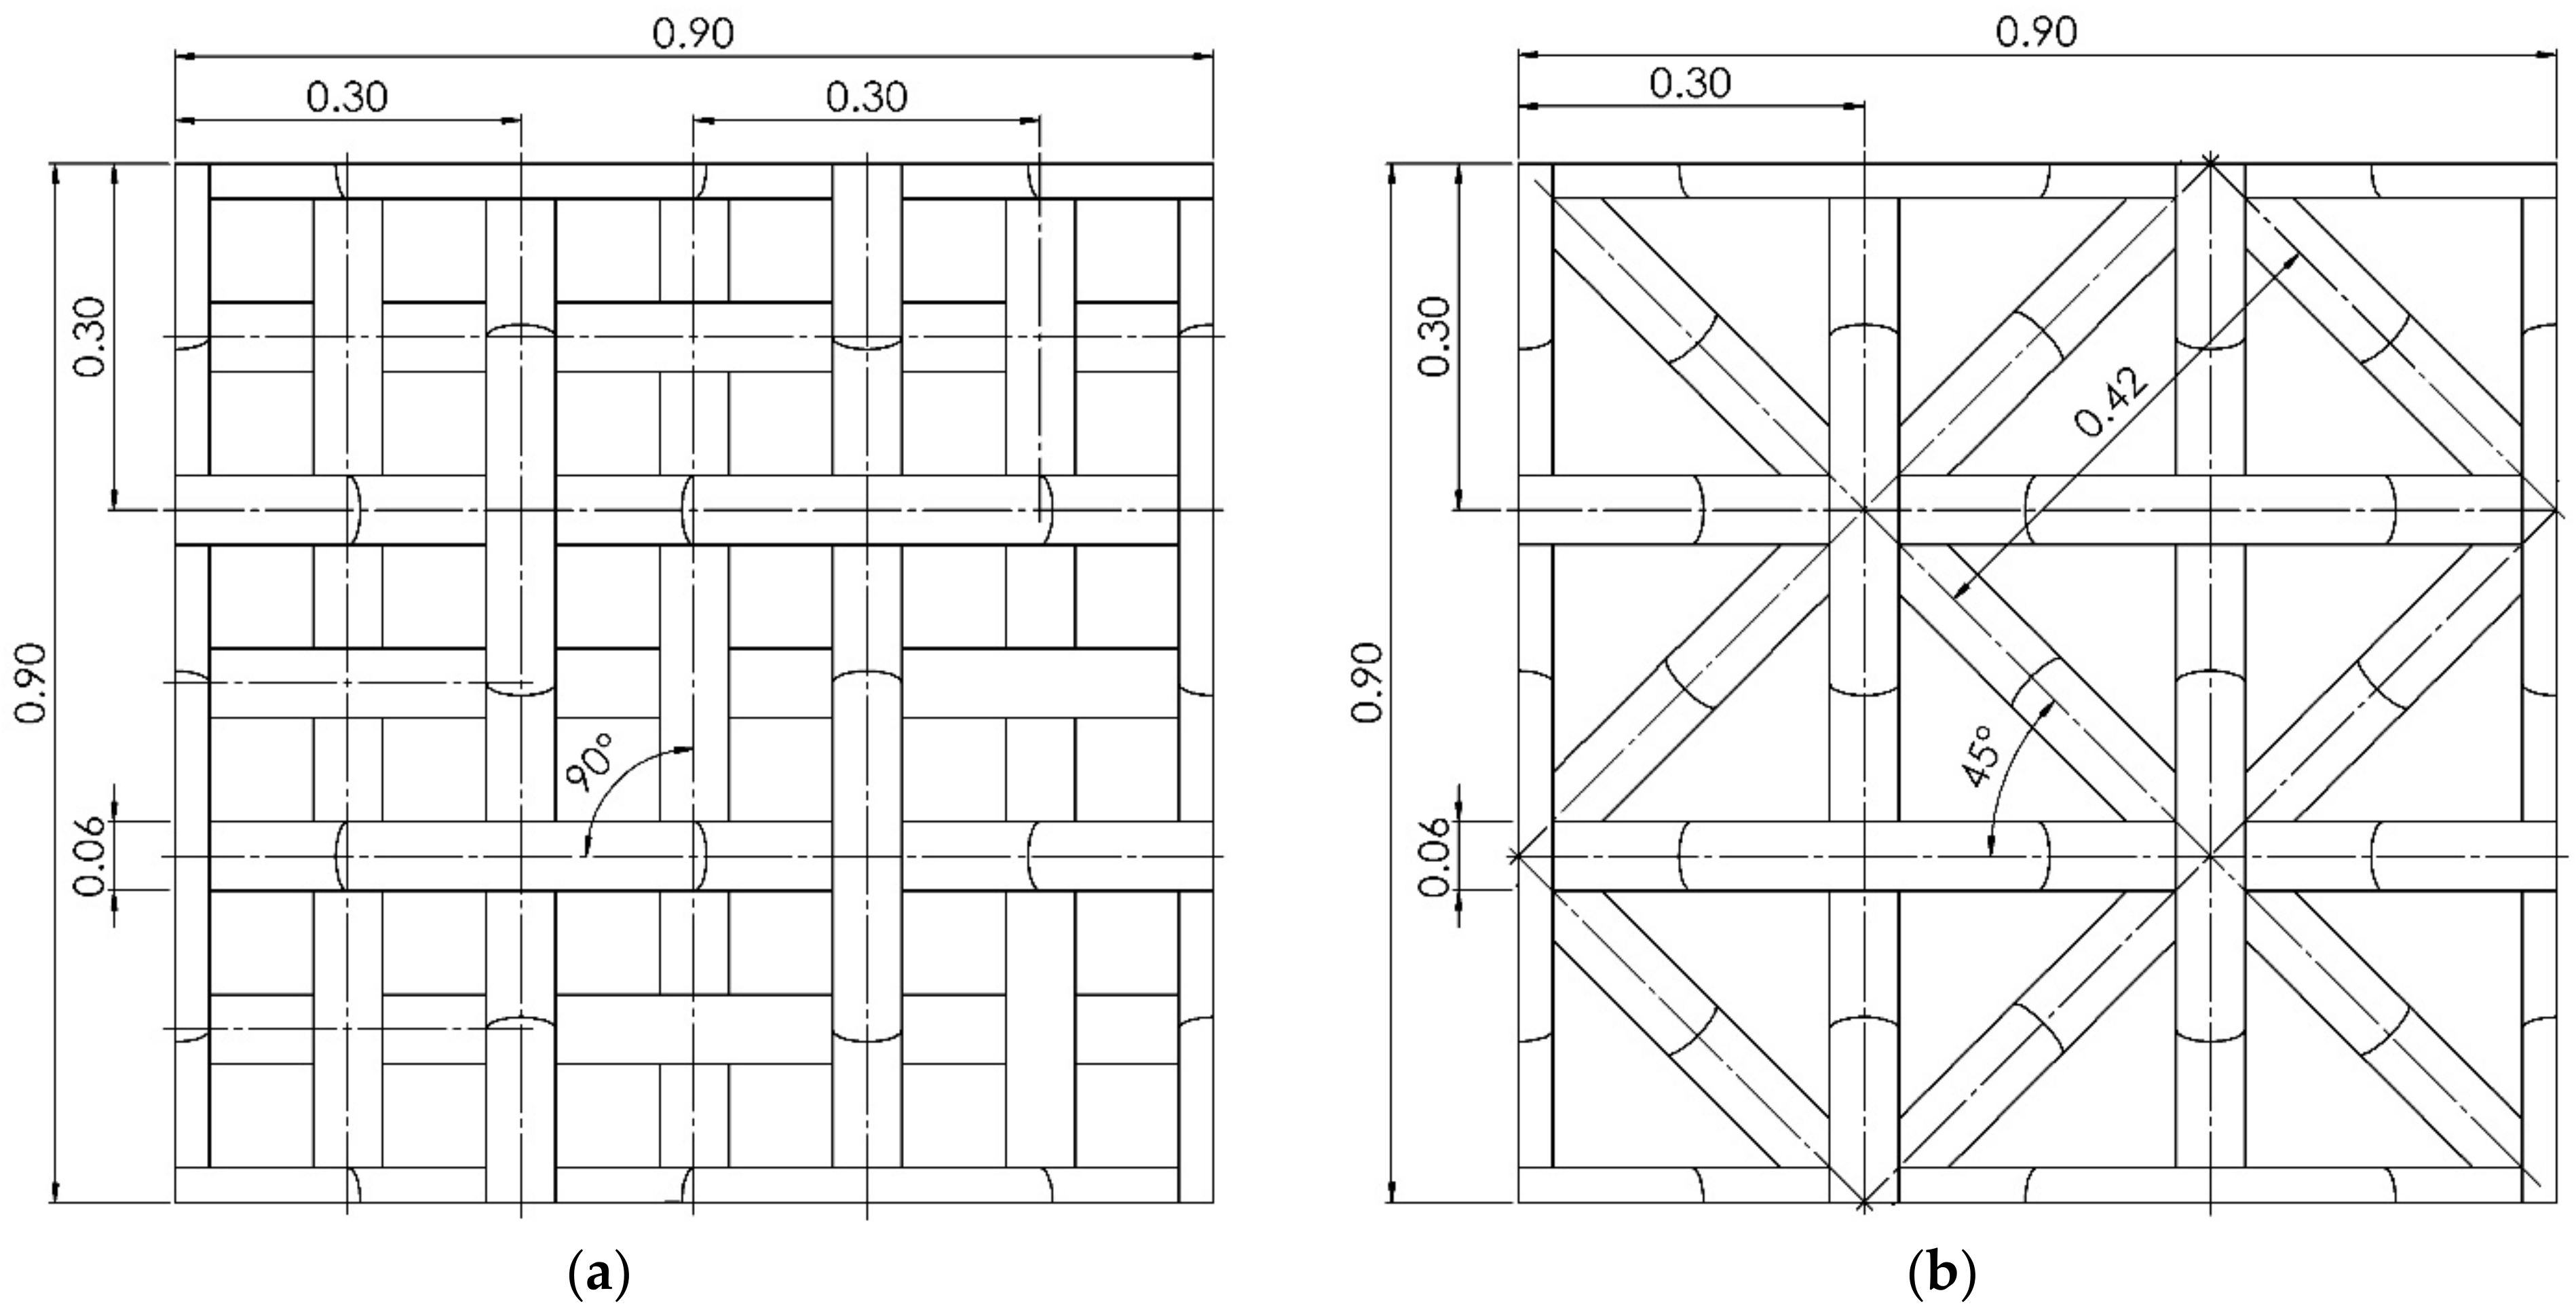
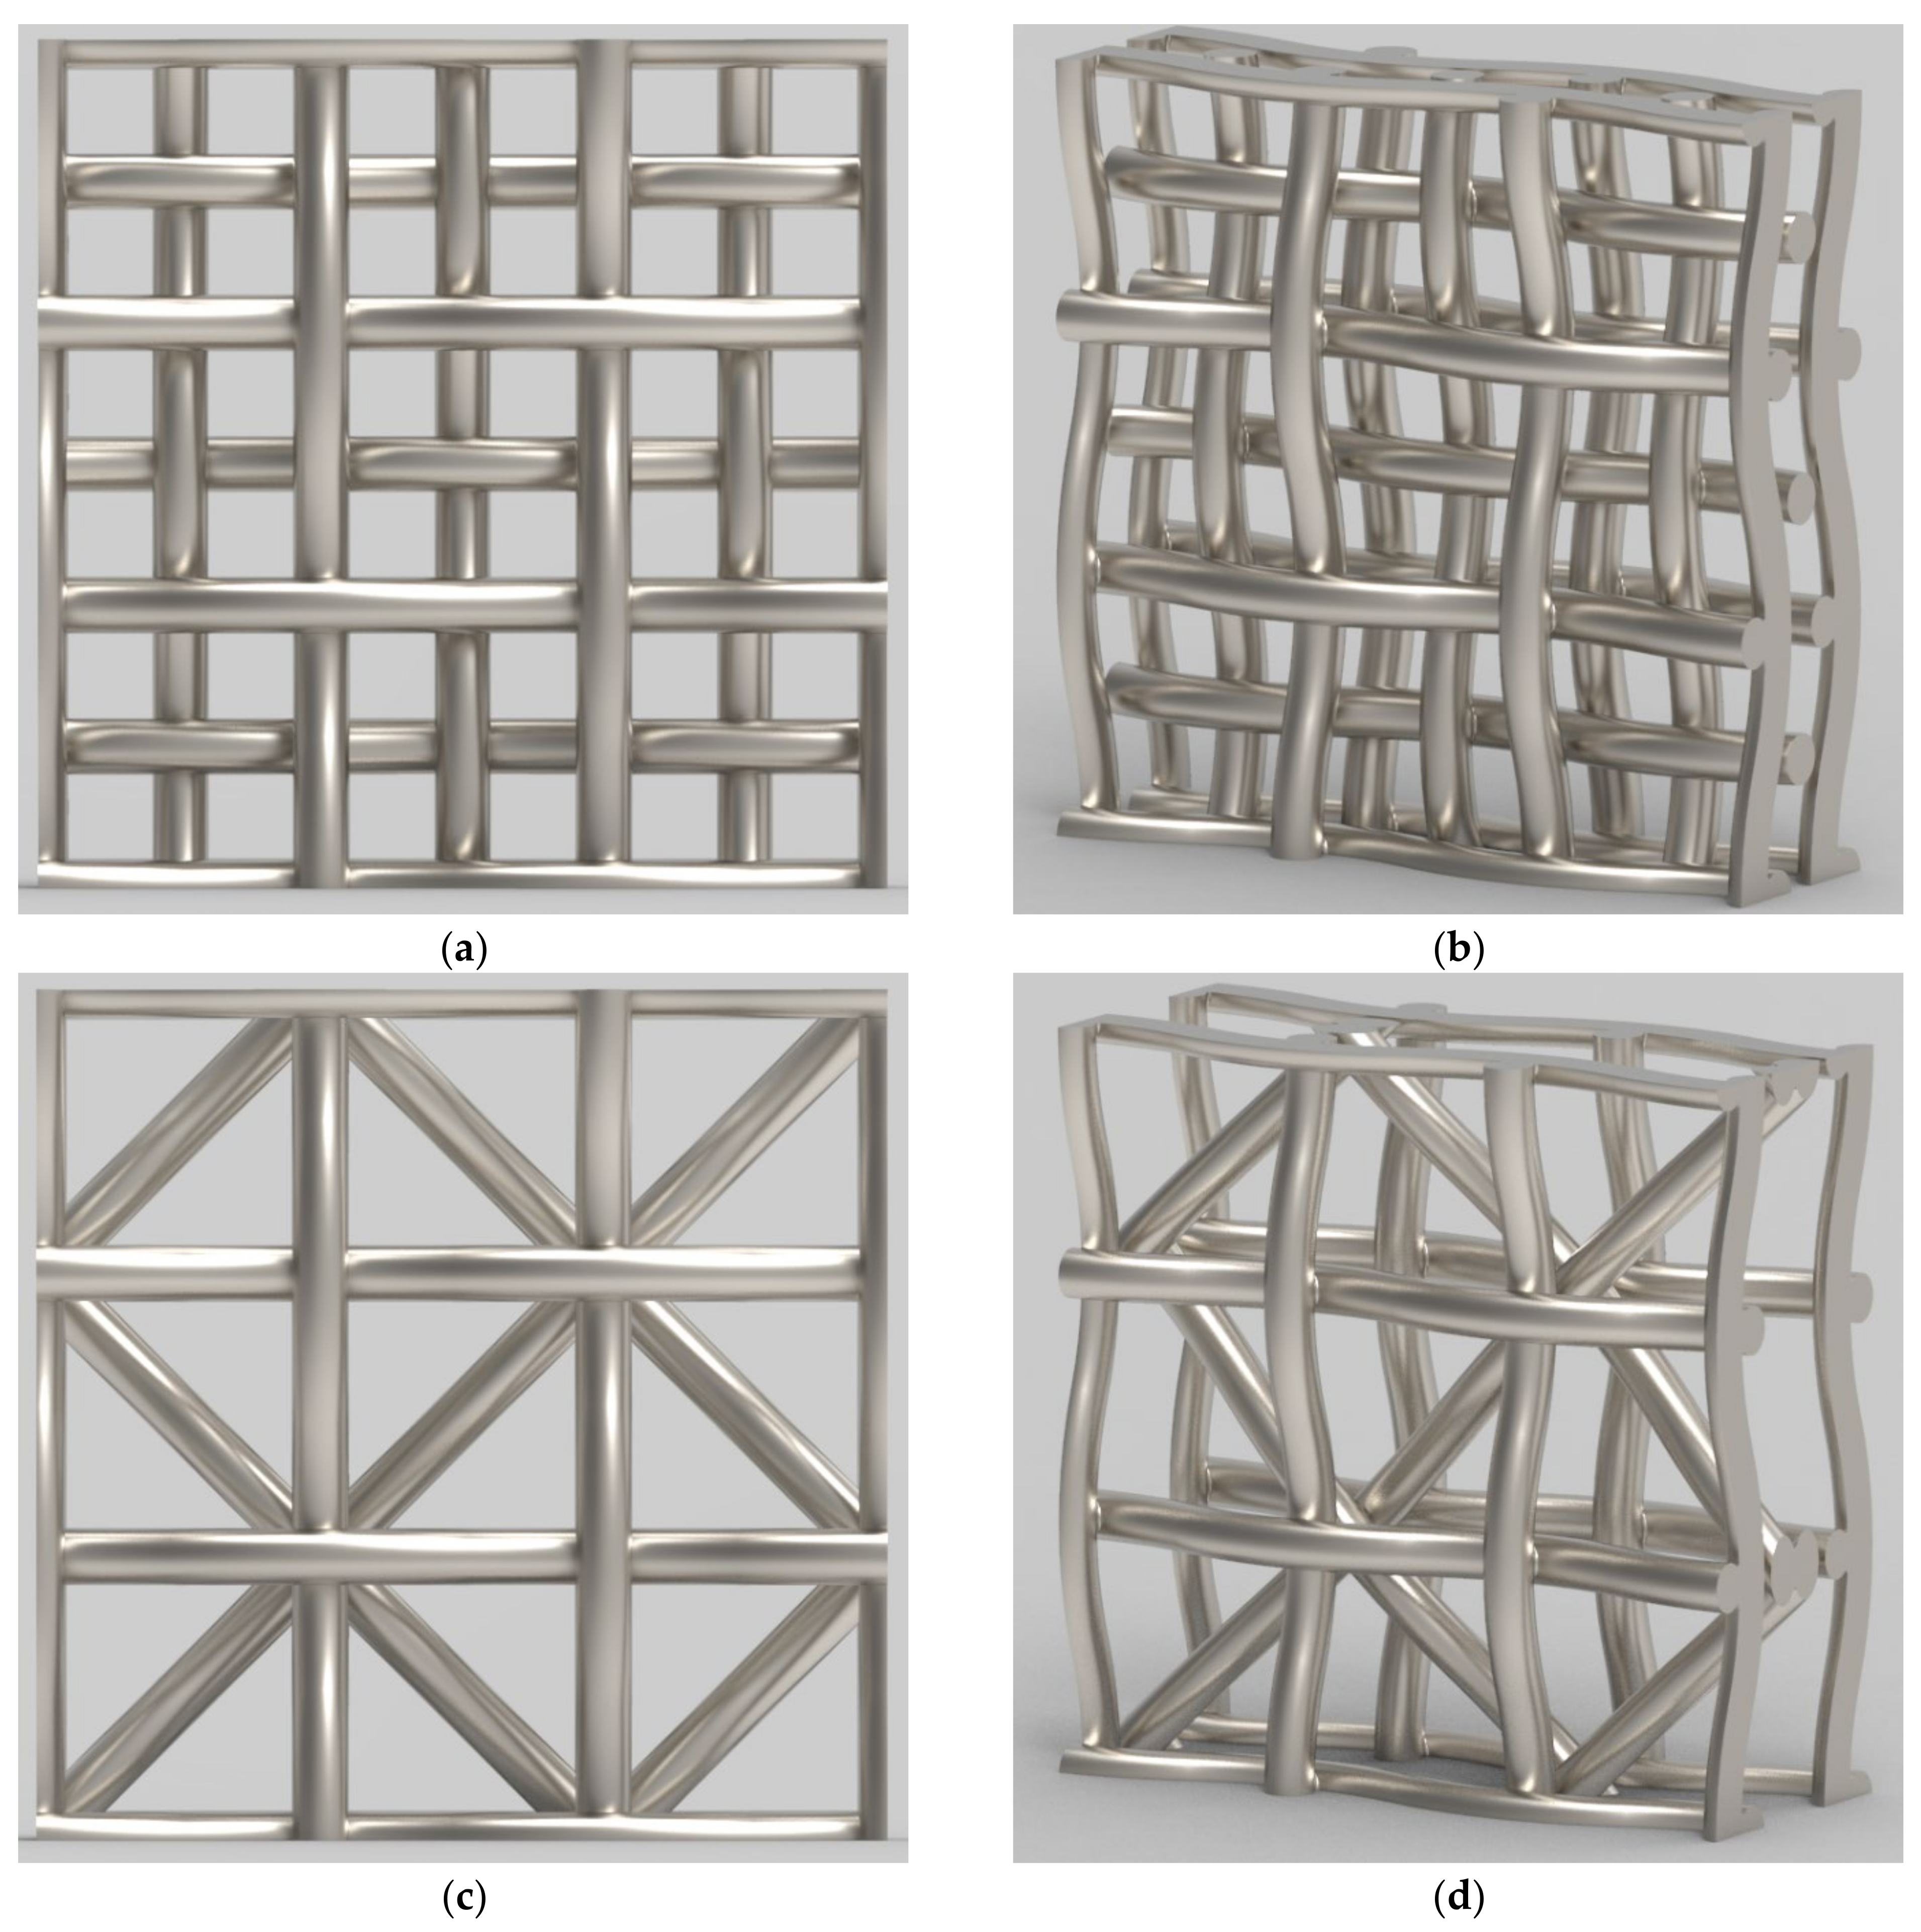
2.2. Catalyst Geometry and Properties

The catalyst gauze commonly used in the industry is woven gauze, and the wires’ diameter ranges between 0.06 and 0.076 mm, though the lower diameter is dominant [14,20,22]. In this work, gauzes with wire diameters of 0.06 mm were investigated. Typical industrial wires are woven with 1024 meshes per cm2 [20]. Based on this information, a 3D geometry of a three-layer gauze was modelled and implemented in simulations. Two catalyst gauze models were created. In the first variant (Geometry A), the second layer was shifted by half the mesh size in two axes relative to the first and third layers. The second variant (Geometry B) was a novel gauze type proposed by authors. In this gauze modification, the second layer was shifted by half the mesh size on one axis and rotated 45° relative to the first and third layers. Figure 1 presents the differences and dimensions between basic and novel geometries.
The gauze geometries used in this work were simplified to nine meshes. The gauze was cut at the symmetry axis of the outer wires to minimise the error from applying symmetry boundary conditions at the edges of the computational domain. Table 2 summarises the differences and critical dimensions between the considered geometries. Figure 2 illustrates the visualisations of investigated gauzes.

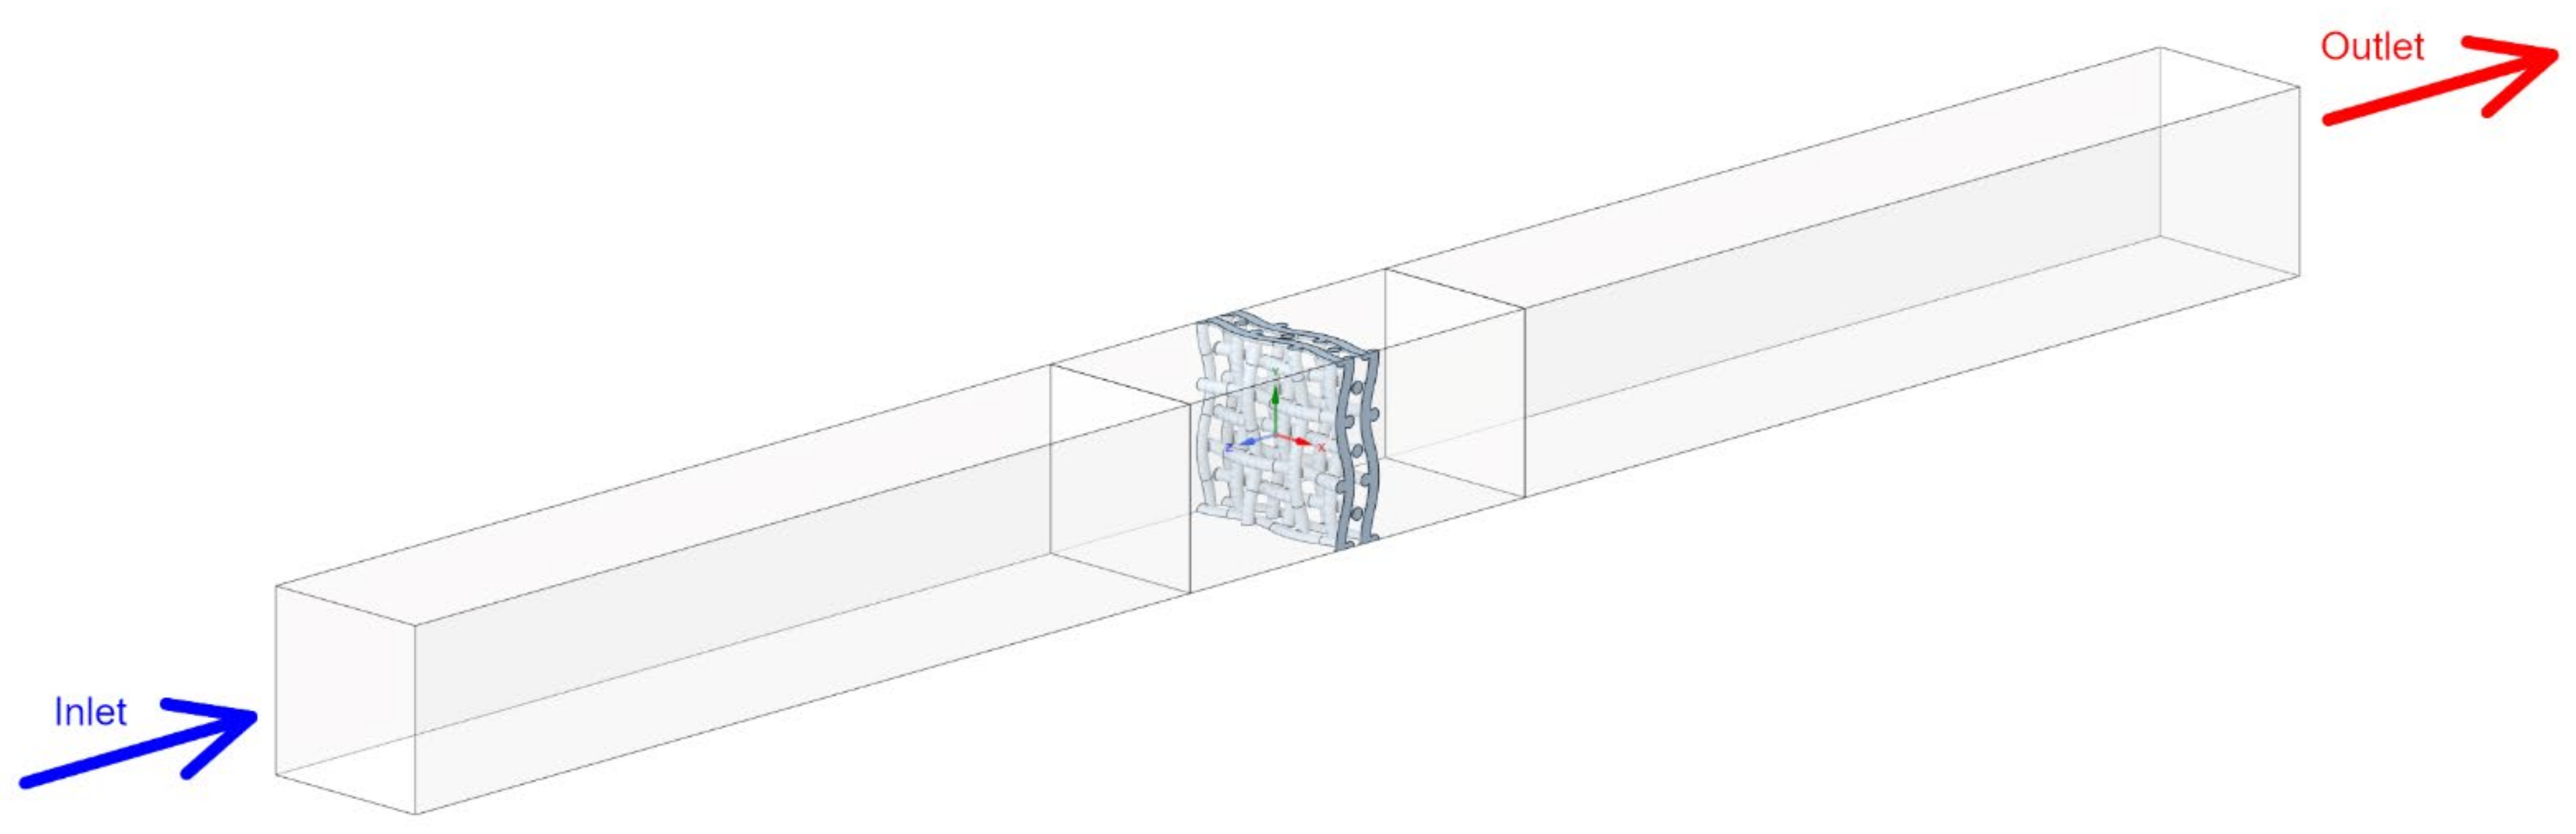
2.3. Computational Domain

The computational domain used in simulations was a small clipping of the ammonia burner. Its shape was a cuboid of 0.9 × 0.9 × ~12 mm. This cuboid contained a 3 × 3 mesh of catalyst gauze in its centre fragment, which is presented in Figure 3. Both solid and fluid phases needed to be considered because the reaction is highly exothermic and heat conduction in solid catalyst wires is critical. According to Wiser [15] and Pottbacker et al. [14], the radiative heat of the wires is negligible. Wiser [15] states that the radiative heat of the first wire contains only 1.7% of the total heat produced. In his research, he conducted CFD calculations to compare models with and without radiation, which resulted in the conclusion that models with radiation only slightly improve results with the drawback of tripled calculation time.
The “velocity-inlet” and “pressure-outlet” boundary conditions with constant values were set to the inlet and outlet of the domain, respectively. The rest of the external boundary conditions were set to “symmetry”. Although the “symmetry” boundary condition is a simplification, applying it increased the calculations’ stability and helped to achieve better convergence. Boundary conditions between the continuous phase and the solid catalyst were set as a stationary wall without a slip and with coupled thermal conditions.

2.4. Continuous Phase Modelling

Computational meshes were generated with the Ansys Fluent 2021 R2 meshing module. Due to the importance of heat conduction in catalyst wires, both fluid phase and solid catalyst wires were meshed. The number of cells of the numerical grids was approximately 1.14–1.42 million polyhedral cells, depending on the geometry variant. The mesh was the finest in the catalyst and reaction vicinity and was tested on variants with the highest Reynolds numbers. Two quantities were used to check the mesh independence: the system’s average turbulence energy dissipation rate and wall shear stress value at the walls. The y + ~1 condition was satisfied by setting the near-wall cell sizes. Different meshes were tested until the difference between those two quantities was less than 3% compared to those with a denser mesh. The obtained mesh was validated by comparing calculated results with literature data [12,15]. The inlet and outlet influx areas were generated using the extrude method to minimise the mesh size. All calculations were conducted in the Ansys Fluent 2021 R2 solver. The SIMPLE method was used for the pressure–velocity coupling and the second-order discretisation schemes were used for all variables. The calculations were conducted until all total normalised residuals were smaller than 10−8. According to the literature [12,15], turbulence has a minor role in the process due to the slight clearances in the gauze and, therefore, has low Reynolds numbers in the catalyst wires’ vicinity. However, the k-ε model was used in calculations to improve the simulation of the gas phase outside the gauze area. Wiser [15] also proved that the k-ε model can be used to simulate flow in the vicinity of a catalyst. The following equations govern the continuity (1), momentum (2), turbulent kinetic energy (3), and the specific dissipation rate of turbulent kinetic energy (4) in the k-ε model [23]:
ρ t + · ρ   v = 0
t ρ   v + · ρ   v v = p + · μ v + v T 2 3 · v I
t ρ k + x i ρ ku i = x j μ + μ t σ k k x j + G k + G b ρ ε Y M .  
t ρ ε + x i ρ ε u i = x j μ + μ t σ ε ε x j + C 1 ε ε k G k + C 3 ε G b C 2 ε ρ ε 2 k
The operating conditions of the continuous phase used in simulations are listed in Table 3.

2.5. Reaction Kinetics

In this work, the ammonia oxidation reaction was simulated using Species Transport in a pressure-based solver. In Ansys Fluent, this model solves a convection–diffusion equation for each species according to the following Equation [23]:
t ρ Y i + ρ v Y i = J i + R i + S i
The diffusion flux of each species is calculated as a gradient of concentration and temperature and by default from Fick’s law. The turbulent flow Equation (5) contains the Schmidt number, as described by turbulent viscosity and diffusivity. The gas mixture properties were calculated based on the ideal gas mixing law. The diffusivity coefficients were computed using the unity Lewis number, which determines the ratio of thermal diffusivity to mass diffusivity.
The kinetics of ammonia oxidation on a solid catalyst are complex, and many complex models describe this mechanism, e.g., those developed by [4,6,11]. All those models contain numerous surface reactions, including adsorption and desorption. Those mechanisms are difficult to implement in CFD. They require a vast amount of computing resources, and achieving converged solutions and stability in the calculation is challenging. However, when modelling the degradation of platinum wires, it is not necessary to simulate the whole process. The crucial parameter is temperature distribution, which can be accurately obtained using the ammonia oxidation kinetics simplified to a single surface reaction:
4 NH3 + 5 O2 → 4 NO + 6 H2O
The disadvantage of the simplifications adopted is that secondary reactions are not taken into account, thus overestimating nitric oxide production. However, the use of a simplified model does not significantly affect the values and temperature profile near platinum wires, which is crucial for their degradation process. The reaction rate can be calculated by an empirical expression proposed by [25]:
r = kc i α
where α is an empirically determined constant according to [25]. The forward rate constant for this reaction is computed using the Arrhenius equation:
k = A r T β r e E r RT
where Ar represents the pre-exponential factor, βr is a temperature exponent, Er is the activation energy, and R is the universal gas constant. The temperature exponent was set to 0.5. The parameters used in Equations (6) and (7) are listed in Table 4.
The surface reactions change the gas phase, surface-adsorbed (site), and bulk (solid) species. The mass flux of gas species due to the convection and diffusion is balanced with its rate of consumption/production [23]:
ρ wall D i , wall Y i ,   wall n m ˙ dep Y i , wall = M w , i R ^ i , gas i = 1 , 2 , 3 , , N g
where R ^ i , site is a rate of reaction on the catalyst surface:
R ^ i , site = S i wall t i = 1 , 2 , 3 , , N s
where Y i , wall is the wall mass fraction related to the concentration by:
G i wall = ρ wall Y i , wall M w , i
where m ˙ dep is the net rate of mass deposition as a result of the surface reaction:
m ˙ dep = i = 1 N b M w , i R ^ i , bulk
where S i wall is site species concentration defined as:
S i wall = ρ site Z i
Other symbols used in Equations (8)–(12) are as follows: ρwall is the wall phase density, t is time, Mw,i is the species molecular weight, R ^ i , bulk is the reaction rate of the bulk phase, ρsite is the site density, and Zi is the site coverage of species. The diffusion term appearing in Equation (8) is calculated as the difference of the species mass fraction at the cell centre and wall face centre divided by the distance between these centre points.

2.6. Discrete Phase Modelling

The simulation of trajectories of platinum particles was a critical part of this work, as it allowed us to investigate the influence of gauze geometry on the total number of platinum losses due to catalyst degradation. The proper selection of process parameters, such as the contact time of gases with catalyst gauze and the position of wires in gauze, can minimise this undesired phenomenon.
The Discrete Phase Model (DPM) with turbulent dispersion detailed in [26] was utilised to predict entrained platinum’s movement and deposition using a Lagrangian frame of reference. The modelled particles were considered ideal, hard spheres with a diameter of 1 μm and a pure platinum density (21,090 kg m−3). We assumed the following for calculations: there was no interaction and coalescence between the particles, particles did not affect the gas phase, and the gravitational forces acting on particles were negligible. Boundary conditions applied to the DPM model are described in Section 3.4.

3. Results

This study was aimed at determining the influence of the geometry and layer arrangement of catalyst gauze on the course of the process and the unfavourable phenomenon of catalyst degradation. For this purpose, the contour profiles of velocity, temperature, and concentration were determined with Computational Fluid Dynamics. The obtained results were the basis for determining the trajectory of entrained platinum particles. From a practical point of view, the contact time of gas and catalyst, the efficiency of platinum particles trapped by subsequent layers, and the mass efficiency of NO conversion were used to investigate the problem.
Contact time is a critical parameter in the oxidation of ammonia. Due to undesirable post-reactions, this process must be operated with a short contact time between the reactants and the catalyst. Therefore, it was used as a reference parameter for the results. Equation (13) expresses the contact time:
t = H v
where H [m] is the height of the gauze and v [m/s] is the average velocity between wires.

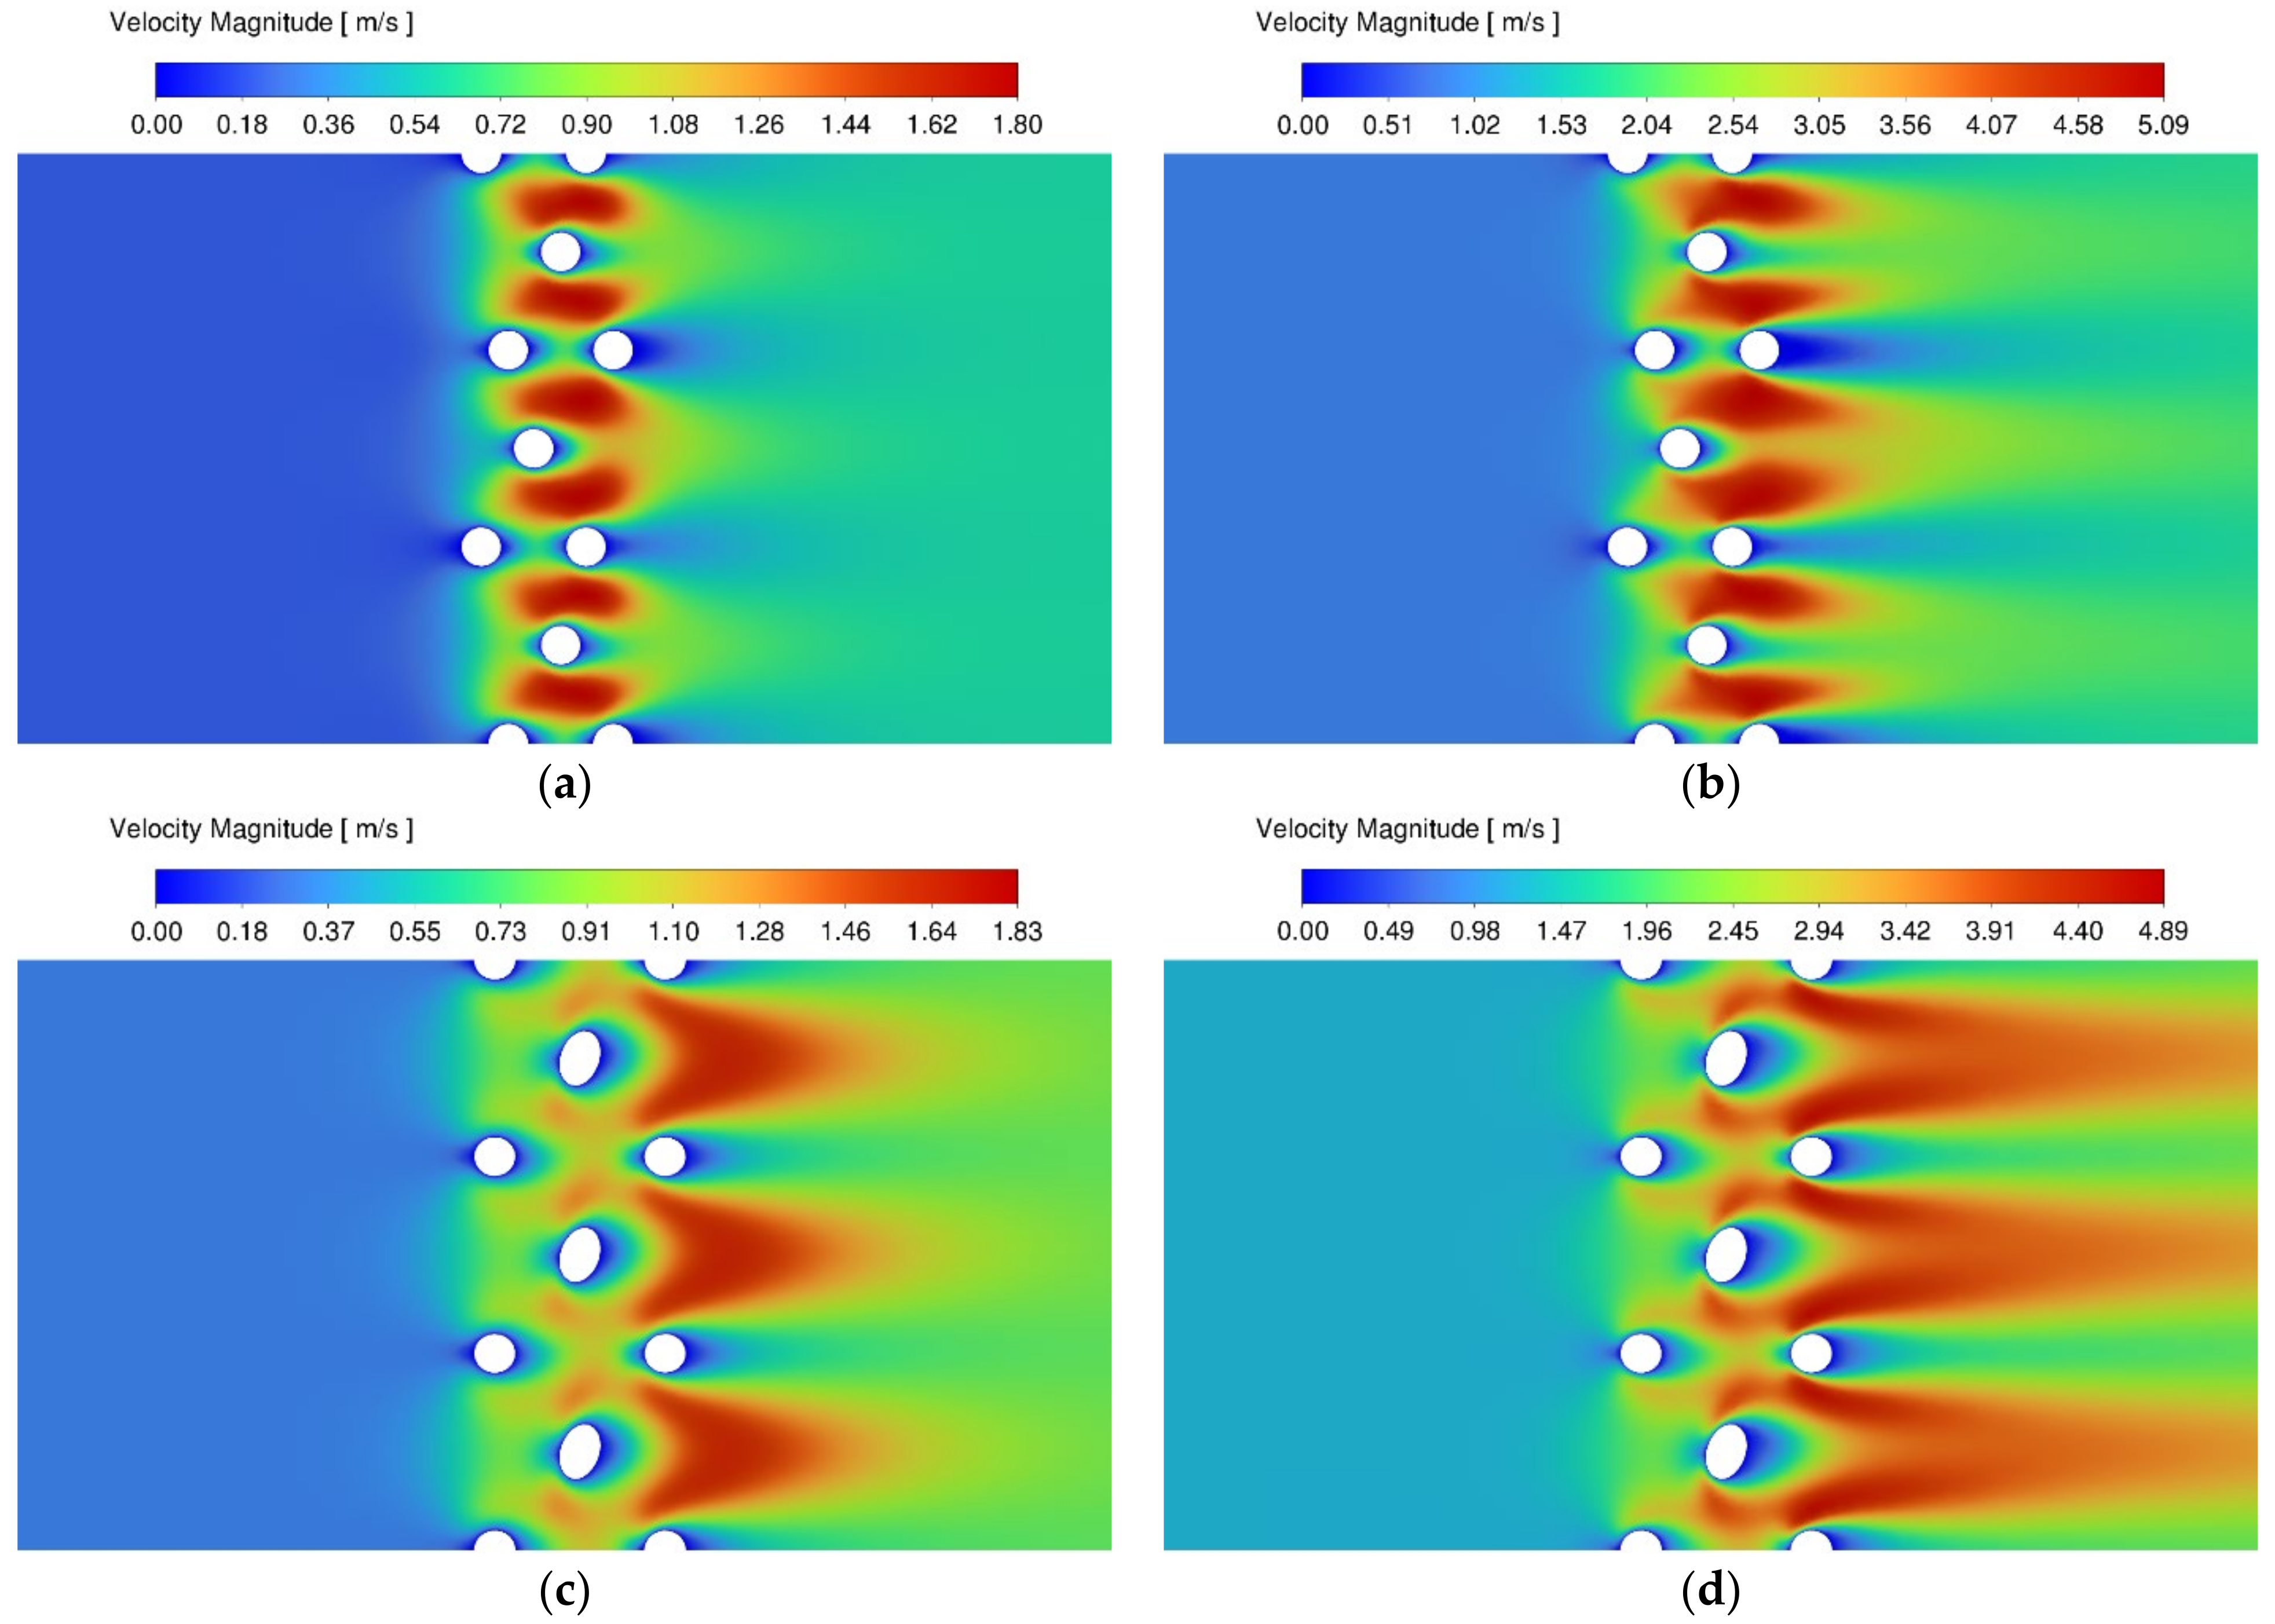
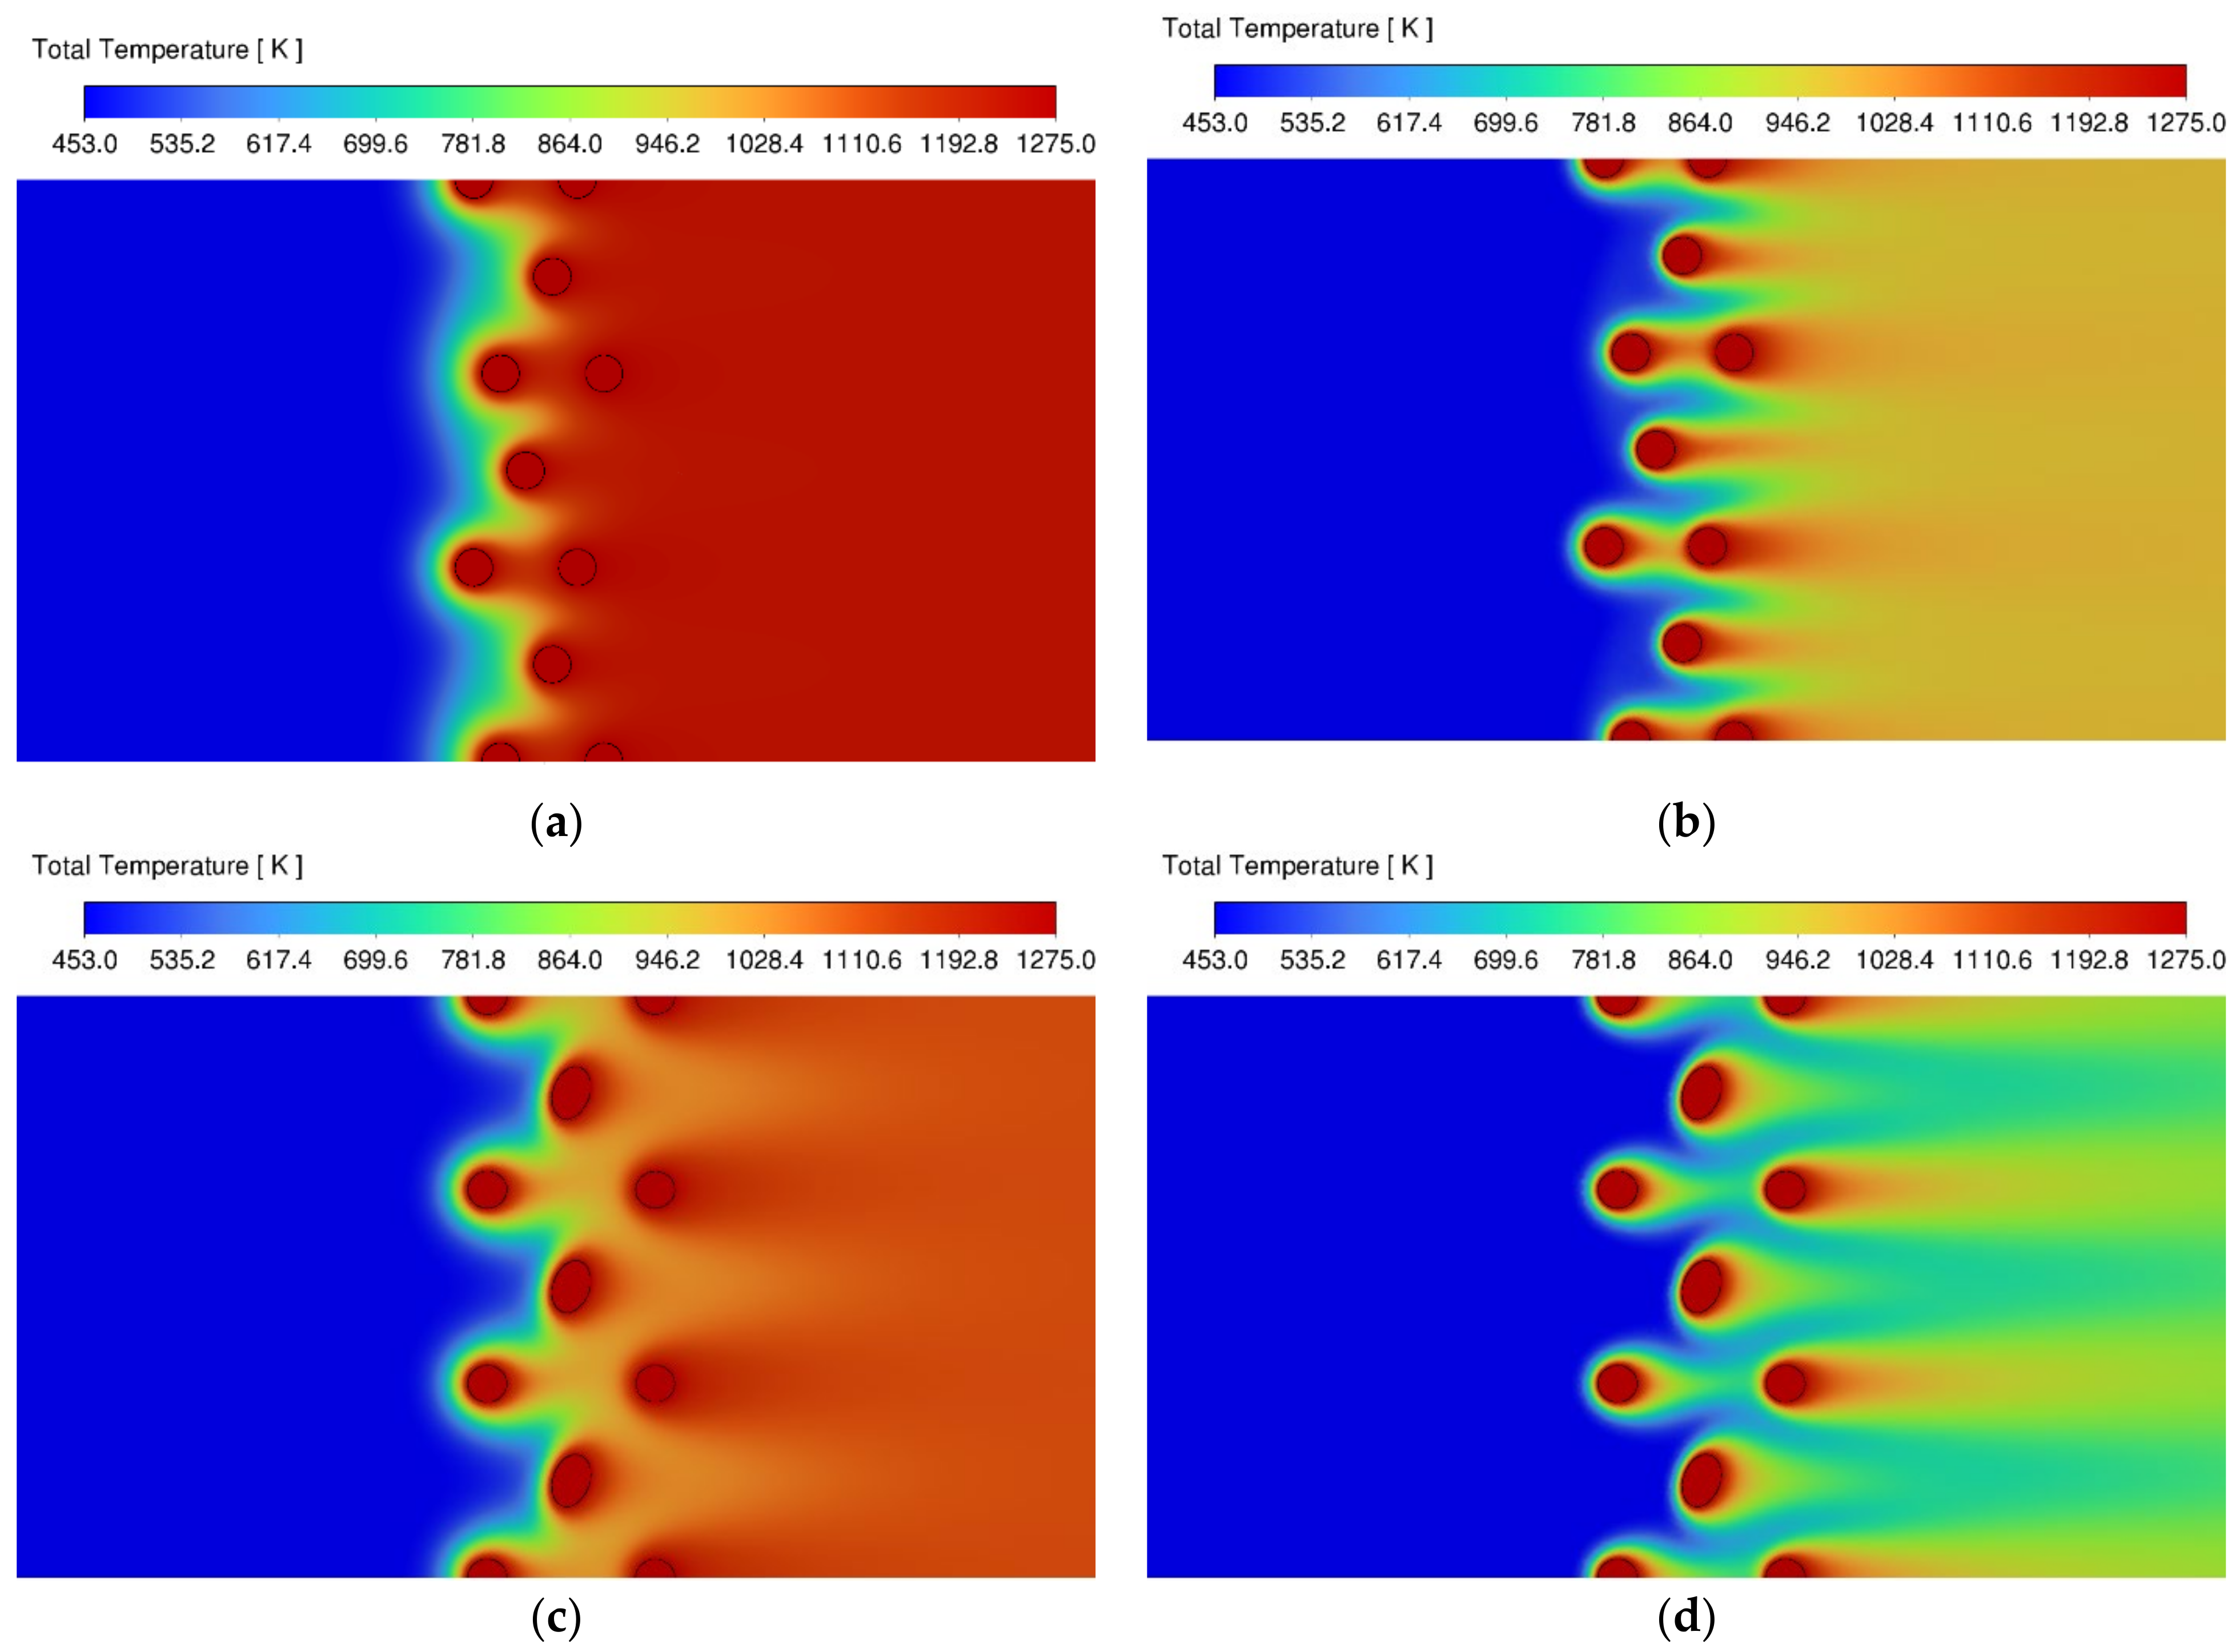
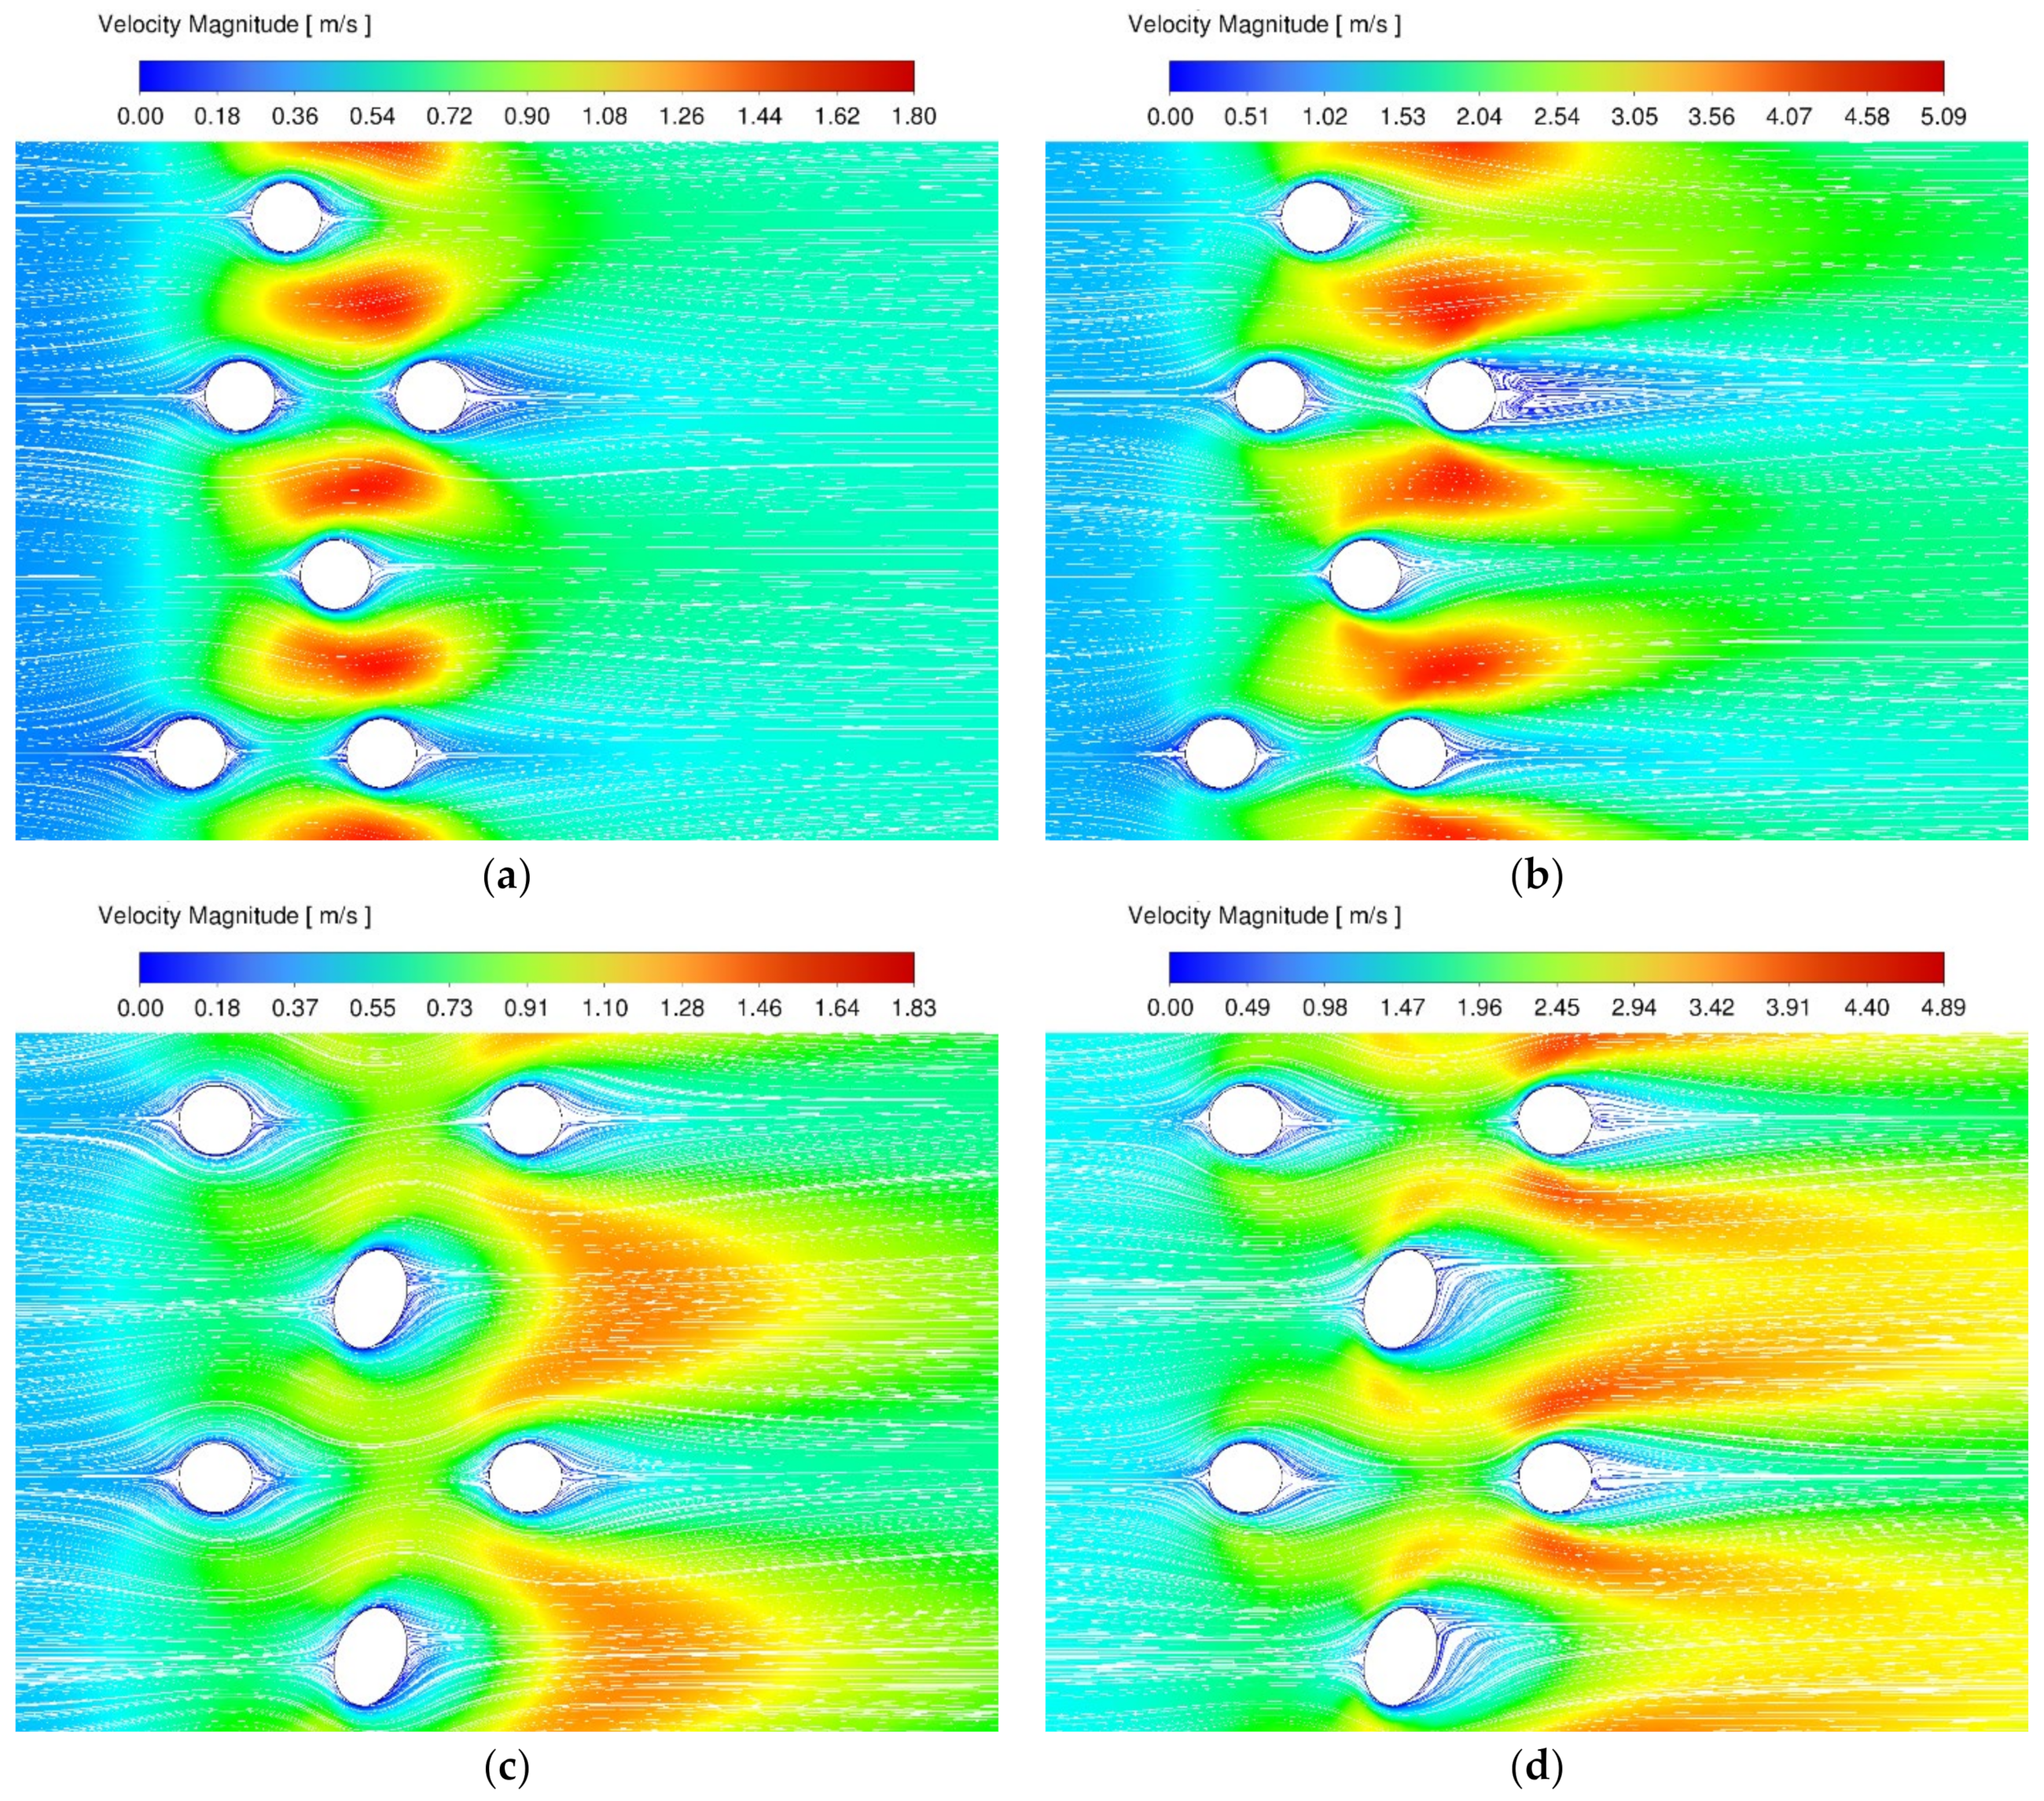
3.1. Velocity and Temperature Contours

Figure 4 presents velocity contours for the investigated geometry variants in the plane of the largest clearance.
The velocity profiles around the catalyst wires are an essential parameter that directly influences mass and heat transfer behaviour. The delivery of the reactants to the catalyst charge and the collection of the products determine the rate of the primary reaction and the likelihood of parallel and subsequent undesirable reactions. It was observed that the velocity between wires increased due to the reduction in clearance between wires, which was consistent with the continuity equation. Furthermore, an increase in the velocity in this area accelerated the reaction by increasing the heat and mass transfer coefficients but also reduced the contact time of the fluid with the surface of the catalytic wire. This is also a crucial aspect when considering the occurrence of secondary reactions. Due to the specific structure of the second layer, there was a noticeable difference between Geometries A and B. Geometry B had a larger clearance of the middle layer, therefore the fluid had to have a higher reactor inlet velocity to maintain the same contact time as in Geometry A. This means that, for the same contact time, we have a higher volumetric flux of gas flowing through the reactor.
Figure 5 shows total temperature contours. The characteristic contrails of high temperature behind the wires can be observed and were an effect of reverse flow in the separation zone. The temperature sharply rose as the gas came into contact with the gauze. A few millimetres behind the wires there was a homogeneous temperature distribution, and this distance increased with velocity. Temperature is a crucial parameter that influences the course of the primary and secondary reactions and the degradation of wires due to thermal stresses. The temperature contours were consistent with literature data [12,15]. One can notice that Geometry B has lower uniformity of temperature profiles than Geometry A. This unfavourable phenomenon results in some reaction efficiency reduction for the same contact time, but if we compare NO conversion efficiency per 1 g of catalyst for the same reactor inlet velocity, differences are small. More details of this phenomena are described in Section 3.3.

3.2. Stagnation Areas

Stagnation areas are an unwanted phenomena that significantly influence the reaction and temperature distribution, and they directly affect the degradation process. It was possible to observe a growing stagnation zone behind the wires in subsequent layers (Figure 6). The third layer had a much larger back mixing zone than the first, which led to a decrease in the degree of reactivity in the subsequent layers compared with the first layer.
Figure 6 presents pathlines of velocity passing through the wire gauze. One can notice that fluid velocity was zero at a close distance from the surface of the catalyst wires, which locally caused higher contact time and temperature. This led to the conclusion that the velocity between the wires was higher and better mixed, potentially enhancing the contact between fluid and catalyst surface and influencing conversion efficiency. It can be noticed that for the contact time of 0.001 s, the stagnation zone was practically non-existent, while for the contact time of 0.00025 time, this zone was already significant. There was a substantial difference in the intensity of the stagnation zone phenomenon between Geometries A and B. In both cases, stagnation areas increased with velocity, although the growth was much higher for Geometry A.
Figure 6 shows that particles released from the lower part of the first layer mainly settled on the third layer and not on the second one, which resulted from the arrangement of layers towards each other and from the inertia of particles that moved with the fluid. Accordingly, it is possible to influence the degree of capturing platinum particles by changing the arrangement of subsequent layers; however, this should not be achieved at the expense of a decrease in the efficiency of the reaction.

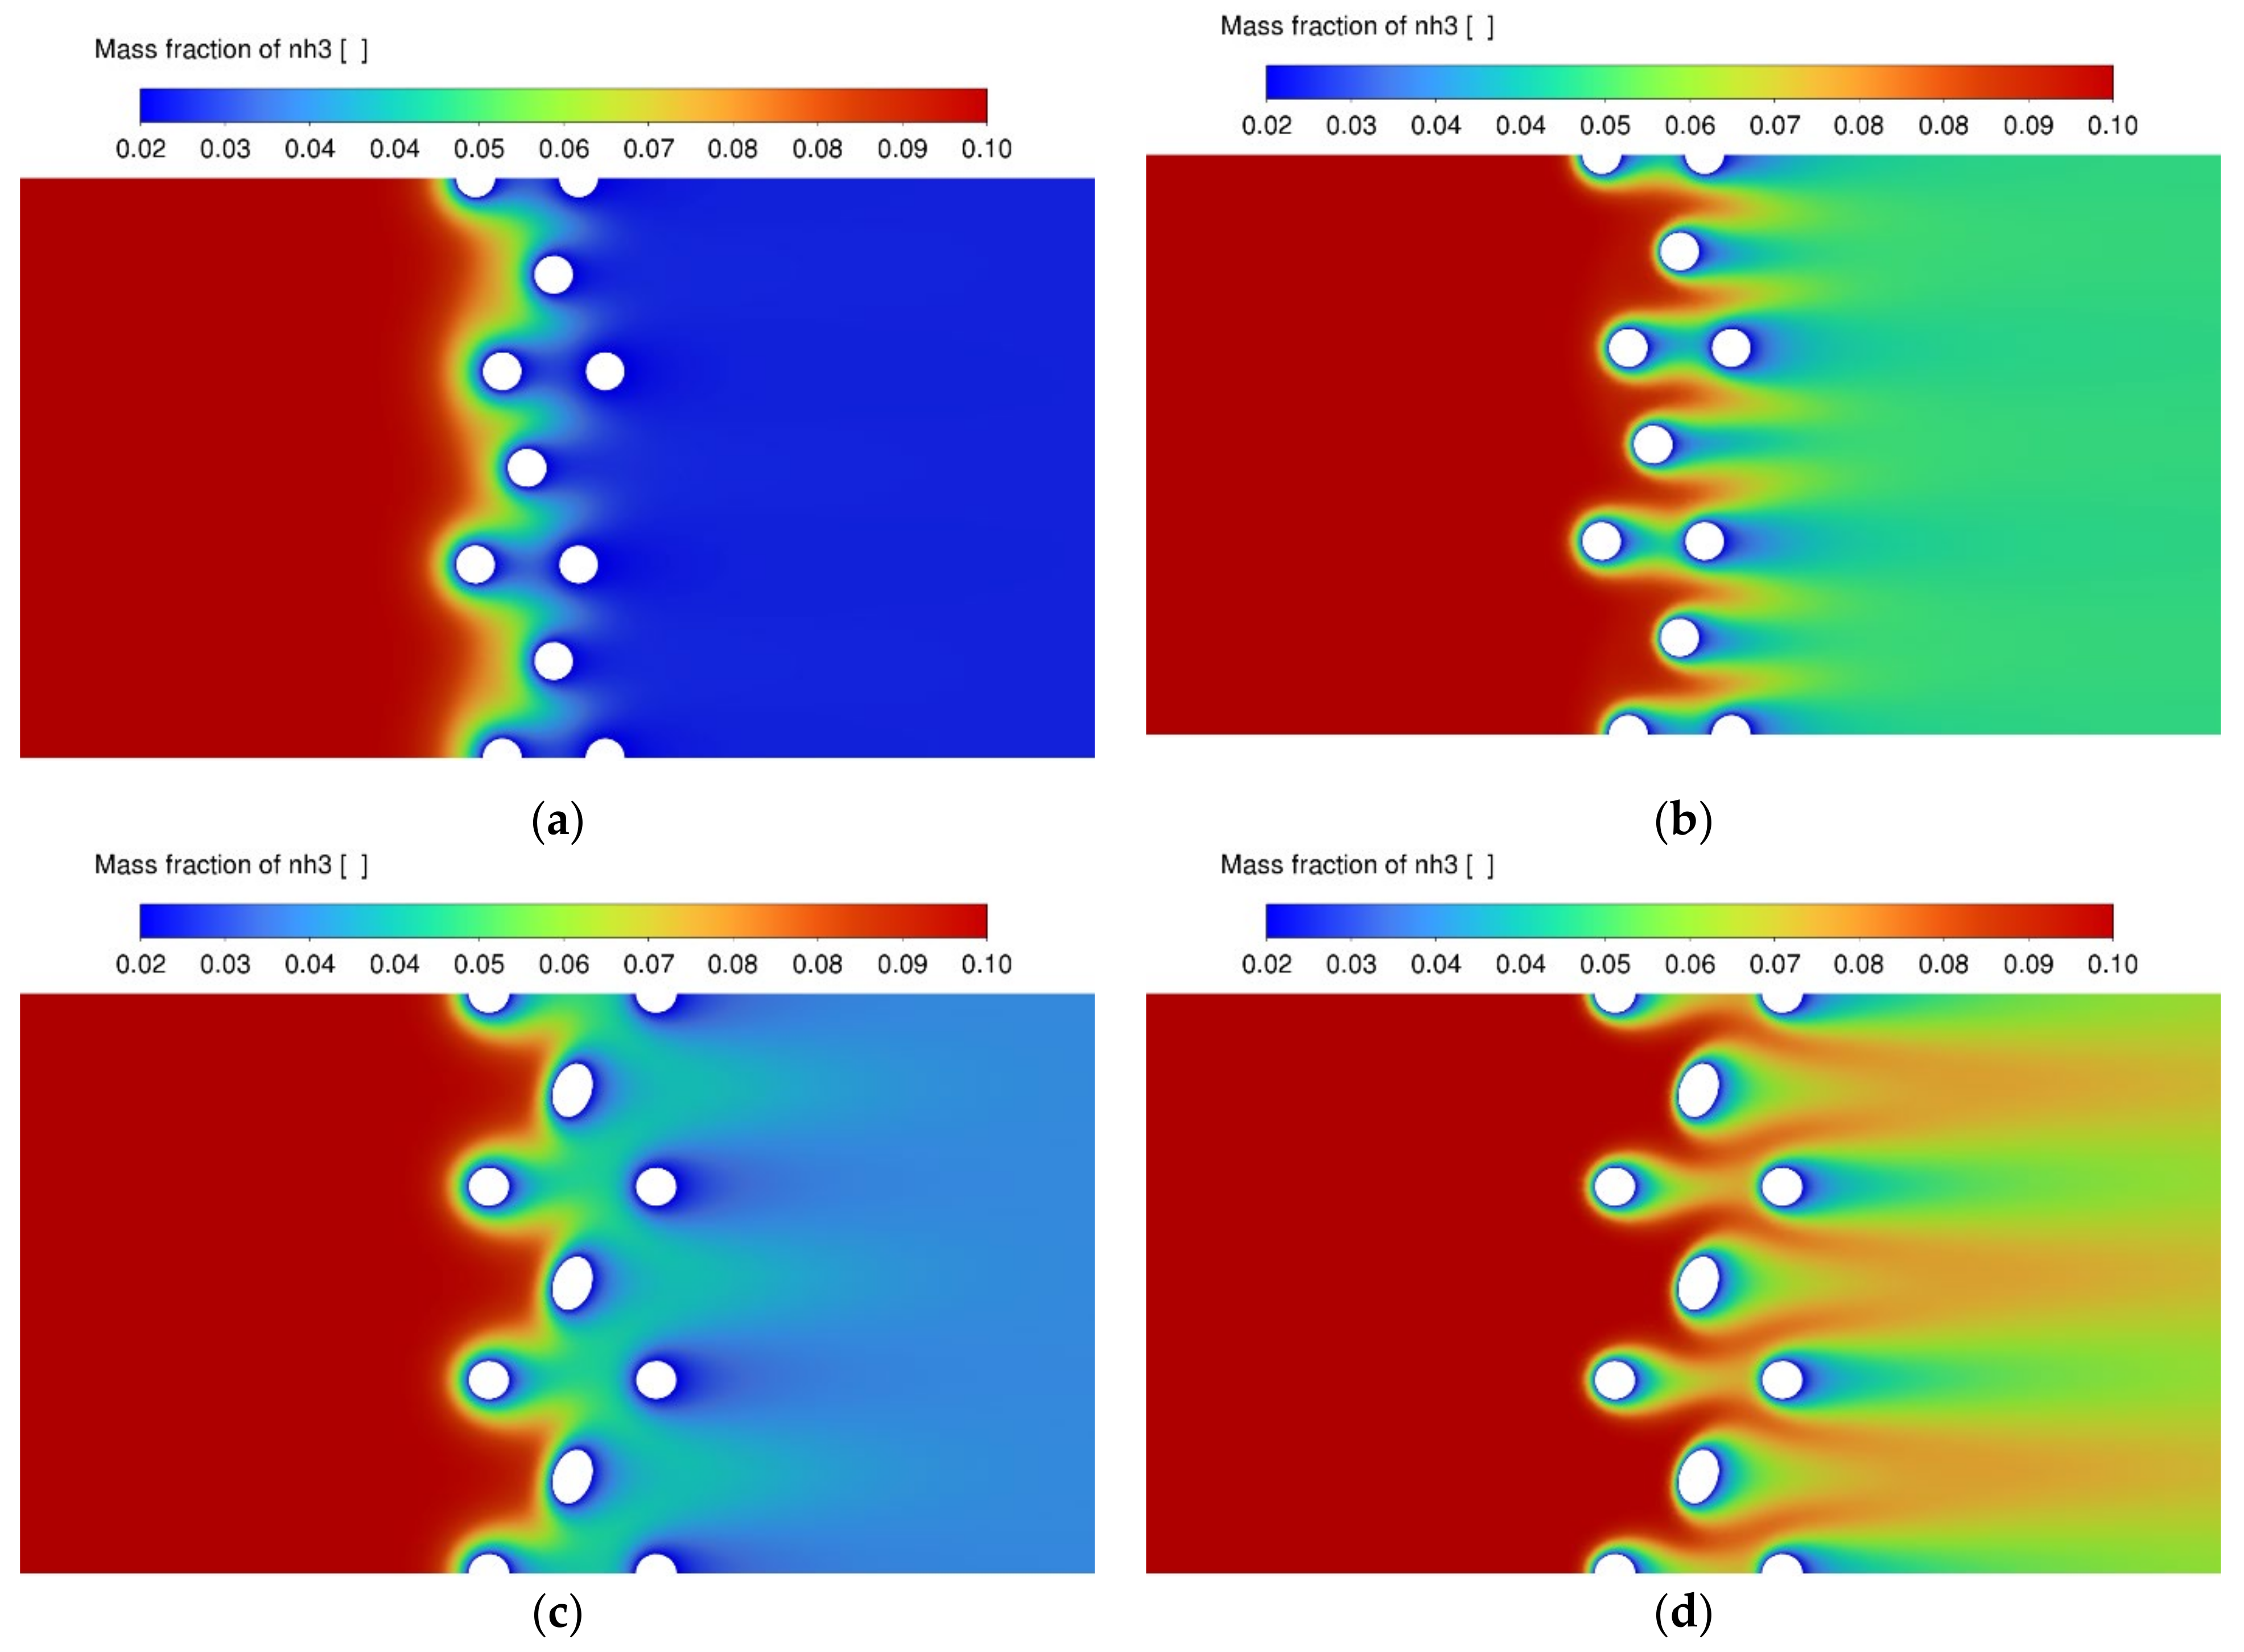
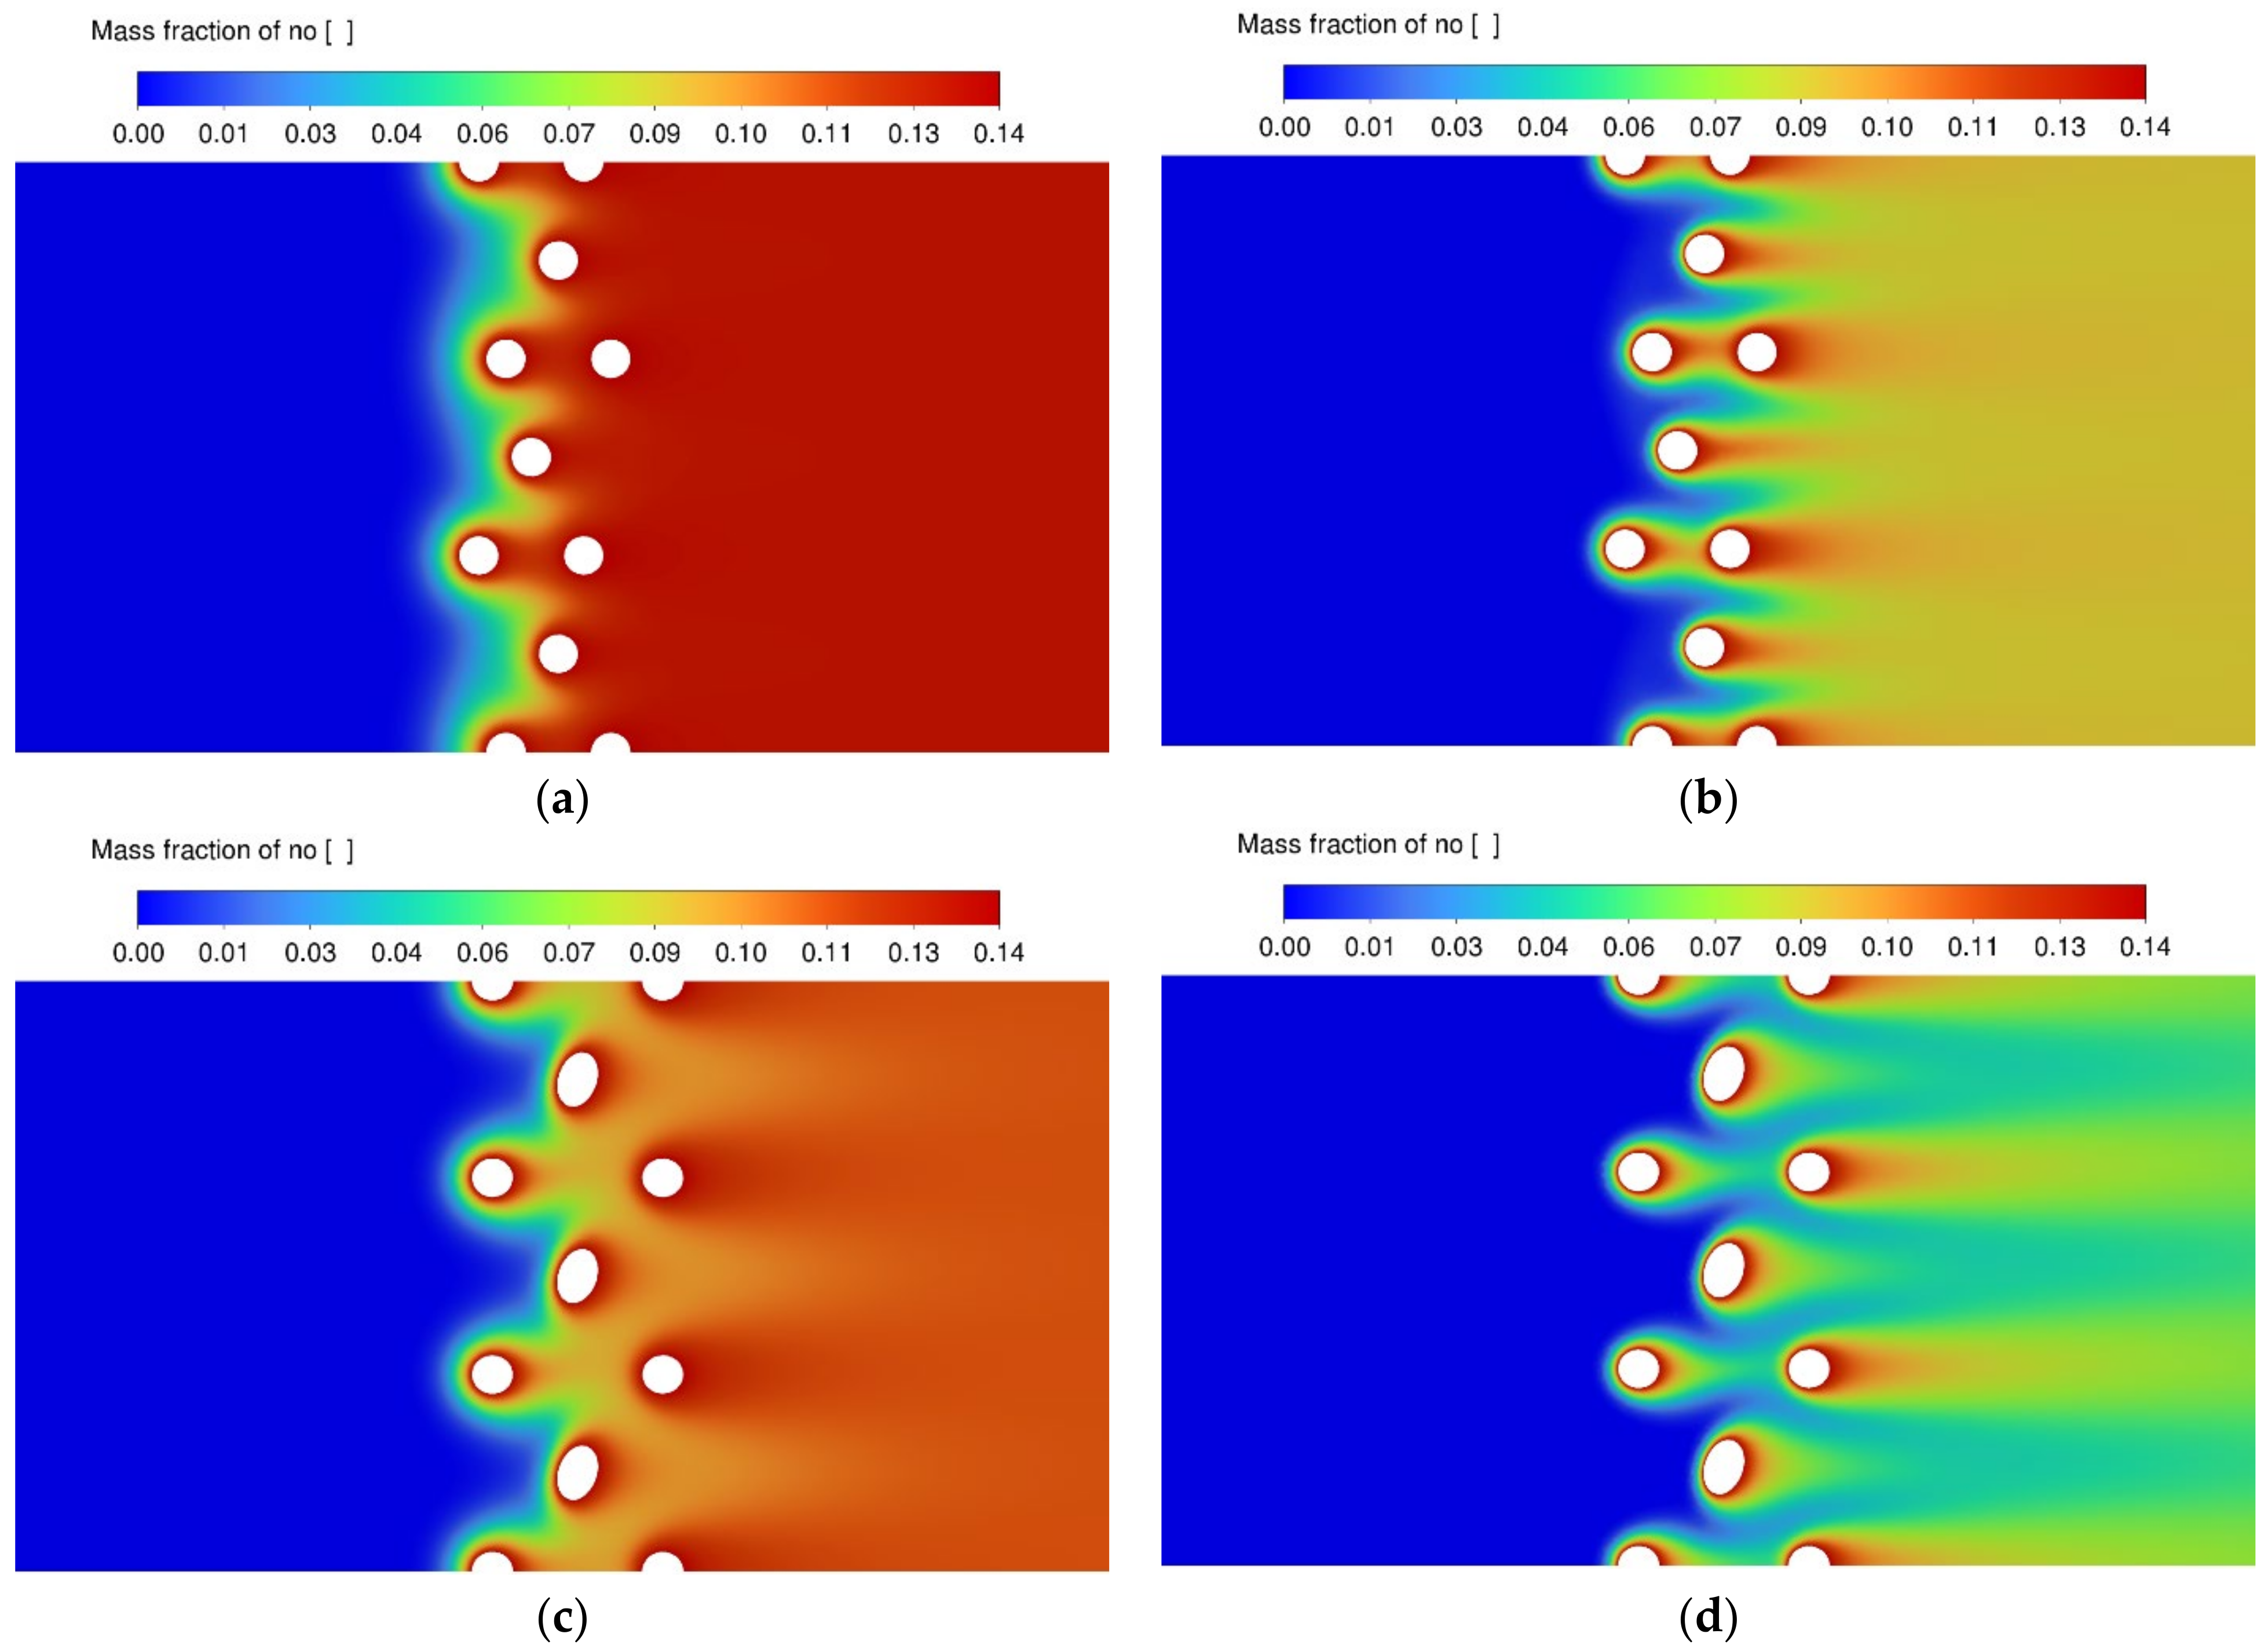
3.3. NO Conversion Efficiency and Concentration Contours

The mass efficiency of NO conversion is shown in Equation (14):
η r = X NO _ out X NH 3 _ in · M NH 3 M NO · 100 %
where XNO_out is the mass fraction of NO at the outlet, XNH3_in is the mass fraction of NH3 at the inlet, and MNH3 and MNO are molar masses of NH3 and NO, respectively. Figure 7a presents the conversion efficiency as a function of contact time. Due to the construction of the second layer in Geometry B, it contained approximately 10% less mass of the catalyst than Geometry A. Figure 7b presents the conversion efficiency per 1 g of catalyst.
It can be noticed that conversion efficiency was higher for longer contact times. However, these calculations did not take secondary reactions into account, and in the industry shorter contact times are used to hinder their effects [24]. However, our obtained results showed a general trend. Considering the reduced demand for the amount of catalyst in the case of Geometry B, it was justified to use it for shorter contact times to increase the efficiency of catching platinum. Nevertheless, this led to a decrease of approximately 5–20% in the reaction efficiency. However, if we consider the contact time as well as the inlet velocity, we find that the conversion efficiency per 1 g of catalyst is only slightly lower (approximately 4%) for Geometry B.
Figure 7 shows that the maximum process yield for new, undegraded platinum wire and the losses of platinum during reactor operation lead to a reduction in process efficiency and the need to replace the catalyst. Reducing catalyst losses, e.g., by using a different wire arrangement, can lead to a longer time of stable reactor operation, which will translate into increased efficiency and increased savings.
An industrial reactor uses multiple layers of platinum wires (more than three), resulting in a significant increase in process efficiency, and using a B-geometry mesh as one of the layers would affect efficiency loss even less, reducing platinum losses significantly.
Finally, if platinum losses are reduced and/or the degradation of the catalytic grid is slowed down, leading to an increase in reactor operating time, a slight reduction in efficiency could be acceptable.
Of course, losing platinum is costly, but consideration should also be given to whether the gains from reducing platinum loss compensate for the lower reaction efficiency and which will be partially based on the current prices of the Pt and Rh that will need to be replaced after each production campaign.
Figure 8 and Figure 9 present mass fraction contours of NH3 and NO, respectively, for the investigated geometries.
In the case of the mass fraction contours, there was a similar distribution as in the case of temperature profiles. The maximum values of NO and the minimum values of NH3 were located in the close vicinity of the wires, which confirmed that the obtained product concentration was closely related to the temperature distribution. Moreover, similar to temperature, the influence of the stagnation zones behind the last layer of gauze was observed.
A detailed analysis of the results showed the effect of the stagnation areas mentioned earlier. Those are seen in the figures, particularly for lower contact time values (Figure 8b,d and Figure 9b,d)) for the last layer in the catalyst gauze. The use of a larger number of layers provided the desired effect of suppressing stagnation layers for the preceding wires, i.e., in the discussed case for wires in the first and second layers. In this way, we could not only affect the efficiency of the reaction but also reduce the loss of platinum when we applied a non-catalytic last layer, which then played a role only in capturing the entrained platinum particles. Such solutions are used in the latest generations of nitric acid gauze packs.

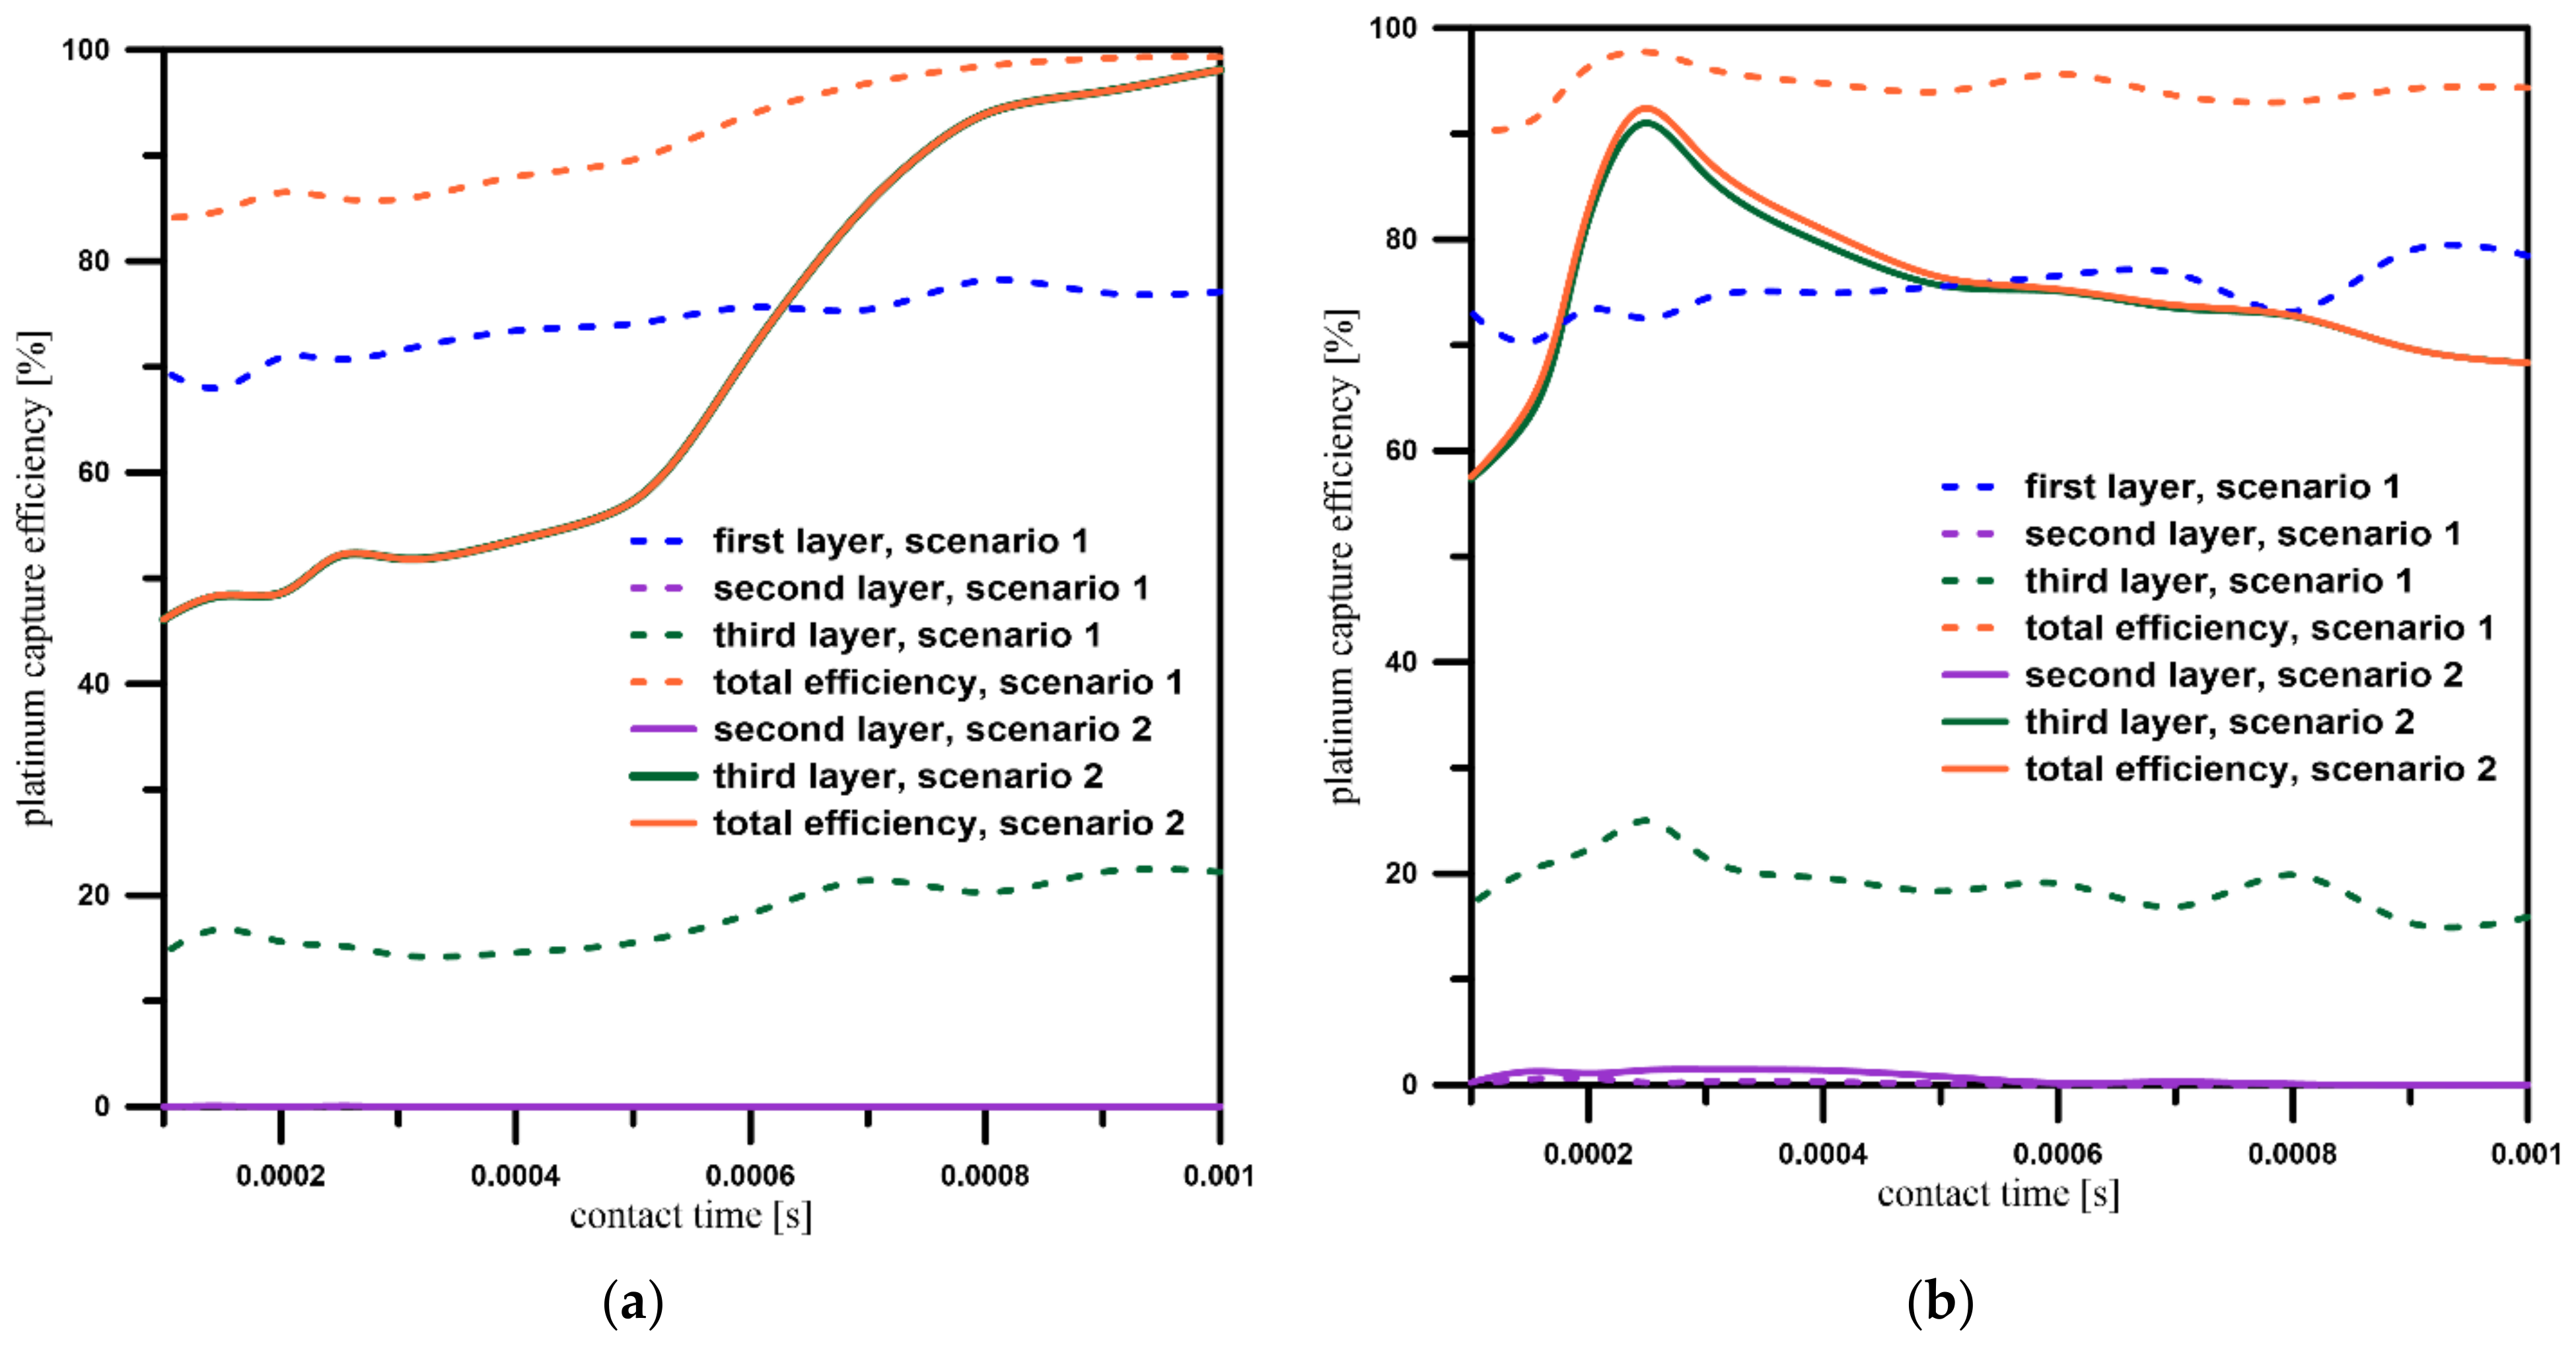
3.4. Platinum Particles’ Capture Efficiency

In our calculations, we assumed that platinum particles were released from the area of the first layer of catalyst gauze with the highest surface temperature (Figure 10). For this purpose, it was decided to divide the surface of the wire into “hot” and “cold” zones. The demarcation between “hot” and “cold” zones was set at half of the temperature gradient across the surface of the first gauze layer. The separated “hot” zones were then used as injection areas for platinum particles. The DPM model was used to model the trajectory of platinum particles.
In this work, two possible particle tracking scenarios were considered. The first solution (Scenario 1) allowed platinum particles to depose on all catalyst surfaces, including the first layer, to assume the initial decomposition of the gauze in which a substantial change in the shape of the wires could be observed on SEM images [17,18]. Hence the “trap” boundary condition was used for all layers of catalyst gauze. The second approach (Scenario 2) concerned the case of the later stage of loading the wire platinum particles when the shape of the first layer of the catalytic grid changed, causing the dead zone behind the wire to decrease and therefore leading to a situation in which particles torn off from the first layer settled only on the second and third layers. Therefore the “reflect” boundary condition was applied on the surface of the first layer of catalyst gauze and the “trap” for the second and third layers. The platinum capture efficiency is shown in Equation (15):
η Pt _ trap = N Pt N Pt _ loss N Pt · 100 %
where NPt is the number of tracked platinum particles and NPt_loss is the number of platinum particles that left the domain without contact with the subsequent layers of the gauze. Figure 11 presents the changes in the total and individual layer platinum capture efficiencies as a function of contact time.
The results showed that the rearrangement of the middle layer significantly affected the amount of platinum trapped particles. This effect was substantial for the mesh with a wire diameter of 0.06 mm, which is widely used in the industry [20,22]. One can observe that, in the case of Geometry A, the platinum catching efficiency increased with the increase in contact time (gas velocity decrease). In contrast, in the case of Geometry B, an inverse relationship can be observed, with a maximum around a contact time of 0.00025 s; for shorter contact times, the amount of platinum trapped fell sharply. These differences were less visible in Scenario 1, but this dependence was still noticeable.
Running the process for short contact times is attractive because of gas mass flow and reduction of precious metal loss. In this area, the platinum loss for Geometry A is almost double that for Geometry B. Obviously, the yield for the new gauzes at the beginning of the process run for Geometry A is higher (Figure 7b); however, it is known to decrease with strong gauze degradation and platinum losses during the production campaign. The use of Geometry B as one of the layers can slow down the process of yield degradation, which will translate into a longer period of operation on a single platinum gauze and consequently a higher yield during the campaign.
In summary, for the ammonia oxidation process using a catalyst with a wire diameter of 0.06 mm, Geometry A is the preferred variant for longer contact times. For shorter contact times, Geometry B is the better choice. Table 5 compares the platinum capture efficiency for the extreme cases in Scenario 2.
Figure 12 shows trajectories of platinum particles for the extreme cases in Geometries A and B.
One can observe that the geometry of the middle layer in the catalytic gauze directly changed the flow direction. For Geometry A, it played a minor role, and for Geometry B, it reduced the platinum loss for higher contact times. The results show that by manipulating the shape of the penultimate layer in the gauze, it is possible to influence the movement of the platinum particles to reduce the amount of lost platinum.

4. Conclusions

In this study, the ammonia oxidation process on a solid platinum–rhodium catalyst was modelled using Computational Fluid Dynamics. We investigated the influence of geometry on the process of catalyst degradation regarding the contact time, platinum particle trajectories, velocity, temperature, concentration, and reaction efficiency.
We examined typical variants of the catalytic grid used in the industry and then ap-plied an original grid modification by rotating the central layer by 45 degrees and shifting the gauze by half the length of the mesh. The obtained results show that changing the geometry of the middle layer of gauze strongly depends on the orientation of the wire. The most favourable changes in the efficiency of catching platinum were obtained for shorter contact times (0.00025 s).
The simulation results show that the geometry of the preceding layer has a crucial influence on the deposition of the entrained platinum on a given layer, which is especially important for the penultimate layer, which directly influences the flow direction. The effect varies for different process conditions, such as contact time. The results show that proper geometry selection can significantly reduce the amount of platinum loss. However, changing the geometry also affects the efficiency of the process.
Therefore, the changes made in the arrangement of wires in successive layers should be correlated simultaneously with the contact time and the velocity of gas flow in the reactor. Only then can the most favourable reactor operating conditions be determined in terms of the conversion efficiency achieved, platinum losses and, consequently, the extension of the reactor’s operating period on a single catalyst gauze. The paper shows that CFD can be a suitable tool for this purpose.
Before choosing a particular variant of the gauze pack geometry, the potential losses resulting from the reaction efficiency and the gains in Pt recovery should be assessed based on the prices of Pt, Rh, and the produced nitric acid.

Author Contributions

Conceptualization, Ł.M., M.T., J.M.B., and W.O.; methodology, Ł.M. and M.T.; validation, Ł.M. and M.T.; investigation, M.T., I.P., and Ł.M.; resources, Ł.M.; writing—original draft preparation, Ł.M. and M.T.; writing—review and editing, Ł.M., M.T., J.M.B., and W.O.; visualisation, M.T.; supervision, Ł.M. and W.O.; project administration, Ł.M.; funding acquisition, Ł.M. All authors have read and agreed to the published version of the manuscript.

Funding

This research received no external funding.

Data Availability Statement

Not applicable.

Conflicts of Interest

The authors declare no conflict of interest.

Nomenclature

The following symbols are used in this manuscript:
Latin symbols:
Arpre-exponential factor, s−1
C, C, Cconstants
ciconcentration of species i, mol m−3
Di,wallmass diffusion coefficient, m2 s−1
Eractivation energy, J mol−1
Gbgeneration of turbulence kinetic energy due to buoyancy, kg m−1 s−2
Gkgeneration of turbulence kinetic energy due to the mean velocity gradients, kg m−1 s−2
[Gi]wallmolar concentration of surface-adsorbed species
Hcatalyst gauze height, m
Iunit tensor
J i diffusion flux of species i, kg m−2 s−1
kreaction rate constant, s−1
kturbulent kinetic energy, m2 s−2
MNH3molar mass of NH3, kg mol−1
MNOmolar mass of NO3, kg mol−1
Mw,imolecular weight, kg mol−1
m ˙ dep net rate of mass deposition as a result of the surface reaction
Ngnumber of gas species
Nsnumber of site species
NPtnumber of tracked platinum particles
NPt_lossnumber of lost platinum particles
ppressure, Pa
Runiversal gas constant, J mol−1 K−1
Rinet rate of production of species i by chemical reaction
R ^ i , gas rate of reaction in the gas phase
R ^ i , site rate of reaction on the catalyst surface
R ^ i , bulk rate of reaction in the bulk phase
rreaction rate, mol m−3 s−1
Sirate of creation of species i by addition from the dispersed phase plus any user-defined sources
[Si]wallmolar concentration of site species
Ttemperature, K
tcontact time, s
ttime, s
uicontinuous phase velocity, m s−1
u ¯ average fluctuation of continuous phase velocity, m s−1
vaverage velocity between wires, m s−1
v overall velocity vector, m s−1
xi, xjcomputational domain dimensions, m
XNH3_inmass fraction of NH3 at the inlet
XNO_outmass fraction of NO at the outlet
Yilocal mass fraction of species i
Yi,wallmass fraction at the wall of the catalyst wires
YMcontribution of the fluctuating dilatation in compressible turbulence to the overall dissipation rate, kg m−1 s−2
Zisite coverage of species i
Greek symbols:
αempirical constant
βrtemperature exponent
εturbulent dissipation rate, m2 s−3
ηrNO conversion efficiency
ηPt_trapplatinum capture efficiency
μcontinuous phase dynamic viscosity, Pa·s
μtcontinuous phase turbulent viscosity, Pa·s
νcontinuous phase kinematic viscosity, m2 s−1
ρcontinuous phase density, kg m−3
ρsitesite density, kg m−3
ρwallwall phase density, kg m−3
σkturbulent Prandtl number for k
σεturbulent Prandtl number for ε
Acronyms:
CFDComputational Fluid Dynamics
DPMDiscrete Phase Model
SIMPLESemi-Implicit Method for Pressure Linked Equations

References

  1. Hoque, A.; Mohiuddin, M.; Su, Z. Effects of Industrial Operations on Socio-Environmental and Public Health Degradation: Evidence from a Least Developing Country (LDC). Sustainability 2018, 10, 3948. [Google Scholar] [CrossRef] [Green Version]
  2. Klumpp, A.; Domingos, M.; Klumpp, G. Assessment of the vegetation risk by fluoride emissions from fertiliser industries at CubaGo, Brazil. Sci. Total Environ. 1996, 10, 219–228. [Google Scholar] [CrossRef]
  3. Roser, M.; Ritchie, H. Hunger and Undernourishment. Available online: https://ourworldindata.org/hunger-and-undernourishment (accessed on 14 September 2022).
  4. Warner, M. The Kinetics of Industrial Ammonia Combustion. Ph.D. Thesis, The University of Sydney, Sydney, Australia, 2013. [Google Scholar]
  5. Aparicio, L.M.; Dumesic, J.A. Ammonia synthesis kinetics: Surface chemistry, rate expressions, and kinetic analysis. Top. Catal. 1994, 1, 233–252. [Google Scholar] [CrossRef]
  6. Kraehnert, R.; Baerns, M. Kinetics of ammonia oxidation over Pt foil studied in a micro-structured quartz-reactor. Chem. Eng. J. 2008, 137, 361–375. [Google Scholar] [CrossRef] [Green Version]
  7. Rafti, M.; Vicente, J.L.; Albesa, A.; Scheibe, A.; Imbihl, R. Modeling ammonia oxidation over a Pt (533) surface. Surf. Sci. 2012, 606, 12–20. [Google Scholar] [CrossRef]
  8. Otomo, J.; Koshi, M.; Mitsumori, T.; Iwasaki, H.; Yamada, K. Chemical kinetic modeling of ammonia oxidation with improved reaction mechanism for ammonia/air and ammonia/hydrogen/air combustion. Int. J. Hydrog. Energy 2018, 43, 3004–3014. [Google Scholar] [CrossRef]
  9. Scheuer, A.; Votsmeier, M.; Schuler, A.; Gieshoff, J.; Drochner, A.; Vogel, H. NH3-Slip Catalysts: Experiments Versus Mechanistic Modelling. Top. Catal. 2009, 52, 1847–1851. [Google Scholar] [CrossRef]
  10. Hickman, D.A.; Schmidt, L.D. Modeling catalytic gauze reactors: Ammonia oxidation. Ind. Eng. Chem. Res. 1991, 30, 50–55. [Google Scholar] [CrossRef]
  11. Novell-Leruth, G.; Ricart, J.M.; Pérez-Ramírez, J. Pt (100)-Catalyzed Ammonia Oxidation Studied by DFT: Mechanism and Microkinetics. J. Phys. Chem. C 2008, 112, 13554–13562. [Google Scholar] [CrossRef]
  12. Haas, M.; Nien, T.-W.; Fadic, A.; Mmbaga, J.P.; Klingenberger, M.; Born, D.; Etzold, B.J.M.; Hayes, R.; Votsmeier, M. N2O selectivity in industrial NH3 oxidation on Pt-gauze is determined by interaction of local flow and surface chemistry: A simulation study using mechanistic kinetics. Chem. Eng. Sci. 2022, 260, 117832. [Google Scholar] [CrossRef]
  13. Haas, M.; Wiser, A.; Drochner, A.; Hasse, C.; Etzold, B.J.M.; Votsmeier, M. Multiscale CFD Model for the Catalyzed Ammonia Oxidation: From a Detailed Surface Kinetic Model to an Industrial Reactor. In Proceedings of the 25th International Conference on Chemical Reaction Engineering, ISCRE25, Florence, Italy, 20–23 May 2018. [Google Scholar]
  14. Pottbacker, J.; Jakobtorweihen, S.; Behnecke, A.S.; Abdullah, A.; Özdemir, M.; Warner, M.; Menon, M.; Bujalski, J.M.; Waller, D.; Korup, O.; et al. Resolving gradients in an ammonia oxidation reactor under industrial conditions: A combined experimental and simulation study. Chem. Eng. J. 2022, 439, 135350. [Google Scholar] [CrossRef]
  15. Wiser, A. Investigation of the Industrial NH3 Oxidation by CFD Simulations including Detailed Surface Kinetics. Ph.D. Thesis, Technische Universität, Darmstadt, Germany, 2020. [Google Scholar]
  16. McCabe, A.R.; Smith, G.D.W. The Mechanism of Reconstruction of Rhodium-Platinum Catalyst Gauzes. Platin. Met. Rev. 1986, 30, 54–62. [Google Scholar]
  17. Pura, J.; Wieciński, P.; Kwaśniak, P.; Zwolińska, M.; Garbacz, H.; Zdunek, J.; Laskowski, Z.; Gierej, M. Investigation of the degradation mechanism of catalytic wires during oxidation of ammonia process. Appl. Surf. Sci. 2016, 388, 670–677. [Google Scholar] [CrossRef]
  18. Pura, J.; Kwaśniak, P.; Wiecinski, P.; Garbacz, H.; Zdunek, J.; Laskowski, Z.; Gierej, M. Investigation of the Degradation Mechanism of Platinum-Rhodium Catalytic Wires during Oxidation of Ammonia Process. Solid State Phenom. 2015, 227, 229–232. [Google Scholar] [CrossRef]
  19. Bobrownicki, W.; Pawlikowski, S. Otrzymywanie rozcieńczonego kwasu azotowego. In Technologia Związków Azotowych; Wydawnictwa Naukowo-Techniczne WNT: Warszawa, Poland, 1974; pp. 197–214. [Google Scholar]
  20. Thiemann, M.; Scheibler, E.; Wiegand, K.W. Nitric Acid, Nitrous Acid, and Nitrogen Oxides. In Ullmann’s Encyclopedia of Industrial Chemistry; Wiley-VCH Verlag GmbH & Co. KGaA: Weinheim, Germany, 2000; Volume 24, pp. 177–225. ISBN 978-3-527-30673-2. [Google Scholar]
  21. Handforth, S.L.; Tilley, J.N. Catalysts for Oxidation of Ammonia to Oxides of Nitrogen. Ind. Eng. Chem. 1934, 26, 1287–1292. [Google Scholar] [CrossRef]
  22. Hatscher, S.T.; Fetzer, T.; Wagner, E.; Kneuper, H.-J. Ammonia Oxidation. In Handbook of Heterogeneous Catalysis, 8 Volume Set, 2nd ed.; Wiley: New York, NY, USA, 2008; Volume 5, pp. 2575–2592. ISBN 978-3-527-31241-2. [Google Scholar]
  23. Ansys® Fluent, Release 2021 R2, Help System, Fluent Theory Guide; ANSYS, Inc.: Canonsburg, PA, USA, 2021.
  24. Bortel, E.; Konieczny, H. Otrzymywanie kwasu azotowego. In Zarys Technologii Chemicznej; Wydawnictwo Naukowe PWN: Warszawa, Poland, 1992; pp. 534–550. ISBN 978-83-01-09944-2. [Google Scholar]
  25. Bentsen, P.C. Kinetics of Low Temperature Oxidation of Ammonia Trace Quantities. Ph.D. Thesis, Texas Tech University, Lubbock, TX, USA, 1973. [Google Scholar]
  26. Makowski, Ł.; Łaskowski, J.; Tyrański, M. Influence of Modification of the Geometry of the Wave-Plate Mist Eliminators on the Droplet Removal Efficiency—CFD Modelling. Processes 2021, 9, 1499. [Google Scholar] [CrossRef]
Figure 1. Comparison of dimensions of basic (a) and novel (b) geometries.
Energies 15 08123 g001
Figure 2. The visualisation of catalyst gauze: (a,b): typical catalyst gauze (Geometry A); (c,d): novel variant of catalyst gauze (Geometry B).
Energies 15 08123 g002
Figure 3. Computational domain of Geometry A.
Energies 15 08123 g003
Figure 4. Velocity contours for: (a) Geometry A, contact time of 0.001 s; (b) Geometry A, contact time of 0.00025 s; (c) Geometry B, contact time of 0.001 s; (d) Geometry B, contact time of 0.00025 s.
Energies 15 08123 g004
Figure 5. Temperature contours for: (a) Geometry A, contact time of 0.001 s; (b) Geometry A, contact time of 0.00025 s; (c) Geometry B, contact time of 0.001 s; (d) Geometry B, contact time of 0.00025 s.
Energies 15 08123 g005
Figure 6. Velocity pathlines for: (a) Geometry A, contact time of 0.001 s; (b) Geometry A, contact time of 0.00025 s; (c) Geometry B, contact time of 0.001 s; (d) Geometry B, contact time of 0.00025 s.
Energies 15 08123 g006
Figure 7. Conversion efficiency (a) and conversion efficiency per catalyst mass (b) as a function of contact time for Geometries A and B.
Energies 15 08123 g007
Figure 8. NH3 mass fraction contours for: (a) Geometry A, contact time of 0.001 s; (b) Geometry A, contact time of 0.00025 s; (c) Geometry B, contact time of 0.001 s; (d) Geometry B, contact time of 0.00025 s.
Energies 15 08123 g008
Figure 9. NO mass fraction contours for: (a) Geometry A, contact time of 0.001 s; (b) Geometry A, contact time of 0.00025 s; (c) Geometry B, contact time of 0.001 s; (d) Geometry B, contact time of 0.00025 s.
Energies 15 08123 g009
Figure 10. Surface temperature gradient on the first layer of gauze (Geometry A). Platinum particles were released from areas of higher temperature (“hot” zones shown in red).
Energies 15 08123 g010
Figure 11. Efficiencies of platinum capture as a function of contact time for Geometry A (a) and Geometry B (b).
Energies 15 08123 g011
Figure 12. Trajectories of platinum particles for: (a) Geometry A, contact time of 0.001 s; (b) Geometry A, contact time of 0.00025 s; (c) Geometry B, contact time of 0.001 s; (d) Geometry B, contact time of 0.00025 s.
Energies 15 08123 g012
Table 1. The composition of the continuous phase (gas mixture) at the inlet.
Species NameConcentration (Mass Fractions)
NH30.1
O20.19
N20.71
Table 2. Differences between investigated geometries.
NameWire
Diameter
[mm]
1st and 3rd
Layer Mesh
Size [mm]
2nd Layer
Mesh Size
[mm]
2nd Layer Angle
Relative to the 1st
and 3rd Layers
2nd Layer Shift
Relative to the 1st
and 3rd Layers [mm]
A0.060.3 × 0.30.3 × 0.390°0.15; two axes
B0.060.3 × 0.30.42 × 0.4245°0.15; two axes
Table 3. Operating conditions of ammonia oxidation.
NameValueSource
contact time of gas phase with a catalyst (s)0.001—0.0002[22,24]
gas inlet velocity (m/s)0.22—3.17calculated, Equation (13)
gas inlet temperature (K)453[12]
operating pressure (bar)5[22]
Table 4. Reaction kinetic parameters.
SymbolNameUnitValueSource
Eactivation energyJ mol−16.28·104[19]
Apre-exponential factors−15·1011[4]
αempirical constant-0.69[25]
Table 5. Platinum capture efficiencies for the extreme cases in Scenario 2.
GeometryContact Time [s]Platinum Capture Efficiency [%]
A0.00198.10%
A0.0002552.20%
B0.00168.34%
B0.0002592,42%
Publisher’s Note: MDPI stays neutral with regard to jurisdictional claims in published maps and institutional affiliations.

