Article

Indoor Air Quality Diagnosis Program for School Multi-Purpose Activity and Office Spaces

1
Department of Architectural Engineering, Graduate School, Seoul National University of Science and Technology, Seoul 01811, Korea
2
School of Architecture, Seoul National University of Science and Technology, Seoul 01811, Korea
3
Architectural Engineering Program, School of Architecture, Seoul National University of Science and Technology, Seoul 01811, Korea
*
Author to whom correspondence should be addressed.
Energies 2022, 15(21), 8134; https://doi.org/10.3390/en15218134
Submission received: 15 August 2022 / Revised: 24 October 2022 / Accepted: 28 October 2022 / Published: 31 October 2022
(This article belongs to the Special Issue Green Buildings for Carbon Neutral)

Abstract

:
This study presents a simple indoor air quality diagnosis program for school office spaces, which are occupied for long durations by teachers, and indoor sports facilities, whose utilization has been on the rise in response to high concentrations of pollutants in outdoor air. The proposed program was made with Visual Basic for Applications (VBA) and Microsoft Excel. This program requires inputs which can be easily determined or measured even by nonexperts and can check the current status of indoor air quality such as CO2 and PM2.5 concentrations and predict the effect if changes are made. In addition, it is possible to diagnose indoor air quality before and after class and compare it with the initial plan so that if it exceeds the indoor air quality maintenance standard range, it can be improved by using a ventilation system and an air purifier. The development of the program was divided into four stages. First, prior research on the influencing factors was investigated. Second, influencing factors affecting the changes in PM2.5 and CO2 concentrations were selected by category to accommodate the various factors, and those selected as input were presented. Third, mass and concentration conservation equations were utilized to derive PM2.5 and CO2 concentration prediction equations according to activity and passage of time, and a VBA code was used for constructing the program. For verification of the developed program, the calculation results were compared with the measured data. The mean absolute percentage error (MAPE) was 19.47% for PM2.5 concentration. In order to improve accuracy, Simulation 2, in which the wind speed and indoor/outdoor air pressure difference are corrected, is presented. The MAPE of PM2.5 concentration by the corrected Simulation 2 was lowered 5.15%.

1. Introduction

The annual average concentration of fine particulate matter (PM2.5) in South Korea was 18 µg/m3 in 2021, which was the lowest since 2015 due to seasonal management, main sources management (including industry, power generation, and transportation), the government’s heightened concern about this issue, and the impact of COVID-19 (Figure 1a) [1,2,3]. However, this amount still exceeds the recommended emission level provided by the World Health Organization (WHO) global air quality guidelines on PM2.5 (Figure 1b) [3,4,5].
Despite active governmental management and regulations, the annual concentration of PM2.5, which is a representative air pollutant as well as a Group 1 carcinogen causing and worsening respiratory and cardiovascular diseases, has been consistently high (Figure 2a) [6,7,8].
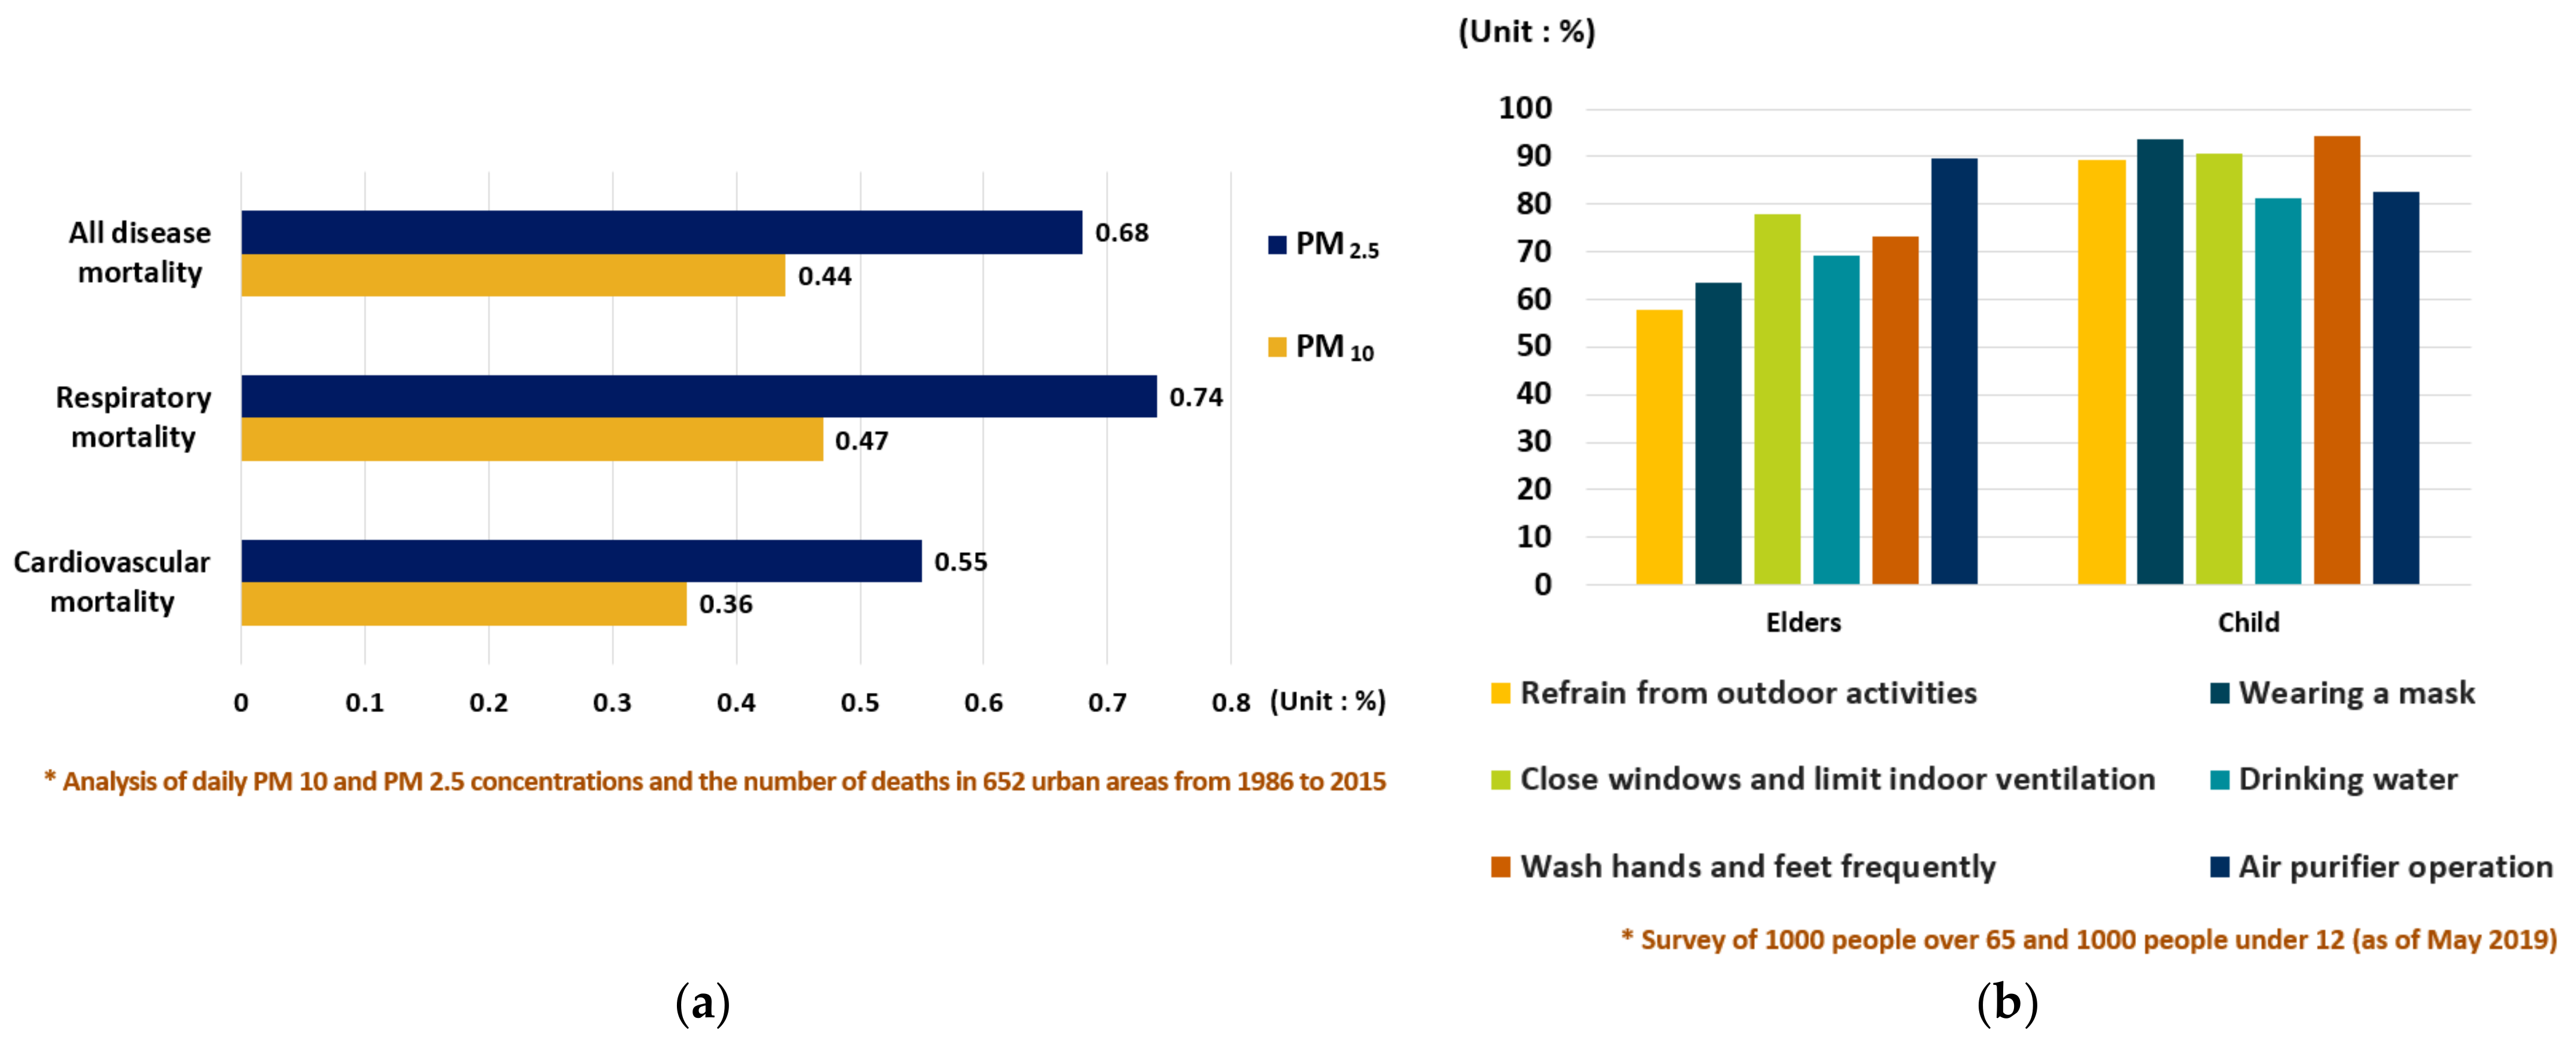
This rise has increased the death rate due to respiratory and cardiovascular diseases both worldwide and in South Korea, negatively affecting the daily lives of children, who are particularly vulnerable to air pollutants (Figure 2b) [9,10,11,12].
Because the daily lives of children and the elderly are affected by the rise in the concentration of PM, the South Korean government has classified children, students, and the elderly as vulnerable to PM [13]. In particular, the respiratory volume of children is high due to their body structure and behavioral and developmental characteristics, causing them to inhale a relatively high amount of air pollutants [14,15].
Figure 2. (a) Increases in death rate by disease according to the rising PM10 and PM2.5 concentrations [10]. (b) Application rate for each method of coping with PM in the elderly and children [12].
Energies 15 08134 g002
To protect children, South Korean authorities are updating guidelines and standards for dealing with fine dust in schools each year in preparation for the increase in fine dust concentration [13,16,17]. According to the Air Pollution Response Manual, schools, including kindergartens, should prepare and implement an alternative plan for outdoor classes considering the situation of high outdoor concentrations of PM, consider shortened classes upon air quality alerts based on high PM levels, and hold outdoor physical education classes in indoor sports facilities [6,13,16,17].
The School Health Act was updated with special cases concerning the Maintenance and Management of Air Quality in Articles 4-2 and 4-3 in April 2019 in response to the increased utilization of indoor school facilities [18]. These newly established standards are dedicated to classrooms, providing no detailed rules regarding other spaces, such as the offices of teachers, principals, and administrators, which are occupied for long periods, as well as indoor sport facilities, where respiratory volume increases due to multiple people engaging in physical activity [19,20].
Furthermore, the indoor air quality should be monitored by analyzing the characteristics of spaces, as the concentration of each pollutant, despite being similar when outdoors, varies depending on the configuration of the space and facility conditions [21,22,23].
Analyses of indoor air quality in South Korea are conducted based mainly on an air quality measurement methods that utilize measuring devices and a method that predicts the indoor air quality of spaces using the Computational Fluid Dynamic (CFD) program. Because this measurement and program require user proficiency, they are difficult for nonexperts, such as teachers or school managers, to utilize [24,25,26,27].
Currently, a lot of research is being conducted on indoor air quality monitoring programs and indoor air quality prediction diagnostic programs. In the case of the program and monitoring system of previous studies, it is a program that analyzes one pollutant, and it is difficult for non-experts to directly operate it [28,29,30]. Therefore, there is a need for a program that allows nonexperts to diagnose indoor air quality by identifying the characteristics of the space when planning the space before class. In addition, if the maintenance standard range of indoor air pollutants is exceeded during diagnosis, a tool that can diagnose compared to the initial plan is needed so that improvements can be made using ventilation facilities, etc.
Thus, this study developed an indoor air quality diagnosis program for office and multipurpose activity spaces at schools that enables nonexperts to accessibly determine the change in pollutants in these spaces. The program proposed in this study was made with Visual Basic for Applications (VBA) and the Microsoft Excel program, which nonexperts such as teachers and school managers can easily access and use to predict indoor air quality. This study presented a tool that can be compared with the initial plan so that nonexperts can diagnose the indoor air quality before and after class and improve it by using ventilation equipment, such as an air purifier, when it exceeds the indoor air quality maintenance standard range.
In addition, the necessary information is presented as optional factors (maximum, minimum, median, etc.) in consideration of input factors that are difficult for nonexperts to grasp when predicting indoor air quality.

2. Methods

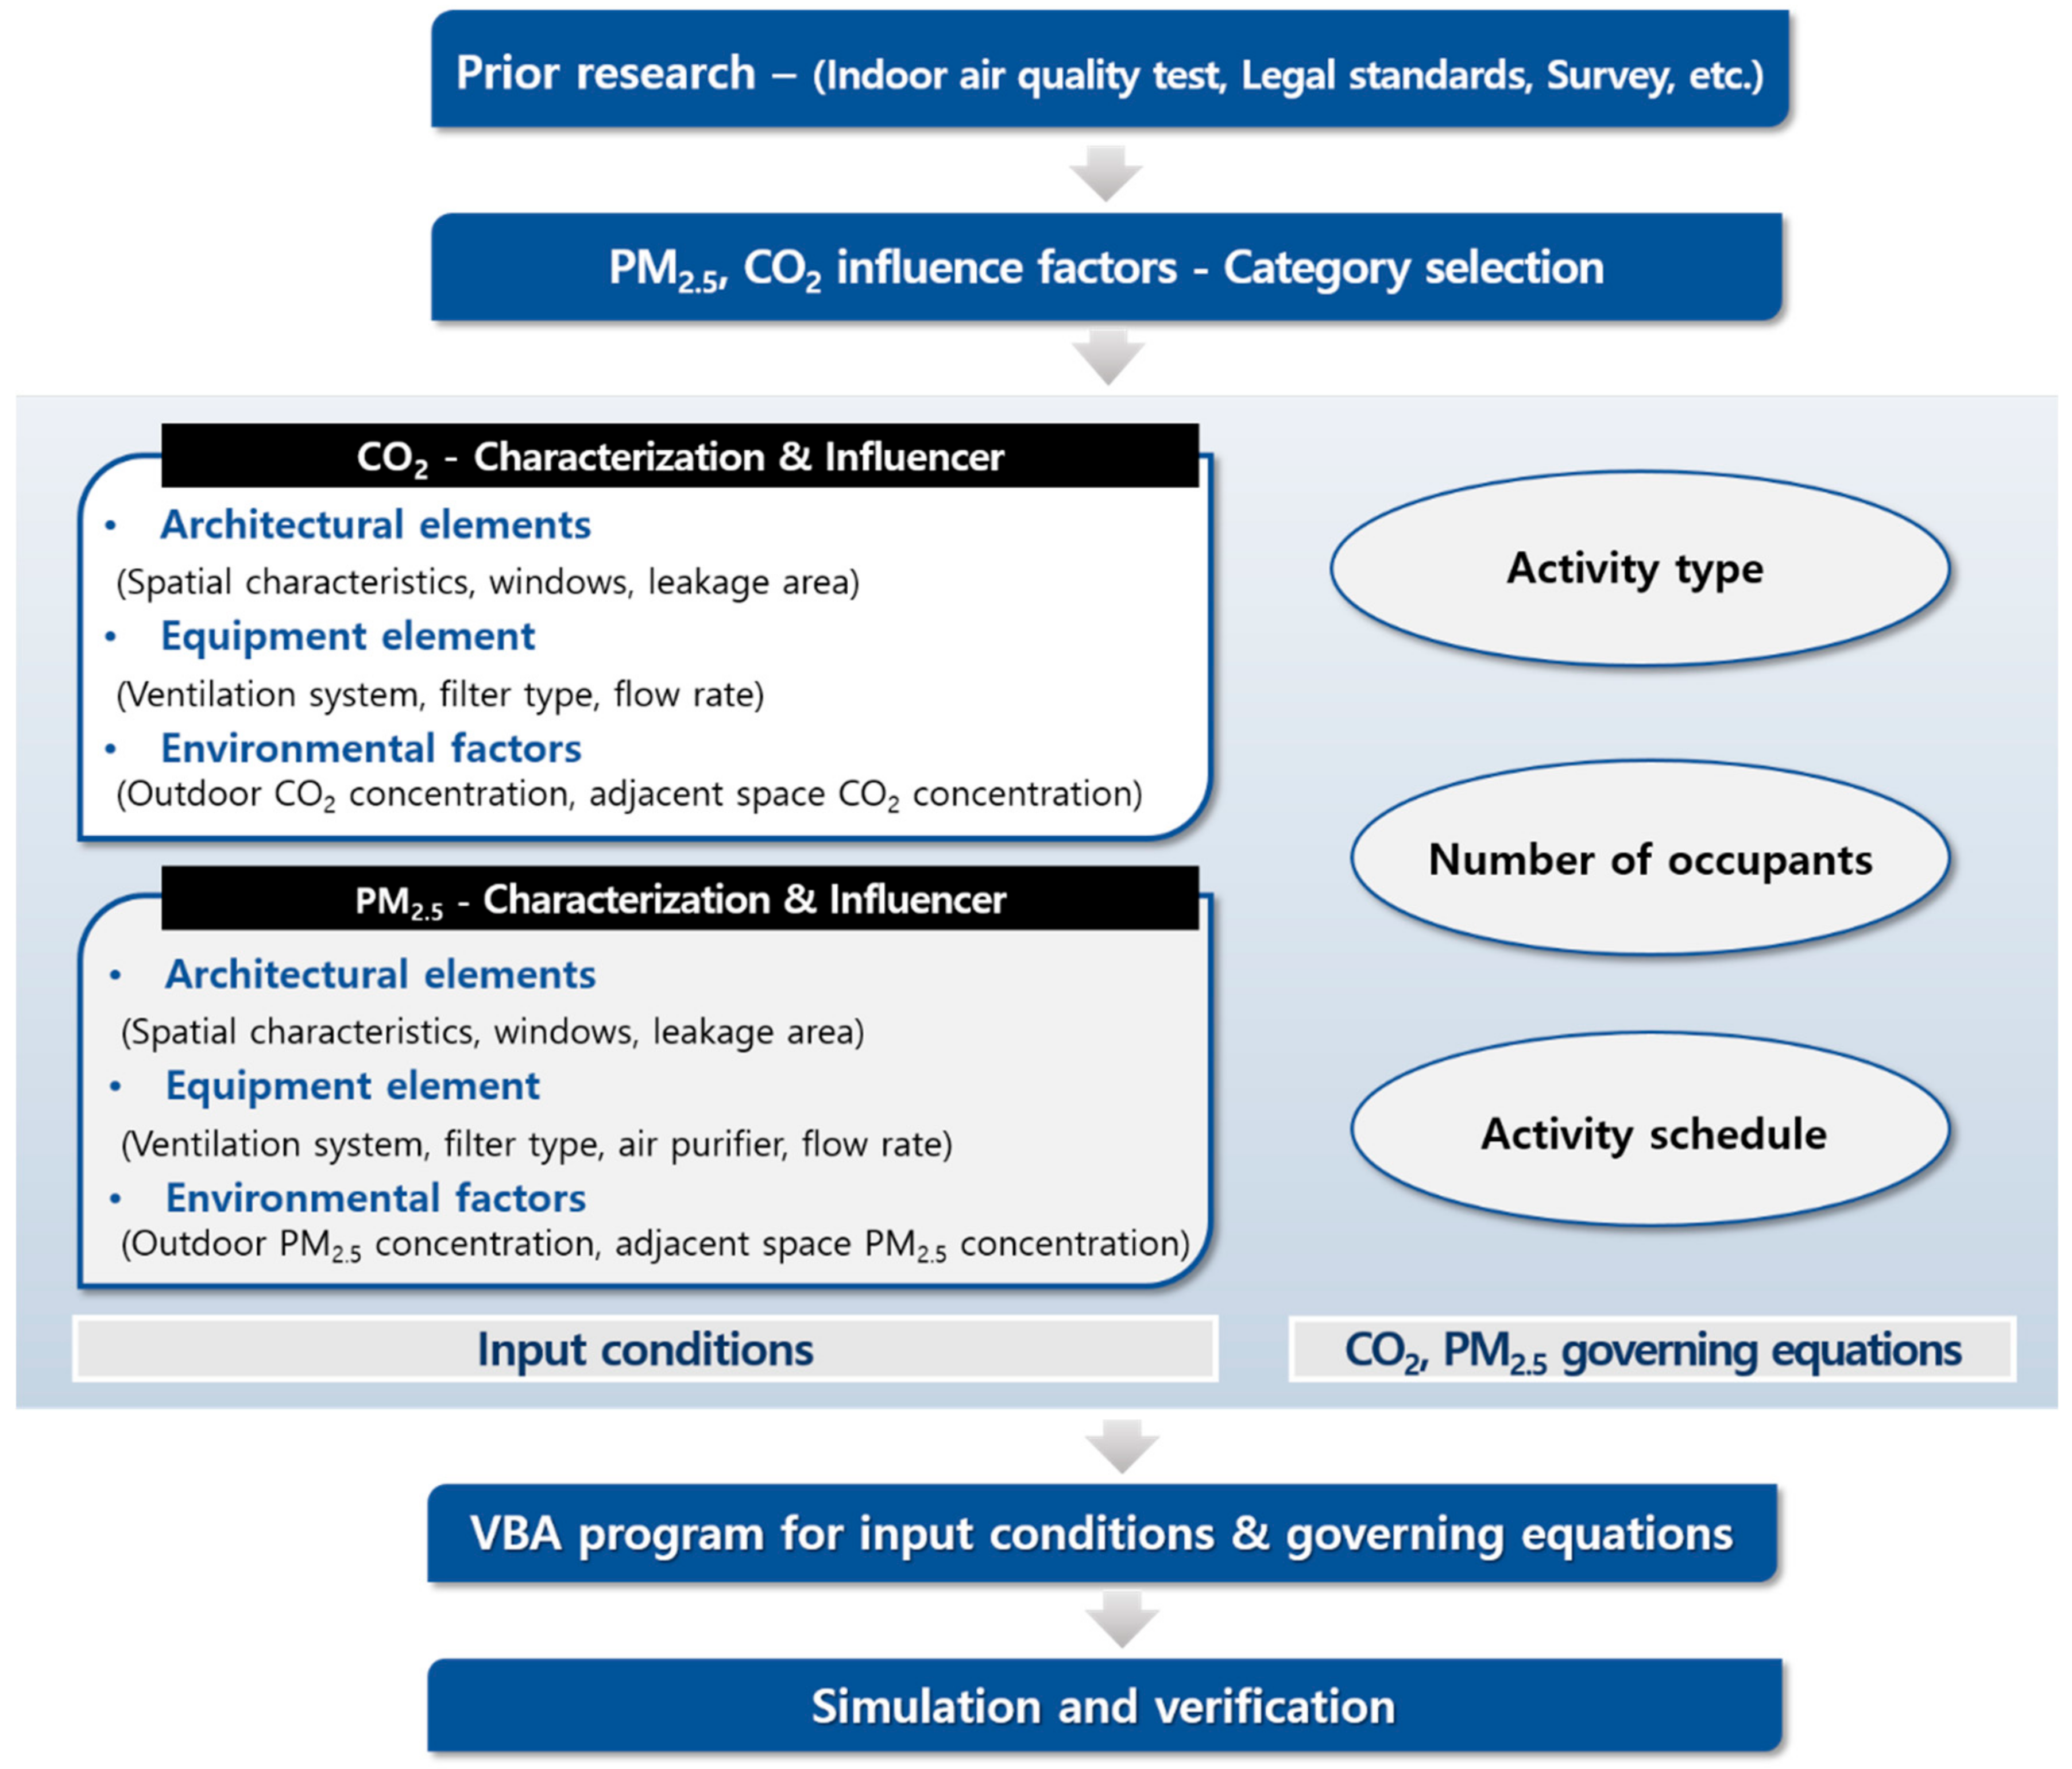
This program was designed with VBA and executed with Microsoft Excel. Figure 3 shows the research process of this study for diagnosing changes in pollutant levels depending on the space and activities conducted in it.
This research process was divided into four stages, and PM2.5 and CO2 were selected as the pollutants for indoor air quality diagnosis.
First, the prior research of the influencing factors to be selected for the Input sheet was investigated through analyses of architectural drawings and experimental data. In particular, the major factors of changes in PM2.5 and CO2 concentrations were identified through experimental data analysis. Second, factors affecting PM2.5 and CO2 concentration changes were selected. The selected influencing factors were used as input conditions that the user could input or select during program operation [29,31]. Third, input conditions (space volume, number of occupants, air volume, etc.) were applied to the mass and concentration conservation equations. The equations derived from these serve as the final predictions of PM2.5 and CO2, which change with time. In addition, the program was configured by inputting VBA code to run it for each instructional schedule (number of occupants, hours of use, operation of air purification facilities, etc.) input by the user. Finally, to verify the accuracy of the simple indoor air quality diagnosis program, the calculated results were compared with the measured data.

3. Prior Research

Prior to the development of the indoor air quality program, research was conducted to identify various variables, such as spatial, facility, and environmental factors, affecting changes in PM2.5 and CO2 concentrations [21,22,23,25,31,32,33]. First, the completed school facility drawings were examined to analyze the architectural elements and applied facilities of the office and multipurpose activity spaces [21,22,23,25,29,33]. Second, indoor air quality experiments were conducted to analyze the characteristics of changes in PM2.5 and CO2 concentrations depending on the number of occupants, air purification facilities, and activities in the office and multipurpose activity spaces [21,22,23,25,29,33].

3.1. Architectural Drawing Analysis

To analyze the application statuses of the architectural and equipment elements, the spaces in the drawings were classified and defined depending on function, and 10 drawings were analyzed based on floor area, ceiling height, window type, and air purification facility application status.

3.1.1. Definition of Spaces by Function

Prior to analyzing the current statuses of office and multipurpose activity spaces, this study defined the functions of the office and multipurpose activity spaces described on the architectural drawings, as shown in Table 1 [34,35,36].

3.1.2. Architectural Elements and Application Statuses of Air Purification Facilities

This study conducted architectural drawing analysis on 10 office spaces, which revealed an average floor area of 75 m2 and an average ceiling height of 2.6 m. The sliding window type was applied to most schools, while the awning window type was applied to new school buildings or administrative offices of universities. The consideration of ventilation depending on opening angles is necessary due to the various angles available for awning windows [37,38].
The average floor area of multipurpose activity spaces was 607 m2, and the average ceiling height was 10.5 m. The window type was sliding window for all 10 schools [33].
This study further analyzed the application statuses of air purification facilities, which affect the change in concentrations of indoor air pollutants [39,40,41,42]. Six of the office spaces and four of the multipurpose activity spaces lacked air purification facilities (Table 2).
Thus, the architectural drawing analysis showed that there are various sizes, window types, and available air purification facilities for office and multipurpose activity spaces. In consideration of these elements, this study added the calculation of input conditions that allow users to directly input information or select various types of information in the air quality diagnosis program.

3.2. Indoor Air Quality Tests

To determine the changes in PM2.5 and CO2 concentrations depending on the number of occupants, air purification facilities, and activities in office and multipurpose activity spaces, this study compared and analyzed the data from the indoor air quality test regarding office and multipurpose activity spaces at three locations.
As shown in Figure 4, the indoor air quality measurement data of three spaces were analyzed. Figure 4a is an office space located in a school facility, Figure 4b is a multipurpose activity space, and Figure 4c is a department office located in a school facility.
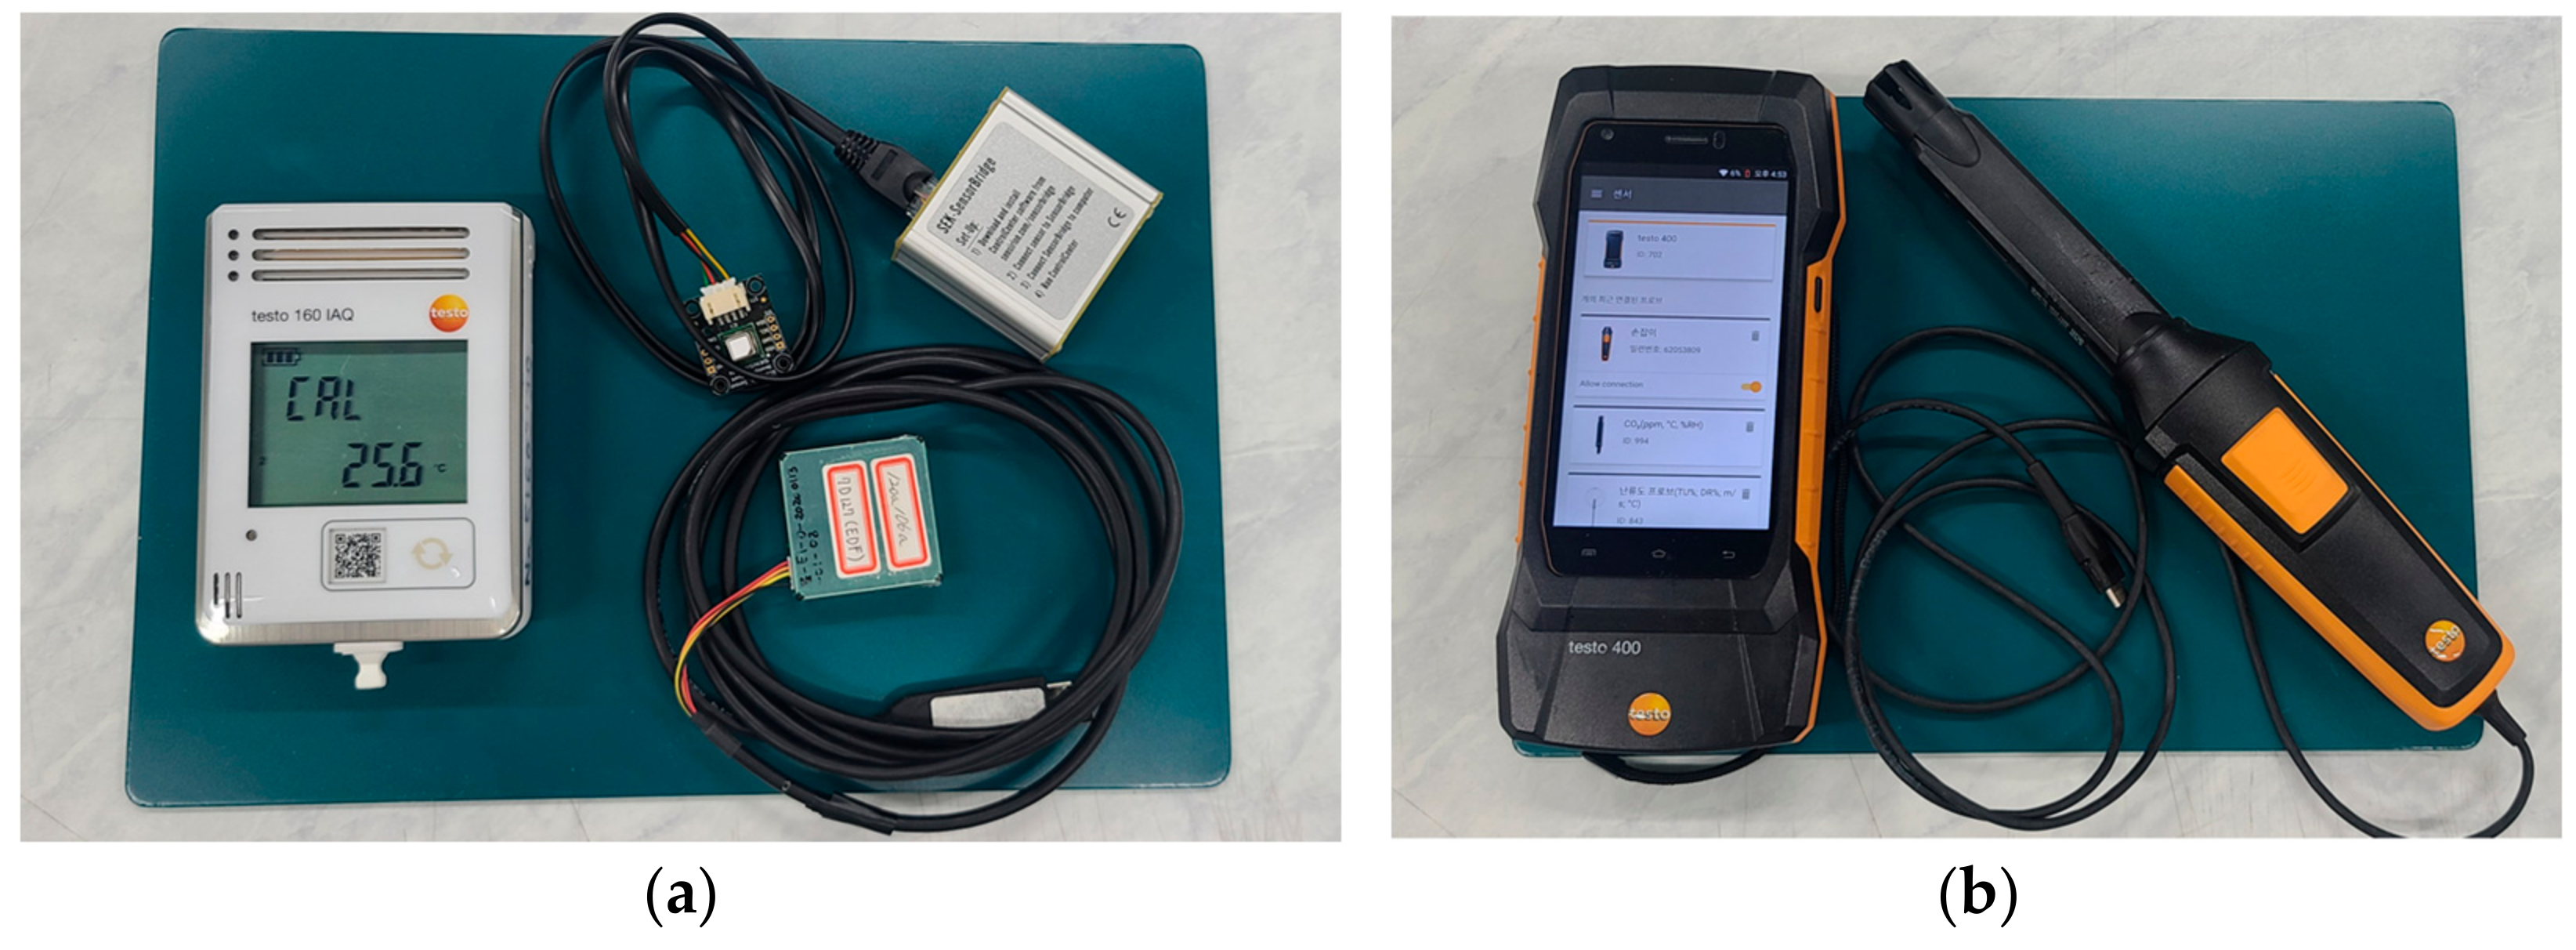
The measuring devices were a Sensirion SPS30 (which is certified for monitoring by the U.K. Environment Agency), an IAQ160, and a SCD40 for the PM2.5 concentration and a Testo 400 for the CO2 concentration (Figure 5) [32].

3.2.1. Analysis of the Characteristics of PM2.5 and CO2: Outdoors and in Hallways

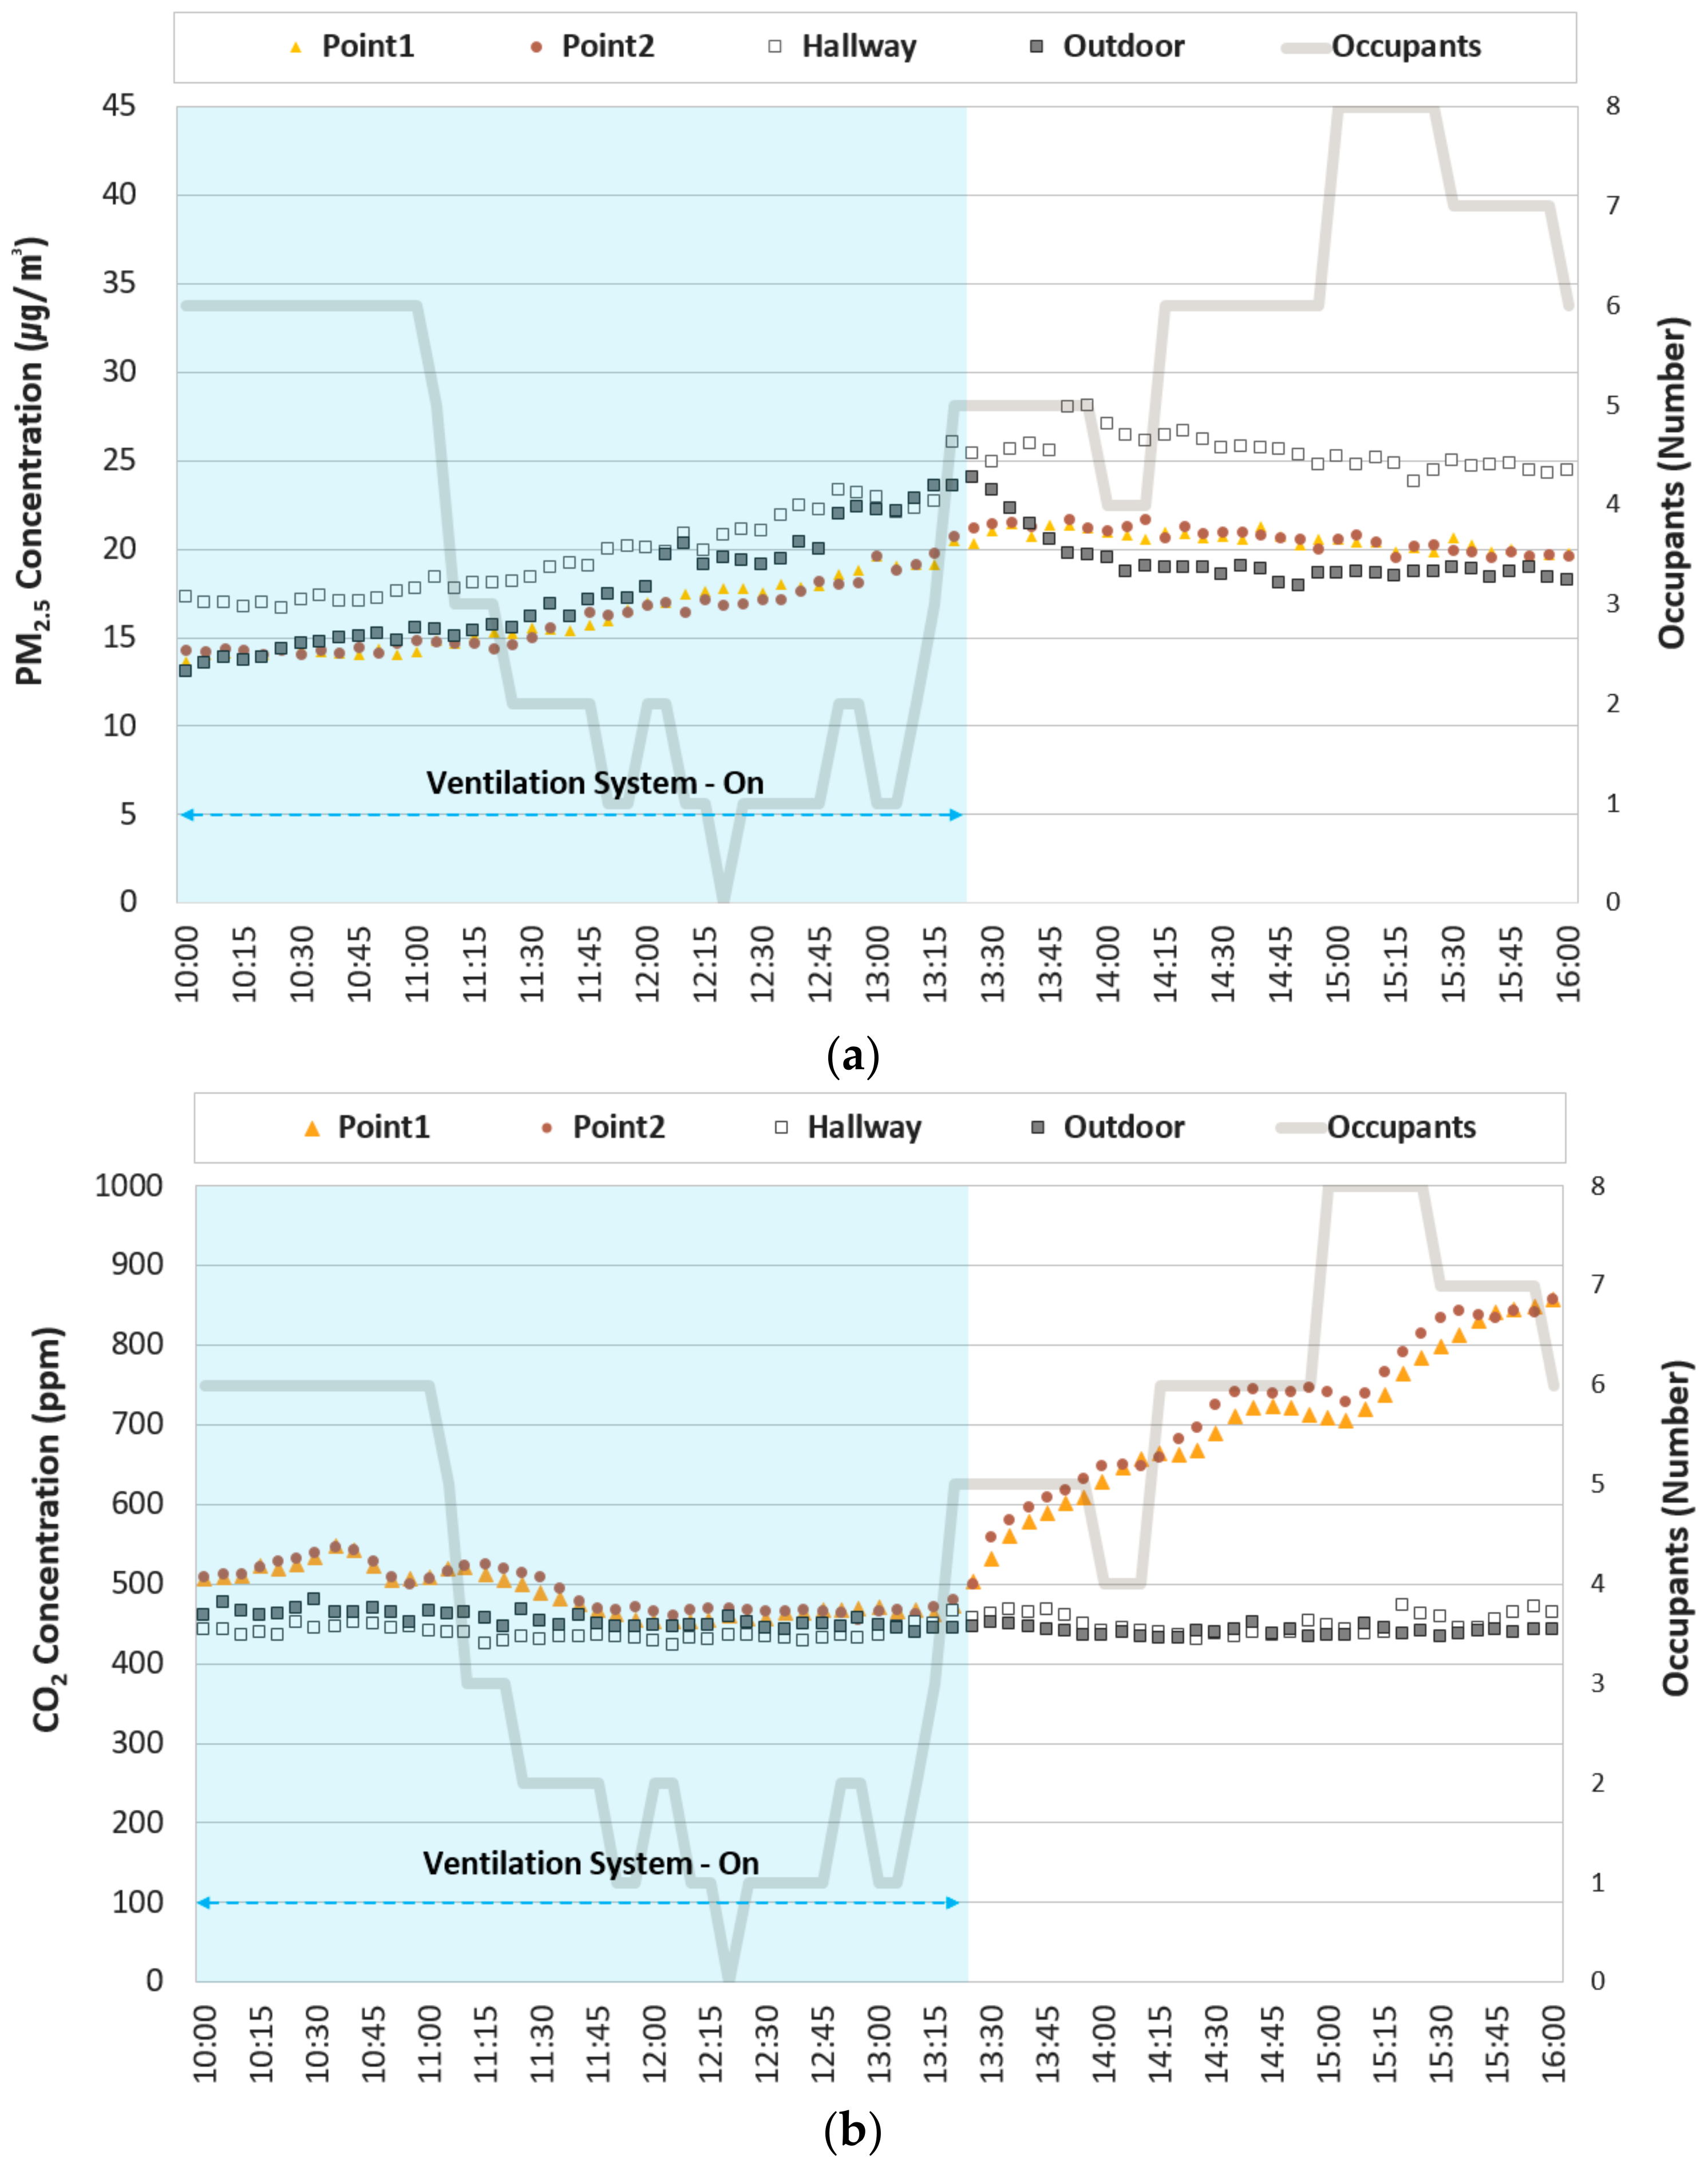
The indoor air quality test data, which were collected on 12 August 2021, were utilized to analyze the changes in air quality concentrations in an indoor space depending on the changes in PM2.5 and CO2 concentrations outdoors and in hallways. This space was an office space capable of accommodating a maximum of 15 people with a floor area of 60.43 m2 [32]. Points 1 and 2 were measured at the 1.2 m level by considering the respiration height [32,33,43].
Figure 6 is a graph of PM2.5 and CO2 concentrations measured from 10:00 to 16:00 on 12 August. As shown in Figure 6a, the PM2.5 concentration of Point 2 was measured at a maximum of 22 µg/m3 between 13:45 and 14:00, while the hallway PM2.5 concentration maximum was 28 µg/m3 at the same time interval. Figure 6b is the analysis result of the CO2 concentration. The CO2 concentration of Point 2 increased to a maximum of 860 ppm at 16:00 due to an increased number of occupants after lunchtime. However, the outdoor and hallway CO2 concentrations remained below approximately 500 ppm.
The data analysis shows that the factors affecting indoor PM2.5 and CO2 concentrations differ, thereby suggesting that indoor PM2.5 concentration is affected by the outdoor PM2.5 concentration and that CO2 concentration is affected by the number of occupants.

3.2.2. Analysis of the Characteristics of PM2.5 and CO2: Windows, Doors, and Air Purification Facilities

The indoor air quality test data collected on 18 November 2020 were utilized to analyze the change in concentrations of PM2.5 and CO2 in the indoor space depending on the opening and closing of doors and windows as well as the availability of ventilation facilities. This space was a multipurpose activity space that is utilized as an auditorium and sports facility and has a floor area of 616.14 m2 [33]. Points 1 and 2 were measured at the 1.2 m level by considering the respiration height [32,33,43].
Figure 7 shows the indoor air quality measurement data from 8:45 to 15:30 on 18 November. As shown in Figure 7a, the indoor PM2.5 concentration decreased by approximately 3.02 µg/m3 between 10:15 and 11:45, which was when the jet fan was in operation. In addition, the PM2.5 concentration in the hallway decreased from 25.19 to 15.10 µg/m3 between 14:30 and 15:00, which was when the door between the hallway and the multipurpose activity space was open, while the concentration in the multipurpose activity space increased from 9.8 to 10.94 µg/m3.
The CO2 concentration remained below 250 ppm from 8:45 to 10:15 and increased to a maximum of 450 ppm from 10:15 to 11:45, at the start time of the occupants’ activities. As shown in Figure 7b, the concentration was measured to be 370 ppm or less after 15:00, when there was no change in the number of occupants.
In addition, the indoor air quality data measured on 20 August 2020 were utilized to analyze the changes in PM2.5 and CO2 concentrations according to the opening and closing of windows as well as the operation of air purifiers. This space was being used as administrative offices and had a floor area of 48.79 m2.
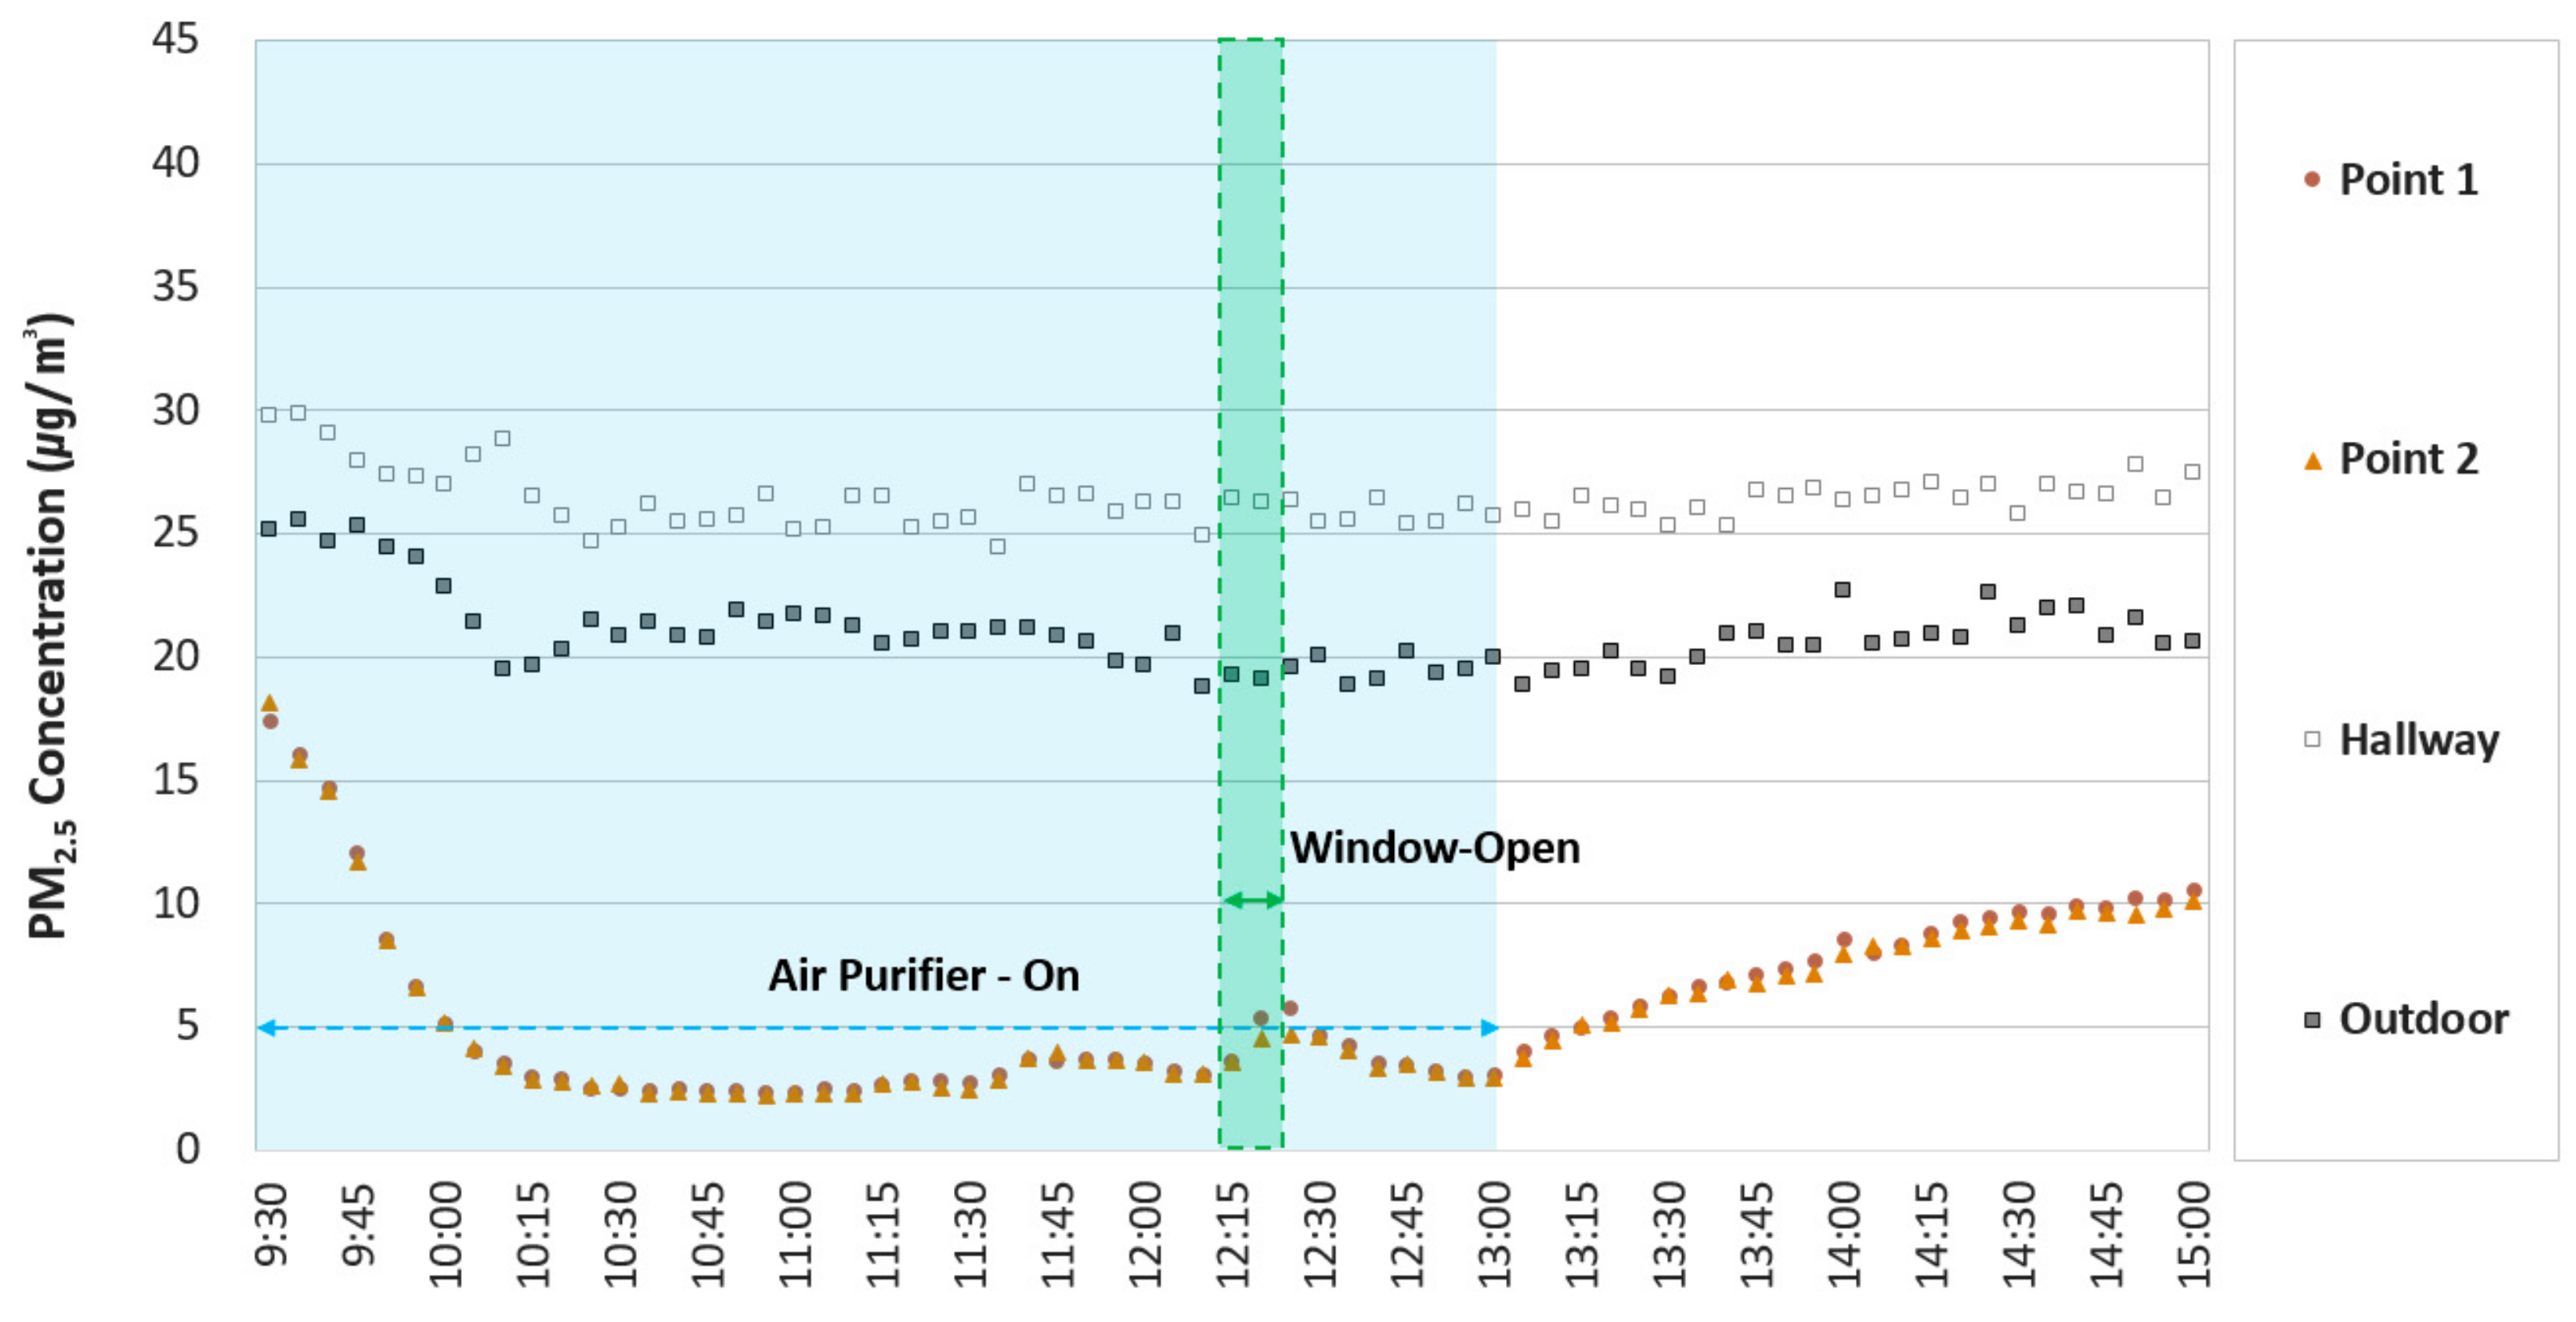
As shown in Figure 8, the air purifier was in operation from 9:30 to 13:00, and the initial PM2.5 concentration at Point 2 decreased from 18.15 µg/m3 at 9:30 to 2.25 µg/m3 at 10:55. Moreover, when the window was open between 12:11 and 12:22, the concentration of Point 1 increased by approximately 2.67 µg/m3, from 3.07 to 5.74 µg/m3.
Through the data analysis of Figure 4, Figure 5 and Figure 6, each influencing factor of PM2.5 and CO2 was identified. The data analysis showed that a jet fan, which brings in outside air through an air purification facility, decreases PM2.5 and CO2 concentrations during its operation. In addition, the results indicated that the air purifier decreased the PM2.5 concentration. They further showed that the opening of windows and doors affected the PM2.5 and CO2 concentrations in the indoor space, as the PM2.5 and CO2 of the adjacent space flowed into the indoor space.

3.2.3. Analysis of the Characteristics of PM2.5 and CO2: Regions

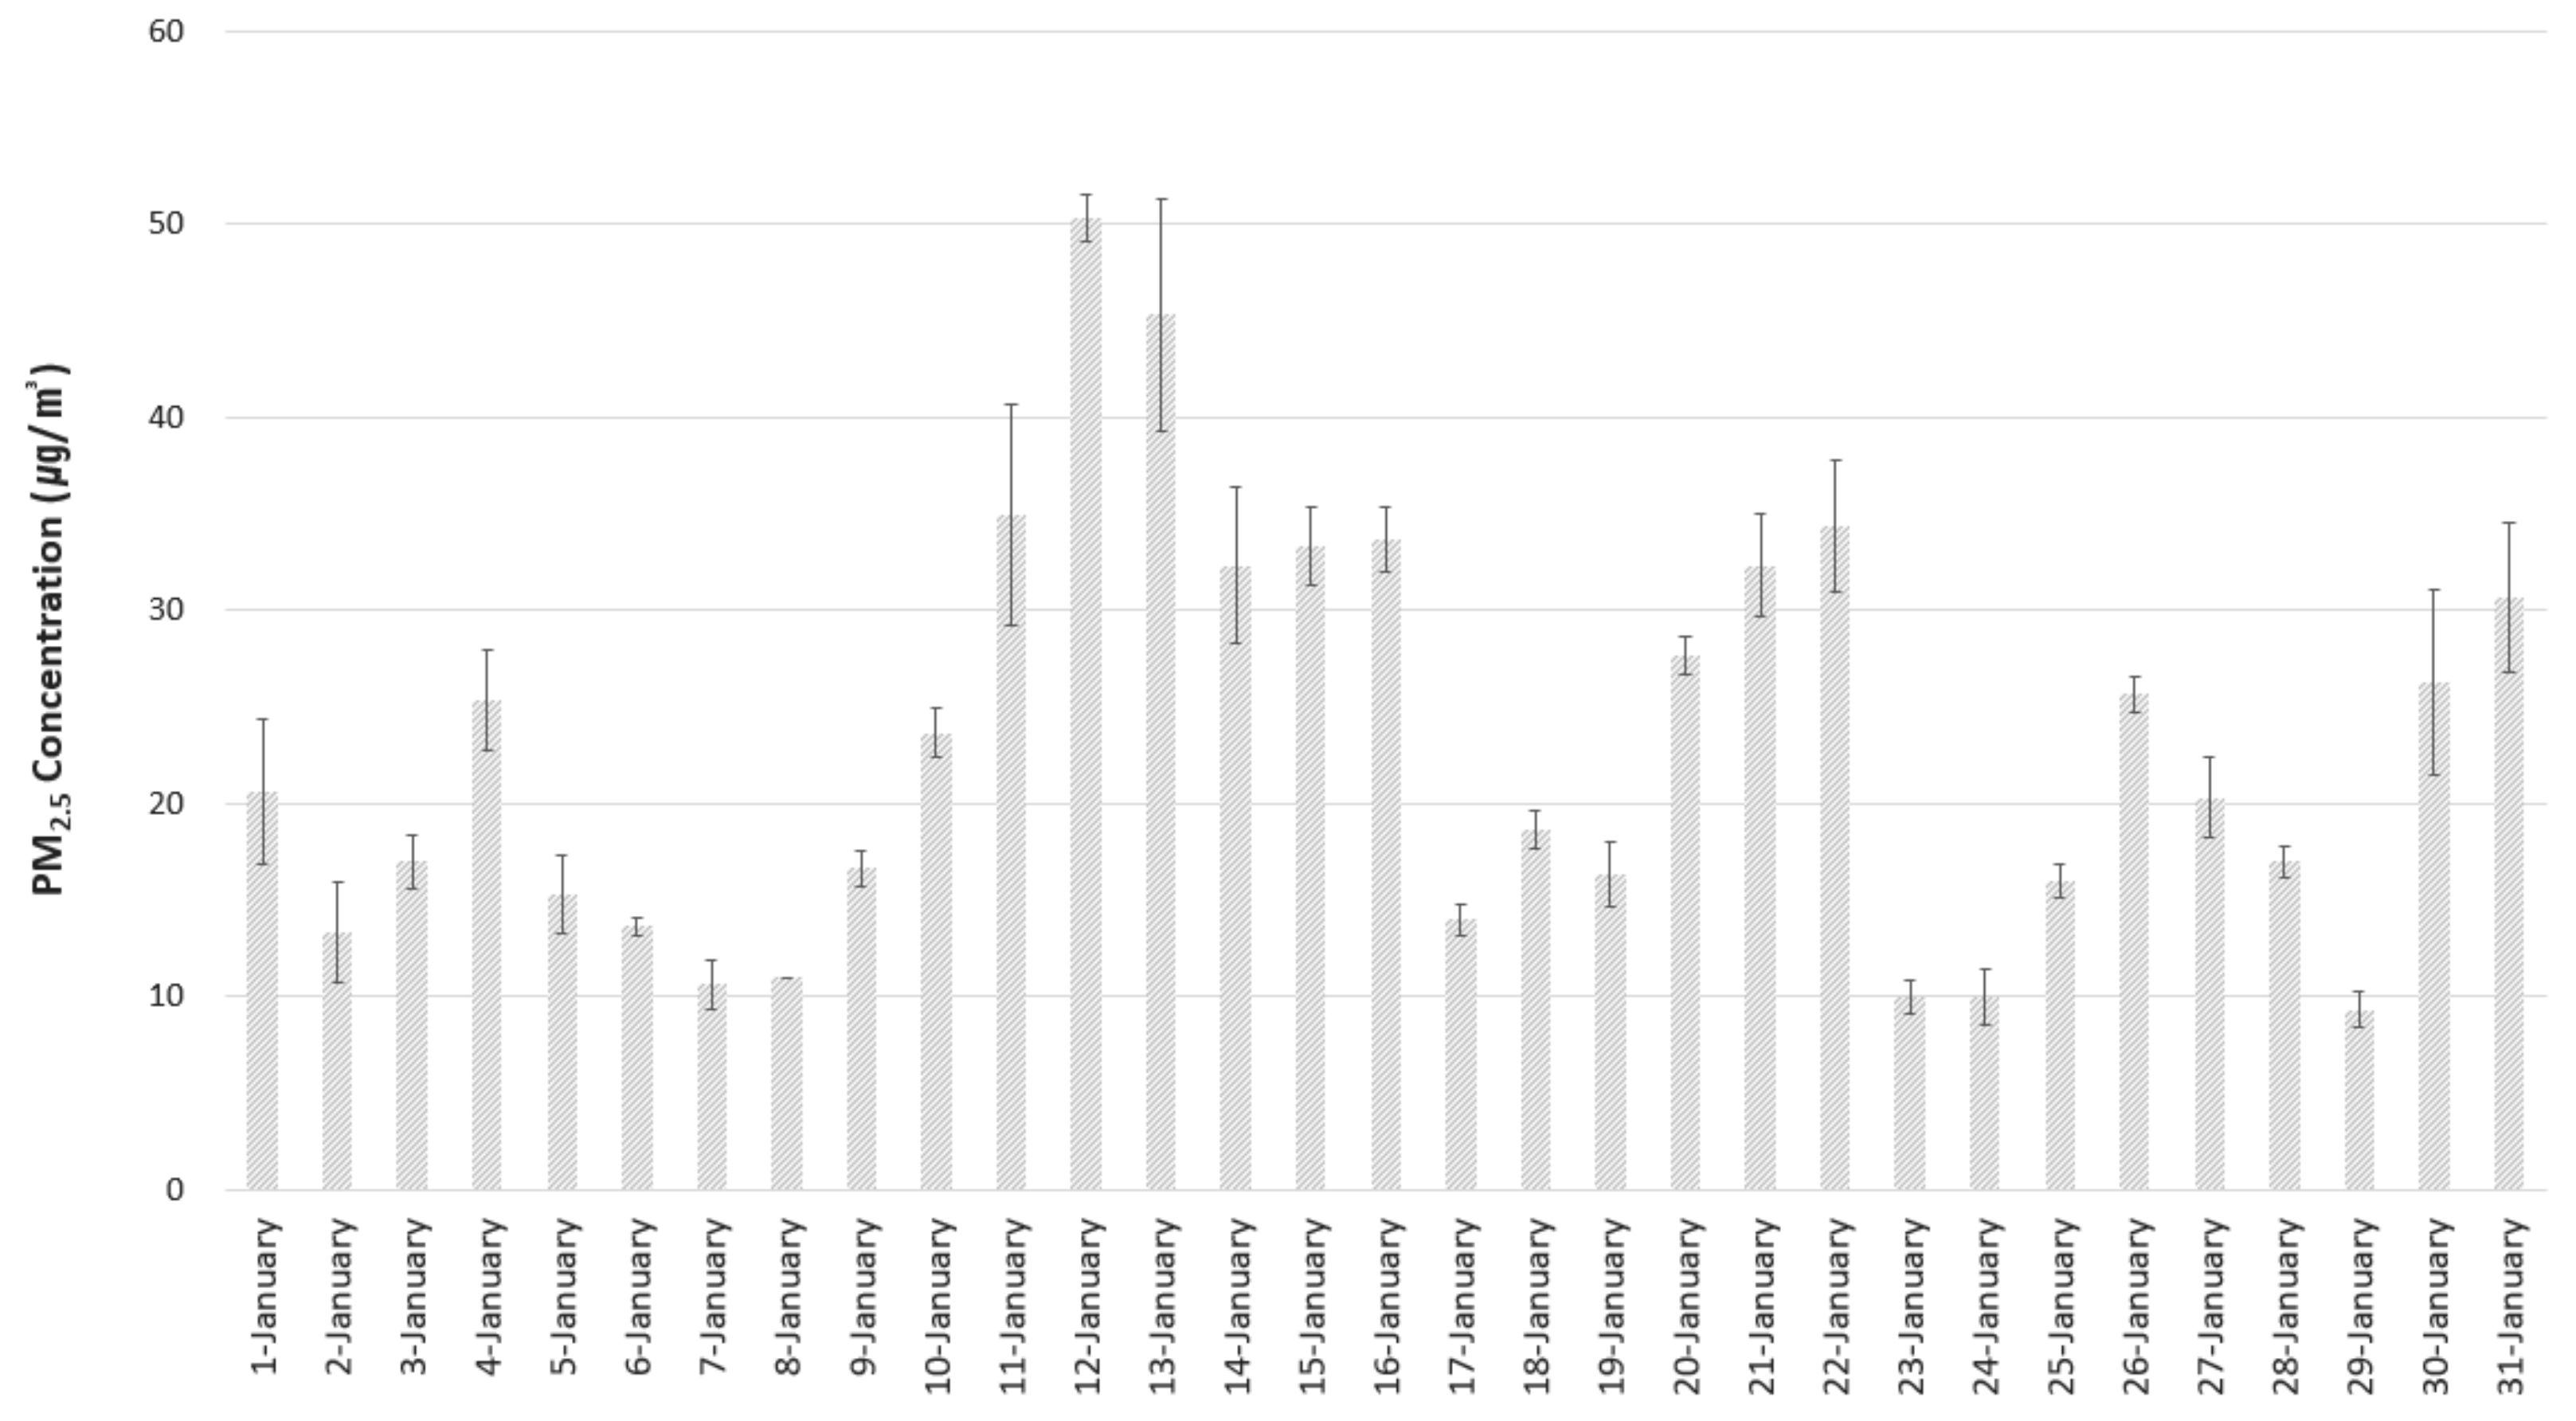
This study utilized Our Neighborhood’s Atmospheric Information and the Annual Report of Air Quality in Korea 2020 provided by the Korea Environment Corporation to check the changes and deviations in PM2.5 concentrations depending on regional location [44,45]. The data from Our Neighborhood’s Atmospheric Information were utilized to analyze the standard deviation of PM2.5 concentration based on the three locations where the previous measurement experiment was conducted (two in Seoul and one in Pyeongtaek, Gyeonggi-do). The standard deviation analysis was conducted based on data gathered in January, when the number of days with a high PM2.5 concentration by year is high in South Korea [46]. The average deviation of PM2.5 concentration in January 2021 in the three regions was 2.07 µg/m3, and as shown in Figure 9, the highest deviation was 6.02 µg/m3 on 13 January.
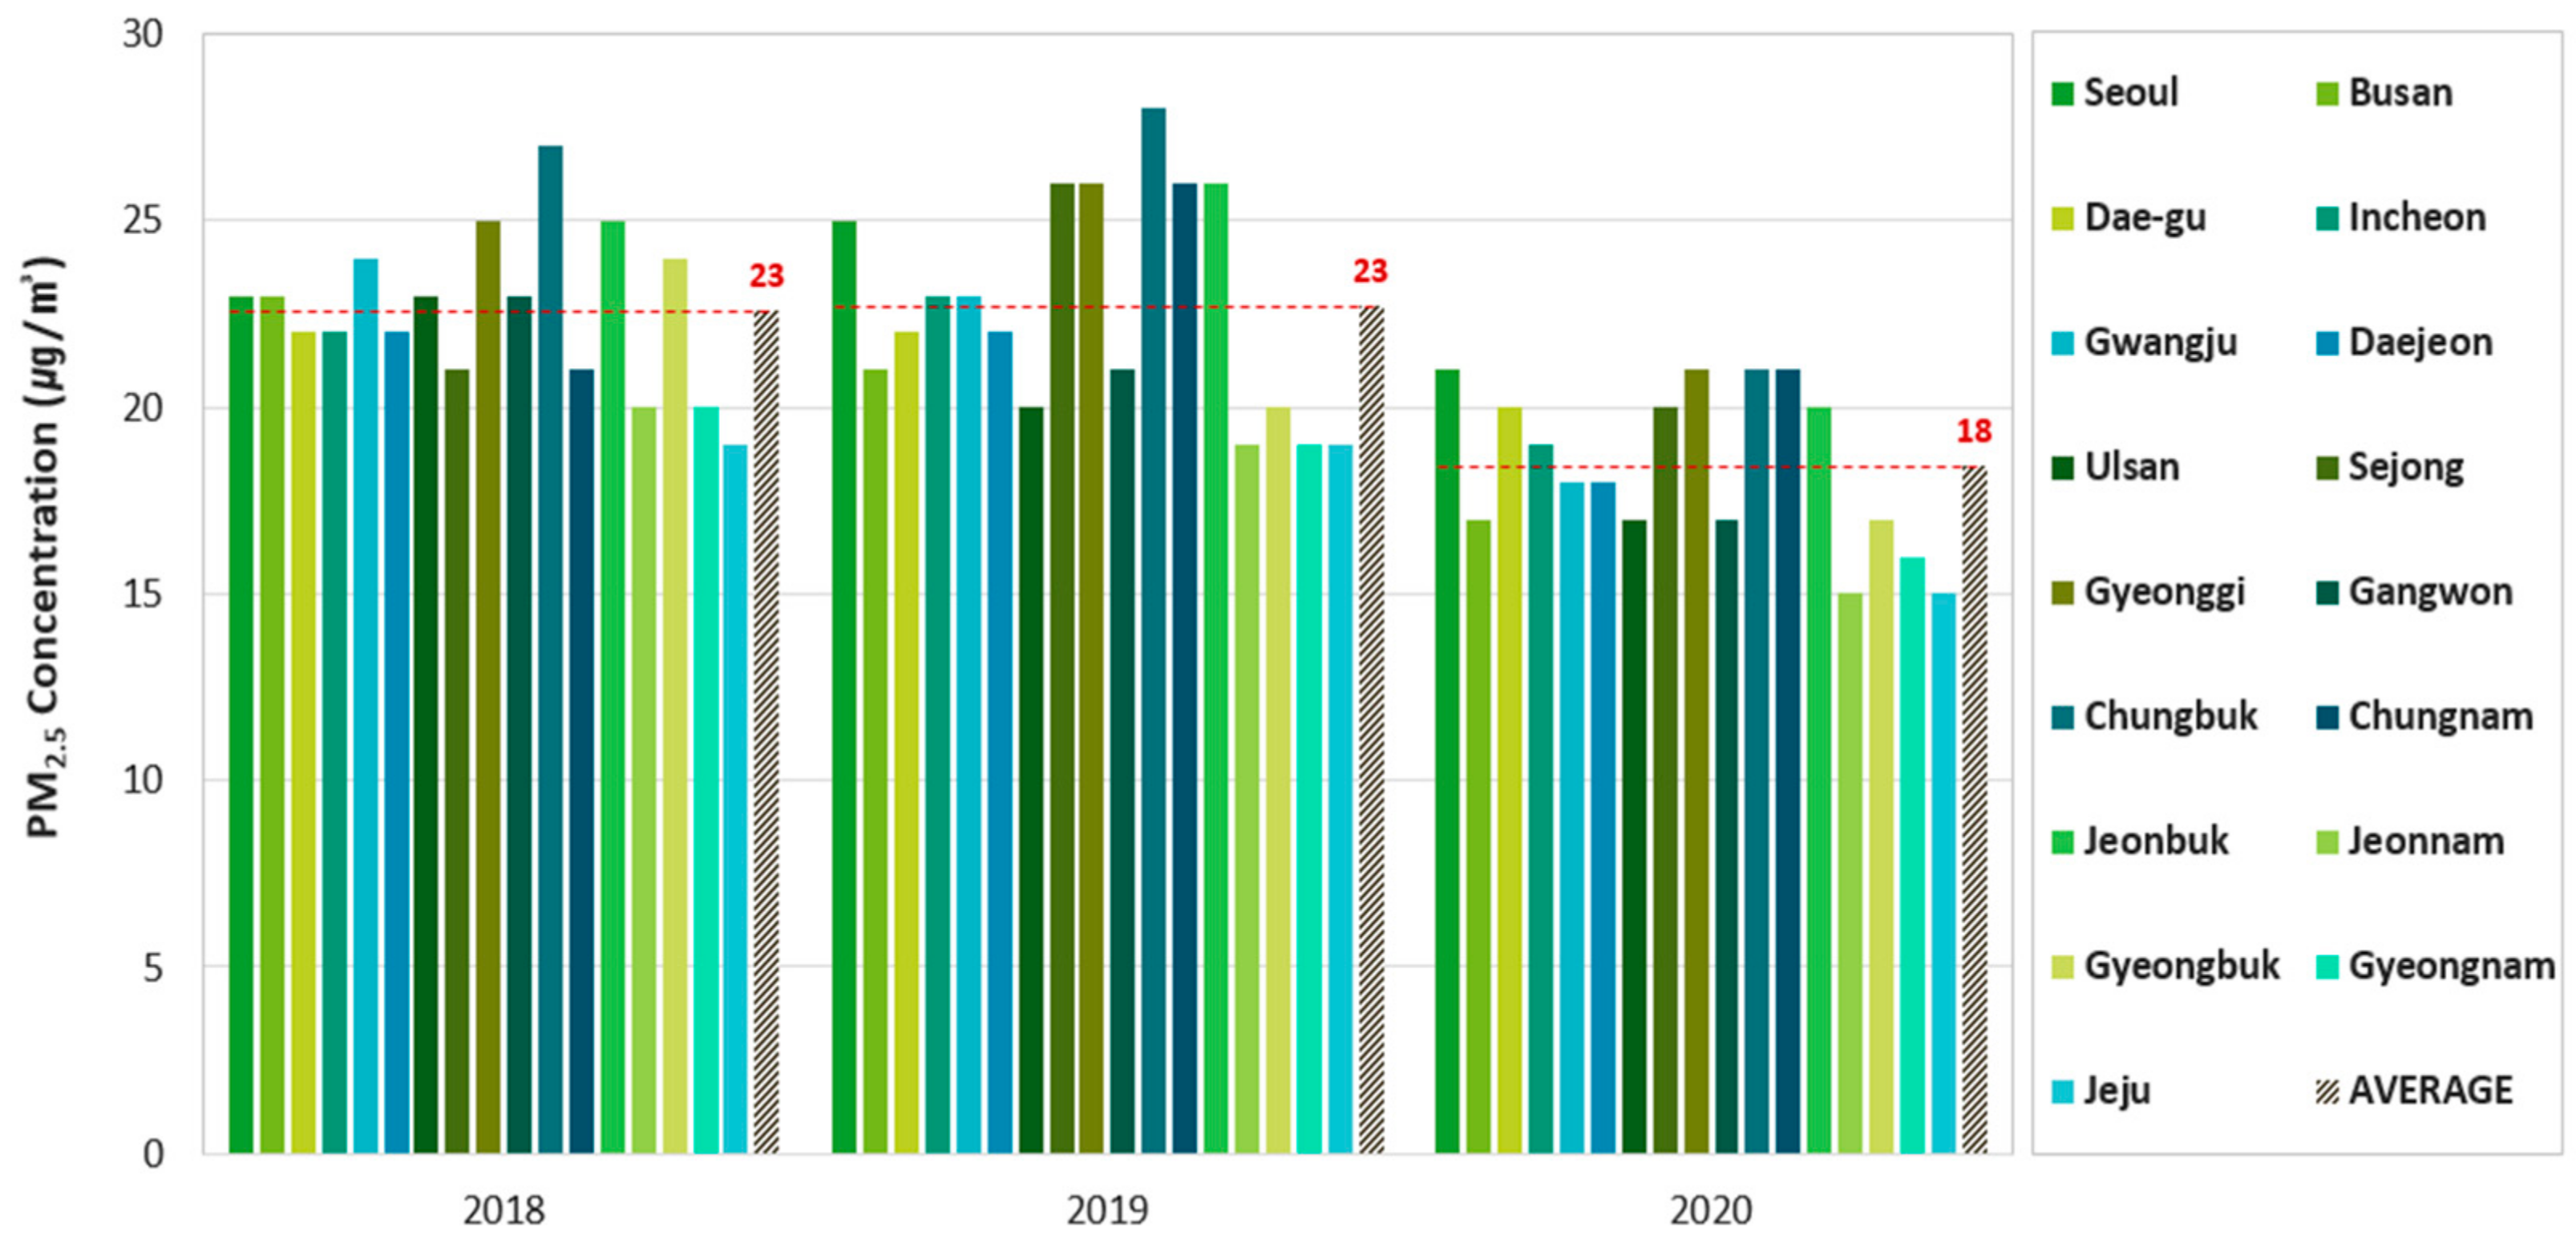
This study utilized the Annual Report of Air Quality in Korea 2020 to check the annual average PM2.5 concentrations by city and province [45]. As a result, the PM2.5 concentration in the Chungcheongbuk-do region in 2018 and 2019 was the highest, while that in Jeju was the lowest. Furthermore, the average annual PM2.5 concentrations in South Korea were 23 µg/m3 and 18 µg/m3 in 2018 and in 2019 and 2020, respectively, indicating a decreasing trend in the annual PM2.5 concentration (Figure 10).
The outdoor CO2 concentration was obtained from Lee et al. [32], who reported an average annual CO2 concentration of 420 ppm in 2020.
The prior research has identified the increasing and decreasing factors of PM2.5 and CO2 concentrations through indoor air quality experiments and analyzed the annual average change in PM2.5 concentration by region. These factors have further been utilized to derive the correlations and concentration prediction equation for each influencing factor for predicting PM2.5 and CO2 concentrations over time, which comprise the core of the simple indoor air quality diagnosis program for office and multipurpose activity spaces at schools.

4. General Structure of the Proposed Program

To calculate the predicted concentrations to be presented as output of the simple diagnostic program, this study separated PM2.5 and CO2 to provide the influencing factors by category by referring to the increasing and decreasing factors obtained from the prior research in addition to selecting input influencing factors to allow users to select or input values. Moreover, an equation for predicting PM2.5 and CO2 concentrations was derived using the mass conservation equation [32,47].

4.1. Prediction of PM2.5 Concentration

To predict PM2.5 concentration depending on user input and selection in the simple diagnostic program, this study derived the influencing factors as input conditions and utilized Equation (1) to derive the change rate of PM2.5 concentration.

4.1.1. Factors Influencing PM2.5

For the classification of influencing factors, factors increasing or decreasing PM2.5 concentrations in the prior research were divided into large and intermediate categories, as shown in Table 3, and the factors applied as input factors in the Input sheet for program users were selected as belonging to the small category.

4.1.2. Input Conditions for Factors Influencing PM2.5

For the small category of factors influencing PM2.5, the factors were further divided into two types: user input conditions, in which a user directly inputs the factor applied to a building, and optional input conditions, in which the program allows a user to select input items. The information on optional input conditions was obtained from a literature review, as shown in Table 4.

4.1.3. Derivation of the PM2.5 Concentration Prediction Equation

The PM2.5 concentration prediction equation depending on occupancy time was derived using the previously derived input values and the mass conservation equation [32,47]. Furthermore, the PM2.5 concentration, unlike the CO2 concentration, decreases with air purifier operation and is affected by deposition over time. Thus, the PM2.5 prediction equation was derived considering the deposition rate presented by Ji et al. [54].
In addition, the indoor PM2.5 concentration changes depend on the degree to which the windows and doors are opened. The air volume caused by the opening of the windows and doors was derived using Equations (1) and (2) [32,47].
Equation (1) is the air velocity flowing into the indoor space through a window [32,47].
V w =   2 Δ P ρ a i r
The variables in Equation (1) are defined as follows:
V w : Wind speed through the window (m/s);
Δ P : Indoor and outdoor pressure difference (Pa);
ρ a i r : Air density (kg/m3).
The pressure difference applied in Equation (1) differs depending on the position of the window and door. In the input condition, the input value was created so that the user could input by dividing the indoor and outdoor pressure difference by the indoor and adjacent space pressure difference.
Equation (2) is the volume of air entering through the window of the indoor working space.
V ˙ w = A ˙ w V w · 3600
The variables in Equation (2) are defined as follows:
V w : Wind speed through the window (m/s);
V ˙ w : Air flow rate through the window (m3/h);
A ˙ w : Window opening area (m2).
To obtain the air volume of the door, one can input the area of the door and the wind speed of the air flowing in from the door into the equation. Equation (3) shows the prediction of indoor PM2.5 concentration changes depending on activity and other factors using Equation (2) and the previously derived input values.
The prediction of indoor PM2.5 concentration change depending on activity and other factors is given by Equation (3) [32,47,54].
V d C P M 2.5 ,   i n d t = { ( 1 η e r v ) V ˙ e r v C P M 2.5 ,   o u t + V ˙ w C P M 2.5 ,   o u t + V ˙ i n f , o u t C P M 2.5 ,   o u t +   V ˙ i n f , h a l l C P M 2.5 , h a l l + V ˙ d , o u t C P M 2.5 , o u t + V ˙ d , h a l l C P M 2.5 , h a l l }   C P M 2.5 ,   i n ( V ˙ e r v + V ˙ w + V ˙ i n f , o u t + V ˙ i n f , h a l l + V ˙ d , o u t + V ˙ d , h a l l +   λ P M 2.5 Σ A + V ˙ p η p )
The variables in Equation (3) are defined as follows:
V: Volume of the room (m3);
t : Time (h);
C P M 2.5 , in : Indoor PM2.5 concentration (µg/m3);
η e r v : Mechanical ventilation system filter efficiency;
V ˙ e r v : ERV supply flow rate (m3/h);
C P M 2.5 , o u t : Outdoor PM2.5 concentration (µg/m3);
V ˙ w i n d o w : Air flow rate through the window (m3/h);
V ˙ i n f , o u t : Infiltration flow rate from outdoor air (m3/h);
V ˙ i n f , h a l l : Infiltration flow rate from adjacent space air (m3/h);
C P M 2.5 , h a l l : Concentration of PM2.5 in adjacent spaces (µg/m3);
V ˙ d , o u t : Air flow rate through the external door opening (m3/h);
V ˙ d , h a l l : Air flow rate through the adjacent door opening (m3/h);
λ P M 2.5 ,   d : PM2.5 deposition rate (m/h);
Σ A : Surface area of the space (m2);
V ˙ p : Air purifier flow rate (m3/h);
η p : Air purifier filter efficiency.

4.2. Prediction of CO2 Concentration

To predict CO2 concentration depending on user input and selection in the simple diagnostic program, this study derived the influencing factors as input conditions and utilized Equation (2) to derive the CO2 concentration change per hour.

4.2.1. Factors Influencing CO2

For the classification of influencing factors, factors increasing and decreasing CO2 concentrations in the prior research were divided into large and intermediate categories, as shown in Table 5, and those applied as input factors in the Input sheet for program users were selected as belonging to the small category.

4.2.2. Input Conditions for Factors Influencing CO2

For the small category of factors influencing CO2, the factors were further divided into two types: user input conditions, in which a user directly inputs the factor applied to a building, and optional input conditions, in which the program allows a user to select input items. The information on optional input conditions was obtained from a literature review, as shown in Table 6.

4.2.3. Derivation of the CO2 Concentration Prediction Equation

The CO2 concentration prediction equation depending on occupancy time was derived using the previously derived input values [32,47,52]. In addition, CO2 concentration, unlike PM2.5 concentration, is subject to significant change based on the number of occupants, and its increase rate varies depending on the type of activities performed by the occupants [31,32,33,55,56,57].
The CO2 emissions per person per hour, taking into account the size of the body of students and adults, are as shown in Equation (4) [32,43,56,57].
C ˙ a o r   s = R Q   0.0276 A D M 0.23 R Q + 0.77   · 3600
The variables in Equation (4) are defined as follows:
C ˙ a o r   s : The amount of CO2 per person per hour for each activity (ℓ/h);
R Q : Respiratory quotient (0.83);
AD: Occupant’s surface area (m2);
M : Met level.
Equation (5) predicts changes in indoor CO2 concentration according to activity and other factors using Equations (1), (2) and (4).
The prediction of indoor CO2 concentration change depending on activity and other factors is given by Equation (5) [32,47,55,56,57].
V d C C O 2 ,   i n d t = ( N a C ˙ a + N s C ˙ s + V ˙ e r v C C O 2 ,   o u t + V ˙ w C C O 2 , o u t +   V ˙ i n f , o u t C C O 2 ,   o u t +   V ˙ i n f , h a l l C C O 2 ,   h a l l + V ˙ d , o u t C C O 2 ,   o u t + V ˙ d , h a l l C C O 2 ,   h a l l )   C C O 2 , i n ( V ˙ e r v + V ˙ w + V ˙ i n f , o u t + V ˙ i n f , h a l l + V ˙ d , o u t + V ˙ d , h a l l )
The variables in Equation (5) are defined as follows:
V: Volume of the room (m3);
t : Time (h);
C C O 2 , i n : Indoor CO2 concentration (ppm);
N a : Number of adults;
N s : Number of students;
C a ˙ : CO2 emissions by adult (ℓ/h);
C s ˙ : CO2 emissions by student (ℓ/h);
V ˙ e r v : ERV supply flow rate (m3/h);
C C O 2 , o u t : Outdoor CO2 concentration (ppm);
V ˙ w i n d o w : Air flow rate through the window (m3/h);
V ˙ i n f , o u t : Infiltration flow rate of outdoor air (m3/h);
V ˙ i n f , h a l l : Infiltration flow rate of adjacent space air (m3/h);
C C O 2 , h a l l : Concentration of CO2 in the adjacent space (ppm);
V ˙ d , o u t : Air flow rate through the external door opening (m3/h);
V ˙ d , h a l l : Air flow rate through the adjacent door opening (m3/h).

4.3. The Simple Diagnosis Program for Indoor Air Quality

The PM2.5 and CO2 concentration prediction equations were utilized to produce a simple diagnostic program that enables a user to check the indoor air quality by either directly inputting values or selecting each element. This program was created using Microsoft Excel.

4.3.1. Implementation of the Concentration Prediction Equation for Each Class Period

This study constructed a period checklist for the simple diagnosis program for indoor air quality, as shown in Figure 11, which allows users to input or modify conditions subject to change by period by considering the characteristics of school facilities utilized in each class period. For the modification of input conditions for each period, an icon was added using a macro function, which is a development tool of Microsoft Excel. Furthermore, as shown in Figure 11, the input conditions for the architectural, equipment, and environmental elements selected in Input were utilized to declare and assign variables through VBA in Microsoft Excel, and the equation utilizing the concentration prediction equation that was previously derived was applied to present the output for each class period with VBA coding.

4.3.2. Coding of the Simple Diagnosis Program

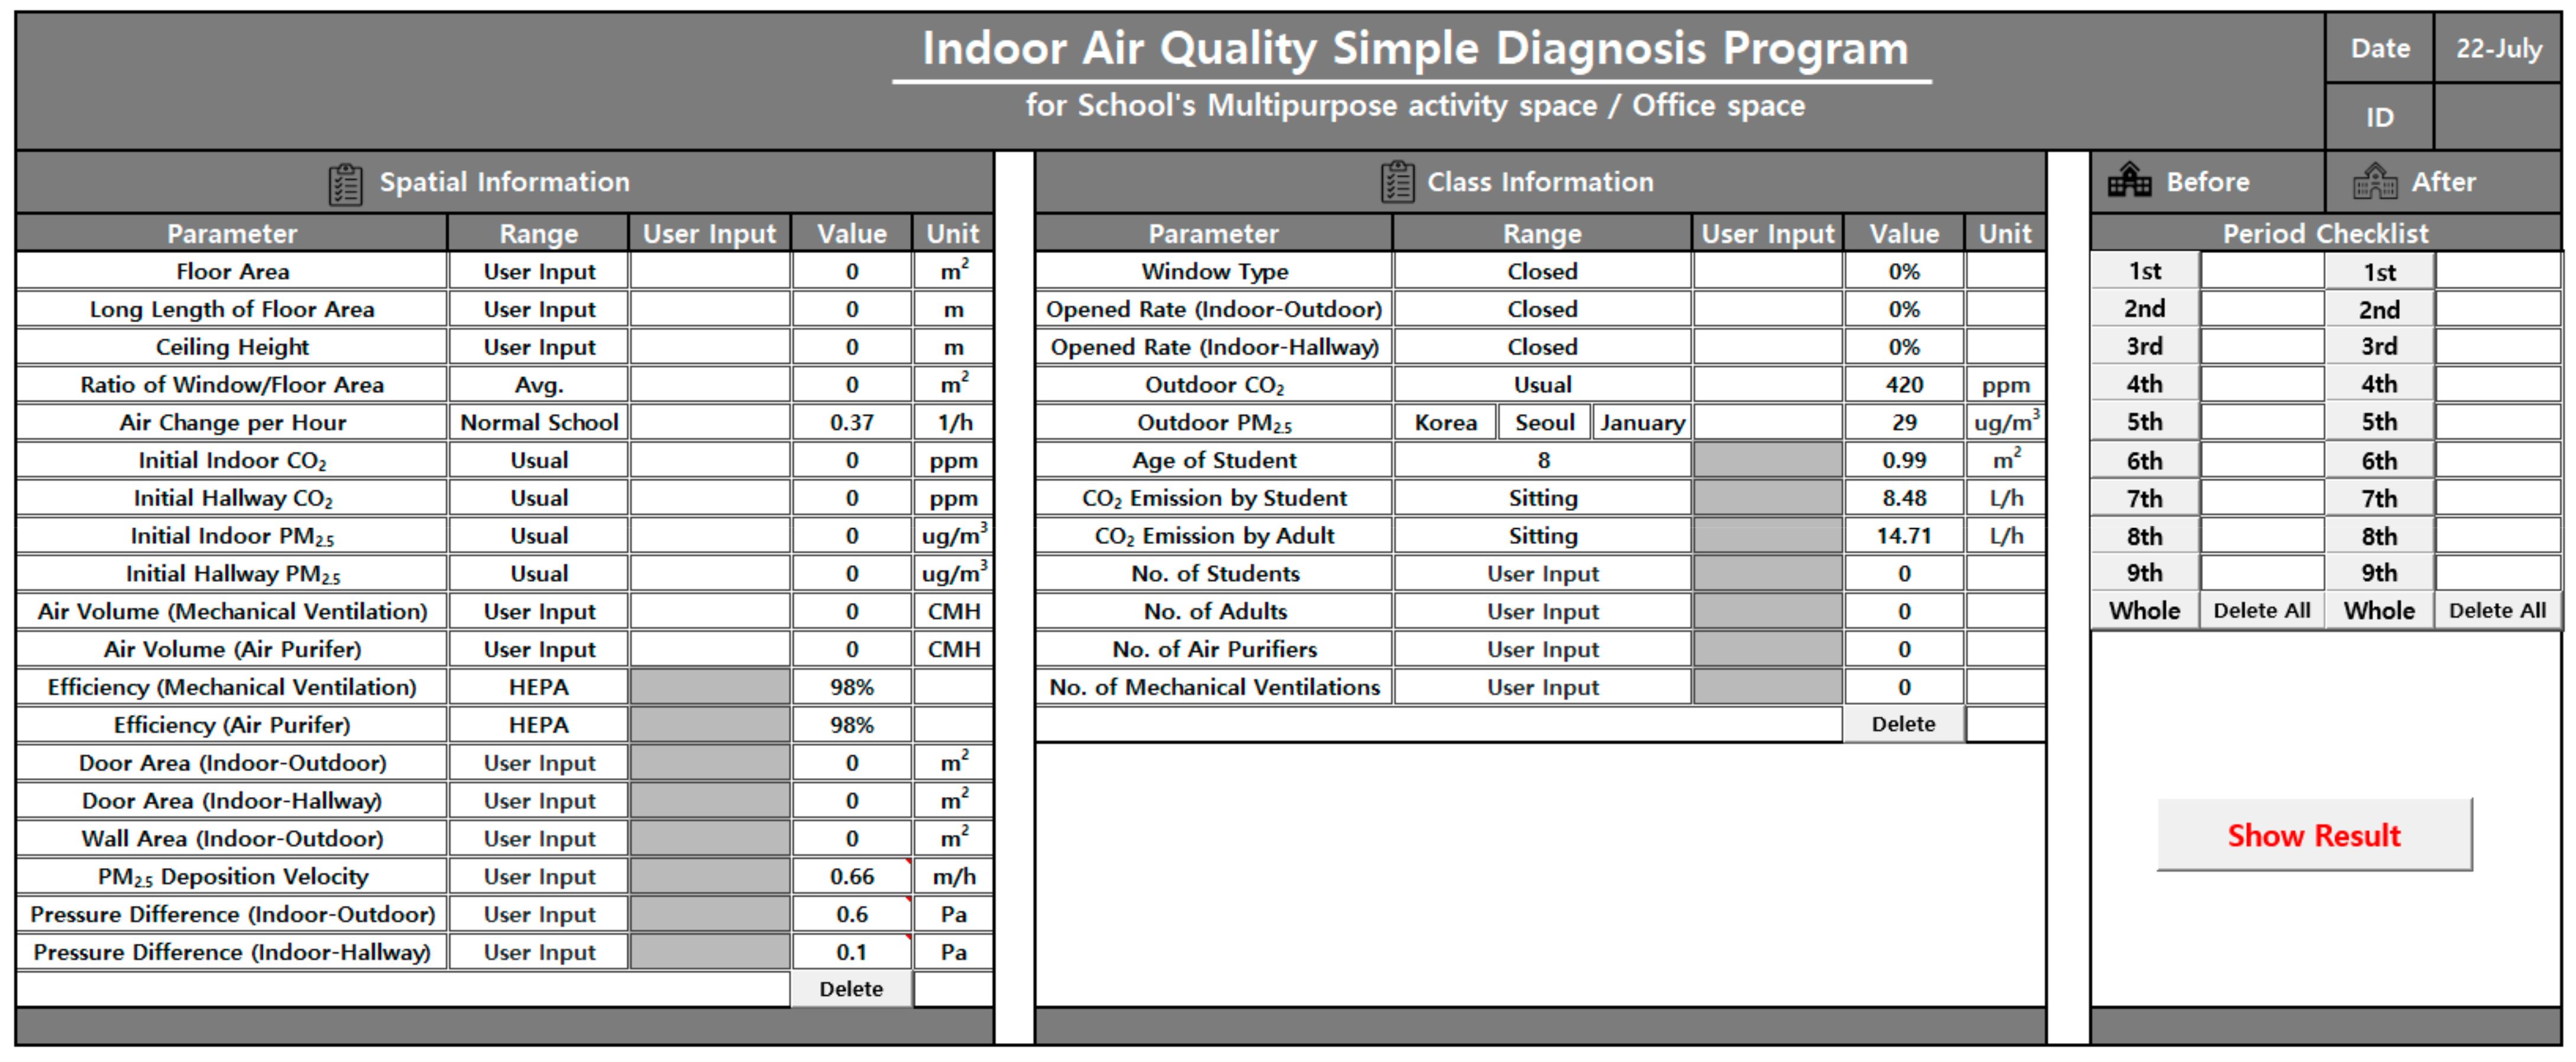
The simple diagnosis program for indoor air quality consists largely of two sheets. First, the Input sheet is a sheet in which the user inputs space information. As shown in Figure 12, the parameters in the Input sheet are architectural, equipment, and environmental factors, and their ranges can be determined by either user input or optional selection. Moreover, this program, in consideration of the characteristics of school operation, offers a period checklist, which enables variable conditions to be modified or added for each period; the “Show Result” button allows users to move to the result window.
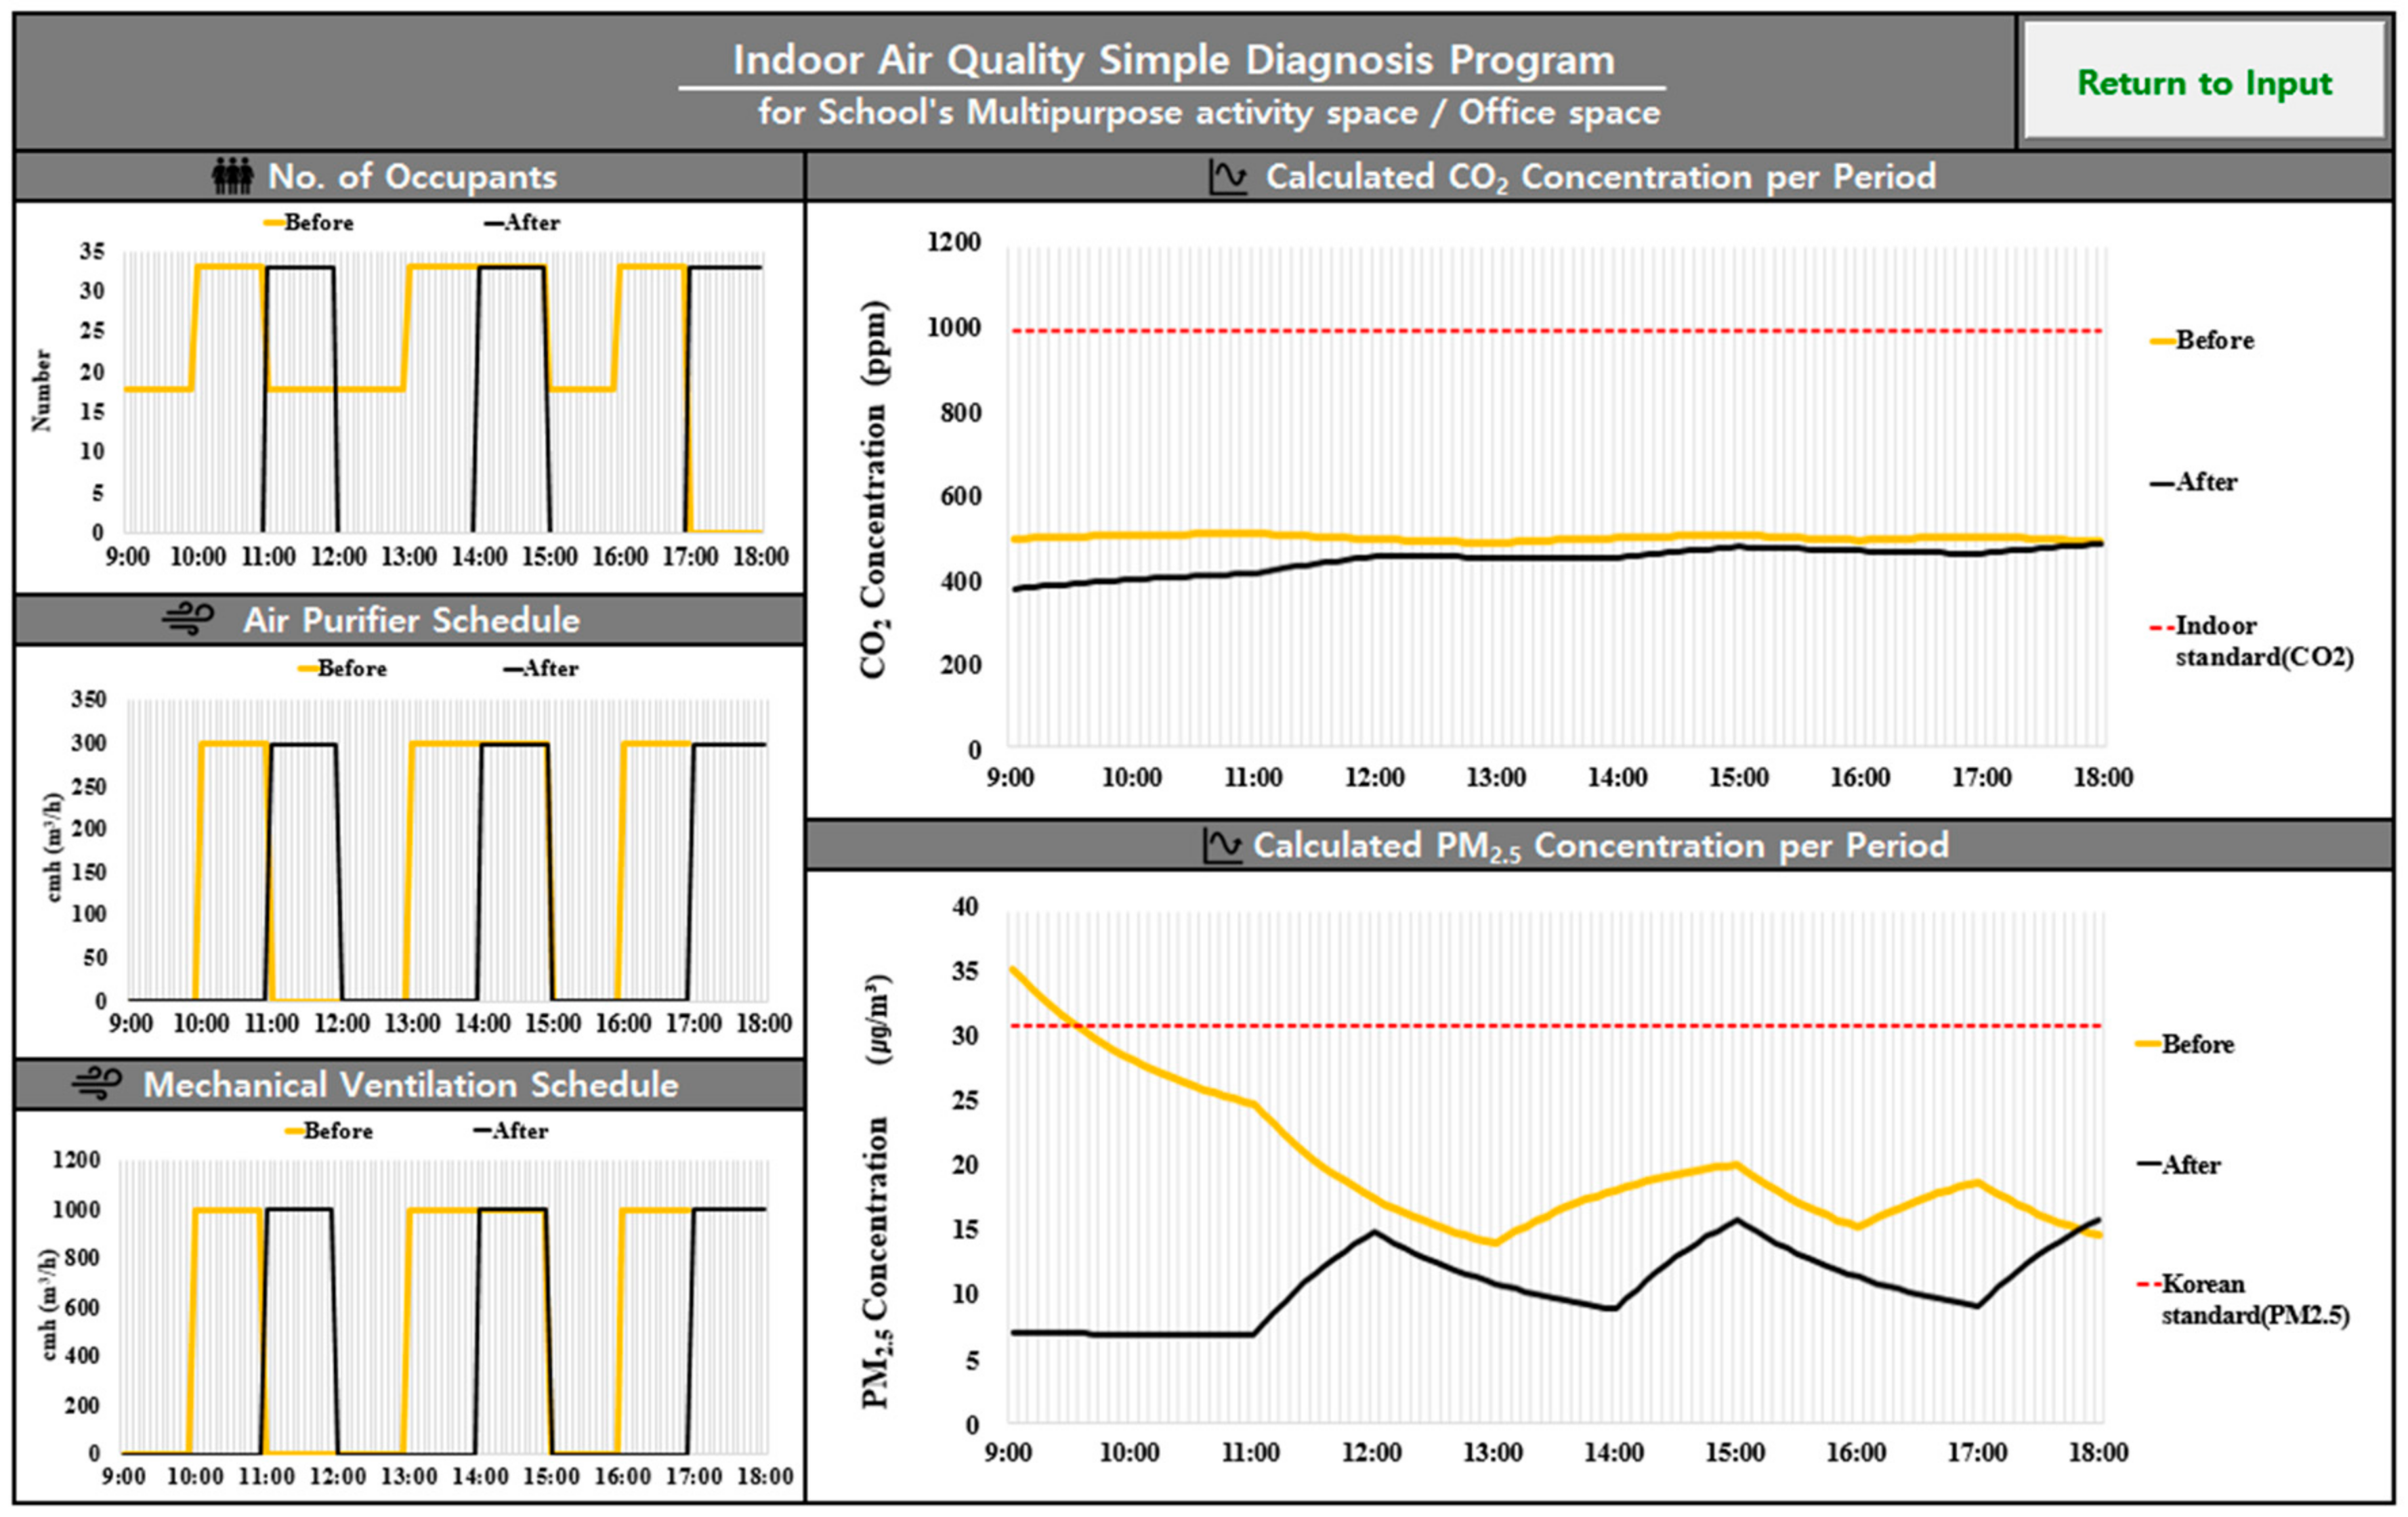
The diagnosis program, as shown in Figure 13, was configured to allow users to read the PM2.5 and CO2 concentrations predicted by the input into the Input sheet. The Result sheet provides the prediction information in graphical form to determine the PM2.5 and CO2 concentration per hour. The Result sheet was further configured to show the occupant schedule per hour, the air purifier operation schedule, and the mechanical ventilation operation schedule for improving air quality in the diagnosis space in addition to the predicted concentration. Finally, this program offers a “Return to Input” button, which allows users to return to the input conditions to enhance user convenience.

5. Validation and Results

To improve the reliability of the prediction results on PM2.5 and CO2 concentrations calculated by the simple diagnosis program, this study conducted a comparative analysis on the measured data and the result data from the simple diagnosis program. For the measured data to be compared, an indoor air quality test was conducted for a single-person office space, which is capable of the smooth control of external environmental factors, using the measurement devices presented in Section 4.2 (Figure 5).
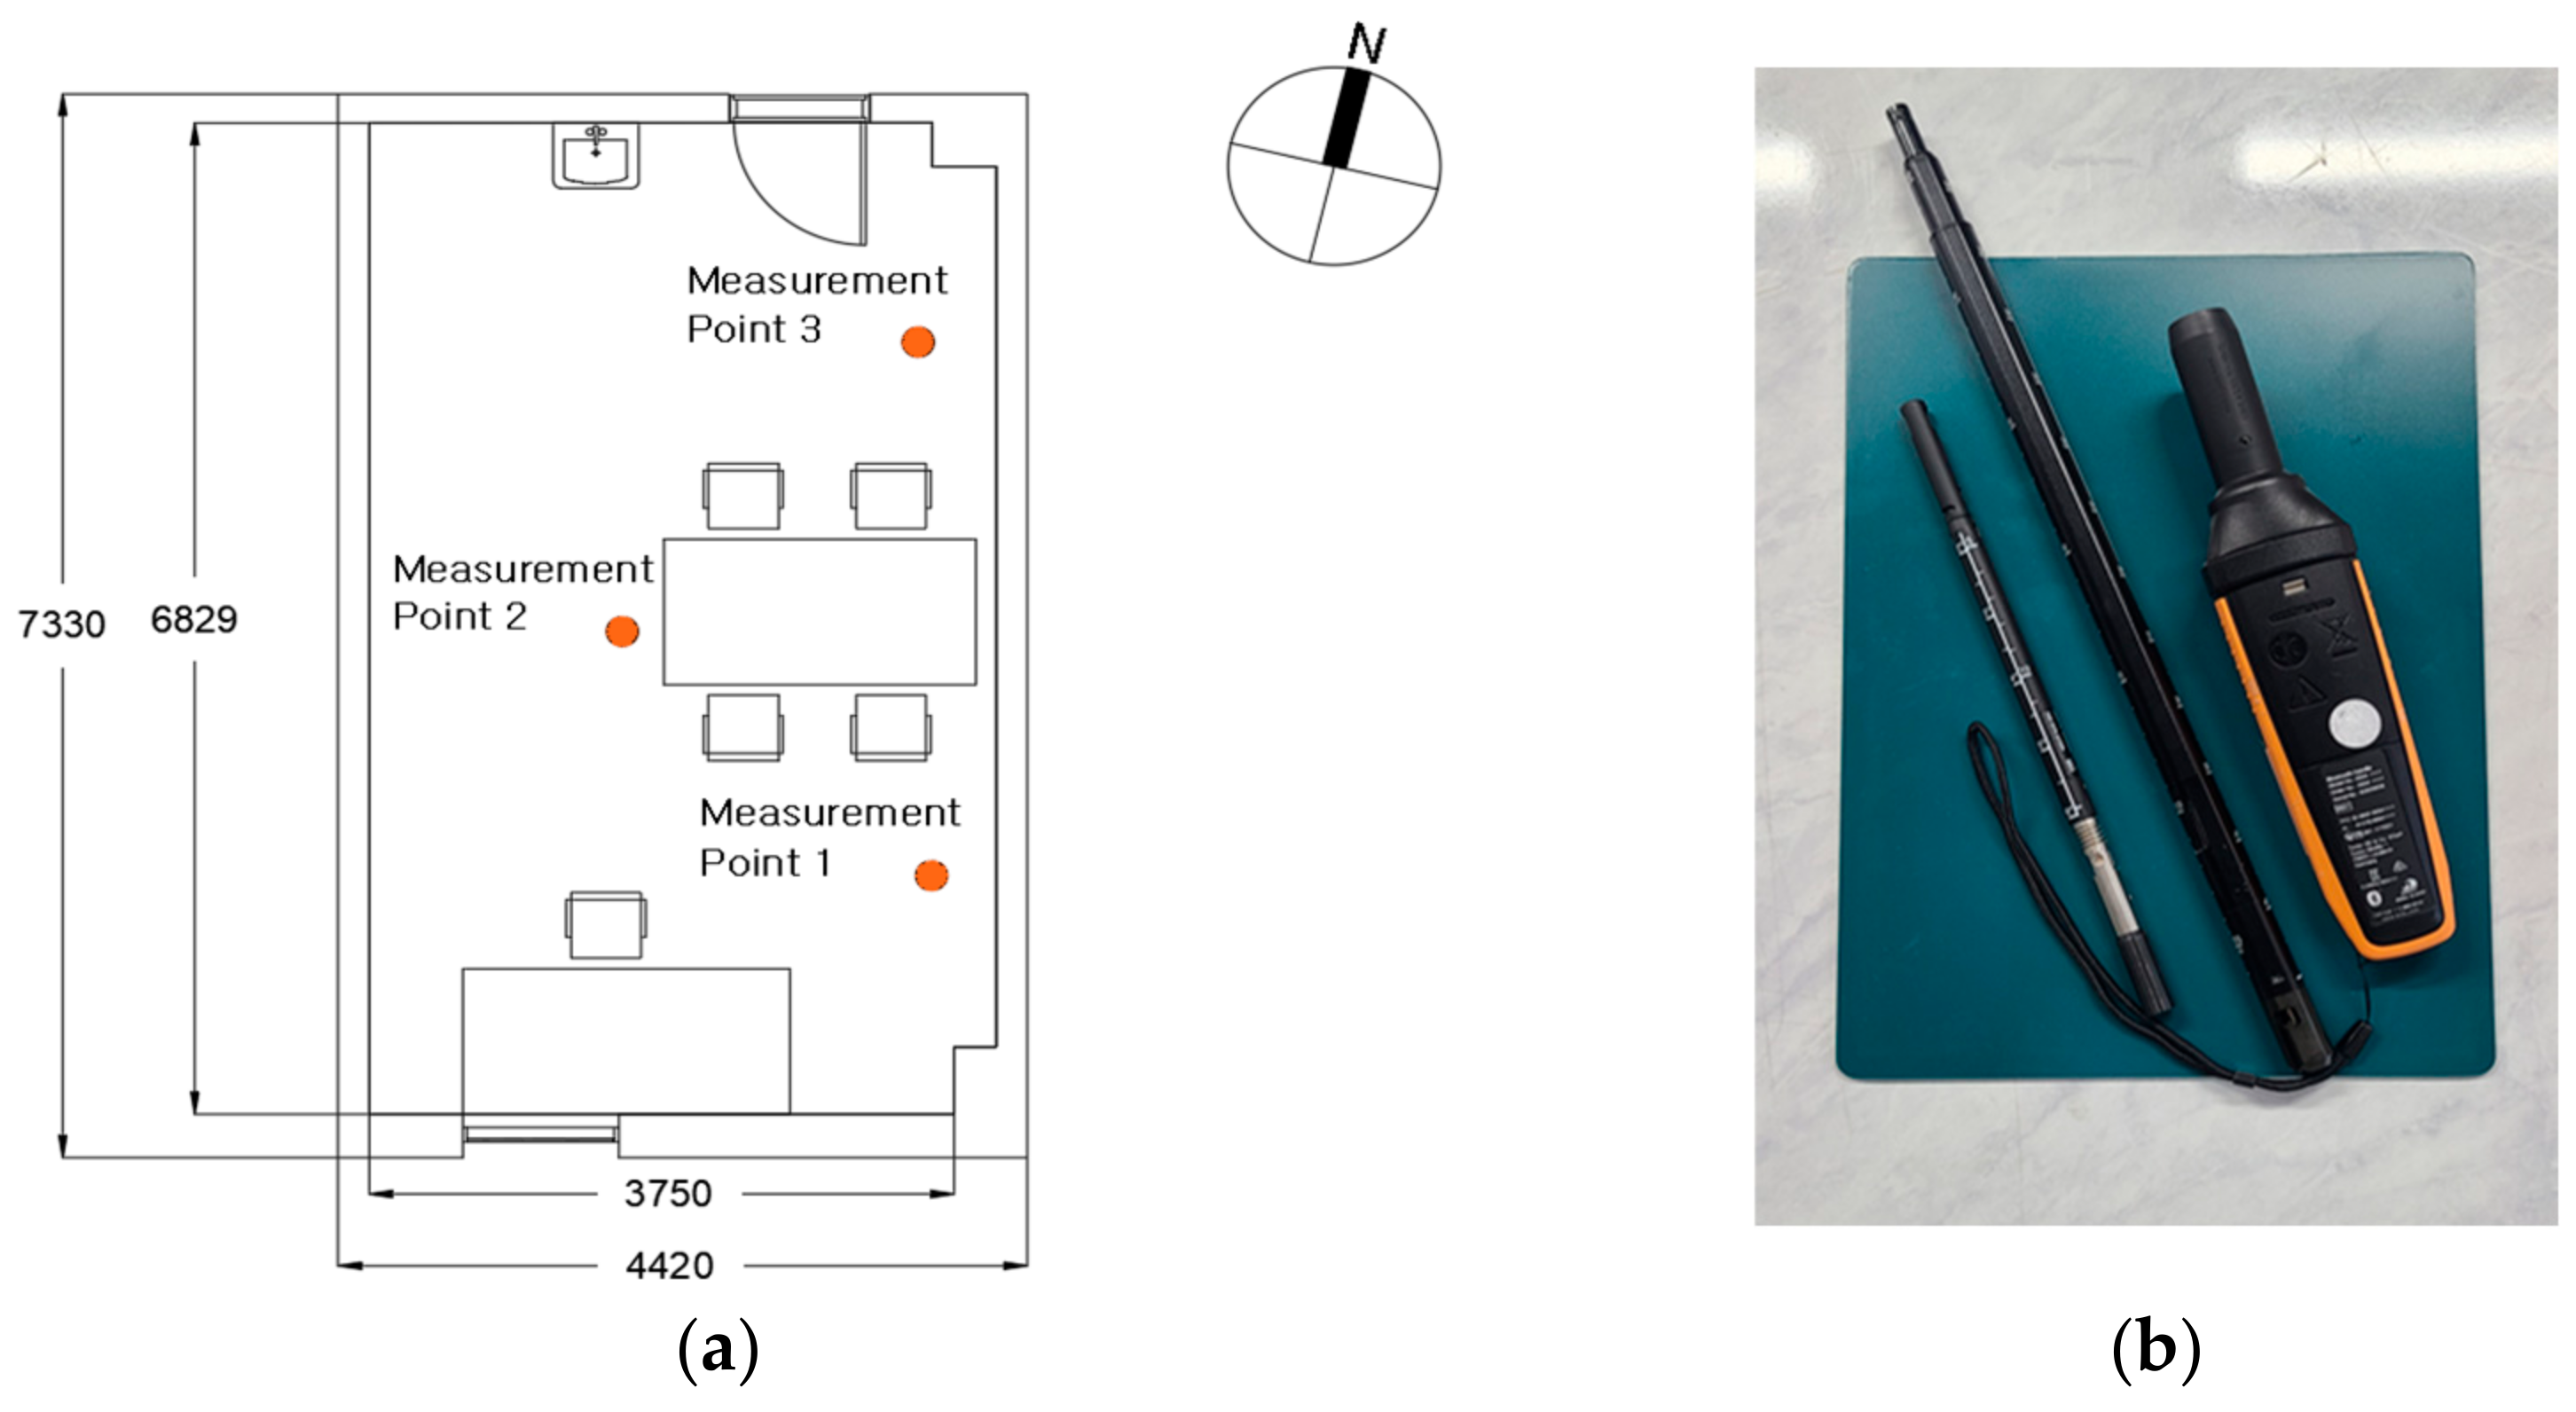
The floor area of the space was approximately 28.10 m2, and the measurement was performed from 9 February to 22 February 2022. As shown in Figure 14a, the measurement of PM2.5 and CO2 was performed at the 1.6 m level in height on three measurement points. The measurement data presented in Figure 13 and Figure 14 represent the average concentrations of the three measurement points.
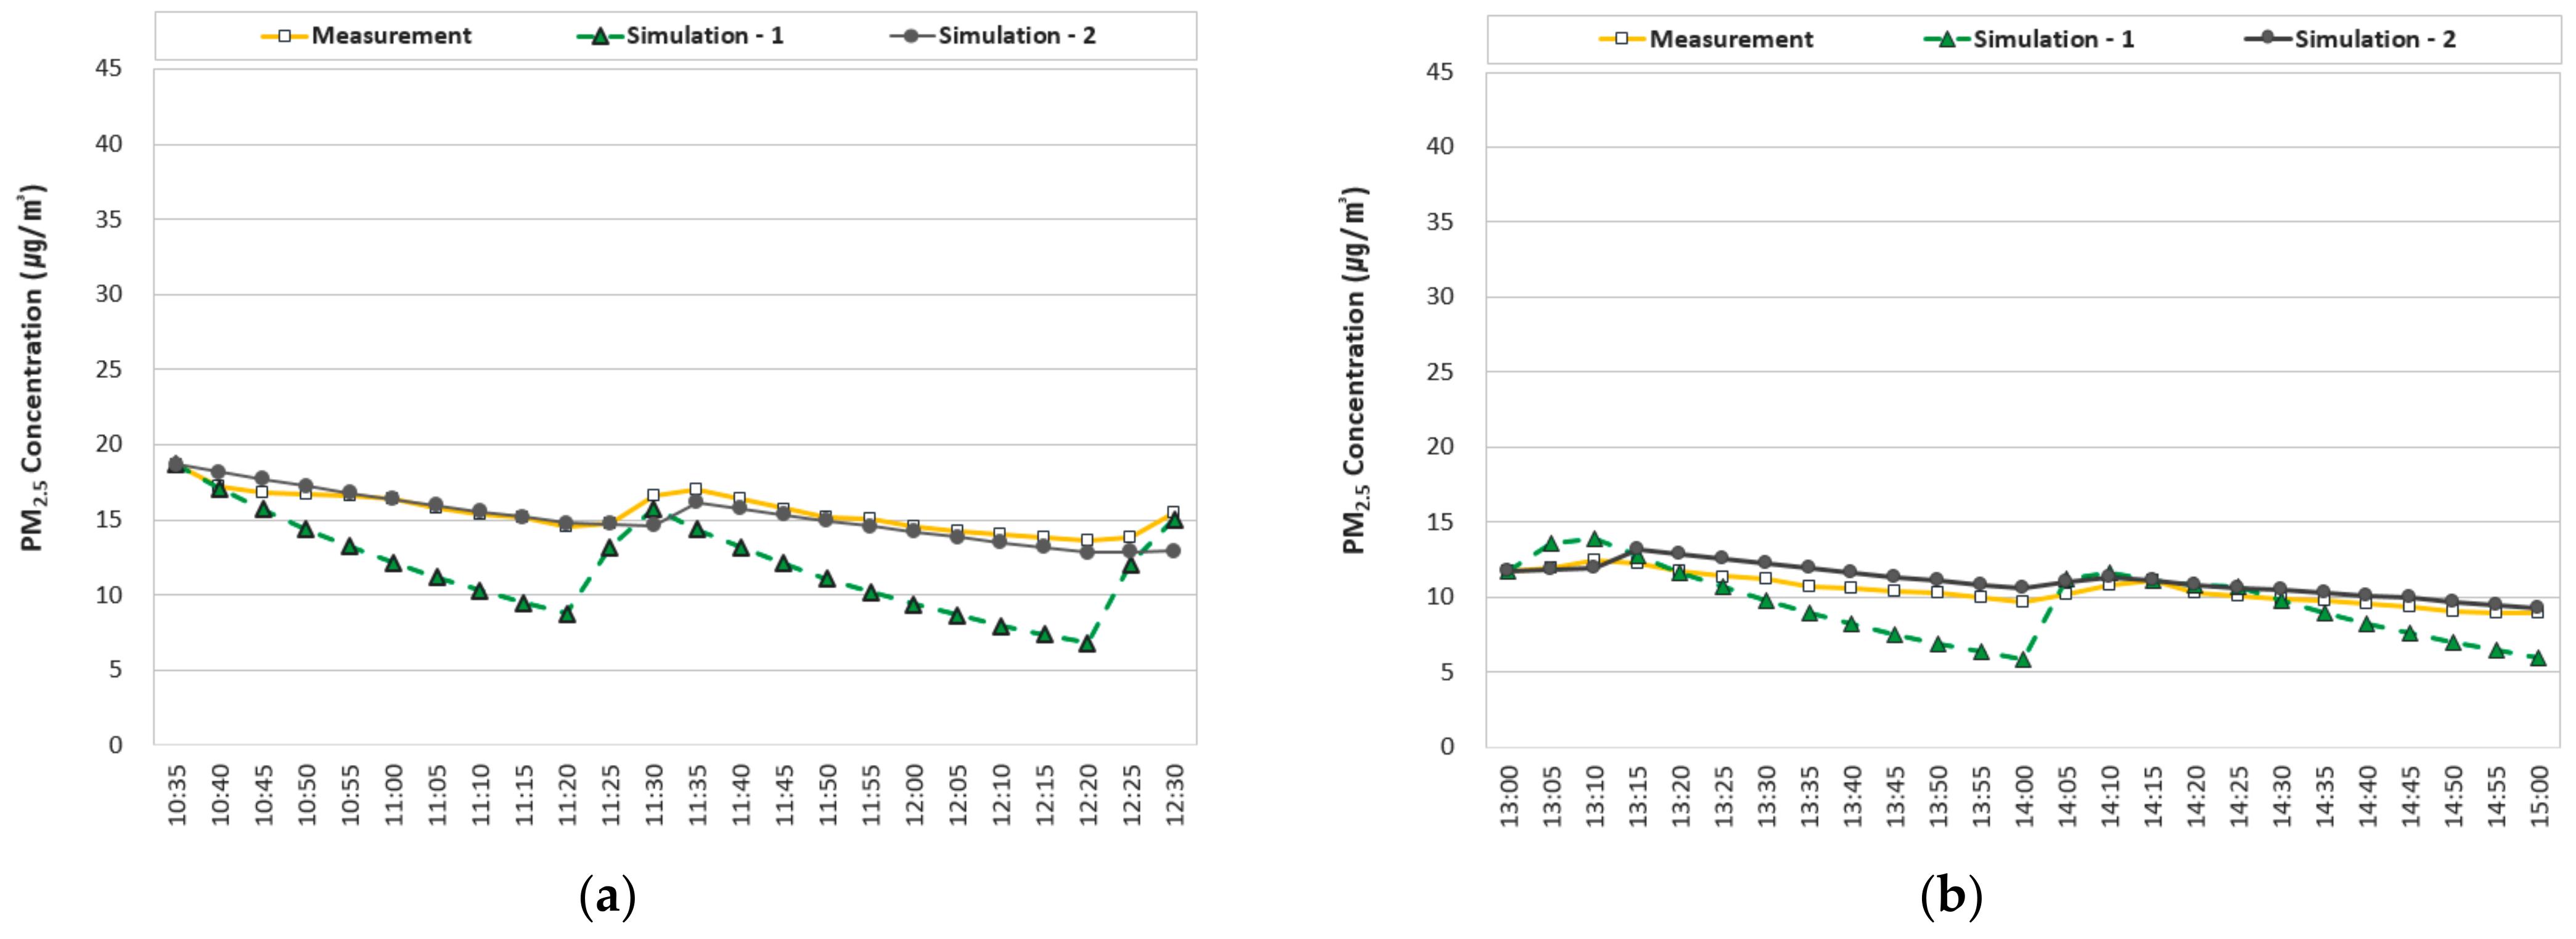
Figure 15 shows the comparison result with PM2.5 data on 15 February, which includes the activities of opening and closing windows during the occupancy of one male adult doing light office work. Simulations 1 and 2 refer to the results before and after correction, respectively.
To ensure the reliability and accuracy of the comparative analysis between the measured data and those from the simple diagnostic program, root mean square error (RMSE) and mean absolute percentage error (MAPE) statistical analyses were conducted to determine the error range [32,59,60,61,62,63].
RMSE (root mean square error) is the most used measure when dealing with the difference between the predicted value and the actual measured value in simulation. MAPE (mean absolute percentage error) is one of the numerical measures that measures the relative proportion of the error to the actual value by dividing the difference between the actual measured value and the predicted value by the actual measured value [32,59,60,61,62,63]. In addition, the RMSE percentage was analyzed for PM2.5 data [32,59].
Table 7 shows the results of RMSE and MAPE assays for PM2.5 concentrations. In Simulation 1 before correction, the wind speed formula for the opening was reflected by setting the difference in air pressure between indoors and outdoors to 0.6 Pa, as shown in Figure 12 [64,65]. As shown, the corrected Simulation 2 represents the results with an average wind speed of 0.08 m/s measured through Testo 400 using the anemometer, as shown in Figure 14b, and with the in-door/outdoor pressure difference set to 0.1 Pa [66,67].
According to the comparison between the PM2.5 measurement results and those from Simulation 1, as shown in Table 7, the average RMSE was 2.92 µg/m3, and the RMSE and MAPE percentages were relatively high at 21.35% and 19.47%, respectively. According to the comparison between the PM2.5 measurement results and those from Simulation 2, the average RMSE was 0.76 µg/m3, and the RMSE and MAPE percentages became 5.84% and 5.15%, respectively, which are much lower than those of Simulation 1.
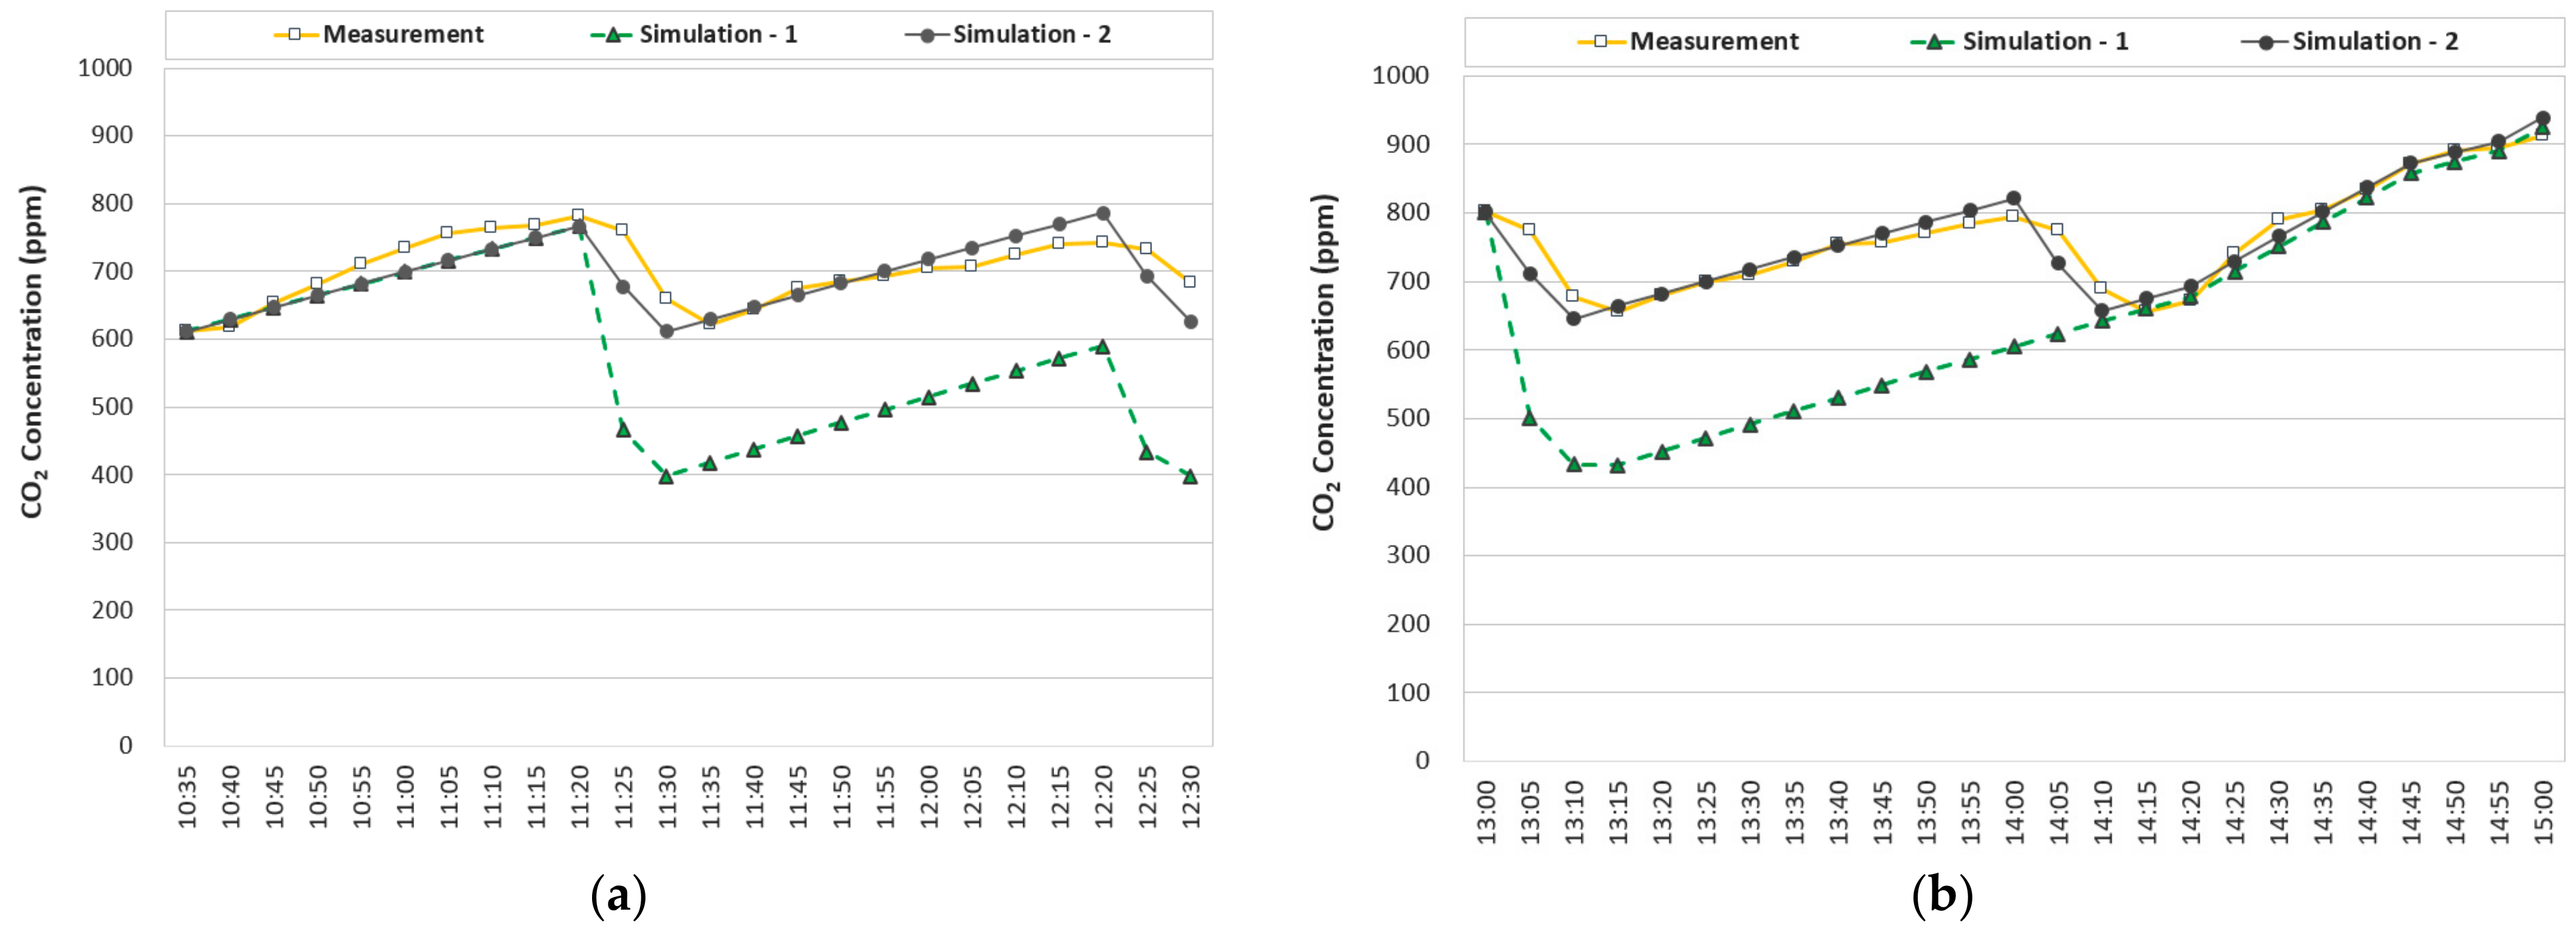
Figure 16 presents the comparison results between the measured data and simulation data for CO2 concentration, displaying Simulation 1, the simulation results before correction, and Simulation 2, those after correction.
Table 8 shows the results from RMSE and MAPE analyses for CO2 concentration. Simulation 1 reflects the wind speed formula through the opening [64], which was obtained by setting the indoor/outdoor pressure difference to 0.6 Pa in consideration of the wind pressure coefficient [65]. Simulation 2 is the result of applying the correction factor of 0.5 to the wind speed formula through the opening [64] and changing the indoor/outdoor pressure difference to 0.1 Pa [66,67].
According to the comparison between the CO2 measurement results and those from Simulation 1, as shown in Table 8, the average RMSE was 154.11 ppm, and the percentages were relatively high at 21.17% and 17.84%, respectively. According to the comparison between the CO2 measurement results and those from Simulation 2, the average RMSE was 25.61 ppm, and the percentages became 3.55% and 2.80%, respectively, which are much lower than those of Simulation 1. The RMSE percentage of Simulation 2 was 17.6% lower than that of Simulation 1, showing better accuracy.
Therefore, this study proposes Simulation 2 as the final program, as its accuracy was shown to be better than that of Simulation 1 through RMSE and MAPE analyses.

6. Discussion

There may be errors in the results from the comparison between the program prediction results and the measured data due to various variables affecting the indoor air quality. Thus, the error range could be reduced by comparing the program prediction results with those from actual measurements of more diverse spaces and by further utilizing the correction factor. In particular, in the case of the PM2.5 category reflected in this study, there are insufficient parts that do not reflect the characteristics of changes in PM2.5 concentration due to occupant activities. Therefore, it is necessary to conduct experiments and corrections related to the characteristics of floating fine dust and deposition according to time.
Furthermore, a deep learning model trained through various interpretations using the actual measurement data, in addition to the actual measurement model, could be utilized to minimize the errors by upgrading the presented program.

7. Conclusions

This study proposed a simple indoor air quality diagnosis program for office spaces and indoor sports facilities, whose utilization has been on the rise in response to high concentrations of outdoor PM and other air pollutants. The program proposed in this study was made with VBA and the Microsoft Excel program, which nonexperts such as teachers and school managers can easily access and utilize to predict indoor air quality. In addition, the necessary information is presented as optional factors (maximum, minimum, median, etc.) in consideration of input factors that are difficult for nonexperts to grasp when predicting indoor air quality.
In particular, the program presented in this study was constructed based on PM2.5 and CO2, and it provides a concentration prediction equation by classifying the influencing factors for each pollutant through analyses of experimental data in various spaces. In addition, to increase the accuracy and reliability of the results of the simple indoor air quality diagnosis program, this study conducted verification through comparative analyses with measured data. The main contents and results of the simple indoor air quality diagnosis program are described below:
  • Prior research was conducted to analyze the influencing factors to be selected for the Input sheet. Among them, the analysis of measurement data from 12 August 2021 confirmed a sharp increase in CO2 concentration. The CO2 concentration of Point 2, an office space with a total floor area of 60.43 m2, increased to a maximum of 860 ppm after 13:30, when the number of occupants rose. From the data results, it was inferred that the number of occupants influenced the increase in indoor CO2 concentration.
  • The input conditions for the simple indoor air quality diagnosis program selected through previous research are as follows. In the program, input conditions for PM2.5 and CO2 were selected as floor area, ceiling height, and effective window area. In addition, in the case of PM2.5 input conditions, 10 categories, including the rate of air changes, outdoor PM2.5 concentration, and adjacent PM2.5 concentration, were additionally included because the PM2.5 concentration is greatly affected by external environmental factors. In the case of CO2 input conditions, eight categories, including the number and age of occupants and activity type, were additionally included because the CO2 concentration is greatly affected by the number and activity of occupants.
  • The simple indoor air quality diagnosis program proposed in this study uses the equation derived using the mass and concentration conservation equation so that PM2.5 and CO2 concentrations can be predicted by the input conditions using Excel. Additionally, the program was configured by inputting the VBA code for each instructional schedule (number of people, hours of use, operation of air purification facilities, etc.) input by the user.
  • To verify the accuracy of the simple indoor air quality diagnosis program, Simulation 1, which contained the program result data, was compared with the measured data. The average RMSE was 2.92 µg/m3, and the RMSE percentage was 21.35% according to the comparative analysis of the PM2.5 concentration of the measured data with those of Simulation 1. The RMSE was 154.11 ppm, and the RMSE percentage was 21.17% according to the comparative analysis of the CO2 concentration of the measured data with those of Simulation 1.
  • In order to improve accuracy, Simulation 2, in which the wind speed and indoor/outdoor air pressure difference are corrected, was presented. The RMSE was 0.76 µg/m3, and the RMSE percentage was 5.84% in the PM2.5 by Simulation 2. In the case of CO2 concentration, the RMSE was 25.61 ppm, and the RMSE percentage was 3.55%.
This study proposes a simple indoor air quality diagnosis program for office and multipurpose activity spaces at schools in the form of Excel VBA, which can be utilized by nonexperts, in place of the CFD program and the air quality measurement method, which are currently the main indoor air quality diagnosis methods. Further studies will be conducted to find a method of reducing the margin of error in consideration of the diversity of both spatial sizes and variables, thereby enhancing user convenience and program accuracy through comparison with various simulations.
In addition, after completing the process of calibrating the program through comparison to various measurement cases, we plan to make this software available in a web network so that it can be easily accessed and used by any experts or nonexperts who are interested in diagnosing and improving the indoor air quality of various spaces.

Author Contributions

Conceptualization, Y.-K.L.; Methodology, Y.-K.L.; Experiment, Y.-K.L.; Software, Y.-K.L., Y.I.K. and G.-H.K.; Verification, Y.I.K.; Formal analysis, Y.-K.L.; Investigation, Y.-K.L.; Resources, Y.-K.L.; Data Curation, Y.-K.L. and G.-H.K.; Writing—Prepare the original draft, Y.-K.L. and G.-H.K.; Writing—Review and Edit, Y.I.K.; Visualization, Y.-K.L.; Director, Y.I.K.; Project Management, Y.I.K.; Funding, Y.-K.L. All authors have read and agreed to the published version of the manuscript.

Funding

This research received no external funding.

Institutional Review Board Statement

Not applicable.

Informed Consent Statement

Not applicable.

Data Availability Statement

Not applicable.

Conflicts of Interest

The authors declare no conflict of interest.

References

  1. Ultrafine Dust Concentration Recorded 18 ug/m3 in 2021, Lowest Since Observation. Ministry of Environment Climate and Carbon Policy Office Press Release. Available online: https://eiec.kdi.re.kr/policy/materialView.do?num=222403&topic=%3Cbr%3E%3Cbr%3E118%ED%9A%8C&pp=20&datecount=&recommend=&pg= (accessed on 18 June 2022).
  2. Fine Dust Season Control. Available online: https://www.air.go.kr/jbmd/sub30.do?tabPage=3 (accessed on 18 June 2022).
  3. World Health Organization. WHO Global Air Quality Guidelines: Particulate Matter (PM2.5 and PM10), Ozone, Nitrogen di-579 Oxide, Sulfur Dioxide and Carbon Monoxide Executive Summary: Platz der Vereinten Nationen 1 D-53113 Bonn; World Health Organization: Geneva, Switzerland, 2021. [Google Scholar]
  4. Ministry of Environment. Presidential Decree No. 32557, Enforcement Decree of the Framework Act on Environmental Policy Attached Table 1 Environmental Standards; Ministry of Environment: Sejong, Korea, 2022.
  5. Ministry of Environment. Ministry of Environment Ordinance No. 918, Enforcement Rule of Indoor Air Quality Management Act Annex 2 Indoor Air Quality Recommendation Criteria; Ministry of Environment, Korea: Sejong, Korea, 2021.
  6. Yeo, M.J.; Kim, Y.P. Trends of the PM10 concentrations and high PM10 concentration cases in Korea. J. Korean Soc. Atmos. Environ. 2019, 35, 249–264. [Google Scholar] [CrossRef]
  7. Lee, S.J.; Kim, S.J.; Park, M.K.; Cho, I.G.; Lee, H.Y.; Choi, S.D. Contamination characteristics of hazardous air pollutants in particulate matter in the atmosphere of Ulsan, Korea. J. Korea Soc. Environ. Anal. 2018, 21, 281–291. [Google Scholar]
  8. Jo, Y.M. School fine dust management—School fine dust sources and inflow paths. Air Clean. Technol. 2019, 32, 1–8. [Google Scholar]
  9. Vohra, K.; Vodonos, A.; Schwartz, J.; Marais, E.A.; Sulprizio, M.P.; Mickley, L.J. Global mortality from outdoor fine particle pollution generated by fossil fuel combustion: Results from GEOS-Chem. Environ. Res. 2021, 195, 110754. [Google Scholar] [CrossRef] [PubMed]
  10. Liu, C.; Chen, R.; Sera, F.; Vicedo-Cabrera, A.M.; Guo, Y.; Tong, S.; Coelho, M.S.; Saldiva, P.H.; Lavigne, E.; Matus, P.; et al. Ambient particulate air pollution and daily mortality in 652 cities. N. Engl. J. Med. 2019, 381, 705–715. [Google Scholar] [CrossRef]
  11. National Health Insurance Ilsan Hospital Research Institute. Analysis of Medical Use and Death Effect on Respiratory Diseases Using Measurement Data of Fine Dust and Ultrafine Dust and National Health Insurance Claim Data (2018-20-020); National Health Insurance Ilsan Hospital Research Institute: Goyang-si, Korea, 2018. [Google Scholar]
  12. Korea Institute for Health and Social Affairs. Operation of An In-Depth Survey System for Public Awareness and Needs in Response to A Low Fertility and Aging Society (2019-05); Korea Institute for Health and Social Affairs: Sejong City, Korea, 2019. [Google Scholar]
  13. Ministry of Environment. High-Concentration Fine Dust Response Manual for the Protection of Vulnerable Groups Such as Children, Students, and Senior Citizens; Ministry of Environment: Sejong, Korea, 2019.
  14. Bennett, W.D.; Zeman, K.L.; Jarabek, A.M. Nasal contribution to breathing and fine particle deposition in children versus adults. J. Toxicol. Environ. Health 2008, 71, 227–237. [Google Scholar] [CrossRef]
  15. Bateson, T.F.; Schwartz, J. Children’s response to air pollutants. J. Toxicol. Environ. Health 2008, 71, 238–343. [Google Scholar] [CrossRef]
  16. Ministry of Education. School Air Purifier Installation and Maintenance Work Guide (Revised Version); Ministry of Education: Sejong City, Korea, 2022.
  17. Seoul Metropolitan Office of Education. 2019 Seoul Metropolitan Office of Education Working Manual for High Concentration Fine Dust Response; Seoul Metropolitan Office of Education: Seoul, Korea, 2019. [Google Scholar]
  18. Ministry of Education. No. 18196, School Health Act; Ministry of Education: Sejong, Korea, 2021.
  19. Nourry, C.; Deruelle, F.; Guinhouya, C.; Baquet, G.; Fabre, C.; Bart, F.; Berthoin, S.; Mucci, P. High-intensity intermittent running training improves pulmonary function and alters exercise breathing pattern in children. Eur. J. Appl. Physiol. 2005, 94, 415–423. [Google Scholar] [CrossRef]
  20. Bernasconi, P.; Bürki, P.; Bührer, A.; Koller, E.A.; Kohl, J. Running training and co-ordination between breathing and running rhythms during aerobic and anaerobic conditions in humans. Eur. J. Appl. Physiol. Occup. Physiol. 1995, 70, 387–393. [Google Scholar] [CrossRef]
  21. Cho, S.H.; Yang, S.H.; Lee, B.H.; Jeong, S.U.; Lee, B.H. Development of the two-zone model to estimate the air quality in indoor environments. J. Environ. Sci. Int. 1998, 7, 745–751. [Google Scholar]
  22. Kim, T.Y. Analysis of contribution ratio of pollutant sources to indoor air quality. Archit. Inst. Korea 2004, 20, 209–216. [Google Scholar]
  23. Chang, T.H.; Cho, H.W. A Study on the ventilation technology for indoor air quality improvement. J. Adv. Mar. Eng. Technol. 2005, 29, 540–551. [Google Scholar]
  24. Kim, W.H.; Kim, J.H.; Lee, S.K. Atrium Ceiling Jet Temperature Prediction Model Comparison. In Proceedings of the Korean Institute of Industrial Safety Conference, 2000; pp. 144–149. Available online: https://koreascience.kr/journal/HOJHAY.1ff8page (accessed on 10 August 2022).
  25. Kim, T.Y.; Lee, Y.G.; Han, K.W. Contribution ration of pollutant source to concentration of room center. Proc. AIK 2003, 23, 809–812. [Google Scholar]
  26. Yoon, S.H.; Park, J.Y.; Son, D.Y.; Choi, Y.H.; Park, K.S. A numerical study of automotive indoor thermal comfort model according to boarding conditions and parameters related to HVAC. Trans. Korean Soc. Mech. Eng. A 2014, 38, 979–988. [Google Scholar] [CrossRef] [Green Version]
  27. Szczepanik-Scislo, N.; Scislo, L. Comparison of CFD and multizone modeling from contaminant migration from a household gas furnace. Atmosphere 2021, 12, 79. [Google Scholar] [CrossRef]
  28. Marques, G.; Ferreira, C.R.; Pitarma, R. Indoor air quality assessment using a CO2 monitoring system based on internet of things. J. Med. Syst. 2019, 43, 67. [Google Scholar] [CrossRef]
  29. Loy-Benitez, J.; Heo, S.; Yoo, C. Soft sensor validation for monitoring and resilient control of sequential subway indoor air quality through memory-gated recurrent neural networks-based autoencoders. Control Eng. Pract. 2020, 97, 104330. [Google Scholar] [CrossRef]
  30. Taheri, S.; Razban, A. Learning-based CO2 concentration prediction: Application to indoor air quality control using demand-controlled ventilation. Build. Environ. 2021, 205, 108164. [Google Scholar] [CrossRef]
  31. Satish, U.; Mendell, M.J.; Shekhar, K.; Hotchi, T.; Sullivan, D.; Streufert, S.; Fisk, W.J. Is CO2 an indoor pollutant? Direct effects of low-to-moderate CO2 concentrations on human decision-making performance. Environ. Health Perspect. 2012, 120, 1671–1677. [Google Scholar] [CrossRef] [Green Version]
  32. Lee, Y.K.; Kim, Y.I.; Lee, W.S. Development of CO2 concentration prediction tool for improving office indoor air quality considering economic cost. Energies 2022, 15, 3232. [Google Scholar] [CrossRef]
  33. Lee, Y.K.; Kim, Y.I. Analysis of indoor air pollutants and guidelines for space and physical activities in multi-purpose activity space of elementary schools. Energies 2021, 15, 220. [Google Scholar] [CrossRef]
  34. Administrative Office, Principal’s Office, Office Definition. Available online: https://namu.wiki/w/%ED%96%89%EC%A0%95%EC%8B%A4 (accessed on 18 June 2022).
  35. Shin, W.S.; Han, K.Y. The study about architectural plan and practical use of multipurpose room of school facilities (auditorium, gymnasium). J. Korean Inst. Educ. Facil. 2004, 11, 5–16. [Google Scholar]
  36. Korean Institute of Educational Environment. Academic Research on School Facility Plan Design Guidelines and Facility Standards Development; Metropolitan Office of Education: Seoul, Korea, 2013. [Google Scholar]
  37. Wang, H.; Karava, P.; Chen, Q. Development of simple semiempirical models for calculating airflow through hopper, awning, and casement windows for single-sided natural ventilation. Energy Build. 2015, 96, 373–384. [Google Scholar] [CrossRef]
  38. Wang, H.; Chen, Q.Y. Modeling of the impact of different window types on single-sided natural ventilation. Energy Procedia 2015, 78, 1549–1555. [Google Scholar] [CrossRef] [Green Version]
  39. Li, C.; Bai, L.; He, Z.; Liu, X.; Xu, X. The effect of air purifiers on the reduction in indoor PM2.5 concentrations and population health improvement. Sustain. Cities Soc. 2021, 75, 103298. [Google Scholar] [CrossRef]
  40. Cooper, E.; Wang, Y.; Stamp, S.; Burman, E.; Mumovic, D. Use of portable air purifiers in homes: Operating behaviour, effect on indoor PM2.5 and perceived indoor air quality. Build. Environ. 2021, 191, 107621. [Google Scholar] [CrossRef]
  41. Liu, S.; Song, R.; Zhang, T.T. Residential building ventilation in situations with outdoor PM2.5 pollution. Build. Environ. 2021, 202, 108040. [Google Scholar] [CrossRef]
  42. Jones, E.R.; Laurent, J.G.C.; Young, A.S.; MacNaughton, P.; Coull, B.A.; Spengler, J.D.; Allen, J.G. The effects of ventilation and filtration on indoor PM2.5 in office buildings in four countries. Build. Environ. 2021, 200, 107975. [Google Scholar] [CrossRef]
  43. Size Korea. 6th Body Size Survey. Available online: https://sizekorea.kr (accessed on 27 December 2021).
  44. Our Neighborhood Air Environment Information, Measurement Data Inquiry. Available online: https://www.airkorea.or.kr/web/realschoolSearch (accessed on 20 June 2022).
  45. National Institute of Environmental Research. 2019 Air Environment Annual Report; Korea Environment Corporation: Sejong, Korea, 2021. [Google Scholar]
  46. Seoul Institute. Introduction of the Fine Dust Season System (2019-PR-17); Korea Environmental Policy Evaluation Institute: Seoul, Korea, 2019. [Google Scholar]
  47. Tran, D.T.; Alleman, L.Y.; Coddeville, P.; Galloo, J.C. Indoor particle dynamics in schools: Determination of air exchange rate, size-resolved particle deposition rate and penetration factor in real-life conditions. Indoor Built Environ. 2015, 26, 1335–1350. [Google Scholar] [CrossRef]
  48. Standard 62.1-2013; Ventilation for Acceptable Indoor Air Quality. ASHRAE: Atlanta, GA, USA, 2013.
  49. Korean Institute of Architectural Sustainable Environment and Building Systems. Building Airtightness Criteria; KIAEBS C-1; KIAEBS: Seoul, Korea, 2013. [Google Scholar]
  50. Yoon, J.H.; Park, J.W.; Lee, K.S.; Baek, N.C.; Shin, U. A study on the measurement of airtightness performance of detached houses in Chung-cheong area. J. Korean Sol. Energy Soc. 2008, 28, 65–71. [Google Scholar]
  51. Korea Ministry of Land, Infrastructure, and Transport. Ordinance of the Ministry of Land, Infrastructure, and Transport No. 882, Regulations on Equipment Standards for Buildings Attached Table 2 Standards for Calculating the Effective Area of Smoke Windows; Korea Ministry of Land, Infrastructure, and Transport: Sejong, Korea, 2021.
  52. Cho, K.; Chae, C.U.; Cho, D.; Kim, T. Changes in fan energy consumption according to filters installed in residential heat recovery ventilators in Korea. Sustainability 2021, 13, 10119. [Google Scholar] [CrossRef]
  53. Chu, Y.; Xu, P.; Yang, Z.; Li, W. Existing building retrofitting for indoor PM2.5 concentration control on smog days: Case study in China. Procedia Eng. 2017, 205, 3222–3227. [Google Scholar] [CrossRef]
  54. Liu, C.; Yang, J.; Ji, S.; Lu, Y.; Wu, P.; Chen, C. Influence of natural ventilation rate on indoor PM2.5 deposition. Build. Environ. 2018, 144, 357–364. [Google Scholar] [CrossRef]
  55. Ansanay-Alex, G. Estimating occupancy using indoor carbon dioxide concentrations only in an office building: A method and qualitative assessment. In Proceedings of the REHVA World Congress on Energy Efficient, Smart and Healthy Buildings (CLIMA), Prague, Czech Republic, 16–19 June 2013. [Google Scholar]
  56. Standard 55-2010; Thermal Environmental Conditions for Human Occupancy. ASHRAE: Atlanta, GA, USA, 2020.
  57. Steven, J.E.; Andrew, K.P. State-of-the-Art Review of CO2 Demand Controlled Ventilation Technology and Application NISTIR 6729; NIST: Gaithersburg, MD, USA, 2015.
  58. Comprehensive Climate Change Monitoring Information. Available online: http://www.climate.go.kr (accessed on 27 December 2021).
  59. Li, J.; Zhang, H.; Chao, C.Y.; Chien, C.H.; Wu, C.Y.; Luo, C.H.; Chen, L.J.; Biswas, P. Integrating low-cost air quality sensor networks with fixed and satellite monitoring systems to study ground-level PM2.5. Atmos. Environ. 2020, 223, 117293. [Google Scholar] [CrossRef]
  60. Kim, S.H.; Han, G.T. A study of indoor air pollution prediction based on LSTM model using fine dust sensor data in kitchen environment. In Proceedings of the Symposium of the Korean Institute of Communications and Information Sciences, Yongpyong, Korea, 5–7 February 2020; pp. 1127–1128. [Google Scholar]
  61. Hong, T.H.; Kim, H.P.; Kim, J.M.; An, J.B.; Kang, H.A.; Hong, J.W.; Yeom, S.K. Development of the indoor fine dust density forecast model using long short term memory. In Proceedings of the 2018 Korea Society of Energy and Climate Change Conference, Yeosu Expo Korea, Yeosu, Korea, 7–9 November 2018; Volume 11, p. 185. [Google Scholar]
  62. Chicco, D.; Warrens, M.J.; Jurman, G. The coefficient of determination R-squared is more informative than SMAPE, MAE, MAPE, MSE and RMSE in regression analysis evaluation. PeerJ Comput. Sci. 2021, 7, e623. [Google Scholar] [CrossRef]
  63. RMSE Definition. Available online: https://en.wikipedia.org/wiki/Root-mean-square_deviation (accessed on 10 August 2022).
  64. Yang, C.; Shi, H.; Yang, X.; Zhao, B. Research on flow resistance characteristics with different window/door opening angles. HVACR Res. 2010, 16, 813–824. [Google Scholar] [CrossRef]
  65. Tsujihara, M.; Imamura, S.; Tanaka, M. Architectural Environment Easily Explained with Pictures. In Moonundang. 2015. Available online: https://www.nottingham.edu.cn/en/study-with-us/undergraduate/courses/prospectus.aspx?id=8ce16932-d427-4889-835a-ef6aaaebac14 (accessed on 10 August 2022).
  66. Shin, M.S.; Kim, H.S.; Hong, J.E.; Jang, D.S. A numerical study for improvement of indoor air quality of apartment house. J. Korean Soc. Environ. Eng. 2009, 31, 521–530. [Google Scholar]
  67. Lee, T.C.; Son, Y.N.; Yoon, S.H. A study on ventilation and heat transfer coefficient of passive ventilation skin. Korean J. Air-Cond. Refrig. Eng. 2012, 24, 679–684. [Google Scholar]
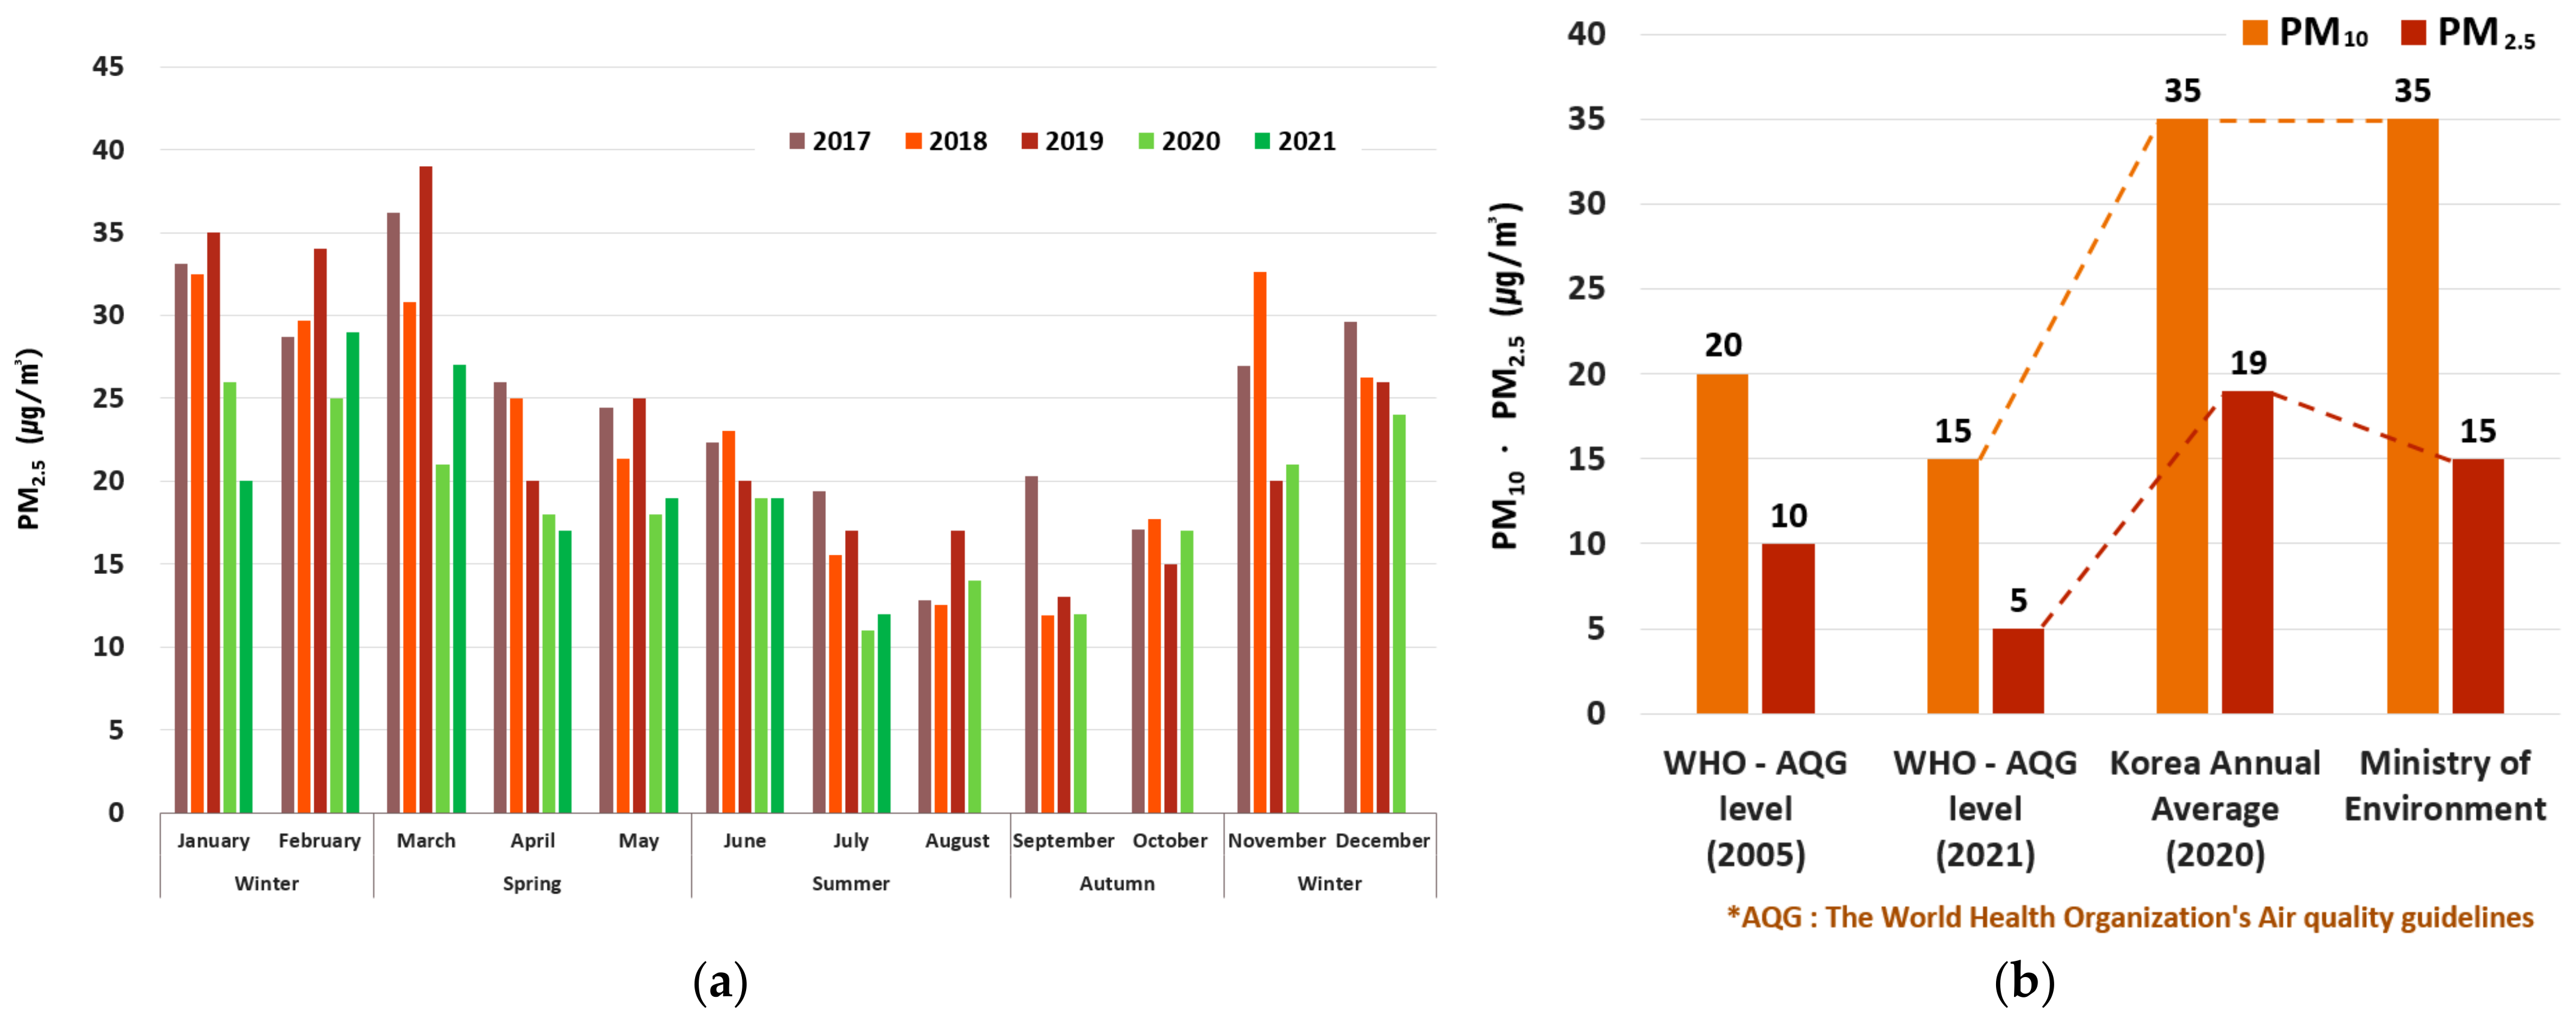
Figure 1. (a) Monthly national average concentrations of PM2.5 in South Korea [3]. (b) PM10 and PM2.5 criteria recommended by the WHO and the Ministry of Environment and average concentrations of PM10 and PM2.5 in South Korea in 2020 [3,4,5].
Energies 15 08134 g001
Figure 3. The research model regarding the indoor air quality diagnosis program for office and multipurpose activity spaces at schools.
Energies 15 08134 g003
Figure 4. Indoor air quality measurement site drawing: (a) a 60.4 m2 office space, (b) a 616.1 m2 multipurpose activity space, and (c) a 48.7 m2 office space.
Energies 15 08134 g004
Figure 5. Photos of indoor air quality measuring devices used: (a) IAQ160, SCD40, and Sensirion SPS30 for the PM2.5 concentration and (b) Testo 400 for the CO2 concentration.
Energies 15 08134 g005
Figure 6. PM2.5 and CO2 indoor air quality test results for a 60.43-m2 office space on 12 August 2021. (a) PM2.5 concentration; (b) CO2 concentration.
Energies 15 08134 g006
Figure 7. PM2.5 and CO2 concentration test results for 616.14 m2 multipurpose activity space on 18 November 2021. (a) PM2.5 concentration. (b) CO2 concentration.
Energies 15 08134 g007
Figure 8. PM2.5 and CO2 concentration test results for a 48.73 m2 office space on 20 August 2020.
Energies 15 08134 g008
Figure 9. Standard deviation analysis results of PM2.5 concentrations in three regions in January 2021 [44,45,46].
Energies 15 08134 g009
Figure 10. Average PM2.5 concentrations by city/province in South Korea and by year from 2018 to 2020 [45].
Energies 15 08134 g010
Figure 11. (a) Program development process by class period using VBA and a macro, a Microsoft Excel development tool. (b) Microsoft Excel development tool, VBA screen.
Energies 15 08134 g011
Figure 12. Input sheet for the simple indoor air quality diagnosis program for office and multipurpose activity spaces at schools.
Energies 15 08134 g012
Figure 13. Result sheet of the simple indoor air quality diagnosis program for office and multipurpose activity spaces at schools.
Energies 15 08134 g013
Figure 14. (a) Indoor air quality test measurement locations in a single-person office space where a validation experiment for the simple diagnostic program was conducted and (b) wind speed measurement device.
Energies 15 08134 g014
Figure 15. PM2.5 data for a single-person office space on 15 February 2022. (a) Morning period. (b) Afternoon period.
Energies 15 08134 g015
Figure 16. CO2 data for a single-person office space on February 15, 2022. (a) Morning period. (b) Afternoon period.
Energies 15 08134 g016
Table 1. Definitions of the functions of office and multipurpose activity spaces.
Space TypeDefinition
OfficeSpace for teachers and school administrators to prepare for class and conduct business
(Examples: principal’s office, teachers’ offices, and administration office)
Multipurpose activitySpace for various classroom activities and school events
(Examples: multipurpose room, auditorium, and indoor gymnasium)
Table 2. Application statuses of air purification facilities in office and multipurpose activity spaces at 10 schools.
Name of SchoolOfficeMultipurpose Activity Space
AXO (Jet fan)
BXX
CXO (Jet fan)
DXO (Jet fan)
EXX
FO (HRV)O (Jet fan)
GO (HRV)O (Jet fan)
HO (ERV)X
IXX
JO (ERV)O (Jet fan)
HRV: Heat Recovery Ventilator. ERV: Energy Recovery Ventilator.
Table 3. Category selection according to the classification of factors affecting changes in PM2.5 concentration.
Large CategoryIntermediate CategorySmall Category
Architectural elementsSpaceFloor area
Ceiling height
Window effective opening area
Door area (indoor/outdoor)
Door area (indoor/adjacent space)
Rate of air changes
Equipment elementsAir purifierNumber of machines
Supply/exhaust air flow rates
Filter type and efficiency
Operation time
Mechanical ventilation systemNumber of machines
Supply/exhaust air volume
Filter type and efficiency
Operation time
Indoor PM2.5 concentration
ExternalOutdoor PM2.5 concentration
Adjacent PM2.5 concentration
Pressure difference (indoor/outdoor)
Pressure difference (indoor/adjacent space)
Table 4. Input conditions for PM2.5 influencing factors.
Small Category (Input Condition)References
Window effective opening area ratio
(Sliding: 0.5/Pivot horizontal: 0.26/Pivot vertical: 0.26/Awning: 0.13/Projected: 0.13)
[37,38,48]
Outdoor PM2.5 concentration
(PM2.5 concentration by city and month)
[45]
Air change per hour
(New school: 0.1/h/Normal school: 0.37/h/Old school: 1/h)
[48,49,50,51]
Air purifier efficiency
(Pre: η = 0.28/Medium: η = 0.59/Hepa: η = 0.98)
[42,52,53]
Table 5. Category selection according to the classification of factors affecting changes in CO2 concentration.
Large CategoryIntermediate CategorySmall Category
Architectural elementsSpaceFloor area
Ceiling height
Window effective opening area
Door area (indoor/outdoor)
Door area (indoor/adjacent space)
Equipment elementsMechanical ventilation systemNumber of machines
Supply/exhaust air flow rate
Operation time
Environmental factorsIndoorRate of air changes
Indoor CO2 concentration
ExternalOutdoor CO2 concentration
Adjacent CO2 concentration
Pressure difference (indoor/outdoor)
Pressure difference (indoor/adjacent space)
Occupant characteristicsNumber of occupants
Age
Activity type
Table 6. Input conditions for factors influencing CO2.
Small Category (Input Condition)References
CO2 emission by occupant
(Calculation of CO2 emissions by age/activity of occupants)
[31,32,33,43,55,56,57]
Outdoor CO2 concentration[58]
Table 7. PM2.5 concentration test and prediction tool RMSE and MAPE results.
PollutantSimulationRMSE (µg/m3)RMSE Percentage (%)MAPE Percentage (%)
PM2.51(a)4.2127.1023.78
1(b)1.6315.5915.15
Average2.9221.3519.47
2(a)0.865.493.82
2(b)0.656.196.48
Average0.765.845.15
Table 8. CO2 concentration test and prediction tool RMSE and MAPE results.
PollutantSimulationRMSE (ppm)RMSE Percentage (%)MAPE Percentage (%)
CO21(a)173.2824.6919.29
1(b)134.9417.6516.38
Average154.1121.1717.84
2(a)32.394.613.48
2(b)18.922.482.11
Average25.613.552.80
Publisher’s Note: MDPI stays neutral with regard to jurisdictional claims in published maps and institutional affiliations.