Abstract
This study explores the effects of hydrothermal carbonization (HTC) on the fuel properties of empty fruit bunches (EFB) by varying the reaction temperatures between the range of 180–300 °C. The improved properties of hydrochars following HTC were achieved by analyzing the changes in the physical and chemical properties of EFB. Moreover, it can save energy during treatment processes, in addition to evaluating the improvement of the biofuel stability based on the equilibrium moisture content and agglomeration. The results showed that the chemical structure of EFB decomposed owing to dehydration and decarboxylation reactions, leading to increased carbon and fixed carbon concentrations in the obtained hydrochar; and thus, an increased calorific value. Hydrochar generated during HTC exhibited chemical properties similar to those of conventional coal fuel. The optimal HTC reaction temperature range was ~230–250 °C. Based on the X-ray fluorescence results, hydrochar produced during HTC had smaller K and Cl contents and a smaller degree of agglomeration than the original sample, indicating that clinker production can be reduced by the HTC of EFB. The results of this study have significance in the utilization of unused waste biomass as an energy source that can replace fossil fuels.
1. Introduction
The annual rate of global energy consumption is rapidly increasing owing to economic development [1,2]. South Korea imports most raw materials for energy production, and a considerable amount of energy is obtained from fossil fuels. The excessive use of fossil fuels causes severe environmental pollution owing to greenhouse gas (GHG) emissions and limited reserves [3,4]. South Korea has been working to reduce carbon dioxide emissions according to GHG reduction targets since 2012 owing to the policy that strives to achieve carbon neutrality by 2050 [5,6]. This typically involves promoting the use of semi-permanent energy sources that can replace fossil fuels [7]. Thus, the interest in energy production using organic waste or biomass has increased, and reviewing the utilization of unused waste biomass is necessary [8].
In Southeast Asian countries, such as Indonesia and Malaysia, large-scale industries that extract oil from palm tree fruits and use it to produce cosmetics and edible palm oil are expanding, leading to the creation of various types of waste biomass. Empty fruit bunches (EFB) account for ~23–25% of biomass waste [9,10]. More than 13,800,000 t of EFB have been generated annually since 2014. EFB are primarily disposed by composting, incineration, and in landfills, whereas untreated EFB are neglected and generate odors or harmful substances, such as methane (CH4) gas, causing various types of environmental pollution [11,12].
EFB contain high concentrations of organic matter and cellulose; and thus, can potentially serve as effective energy sources for fuel [13]. However, similar to the general biomass, EFB also have high moisture and ash contents. Among the inorganic matter in EFB, the high K and Cl contents produce KCl with a low melting point (775 °C) [14]. KCl reacts with SO2 generated during the incineration process to form K2SO4, which has a relatively low melting point compared with other types of inorganic matter [15,16]. K2SO4 leads to clinker formation accompanied by fouling or slagging in the incinerator, thereby degrading the operating efficiency of the incinerator [17].
Several methods proposed to utilize biomass as an energy source include combustion, biochemical conversion, and thermochemical conversions, such as pyrolysis and gasification. Thermochemical energy production methods can be classified into carbonization, pyrolysis, and gasification [18,19].
Among the thermochemical treatment methods, hydrothermal carbonization (HTC) utilizes high-temperature (180–350 °C) and high-pressure (2–10 MPa) subcritical water and has been extensively applied in recent hydrochar production research [8,18,19,20].
The advantages of HTC are as follows: organic matter can be easily decomposed during hydrolysis and pyrolysis reactions under subcritical water conditions, and effective reactions can occur in a lower reaction temperature range of 180–350 °C (compared with 400–500 °C) [21,22]. Previous research indicated the HTC technology has been developed to circumvent the energy-intensive drying step required for the thermal conversion of high-moisture organic feedstocks, such as sludge, livestock manure, slaughterhouse wastes, wood waste, and algal biomass into fuel [8,18,19,20].
Furthermore, HTC requires subcritical water that has a dielectric constant (ε) of 25–35 F/m (80 F/m in standard water at 20 °C and 1 atm) and similar properties to acetonitrile (ε = 37.5), dimethylformamide (ε = 36.7), and acetone (ε = 20.7), the frequently used solvents [23,24]. Under these conditions, the dissolution rate of inorganic matter in the biomass increases, which is expected to reduce clinker generation.
In this study, the physical and chemical properties of EFB were identified based on the HTC reaction temperature, and the effect of HTC on the fuel properties was determined. We also evaluated the improvement of the biofuel stability based on equilibrium moisture content (EMC) through changed chemical structure and agglomeration tests due to changing the inorganic matter component.
2. Materials and Methods
2.1. Empty Fruit Bunches (EFB)
In this study, EFB from Indonesia generated after palm oil production were dried and used for the experiment. Table 1 presents the properties of the EFB sample. Regarding the chemical properties, the carbon and hydrogen contents were 46.05% and 44.5%, respectively; that is, similar to the concentrations of general biomass. The fixed carbon and volatile matter contents were 15.61% and 80.67%, respectively, and the ash content was 3.72%; that is, higher than that of general biomass. The calorific value was 16.5 MJ/kg.

Table 1.
Ultimate and proximate analysis results of EFB according to the HTC temperature.
2.2. Hydrothermal Carbonization (HTC)
To investigate the effect of HTC on the fuel and inorganic matter properties of EFB, we performed HTC using the hydrothermal reactor shown in Figure 1. The reactor has a capacity of 1 L. We mixed 20 g of EFB with water at an EFB: a water ratio of 1:10 to conduct the experiment, which operated under N2 gas. Owing to the low density of EFB, ~60% of the sample was submerged in water. The HTC reaction temperature was set based on the 60 min reaction time after reaching a temperature range of 180–300 °C (15 MPa–90 MPa). During the reaction, the inside of the reactor was stirred at 200 rpm. Solids and liquids in the material generated after the reaction were separated using filter paper (Hyundai Micro, HM, No. 20, 5–8 µm). We then dried the recovered solid (hydrochar) at 105 ± 5 °C and analyzed its properties.
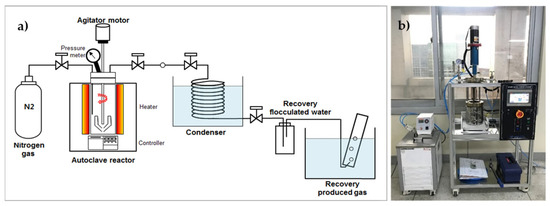
Figure 1.
Lab-scale hydrothermal carbonization reactor: (a) schematic and (b) photograph.
2.3. Analysis of the Chemical Properties of EFB
To determine the properties of the hydrochar obtained after drying, we conducted ultimate, proximate, and calorific value analyses. The ultimate analysis was conducted according to the weight ratio of each element using Flash 2000 Elemental Analyzer (Thermo Fisher Scientific, San Jose, CA, USA). To perform the proximate analysis, we measured the changing weight percentage of volatile matter, fixed carbon, and ash contents using an electric furnace trough; volatile matter is lost at temperatures up to 900 °C under N2, and fixed carbon is burned in the air leaving the ash as a residue following the ASTM procedure. We analyzed the calorific value using a calorimetric analyzer (Parr Model 1341 Plain Jacket Calorimeter, Moline, IL, USA) through EPA Method 5050, which is a calorimetric standard method.
Based on the analyses, the product yield, energy density, and energy recovery efficiency (ERE) were calculated according to the reaction temperature during HTC [18]:
To confirm the surface functional groups of the hydrochar generated during HTC, we carried out analyses in the 4000–450 cm−1 range using a Fourier transform infrared (FTIR) spectrometer (Nicolet 380 FTIR Spectrometer, Thermo Fisher Scientific Inc., Madison, USA). In addition, X-ray fluorescence (XRF) analysis was conducted using the ZSX Primus XRF spectrometer (Rigaku, Japan) to examine the changes in the inorganic matter.
2.4. Equilibrium Moisture Content (EMC) Test
An EMC test was performed for solid fuels, such as coal, to evaluate the stability in the transport and storage stages [25,26]. Herein, the EMC was assessed according to the reaction temperature of the hydrochar generated during the HTC of EFB. The EMC was analyzed using the static desiccator technique and a thermo-hygrostat (HB-150SG, Han Baek Scientific Co., Bucheon, Korea). We set 5 g of the dried sample to a relative humidity of 75% at 40 °C and maintained the hygroscopic conditions for 24 h. The EMC was calculated using the moisture absorption rate of the dried sample through the change in weight under experimental conditions.
2.5. Agglomeration Test
The agglomeration test was performed to evaluate the possibility of fouling, which may occur when EFB are used as fuel. For this purpose, hydrochar (20 g) generated during HTC was placed in a crucible and then, condensed in an electric furnace at 900 and 1000 °C under combustion conditions (air atmosphere at a rate of 1 L/min) for 3 h. After combustion, the product was screened using an automatic sieve separator (<106, 106 to 300, and >300 µm). We conducted all the experiments three times and then, calculated the average value. The equation that was used to calculate the degree of agglomeration is as follows [27]:
where is the ash content with increased particle size and represents the total ash content after the heating reaction.
3. Results and Discussion
3.1. Changes in the Physical and Chemical Properties of EFB Due to HTC
Table 1 presents the changes in the fuel properties of EFB according to the HTC temperature. The ultimate analysis results showed that the carbon content increased from 46.05% to 68.86% as the reaction temperature increased during HTC. In contrast, the hydrogen and oxygen contents decreased from 5.80% and 44.50% to 4.84% and 22.19%, respectively. The proximate analysis results showed that the fixed carbon content increased from 15.61% to 52.11% as the reaction temperature increased, and the volatile matter content decreased from 80.67% to 44.71%. The ash content increased at reaction temperatures >200 °C. However, at all temperatures, the ash content was lower after HTC compared with the original sample. This corresponds with the changes in the inorganic matter content. Because the inorganic matter dissolves in water under HTC conditions, reductions were observed in the inorganic matter content as well as in the total mass.
Figure 2 shows the changes in the fuel ratio and calorific value of EFB after HTC. Based on the fuel ratio calculations (fuel ratio = fixed carbon/volatile matter) using the proximate analysis results, the fuel ratio of raw EFB was 0.19. It increased to 1.17 during HTC and rapidly increased at reaction temperatures above 250 °C. In this temperature range, biomass rapidly decomposed, thereby reducing the volatile matter content. The calorific value increased from 16.5 MJ/kg before HTC to 26.99 MJ/kg as the reaction temperature increased.
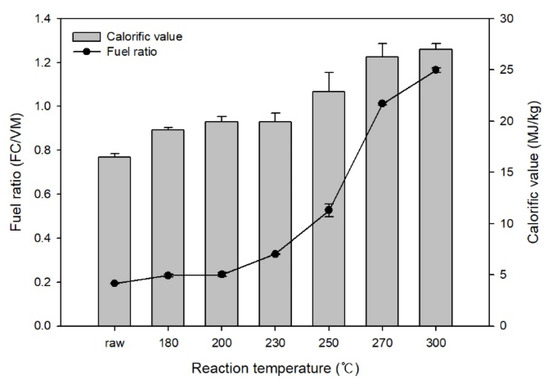
Figure 2.
Effect of hydrothermal carbonization on the calorific value and fuel ratio of EFB.
Figure 3 shows a Van Krevelen diagram comparing the chemical compositions of anthracite, lignite, sub-bituminous coal, and bituminous coal, which are general coal fuels, as well as hydrochar produced during HTC [18,19,20]. Owing to the increase in the carbon content and decrease in the hydrogen and oxygen contents according to the HTC reaction temperature, the atomic H/C and O/C ratios decreased from 1.51 and 0.72 to 0.84 and 0.24, respectively; the values being similar to the average values of coal fuel. These results demonstrate that the fuel properties of EFB improve during HTC.
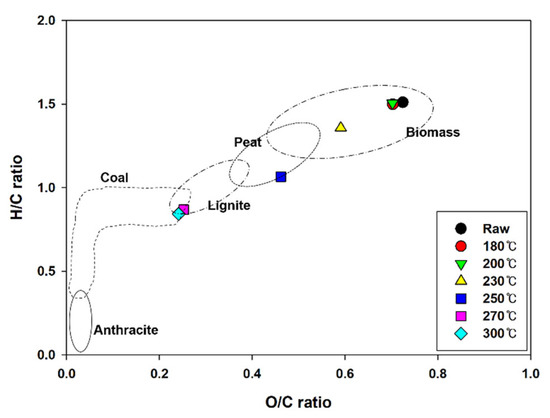
Figure 3.
Van Krevelen diagram of EFB during hydrothermal carbonization at different reaction temperatures.
The FTIR spectra can reportedly identify the organic functional groups due to the HTC reaction [18]. Figure 4 shows the FTIR spectra of raw EFB and the hydrochars through the changing reaction temperatures. The O−H stretching peak (3200–3400 cm−1) appearing in the raw EFB resulted from the hydroxyl and water groups. In the spectra of the HTC products, the intensity of the O−H stretching peak was lower and continued to decrease, although the reaction temperature increased owing to dehydration during HTC. The decreased relative peak intensities at 1608 cm−1 of the C=C bond and 567 cm−1 of the C−H bond in the hydrochar spectra correspond to decreased aromatic structures. The peak intensities appearing at 1033 cm−1 and 1110 cm−1 at approximately 1000−1250 cm−1 of C−O decreased, likely because the C−O band was broken through the decarboxylation reaction of HTC. The peak of carboxylic groups at 1456 cm−1 of C=O also decreased, indicating the conversion of various functional groups through decarboxylation reactions. Moreover, the aliphatic carbon at 2920 cm−1 of −CHx stretching corresponds to the asymmetric and symmetric as −C−H stretching of the methylene groups [28,29]. Consequently, HTC resulted in more aromatic carbon as C−H bonds in the form of CHx functional groups. However, the chemical structures of the biomass changed because of more extensive decomposition at temperatures >250 °C.
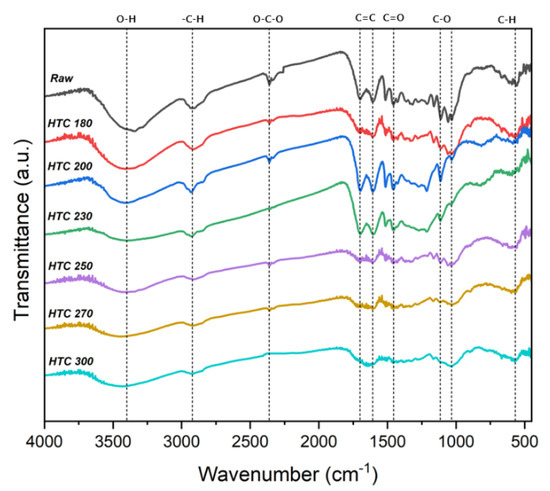
Figure 4.
FTIR spectra of raw and solid products of the hydrothermal carbonization of EFB.
Figure 5 shows the changes in the product yield, energy density, and ERE determined based on previous analysis results. As the HTC reaction temperature increased, the product yield decreased owing to the increase in content changing to the gaseous or liquid phase by pyrolysis. In contrast, as the carbon and fixed carbon contents increased, the energy density increased from 1.16 to 1.64 owing to the increase in the calorific value. Based on the ERE, the optimal HTC reaction temperature for EFB was ~230−250 °C. The fuel quality improved as the temperature increased, whereas the energy consumption rate increased according to the reaction energy, and the amount of fuel that could also be produced decreased. We considered the product yield to propose the optimal temperature of HTC as well as fuel properties. The temperature conditions must be reviewed according to the qualitative form of the energy applied.
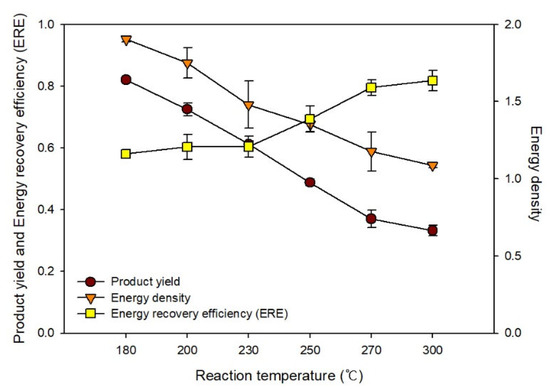
Figure 5.
Changes in the product yield, energy density, and energy recovery efficiency during hydrothermal carbonization.
3.2. Enhanced EMC
Solid biomass fuel generally absorbs moisture during storage at room temperature, which is a problem because this leads to an increased volume and decomposition. Furthermore, as the fuel’s moisture content increases owing to moisture absorption, the lower calorific value decreases, and the basic grade is lowered. Based on an experiment on the change in hygroscopicity (EMC), we confirmed that EFB-based biomass fuel could be improved through treatments such as HTC.
Figure 6 shows the change in the hygroscopicity of solid fuel depending on the changes in the HTC reaction temperature of EFB. At an HTC temperature ≥180 °C, the moisture absorption rate rapidly decreased. At 300 °C, the moisture absorption rate of raw EFB decreased by >70%. The moisture absorption rate sharply decreased at 230 and 250 °C, which represent suitable temperatures for HTC. These sharp drops are likely due to the decrease in the moisture absorption rate due to the removal of the surface hydrophilic groups during the dehydration and decarboxylation reactions during HTC. These results correspond with the FTIR analysis results shown in Figure 4. The hydroxyl group (OH) and carboxyl group (C=O) peaks at 3700−3000 cm−1 and 1800−1600 cm−1, respectively, increased. With the increase in the HTC reaction temperature, the OH and C=O peaks decreased, likely due to the removal of OH and C=O, which are representative hydrophilic groups, owing to the dehydration and decarboxylation reactions [29,30].
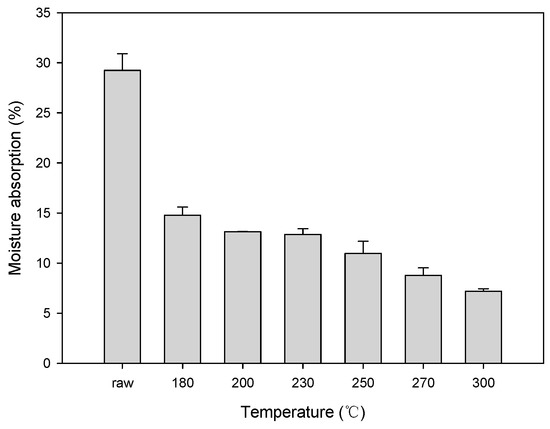
Figure 6.
Hygroscopicity test results obtained after the hydrothermal carbonization of EFB.
3.3. Degree of Agglomeration
The improvement of the fuel properties by performing HTC on EFB can be verified by evaluating the effects of using EFB as fuel. To identify the potential effect of HTC and determine the reduction of clinker, which may occur in combustion furnaces, we conducted an agglomeration test. It is challenging to use EFB as fuel owing to the high ash and inorganic matter contents compared with conventional lignocellulosic biomass. We performed an agglomeration test to determine the effect of HTC on fouling caused by EFB. Figure 7 shows that, when calcined at 900 and 1000 °C, the original sample exhibited a higher degree of agglomeration than the sample subjected to HTC (≥300 µm in size).
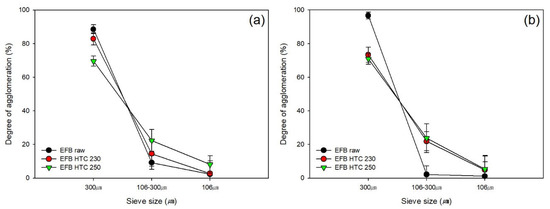
Figure 7.
Degree of agglomeration after the hydrothermal carbonization of EFB at (a) 900 and (b) 1000 °C.
The inorganic matter content during fuel calcination affects clinker generation in incinerators and boilers. KCl generated during the combustion of biomass-based fuel changes to K2SO4 owing to the reaction with SO2, producing clinker accompanied by fouling or slagging, and reducing the combustion system’s efficiency. The XRF analysis results in Table 2 indicate that the K and Cl contents decreased from 62.43% and 4.88% to 11.44% and 1.51%, respectively, as the reaction temperature increased during HTC. These concentration changes were likely due to the dissolution of inorganic matter in the sample in water owing to the change in the dielectric constants (ε) of the subcritical water, a property of HTC. This decrease in the inorganic matter content indicates that the pollution caused by clinker can be reduced. Clinker forms in the combustion reactor, and fouling occurs in the heat exchanger and at the rear end, which reduces its efficiency [31,32].
Table 2.
XRF results obtained after the hydrothermal carbonization of EFB.
4. Conclusions
This study aimed to improve the fuel properties of EFB through HTC. Based on HTC, the chemical structure of EFB decomposed owing to dehydration (hydrolysis) and decarboxylation reactions, thereby increasing the carbon and fixed carbon contents of the hydrochar, and consequently, increasing the calorific value. Based on the Van Krevelen diagram, the position of hydrochar generated during HTC showed chemical properties similar to those of conventional coal fuel with decreasing atomic H/C and O/C ratios. Based on the ERE, the optimal HTC reaction temperature range was ~230−250 °C. Based on the FTIR results, the OH and C=O peaks, which are representative of hydrophilic groups, decreased after the HTC reaction. Owing to these effects, the EMC decreased during HTC. The XRF results indicated that the K and Cl contents, which influence the generation of clinker in the boiler, were reduced in the hydrochar produced during HTC. Furthermore, according to a combustion test of the hydrochar produced during HTC at 900 and 1000 °C, the degree of agglomeration was found to be lower after HTC than that of the raw EFB.
Author Contributions
Conceptualization, K.J., J.L. (Jongwook Lee) and D.K. (Daegi Kim); methodology, D.R., J.L. (Jongkeun Lee), D.K. (Doyong Kim) and D.K. (Daegi Kim); validation, J.L. (Jongkeun Lee), D.K. (Doyong Kim) and D.K. (Daegi Kim); formal analysis, D.R., J.L. (Jongkeun Lee) and D.K. (Doyong Kim); investigation, J.L. (Jongkeun Lee) and D.K. (Doyong Kim); resources, K.J., J.L. (Jongwook Lee) and D.K. (Daegi Kim); data curation, D.R. and J.L. (Jongkeun Lee); writing—original draft preparation, D.R. and J.L. (Jongkeun Lee); writing—review and editing, D.K. (Doyong Kim) and D.K. (Daegi Kim); visualization, K.J. and J.L. (Jongwook Lee); supervision, D.K. (Daegi Kim); project administration, K.J. and D.K. (Daegi Kim); funding acquisition, K.J. and D.K. (Daegi Kim). All authors have read and agreed to the published version of the manuscript.
Funding
This research received no external funding.
Data Availability Statement
Not applicable.
Acknowledgments
This work was supported by the Korea Institute of Planning and Evaluation for Technology in Food, Agriculture, and Forestry (IPET), and Korea Smart Farm R&D Foundation (KosFarm) through Smart Farm Innovation Technology Development Program, funded by the Ministry of Agriculture, Food and Rural Affairs (MAFRA); Ministry of Science and ICT (MSIT); Rural Development Administration (RDA) (421000-00); and the Korea Ministry of Environment as Waste to Energy-Recycling Human Resource Development Project (YL-WE-22-001).
Conflicts of Interest
The authors declare no conflict of interest.
References
- Bilgen, S. Structure and environmental impact of global energy consumption. Renew. Sustain. Energy Rev. 2014, 38, 890–902. [Google Scholar] [CrossRef]
- Muhammad, B.; Khan, M.K.; Khan, M.I.; Khan, S. Impact of foreign direct investment, natural resources, renewable energy consumption, and economic growth on environmental degradation: Evidence from BRICS, developing, developed and global countries. Environ. Sci. Pollut. Res. 2021, 28, 21789–21798. [Google Scholar] [CrossRef] [PubMed]
- Adebayo, T.S.; Awosusi, A.A.; Kirikkaleli, D.; Akinsola, G.D.; Mwamba, M.N. Can CO2 emissions and energy consumption determine the economic performance of South Korea? A time series analysis. Environ. Sci. Pollut. Res. 2021, 28, 38969–38984. [Google Scholar] [CrossRef] [PubMed]
- Kim, H.J.; Park, C.; Nepal, R.; Oh, S.C. Hydrothermal treatment of empty fruit bunches to enhance fuel characteristics. Energies 2021, 14, 1467. [Google Scholar] [CrossRef]
- Oh, H.; Hong, I.; Oh, I. South Korea’s 2050 carbon neutrality policy. East Asian Policy 2021, 13, 33–46. [Google Scholar] [CrossRef]
- Lee, H. Is carbon neutrality feasible for Korean manufacturing firms?: The CO2 emissions performance of the Metafrontier Malmquist-Luenberger index. J. Environ. Manag. 2021, 297, 113235. [Google Scholar] [CrossRef]
- Kumar, G.; Kim, S.H.; Lay, C.H.; Ponnusamy, V.K. Recent developments on alternative fuels, energy and environment for sustainability. Bioresour. Technol. 2020, 317, 124010. [Google Scholar] [CrossRef]
- Jang, E.S.; Ryu, D.Y.; Kim, D. Hydrothermal carbonization improves the quality of biochar derived from livestock manure by removing inorganic matter. Chemosphere 2022, 305, 135391. [Google Scholar] [CrossRef]
- Tan, C.; Saritpongteeraka, K.; Kungsanant, S.; Charnnok, B.; Chaiparapat, S. Low temperature hydrothermal treatment of palm fiber fuel for simultaneous potassium removal, enhanced oil recovery and biogas production. Fuel 2018, 234, 1055–1063. [Google Scholar] [CrossRef]
- Yan, M.; Hantoko, D.; Susanto, H.; Ardy, A.; Waluyo, J.; Weng, Z.; Lin, J. Hydrothermal treatment of empty fruit bunch and its pyrolysis chracteristics. Biomass Convers. Biorefinery 2019, 9, 709–717. [Google Scholar] [CrossRef]
- Ibrahim, M.H.W.; Mangi, S.A.; Zuki, S.S.M.; Jaya, R.P.; Supriyatno, D. Influence of palm oil biomass clinker and empty fruit bunch fibers on concrete properties. IIUM Eng. J. 2020, 21, 100–110. [Google Scholar] [CrossRef]
- Jamari, S.S.; Howse, J.R. The effect of the hydrothermal carbonization process on palm oil empty fruit bunch. Biomass Bioenergy 2012, 47, 82–90. [Google Scholar] [CrossRef]
- Chin, D.W.K.; Lim, S.; Pang, Y.L.; Lim, C.H.; Shuit, S.H.; Lee, K.M.; Chong, C.T. Effects of organic solvents on the organosolv pretreatment of degraded empty fruit bunch for fractionation and lignin removal. Sustainability 2021, 13, 6757. [Google Scholar] [CrossRef]
- Kim, B.; Ryu, C.; Lee, U.; Kim, Y.; Lee, J.; Song, J. A technical review on the protective measures of high temperature corrosion of boiler heat exchangers with additives. Clean Technol. 2017, 23, 223–236. [Google Scholar]
- Rowe, J.J.; Morey, G.W.; Silber, C.C. The ternary system K2SO4-MgSO4-CaSO4. J. Inorg. Nucl. Chem. 1967, 29, 925–942. [Google Scholar] [CrossRef]
- Yazhenskikh, E.; Jantzen, T.; Kobertz, D.; Hack, K.; Mueller, M. Critical thermodynamic evaluation of the binary sub-systems of the core sulphate system Na2SO4–K2SO4–MgSO4–CaSO4. Calphad 2021, 72, 102234. [Google Scholar] [CrossRef]
- Theis, M.; Skrifvars, B.J.; Zevenhoven, M.; Hupa, M.; Tran, H. Fouling tendency of ash resulting from burning mixtures of biofuels. Part 2: Deposit chemistry. Fuel 2006, 85, 1992–2001. [Google Scholar] [CrossRef]
- Kim, D.; Lee, K.; Park, K.Y. Hydrothermal carbonization of anaerobically digested sludge for solid fuel production and energy recovery. Fuel 2014, 130, 120–125. [Google Scholar] [CrossRef]
- Park, K.Y.; Lee, K.; Kim, D. Characterized hydrochar of algal biomass for producing solid fuel through hydrothermal carbonization. Bioresour. Technol. 2018, 258, 119–124. [Google Scholar] [CrossRef]
- Lee, J.; Cho, S.; Kim, D.; Ryu, J.; Lee, K.; Chung, H.; Park, K.Y. Conversion of slaughterhouse wastes to solid fuel using hydrothermal carbonization. Energies 2021, 14, 1768. [Google Scholar] [CrossRef]
- Liu, T.; Liu, Z.; Zheng, Q.; Lang, Q.; Xia, Y.; Peng, N.; Gai, C. Effect of hydrothermal carbonization on migration and environmental risk of heavy metals in sewage sludge during pyrolysis. Bioresour. Technol. 2018, 247, 282–290. [Google Scholar] [CrossRef]
- Olszewski, M.P.; Nicolae, S.A.; Arauzo, P.J.; Titirici, M.M.; Kruse, A. Wet and dry? Influence of hydrothermal carbonization on the pyrolysis of spent grains. J. Clean. Prod. 2020, 260, 121101. [Google Scholar] [CrossRef]
- Giguere, R.J.; Bray, T.L.; Duncan, S.M.; Majetich, G. Application of commercial microwave ovens to organic synthesis. Tetrahedron Lett. 1986, 27, 4945–4948. [Google Scholar] [CrossRef]
- Bach, Q.V.; Skreiberg, Ø. Upgrading biomass fuels via wet torrefaction: A review and comparison with dry torrefaction. Renew. Sustain. Energy Rev. 2016, 54, 665–677. [Google Scholar] [CrossRef]
- Kiranoudis, C.T.; Maroulis, Z.B.; Tsami, E.; Marinos-Kouris, D. Equilibrium moisture content and heat of desorption of some vegetables. J. Food Eng. 1993, 20, 55–74. [Google Scholar] [CrossRef]
- Bellur, S.R.; Coronella, C.J.; Vásquez, V.R. Analysis of biosolids equilibrium moisture and drying. Environ. Prog. Sustain. Energy 2009, 28, 291–298. [Google Scholar] [CrossRef]
- Namkung, H.; Kim, C.H.; Kim, D.; Yuan, X.; Kang, T.J.; Kim, H.T. Effect of bed agglomeration by mineral component with different coal types. J. Energy Inst. 2016, 89, 172–181. [Google Scholar] [CrossRef]
- Liu, Y.; He, Z.; Uchimiya, M. Comparison of biochar formation from various agricultural by-products using FTIR spectroscopy. Mod. Appl. Sci. 2015, 9, 246. [Google Scholar] [CrossRef]
- Reza, M.T.; Uddin, M.H.; Lynam, J.G.; Hoekman, S.K.; Coronella, C.J. Hydrothermal carbonization of loblolly pine: Reaction chemistry and water balance. Biomass Convers. Biorefinery 2014, 4, 311–321. [Google Scholar] [CrossRef]
- He, C.; Giannis, A.; Wang, J.Y. Conversion of sewage sludge to clean solid fuel using hydrothermal carbonization: Hydrochar fuel characteristics and combustion behavior. Appl. Energy 2013, 111, 257–266. [Google Scholar] [CrossRef]
- Chen, I.A.; Juenger, M.C. Incorporation of coal combustion residuals into calcium sulfoaluminate-belite cement clinkers. Cem. Concr. Compos. 2012, 34, 893–902. [Google Scholar] [CrossRef]
- Tripathi, P.; Lakshminarayana, R. Single particle and packed bed combustion characteristics of high ash and high plastic content refuse derived fuel. Fuel 2022, 308, 121983. [Google Scholar] [CrossRef]


Publisher’s Note: MDPI stays neutral with regard to jurisdictional claims in published maps and institutional affiliations. |
© 2022 by the authors. Licensee MDPI, Basel, Switzerland. This article is an open access article distributed under the terms and conditions of the Creative Commons Attribution (CC BY) license (https://creativecommons.org/licenses/by/4.0/).