Abstract
The importance of integrating distributed generation (DG) units into the distribution network (DN) recently developed. To decrease power losses (PL), this article presents a meta-heuristic population-based tangent golden flower pollination algorithm (TGFPA) as an optimization technique for selecting the ideal site for DG. Furthermore, the proposed algorithm also finds the optimal routing configuration for power flow. TGFPA requires very few tuning parameters and is comprised of a golden section and a tangent flight algorithm (TFA). Hence, it is easy to update these parameters to obtain the best values, which provide highly reliable results compared to other existing techniques. In different case studies, the TGFPA’s performance was assessed on four test bus systems: IEEE 33-bus, IEEE 69-bus, IEEE 119-bus, and Indian-52 bus. According to simulation results, TGFPA computes the optimal reconfigured DN embedded along with DG, achieving the goal of minimal power loss.
1. Introduction
Distributed generation (DG) entities are one of the more remarkable technologies for electrical power generation (PG). When compared to traditional ways, these technologies are capable of supplying customers with energy supply solutions that are more cost-effective or eco-friendly environments, as well as distributing improved quality of power (QoP) or dependability. Apart from QoP, DGs are also used to reduce fuel-based pollution caused by the emission of harmful gases. The decentralized form of PG-DG systems decreases the power loss (PL), boosts voltage profile (VP), and enhances the load balance among feeders [1]. Due to its excellent features and benefits, the use of DGs in distribution networks (DN) resulted in a significant revolution in the field of power system (PS) optimization over the last decades. The location of DG in DNs has been increasing prominently in recent times, and is considered one of the important aspects that influences the future of PS [2]. However, it must be noted that the implementation of DG at high penetration levels and energy storage systems (ESS) could introduce certain potential challenges and adverse impacts that affect the stability of DNs.
Furthermore, improper DG unit allocation increases PL, which raises operating and maintenance costs. As a result, identifying and addressing these issues is crucial in order to keep the DN stable and dependable. In this case, an operational study is necessary to determine the ideal position for the deployment of DG in order to minimize PL [3] and improve system stability [4]. The optimum location of DG units increases overall system performance by managing power flow between existing systems. This could enhance the power supply’s dependability and QoP [5].
Recently, DNs were hampered in terms of performance due to issues such as excessive PL and reduced voltage stability, specifically in developing nations. As a result, it is critical to address this issue by strategically positioning DG units of sufficient size in the best possible place. However, it should be remembered that putting DG units in inconvenient locations may increase PL in the system and influence the VP, compromising the DN’s overall performance. Several methodologies for determining the appropriate location and size of DG units have been offered [6]. However, these approaches have more drawbacks that limit their flexibility. These techniques cannot find local optima and often lead to slow convergence. Furthermore, it is also difficult to incorporate all the desired qualities into one technique, and different hybrid models yield different results for the same objective function.
Furthermore, the non-linearities associated with DG entities, such as wind and solar units, complicate long-term system development [7]. This research aims to show that adopting a hybrid or mixture of two or more meta-heuristic optimization approach (MOA) for optimal reconfiguration of a DN integrated with DG units may produce superior outcomes. A novel strategy based on a MOA can be implemented for optimal DN reconfiguration.
Engineers paid close attention to the issue of DG allocation or reconfiguration of DNs [8]. Multiple MOAs have been presented in this regard for determining the ideal position of DG units and feeders. The applications of MOAs gained prominence because of their capability to find an optimal solution with swift computational speed. These algorithms exhibit great potential in solving diversified multiple-objective mathematical optimization problems. MOAs employ an iterative search process for exploitation and exploration in the domain space to achieve an optimal solution for global and local optima. There have been many research investigations into the implementation of MOAs for finding a suitable size and location of DG units. However, most of the conventional MOAs were unsuccessful in achieving the desired performance and converged to a local optimum due to the non-linearity of the DN. This study offers a modified flower pollination method based on the golden section search algorithm (GSA) and tangent flight to solve the distribution problem of DG units in the DN. The GSA can provide local optimal points more accurately in the case of dynamic systems, while the TFA is more robust in finding the global solution through discovering the environment.
Moreover, the proposed algorithm (PA) is adopted if it provides a solution based on the dynamic network, and the network changes its configuration based on the tie switching. Furthermore, the PA identifies which route is more optimal while monitoring the PL in line when the optimal location is determined for DG placement. To further show the novelty of the algorithm, it was stated under a different scenario that might occur due to the bus and line outages (BLO) or faults in DG. This is the first flower pollination algorithm (FPA) study that incorporates golden search and tangent flight. Testing the TGFPA algorithm on IEEE 33-bus, IEEE 69-bus, IEEE 119-bus, and Indian-52 bus test systems proved its efficacy.
The main contributions of this work are:
- After finding a place for DG allocation, the study uses a modified TGFPA to figure out the best way to rearrange things to cut down on PL;
- The TGFPA is completed with fewer parameters, which makes the system less complicated and more reliable;
- The research focuses on branch exchange adaption to increase the reliability of power DNs.
The remainder of the article is structured as follows: Section 2 consists of previous studies on effective DG unit distribution. Section 3 outlines the problem statement that serves as the foundation that describes the recommended research technique, which includes distribution design; Section 4 projects optimization using the TGFPA algorithm. Section 5 focuses on the experimental results and discussion based on typical test bus setups. Finally, Section 6 visualizes the conclusion.
2. Related Works
Many researchers deliberated on the importance of optimal DG placement and reconfiguration problems in DNs [9]. As the demand for QoP, its consumption, and the need for DG increases, there is a need for performance optimization of existing DNs. Recently, the application of different MOAs gained vast significance for optimizing the performance of existing systems such as differential evolution [10], ant lion optimization [11], particle swarm optimization (PSO) [12], teaching–learning-based optimization (TLBO) [13], cuckoo search (CS) [14], equilibrium optimizer [15], and corona-virus herd optimizer [16].
MOA [17] was used to determine the best reconfiguration for renewable DN units. It has been pointed out from two perspectives: minimizing PL in DNs and boosting the profit of renewable energy systems. In this article, the hybrid MOA was planned, which combines a phasor PSO and a gravitational search algorithm to solve the problems of the dynamic nature of renewable DG systems. Similarly, another novel optimization method for reducing PL by optimal placement of DG units was discussed [18]. The hybrid solution integrated two practical grasshopper optimization algorithms and CS algorithms for determining the precise position of DG units in order to improve the flow of power and VP of the feeders while lowering PL. As exposed by numerical analysis and experimental data, the suggested method was performed to ensure that the total PL reduces while the stability of the VP in DN increases [19].
This integration was also used to determine the best location for DG units with varying power factors. A genetic algorithm (GA) was used to reveal the different volumes of power factors before and after the DG unit was installed. The goal function was created by combining the enhancement of the PS-line voltage stability index (LVSI) with system restrictions. The GA’s performance was assessed using the MATLAB simulation tool on the IEEE 14-bus, and the results tested its efficacy [20]. The salp swarm algorithm (SSA) and whale optimization algorithm (WOA) were applied to determine the suitable sizing and positioning of multiple DG units in radial distribution networks (RDN). The primary goal of that work was to reduce aggregated active PL and voltage variation effects. The hybridized TLBO and harmony search algorithm were incorporated at different load penetrating levels for IEEE 33 and IEEE 69-bus systems [21].
Similarly, another hybrid version combining simulated annealing and PSO was utilized for optimal DG sizing only [22]. Minor work was found on integrating DG sizing, DG placement, and DN reconfiguration problems. Henceforth, this work focused on integrating it using a new hybrid algorithm. Multiple MOA, such as the GA [23], were selected for comparative analysis in order to discover the ideal position of DG entities and also reconfigure DNs, such as PSO [24], artificial bee colony (ABC) [25], GSA [26], FPA [27], chaotic flower pollination algorithm (CFPA) [28], fractional chaotic flower pollination algorithm (FCFPA) [29], and golden-search-based flower pollination algorithm (GSFPA).
3. Problem Formulation
The proposed research has an initial goal of developing an efficient optimization approach for selecting an appropriate site for DG entities for an RDN. This research provides a unique method, termed TGFPA, for discovering the ideal position of DG and then reconfiguring the entire network. The goal is intended to reduce active PL. It is validated using IEEE 33-bus [30], IEEE 69-bus [31], IEEE 119-bus [32], and practical Indian 52-bus test systems [33].
3.1. Load Flow Analysis
The reduction in active PL in DNs is critical in determining uninterruptible power. Most DNs plan to install DG units to reduce active PL. The load flow assessment technique [34] to deal with the problem of DG allocation has a major influence on the DN power quality, flexibility, dependability, and accuracy. Hence, the performance of these networks should be optimized using an appropriate optimization algorithm. The potential and accuracy of optimization algorithms are dependent on load flow analysis, which is an important aspect of the PS optimization process. The power flow in the DN is analyzed using a forward sweep approach (FSA) and a backward sweep approach (BSA) in this study, and the resulting solution is utilized to find the ideal position of DG units and then perform reconfiguration [35]. The proposed method could be generalized to all types of smart grids (SG). Henceforth, the practical Indian system is considered to encase its efficiency. When SG is considered, multi-carrier communication could fall under consideration. A protection-based approach might be imported.
3.2. Objective Function (OB)
The OB is intended to decrease active PL [36]. The following is the OB (Equation (1)) defined in this study:
where OB represents the objective function, Ploss represents the active PLs in each node, and ‘n’ represents the total number of nodes. The following Equation (2) is used to calculate active PL:
where Ij is the magnitude of the current measured in amperes and Rj is the resistance measured in ‘ohms’ at each node.
3.3. Operational Constraints (OC)
The OC in Equations (3)–(5) for assessing the VP and PL in the DN are established [37] for mixed integer non-linear programming.
- Voltage and feeder current limit constraints
Vmin ≤ Vi ≤ Vmax
- Feeder current flow should be within the Max limit, which is formulated as follows:
- Power balance constraints (PBC)
4. Proposed Methodology
Recent decades saw significant progress in the development of various MOA techniques. These MOAs are encouraged by the physical comportment of different classes and are incorporated with swarm intelligence and computational intelligence. The MOAs are efficient, flexible, and simple to implement. The proposed research study uses the TGFPA to figure out where feeder connections should go to lower a DN’s PL.
The switching probability governs the local search (LS) and global search (GS) operations in FPA. The switching probability allows pollen to explore and utilize global and local pollination processes. Pollens are allowed to dive into the search space to discover the optimal solution in the global pollination process (GPP), preserving solution diversity. The FPA can tackle complicated problems and outperform other algorithms due to the exploration and exploitation phases. The random occurrence of these two phases depends on the switching probability and, on the other hand, causes the FPA to deviate from the global optimum solution. As a result, in this study, we use a hybrid optimization technique to achieve the most optimal solution in the shortest amount of time in the optimal placement of DG units and reconfigurable networks. The advanced hybrid algorithm is comprised of GSA and TFA in FPA. The optimal LS through individual pollination is achieved through GSA, and the global solution is achieved through tangent flight. In this manner, it can be seen whether the problem has a local optimal point or a global solution, as seen in Figure 1.
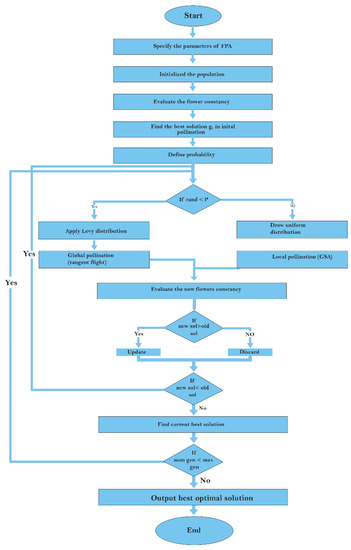
Figure 1.
Flow chart of TGFPA.
4.1. Flower Pollination Algorithm (FPA)
The FPA method presented by [38] is a swarm-based optimization technique motivated by flower genetic reproductive behaviour. Flowers reproduce through a pollination process, wherein the pollen of one flower is transferred to another through pollinators. Self-pollination occurs when a flower reproduces using its pollen or the pollen of other blooms on the same plant. Cross-pollination occurs when pollen is carried over great distances by pollinators. Self-pollination is also known as local pollination, whereas pollination across large distances is known as GPP. In the GPP, the pollen takes more giant steps and exhibits Levy flight behavior. Hence, the mechanism of Levy distribution is employed for achieving GPP [39]. The parameter ‘p’ determines whether the population is formed via self-pollination or cross-pollination when FPA develops a new population. This is accomplished by creating a random variable ranging from 0 to 1 and comparing it to ‘p’, with GPP occurring if the random value is smaller than ‘p’. Agents would walk with a variable step size of length from one bloom to the next for GPP, as approximated by the Levy distribution of flight [36,37] and mathematically stated as Equation (6):
As seen in Equation (7), the new population created by GPP is as follows:
where denotes the pollen i or solution vector ‘xi’ at iteration ‘t’, and ‘g’ represents the best solution for the population in the specific iteration. is a step-size parameter corresponding to the pollination strength and a standard gamma function, and ‘c’ is a scaling factor for adjusting the step size. Local pollination occurs in just a small percentage of the current population. As a result, a uniform distribution determines the “step size”. The mathematical expression (Equation (8)) for such a technique is as follows:
where pollen from separate flowers of the same plant species is embodied as and , respectively.
4.2. Golden Section Search Algorithm
The term “Golden Section” comes from a well-known challenge of precisely separating line segments [26]. The length ‘L’ search space separates the line segment into two sub-segments, L1 and L2, which correspond to major and minor line lengths.
The above Equation (9) can be represented as:
where is the golden ratio; Equation (10) can also be written as:
The solution to Equation (11) is expressed in Equation (12):
The golden section, also known as the ratio of minor and major sub-segments, is the reciprocal of the golden ratio, and is written as follows in Equation (13):
The two separate equation from the search space are shown in Equations (14) and (15):
If [f(X1) f(X2)], the abscissa of the most significant point cannot be less than ‘X1’. Therefore, the range [X1, b] contains the highest value, which is used as the new interval for the next iteration, and vice versa.
4.3. Tangent Flight Algorithm
The primary goal of this study is to create a simple and effective optimization approach. TFA is based on a primary mathematical function called the tangent function (TF) [40]. This function has a lot of exploration capability, and the periodicity and fluctuation between ‘−infinity’ and ‘+infinity’ allow for a nice mix of exploration and intensification. A global step of the form “” drives all motion equations in this technique, where the TF operates similarly to the Levy flight function. It is referred to as a TF for convenience. Most optimization algorithms, such as this, are based on descent from Equation (16).
where a step is the size of the ‘move’, and the direction is identified by ‘d’. Free derivative methods, such as meta-heuristics, use stochastic to converge to global optima, whereas derivative-based methods compute this step using gradient or Hessian information.
Finally, to prevent being caught in a local minimum, the discharge local minima approach is used as a random search agent at each iteration. Just as in other population-based optimization approaches, the TFA begins by generating a random starting population inside the solution space. In the intensification search, tangent flight performs a random local walk led by Equation (17) to replace specific variables in the acquired solution with the values of the following variables in the optimal solution. The fraction of replacement variables in optimization problems with dimensions higher than 4 is equal to 20%, whereas it is equal to 50% with dimensions less than 4. is used to denote the optimal solution at iteration ‘t’.
5. Results and Discussion
In this section, TGFPA is validated and accepted as a point. This technique is executed in MATLAB 2020, and the results are tested. It is validated with the consideration of IEEE 33, IEEE 69, IEEE 119, and the Indian 52-bus system. It has 32 GB of RAM and a 4 GHz Intel Core i7 processor. The proposed technique is designed to reduce the PL of RDNs by optimizing the feeder connections after optimally placing DG units. This optimal network reconfiguration is computed with the help of a new methodology. It is utilized to find the optimal connections of tie switches in RDNs, reducing the PL. It is compared with current approaches such as GA, PSO, ABC, GSA, FPA, CFPA, FCFPA, and GSFPA. The main objective is to enable continuity of power by reducing PL. The proposed methodology is tested with five different cases, which are mentioned as follows:
Case 1: Bus outage (BO): refers to the condition where faults occur, and buses are disconnected;
Case 2: Line outage (LO): occurs mainly due to transmission line faults (asymmetrical and symmetrical);
Case 3: Bus and line outage (BLO): the algorithm is evaluated simultaneously when buses and lines are out of order;
Case 4:DG outage (DGO): in this type of scenario, the DG sources cannot produce the required power as the input to the sources is inefficient. Therefore, the power produced is not pure and contains transients;
Case 5: ESS outage (ESSO): battery sources of ESS are found to be disconnected from the existing system. Each bus system with the proposed technique is validated by applying these cases to the four bus systems. To validate its performance, the different cases are analyzed.
5.1. Performance Analysis of IEEE 33 and 119-Bus System
The IEEE 33-bus system is used to evaluate the performance in five cases. The average active PL is determined to be 284.20 kW. It is reduced with the help of the TGFPA. It is also studied using the IEEE 119-bus system in five scenarios. The system’s total reactive and actual power loads are 17.04 Mvar and 22.70 MW, respectively. The TGFPA helps to reduce the PL. However, network reconfiguration is then served with the help of TGFPA. The TGFPA method is compared with other methods. According to the comparison analysis, it achieves excellent results for decreasing PL.
The system’s PL is initially identified and minimized with DG placement, as shown in Table 1. Further, it is utilized to find optimal feeder connections, as shown in Table 2. This technique achieves first-rate outcomes for reducing the PL from the comparative study.

Table 1.
Optimal DG allocation and sizing for IEEE 33 and119-bus system.
Table 2.
Optimal tie switch connections through reconfiguration in an IEEE 33-bus system.
Table 3 and Table 4 enlist the PL of the IEEE 33-bus and 119-bus systems. Table 3 shows the performance parameters ‘best’, ‘worst’, ‘mean’, and ‘standard deviation’ after evaluating the simulation run 100 times. Different case studies are discussed, and the remedial actions performed by different algorithms are compared. For instance, in case 1 and case 2, the faults at bus 22 and line 11 are considered, and the PL, by adopting a different algorithm, is evaluated and observed. Furthermore, to show the novelty of the algorithm, in case 3, line and bus faults co-occur, and in case 4 and case 5, the DG and ESS at buses 22, 25, 33, and 18 are disconnected due to fault. It is observed that the PA provides a near-optimal solution in less time. With a line outage, the system’s maximum PL is 0.72 p.u. In a BO, BLO, DGO, and ESSO, the system’s PL is 0.8 p.u, 0.72 p.u, 0.8 p.u, and 0.8 p.u, respectively. PL is reduced by selecting the optimal connections of feeders in the PS. Similarly, the maximum PL in the IEEE 119-bus system is 1.7 p.u, with line outage conditions. BO, BLO, DGO, and ESSO conditions indicate the system’s PL as 1.72 p.u, 1.74 p.u, 1.70 p.u, and 1.75 p.u, respectively. According to the outcomes of the experimental study, the proposed method works well in reducing PL. Figure 2a–e validate the power flow occurrences in all cases.
Table 3.
Analysis of PL in IEEE 33-bus system.
Table 4.
Computation of PL in IEEE 119-bus system.
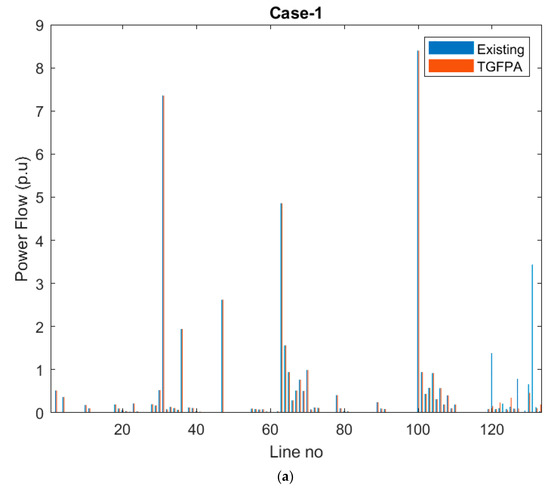
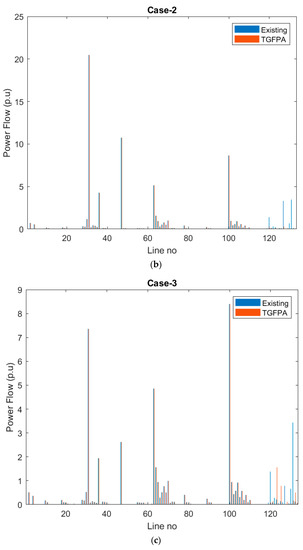
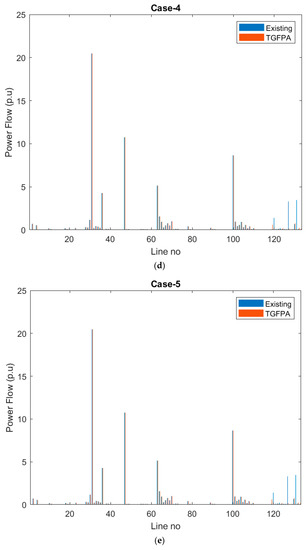
Figure 2.
(a) Power flow Comparison for IEEE 119=bus system during case 1; (b) power flow comparison for IEEE 119 = bus system during case 2; (c) power flow comparison for IEEE 119-bus system during case 3; (d) power flow comparison for IEEE 119-bus system during case 4; (e) power flow comparison for IEEE 119-bus system during case 5.
5.2. Performance Analysis of IEEE 69-Bus System
The performance of TGFPA is examined using the IEEE 69-bus system under five scenarios. The system’s average real PL is 225.5454 kW. Initially, the system’s PL is identified and minimized with DG placement. In the comparative study, TGFPA achieves excellent outcomes for reducing PL. In the event of a line interruption, the system’s maximum PL is 0.48 p.u. Similarly, BO at 60, BLO at 60 and 33, DGO at 35, 45, 65, and ESSO at 27 are considered. Under the recommended method, the system’s PL is 0.53 p.u., 0.52 p.u., 0.53 p.u., and 0.51 p.u., respectively. PL is decreased by determining the best allocation of feeder connections in the PS, and various parameters are observed for comparative analysis among different optimization techniques. Also, as shown in Figure 3, the proposed method obtains the best findings in less time and makes the IEEE 69-bus system less complicated.
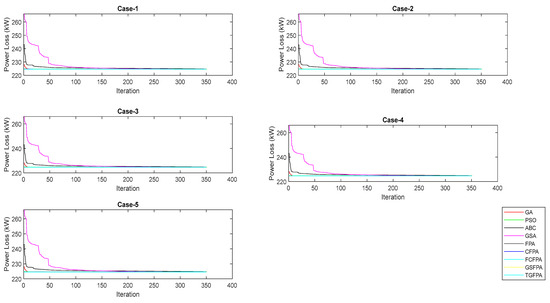
Figure 3.
Comparison between the convergence speeds of all methods and the proposed IEEE 69-bus.
5.3. Performance Analysis of Indian 52 Bus System
From a practical perspective, the performance of the Indian 52 bus system of the smart city network can be assessed in five scenarios. The test system contains 52 buses, 51 branches, and 3 feeders to feed the total network demand. The test system’s power factor is 0.9, which is a lag. The desired test’s base MVA and kV are 1 and 11, respectively. The test system’s bus voltage limitations are 0.9 p.u. and 1.05 p.u. The overall active PL for 52 bus practical distribution systems with DG is 434.7279 kW. The suggested technique helps to decrease the bus system’s PL. At first, the PL in the system is found and dealt with by putting DG units in PS.
Furthermore, the intended method can locate optimal tie switch connections to minimize PL even further by locating the best fit to reroute power flow. The maximum PL of the system is 1.7 p.u, with line outage conditions. Similarly, in BO, BLO, DGO, and ESSO conditions, the system’s PL is 1.02 p.u, 1.1 p.u, 1.05 p.u, and 1.08 p.u, respectively. The system’s average PL is minimized with the aid of the TGFPA. The comparative analysis for different scenarios with the existing state-of-the-art methods is shown in Figure 4, Figure 5, Figure 6, Figure 7 and Figure 8 below, showing that the TGFPA provides a remedial solution with less PL. In the new age of smart cities, where even SGs are advancing, TGFPA offers an actual course of action in less time. As a result, the overall network in a smart city have been provided power without any intrusion. Figure 9 displays how much money the Indian 52 practical bus system saves in terms of a percentage during an outage.
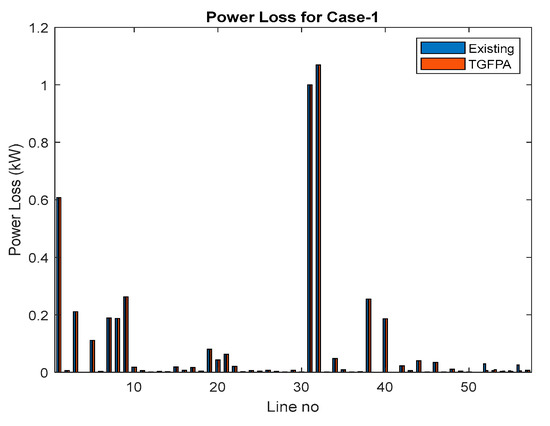
Figure 4.
Comparison of the PL for case 1.
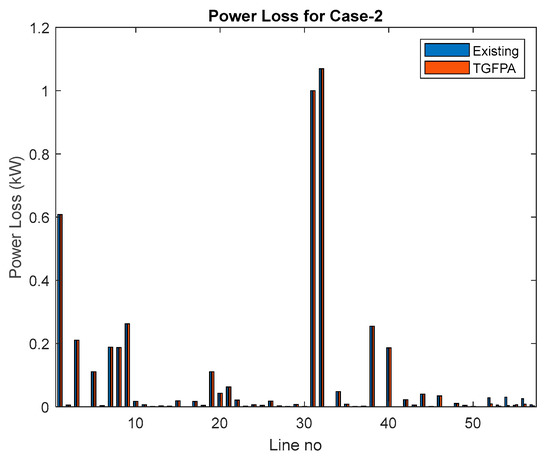
Figure 5.
Comparison of the PL for case 2.
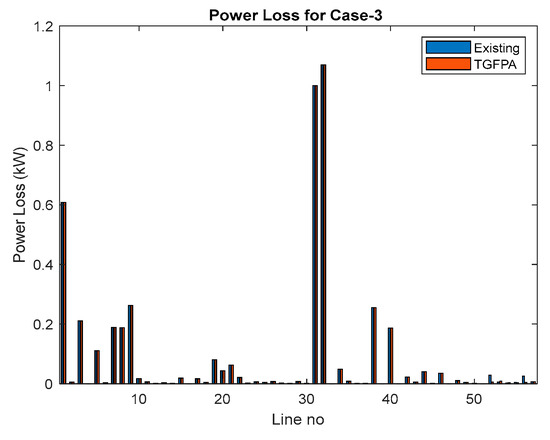
Figure 6.
Comparison of the PL for case 3.
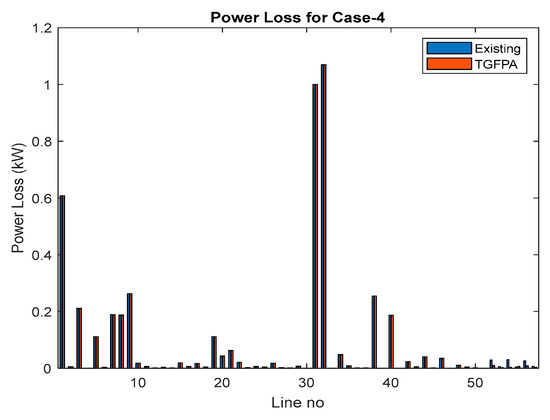
Figure 7.
Comparison of the PL for case 4.
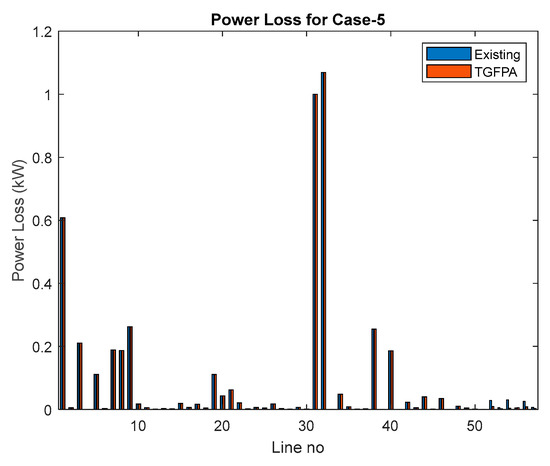
Figure 8.
Comparison of the PL for case 5.
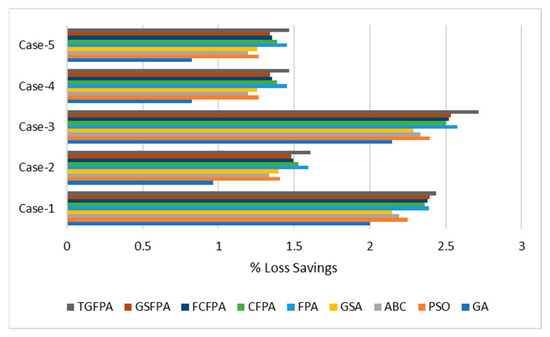
Figure 9.
Percentage loss savings for 5 cases in the Indian 52-bus system.
6. Conclusions
This research defined the optimum reconfiguration problem with actual PL reduction as the objective function. The TGFPA is designed to compute the feeder connections in the RDN after optimally situating the DG to meet the required demand. The proposed technique’s performance is proven with IEEE 33, IEEE 69, IEEE 119, and the Indian 52 practical systems to show the novelty and generalization capability of the proposed algorithm. Furthermore, the method is related to other state-of-the-art optimization algorithms in various case studies, such as bus and line outages, DG, and ESS outage situations. It is discovered that the recommended robust TGFPA algorithm provides a near-optimal solution in less time and lowers PL. The approximation feature of MOA could be enhanced through this hybrid technique called TGFPA, which could be adaptable to additional objectives and capable of coping with larger systems. The results have some excellent features, such as a fair percentage of savings in power loss. It would be an awe-inspiring technique when vehicle-to-grid scheduling is carried out as an aggregator function. Aside from being stable, it could be expanded in future research studies to focus on the best way to use ESS with reconfiguration.
Author Contributions
Conceptualization, A.R.; data curation, A.R.; formal analysis, D.S.; investigation, D.S.; methodology, D.S.; writing—original draft, D.S.; writing—review & editing, D.S. and A.R. All authors have read and agreed to the published version of the manuscript.
Funding
This research work received no external funding.
Institutional Review Board Statement
Not applicable.
Informed Consent Statement
Not applicable.
Data Availability Statement
Not applicable.
Acknowledgments
The authors are grateful to the authorities of Vellore Institute of Technology, Chennai, for rendering this research work successfully.
Conflicts of Interest
The authors declare no conflict of interest.
Nomenclature
| ABC | Artificial bee colony algorithm |
| BLO BO BSA CFPA | Bus and line outage Bus outage Backward sweep approach Chaotic flower pollination algorithm |
| CS | Cuckoo search |
| DG | Distributed generation |
| DGO DN | Distributed generation outage Distribution network |
| ESS | Energy storage system |
| ESSO FCFPA | Energy storage system outage Fractional chaotic flower pollination algorithm |
| FPA | Flower pollination algorithm |
| FSA GA | Forward sweep approach Genetic algorithm |
| GPP GS GSA | Global pollination process Global search Golden section search algorithm |
| GSFPA | Golden-search-based flower pollination algorithm |
| LO LS LVSI MOA | Line outage Local search Line voltage stability index Meta-heuristic optimization algorithms |
| OB OC PA | Objective function Operational constraints Proposed algorithm |
| PBC PG PL | Power balance constraints Power generation Power loss |
| PS | Power system |
| PSO | Particle swarm optimization |
| QoP RDN | Quality of power Radial distribution networks |
| SG SSA | Smart grids Salp swarm algorithm |
| TF TFA | Tangent function Tangent flight algorithm |
| TGFPA | Tangent golden flower pollination algorithm |
| TLBO VP | Teaching–learning-based optimization Voltage profile |
| WOA | Whale optimization algorithm |
References
- Khoubseresht, O.; Shayanfar, H. The Role of Demand Response in Optimal Sizing and Siting of Distribution Energy Resources in Distribution Network with Time-Varying Load: An Analytical Approach. Electr. Power Syst. Res. 2020, 180, 106100. [Google Scholar] [CrossRef]
- Essallah, S.; Khedher, A.; Bouallegue, A. Integration of Distributed Generation in Electrical Grid: Optimal Placement and Sizing under Different Load Conditions. Comput. Electr. Eng. 2019, 79, 106461. [Google Scholar] [CrossRef]
- Pal, A.K.; Chakraborty, A.R. Bhowmik Optimal Placement and Sizing of DG Considering Power and Energy Loss Minimization in Distribution System. Int. J. Electr. Eng. Inform. 2020, 12, 624–653. [Google Scholar]
- Das, S.; Das, D.; Patra, A. Operation of Distribution Network with Optimal Placement and Sizing of Dispatchable DGs and Shunt Capacitors. Renew. Sustain. Energy Rev. 2019, 113, 109219. [Google Scholar] [CrossRef]
- Azam Muhammad, M.; Mokhlis, H.; Naidu, K.; Amin, A.; Fredy Franco, J.; Othman, M. Distribution Network Planning Enhancement via Network Reconfiguration and DG Integration Using Dataset Approach and Water Cycle Algorithm. J. Mod. Power Syst. Clean Energy 2020, 8, 86–93. [Google Scholar] [CrossRef]
- Theo, W.L.; Lim, J.S.; Ho, W.S.; Hashim, H.; Lee, C.T. Review of Distributed Generation (DG) System Planning and Optimisation Techniques: Comparison of Numerical and Mathematical Modelling Methods. Renew. Sustain. Energy Rev. 2017, 67, 531–573. [Google Scholar] [CrossRef]
- Etarhouni, M.; Chong, B.; Zhang, L. A Novel Square Algorithm for Maximising the Output Power from a Partially Shaded Photovoltaic Array System. Optik 2022, 257, 168870. [Google Scholar] [CrossRef]
- Satpathy, P.R.; Aljafari, B.; Thanikanti, S.B. Power Losses Mitigation through Electrical Reconfiguration in Partial Shading Prone Solar PV Arrays. Optik 2022, 259, 168973. [Google Scholar] [CrossRef]
- Anteneh, D.; Khan, B.; Mahela, O.P.; Alhelou, H.H.; Guerrero, J.M. Distribution Network Reliability Enhancement and Power Loss Reduction by Optimal Network Reconfiguration. Comput. Electr. Eng. 2021, 96, 107518. [Google Scholar] [CrossRef]
- Kumar, S.; Mandal, K.K.; Chakraborty, N. A Novel Opposition-Based Tuned-Chaotic Differential Evolution Technique for Techno-Economic Analysis by Optimal Placement of Distributed Generation. Eng. Optim. 2020, 52, 303–324. [Google Scholar] [CrossRef]
- Palanisamy, R.; Muthusamy, S.K. Optimal Siting and Sizing of Multiple Distributed Generation Units in Radial Distribution System Using Ant Lion Optimization Algorithm. J. Electr. Eng. Technol. 2021, 16, 79–89. [Google Scholar] [CrossRef]
- Rezaee Jordehi, A. Particle Swarm Optimisation with Opposition Learning-Based Strategy: An Efficient Optimisation Algorithm for Day-Ahead Scheduling and Reconfiguration in Active Distribution Systems. Soft Comput. 2020, 24, 18573–18590. [Google Scholar] [CrossRef]
- Lotfipour, A.; Afrakhte, H. A Discrete Teaching–Learning-Based Optimization Algorithm to Solve Distribution System Reconfiguration in Presence of Distributed Generation. Int. J. Electr. Power Energy Syst. 2016, 82, 264–273. [Google Scholar] [CrossRef]
- Nguyen, T.T.; Truong, A.V.; Phung, T.A. A Novel Method Based on Adaptive Cuckoo Search for Optimal Network Reconfiguration and Distributed Generation Allocation in Distribution Network. Int. J. Electr. Power Energy Syst. 2016, 78, 801–815. [Google Scholar] [CrossRef]
- Scarabaggio, P.; Carli, R.; Dotoli, M. Noncooperative Equilibrium Seeking in Distributed Energy Systems Under AC Power Flow Nonlinear Constraints. IEEE Trans. Control Netw. Syst. 2022, 1–12. [Google Scholar] [CrossRef]
- Naderipour, A.; Abdullah, A.; Marzbali, M.H.; Arabi Nowdeh, S. An Improved Corona-Virus Herd Immunity Optimizer Algorithm for Network Reconfiguration Based on Fuzzy Multi-Criteria Approach. Expert. Syst. Appl. 2022, 187, 115914. [Google Scholar] [CrossRef]
- Helmi, A.M.; Carli, R.; Dotoli, M.; Ramadan, H.S. Efficient and Sustainable Reconfiguration of Distribution Networks via Metaheuristic Optimization. IEEE Trans. Autom. Sci. Eng. 2022, 19, 82–98. [Google Scholar] [CrossRef]
- Suresh, M.C.V.; Edward, J.B. A Hybrid Algorithm Based Optimal Placement of DG Units for Loss Reduction in the Distribution System. Appl. Soft Comput. 2020, 91, 106191. [Google Scholar] [CrossRef]
- Oudjana, S.H.; Zine, R.; Mosbah, M.; Khattara, A.; Arif, S. Optimal Placement of Distributed Generation Based PV Source in Electrical Power System for LVSI Improvement Using GA Algorithm. In International Conference in Artificial Intelligence in Renewable Energetic Systems; Springer: Cham, Switzerland, 2020; pp. 252–259. [Google Scholar]
- Alzaidi, K.M.S.; Bayat, O.; Uçan, O.N. Multiple DGs for Reducing Total Power Losses in Radial Distribution Systems Using Hybrid WOA-SSA Algorithm. Int. J. Photoenergy 2019, 2019, 2426538. [Google Scholar] [CrossRef]
- Quadri, I.A.; Bhowmick, S. A Hybrid Technique for Simultaneous Network Reconfiguration and Optimal Placement of Distributed Generation Resources. Soft Comput. 2020, 24, 11315–11336. [Google Scholar] [CrossRef]
- Hafez, A.A.; Abdelaziz, A.Y.; Hendy, M.A.; Ali, A.F. Optimal Sizing of Off-Line Microgrid via Hybrid Multi-Objective Simulated Annealing Particle Swarm Optimizer. Comput. Electr. Eng. 2021, 94, 107294. [Google Scholar] [CrossRef]
- Kashyap, M.; Mittal, A.; Kansal, S. Optimal Placement of Distributed Generation Using Genetic Algorithm Approach. In Proceeding of the Second International Conference on Microelectronics, Computing & Communication Systems (MCCS 2017); Springer: Singapore, 2019; pp. 587–597. [Google Scholar]
- Abass, Y.; Abido, M.; Al-Muhaini, M.; Khalid, M. Multi-Objective Optimal DG Sizing and Placement in Distribution Systems Using Particle Swarm Optimization. In Proceedings of the 2019 IEEE Innovative Smart Grid Technologies—Asia (ISGT Asia), Chengdu, China, 21–24 May 2019; pp. 1857–1861. [Google Scholar]
- Das, C.K.; Bass, O.; Kothapalli, G.; Mahmoud, T.S.; Habibi, D. Optimal Placement of Distributed Energy Storage Systems in Distribution Networks Using Artificial Bee Colony Algorithm. Appl. Energy 2018, 232, 212–228. [Google Scholar] [CrossRef]
- Rai, K.; Seksena, S.B.L.; Thakur, A.N. A Comparative Assessment of Genetic and Golden Search Algorithm for Loss Minimization of Induction Motor Drive. In Lecture Notes in Electrical Engineering; Springer: Singapore, 2020; Volume 659, pp. 119–131. [Google Scholar]
- Reddy, P.D.P.; Reddy, V.C.V.; Manohar, T.G. Application of Flower Pollination Algorithm for Optimal Placement and Sizing of Distributed Generation in Distribution Systems. J. Electr. Syst. Inf. Technol. 2016, 3, 14–22. [Google Scholar] [CrossRef]
- Pandya, K.S.; Joshi, S.K. CHAOS Enhanced Flower Pollination Algorithm for Optimal Scheduling of Distributed Energy Resources in Smart Grid. In Proceedings of the 2018 IEEE Innovative Smart Grid Technologies—Asia (ISGT Asia), Singapore, 22–25 May 2018; pp. 705–709. [Google Scholar]
- Yousri, D.; Babu, T.S.; Allam, D.; Ramachandaramurthy, V.K.; Beshr, E.; Eteiba, M.B. Fractional Chaos Maps with Flower Pollination Algorithm for Partial Shading Mitigation of Photovoltaic Systems. Energies 2019, 12, 3548. [Google Scholar] [CrossRef]
- Dharageshwari, K.; Nayanatara, C. Multiobjective Optimal Placement of Multiple Distributed Generations in IEEE 33 Bus Radial System Using Simulated Annealing. In Proceedings of the 2015 International Conference on Circuits, Power and Computing Technologies [ICCPCT-2015], Nagercoil, India, 19–20 March 2015; pp. 1–7. [Google Scholar]
- Prakash, D.B.; Lakshminarayana, C. Multiple DG Placements in Distribution System for Power Loss Reduction Using PSO Algorithm. Procedia Technol. 2016, 25, 785–792. [Google Scholar] [CrossRef]
- Devabalaji, K.R.; Ravi, K. Optimal Size and Siting of Multiple DG and DSTATCOM in Radial Distribution System Using Bacterial Foraging Optimization Algorithm. Ain Shams Eng. J. 2016, 7, 959–971. [Google Scholar] [CrossRef]
- Sabarinath, G.; Manohar, T.G. Application of Bird Swarm Algorithm for Allocation of Distributed Generation in an Indian Practical Distribution Network. Int. J. Intell. Syst. Appl. 2019, 11, 54–61. [Google Scholar] [CrossRef]
- Yao, M.; Molzahn, D.K.; Mathieu, J.L. An Optimal Power-Flow Approach to Improve Power System Voltage Stability Using Demand Response. IEEE Trans. Control Netw. Syst. 2019, 6, 1015–1025. [Google Scholar] [CrossRef]
- Nguyen, T.T.; Nguyen, T.T.; Duong, L.T.; Truong, V.A. An Effective Method to Solve the Problem of Electric Distribution Network Reconfiguration Considering Distributed Generations for Energy Loss Reduction. Neural Comput. Appl. 2021, 33, 1625–1641. [Google Scholar] [CrossRef]
- Raut, U.; Mishra, S. An Improved Sine–Cosine Algorithm for Simultaneous Network Reconfiguration and DG Allocation in Power Distribution Systems. Appl. Soft Comput. 2020, 92, 106293. [Google Scholar] [CrossRef]
- Uniyal, A.; Sarangi, S. Optimal Network Reconfiguration and DG Allocation Using Adaptive Modified Whale Optimization Algorithm Considering Probabilistic Load Flow. Electr. Power Syst. Res. 2021, 192, 106909. [Google Scholar] [CrossRef]
- Yang, X.-S. Flower Pollination Algorithm for Global Optimization. In International Conference on Unconventional Computing and Natural Computation; Springer: Berlin/Heidelberg, Germany, 2012; pp. 240–249. [Google Scholar]
- Pant, S.; Kumar, A.; Ram, M. Flower Pollination Algorithm Development: A State of Art Review. Int. J. Syst. Assur. Eng. Manag. 2017, 8, 1858–1866. [Google Scholar] [CrossRef]
- Layeb, A. Tangent Search Algorithm for Solving Optimization Problems. Neural Comput. Appl. 2022, 34, 8853–8884. [Google Scholar] [CrossRef]


Publisher’s Note: MDPI stays neutral with regard to jurisdictional claims in published maps and institutional affiliations. |
© 2022 by the authors. Licensee MDPI, Basel, Switzerland. This article is an open access article distributed under the terms and conditions of the Creative Commons Attribution (CC BY) license (https://creativecommons.org/licenses/by/4.0/).