Abstract
Semiconductor manufacturing is performed through unit processes that use various chemicals and facilities. In particular, flammable gases, such as H2, NH3, and CH4, are used, and there is a risk of explosion when such gases leak. In this study, computational fluid dynamics (CFD) simulation and a “tracer gas test” according to the SEMI (Semiconductor Equipment and Materials International) S6 Environmental, Health, and Safety Guideline for Exhaust Ventilation of Semiconductor Manufacturing Equipment specification were performed during the leakage of hydrogen, a highly flammable gas used in the etching process of a gas box in the semiconductor industry. The CFD simulation was conducted to investigate the safety of semiconductor production facilities in relation to the explosion risk. Flow analysis was performed for the interior of a gas box used in the etching process. A steady-state analysis was performed to predict the concentration range of the explosion limit in the case of continuous hydrogen gas leakage. The interior of the gas box used in the simulation was modeled, and the ventilation flow rate, which has a significant impact on the leakage gas concentration distribution, obtained from experiments was used. The lower flammability limit (LFL) value of the leaked gas was 4% based on H2, and LFL/4 (25% of the LFL) was analyzed as the explosion limit concentration according to the acceptance criteria of the SEMI S6 tracer gas test. To validate the CFD simulation, a tracer gas test was performed according to SEMI S6. A mixture of hydrogen (5%) and nitrogen (95%) was used as the tracer gas. The flow rate was controlled by a gas regulator valve and measured using an Aalborg mass flow meter. The measured concentration of the tracer gas was calculated using the equivalent release concentration, which was calculated when 100% of the hydrogen was released, and the risk was assessed by comparing it with the LFL/4 of H2.
1. Introduction
Gas leakage has been one of the most troubling problems in the chemical industry, including the semiconductor industry, which uses a variety of toxic chemicals in its processes [1,2,3]. Leaked gases can have harmful effects such as suffocation, explosion, and toxicity, and can cause immediate and irreversible damage to companies, residents, and the environment [1,2,3]. Gas leakage accidents increase social costs with legal issues for recovery and compensation [1]. Gas leakage is related to stress, erosion, and electric arcs [2,3]. Because chemical plants have countless potential leakage points, it is virtually impossible to prevent all gas leakage accidents. Rapid and appropriate action is needed to minimize the damage caused by gas leak accidents [4,5]. Electric machines and appliances with suitable explosion-proof structures should be used in places where flammable materials are manufactured or handled. Article 23 (Honorary Occupational Safety Inspector) of the Occupational Safety and Health Act is a law related to the classification of “explosion hazardous areas,” and the regulation specifies the safety actions that must be taken for facilities, materials, energy, poor working methods, and places where dangers may occur [6]. Article 311 (Selection of Electrical Machines and Appliances Used in Hazardous Areas, etc.) of the related Regulations Regarding Occupational Safety and Health Standards stipulates that “electric machines and appliances with explosion-proof structures for appropriate explosion-proof should be selected and used in explosion hazardous areas due to flammable gases or dust” [7]. The classification of explosions in hazardous areas is stipulated by the international standard IEC 60079-10-1 (Explosive Gas Atmospheres-Classification of Areas), and is affected by leakage classes and ventilation, and divides hazardous explosion areas into Zone 0, Zone 1, Zone 2, and Zone of Negligible Extent (NE) according to the leakage patterns, as shown in Table 1 [8,9,10].

Table 1.
Classification of hazardous explosion areas according to leakage patterns.
A substantial portion of the essential chemical substances used in the semiconductor industry is flammable and subject to the classification of explosion hazardous areas under the Occupational Safety and Health Act. However, semiconductor manufacturing equipment is sufficiently exhausted at all times in preparation for possible cases of leakage, and safety measures are applied, such as automatically shutting off the supply of flammable substances quickly when leakage has been detected through the installation of automatic leakage detection sensors [11]. Owing to such safety devices, mortality events caused by explosions related to the leakage of flammable substances do not occur. As a result, products that are not explosion-proof are supplied and used for semiconductor manufacturing equipment. Nevertheless, whether it is necessary to use explosion-proof products for semiconductor equipment should be determined by assessing the risks when flammable substances used in actual processes have leaked [12,13].
Among previous studies on the assessment of risks in semiconductor processes, Ngai et al. studied the risks of leakage of flammable materials and fire explosions in semiconductor processes through experiments on the leakage from a gas box, ignition, and explosion of silane, which is a combustible substance [14]. Yet-Pole et al. used computational fluid dynamics (CFD) simulations to identify airflow patterns through ventilation when process materials leaked, and examined the leakage locations and leakage speeds in various scenarios to identify the leakage patterns and thermal radiation inside a clean room [15]. Kim conducted flow analysis using CFD simulations when flammable substances leaked from semiconductor gas boxes, to identify the concentration of flammable substances [16]. Xu et al. and Song have developed a method to utilize computational fluid dynamics (CFD) and machine learning for quick and appropriate action [17,18]. Hanna et al. and Shen et al. developed a technique utilizing computational fluid dynamics (CFD) and combining machine learning technique for better emergency response to chemical accidents [19,20]. Song studied an encoding-prediction network that can predict spatio-temporal dispersion when process materials leak inside the gas xox in various layouts of semiconductor manufacturing facilities [21]. Kim et al. conducted a gas tracking experiment for flammable substances according to SEMI S6 standards, and determined the level of exhaust performance of semiconductor manufacturing facilities by selecting the range of hazardous explosion areas [22].
In this study, the concentration of process materials in a gas box when they are leaked was analyzed through a tracer gas test according to SEMI S6. A tracer gas test is an experiment conducted to evaluate the performance of an exhaust system for semiconductor manufacturing equipment by analyzing the gas leakage and concentration. The risk was also evaluated through CFD simulation under the same conditions as the tracer gas test. It is to verify whether the gas concentration with the flammable gas leak scenario is within flammable range or not so as to develop further prevention techniques such as explosion-proof designs.
2. Risk Assessment Method
2.1. SEMI S6 (Tracer Gas Test) Assessment
The SEMI S6 safety guidelines stipulate safety performance standards and test methods to assess the conformity of exhaust gas ventilation of semiconductor manufacturing equipment [23]. Assuming a gas leakage situation, a gas mixed with a 95% concentration of nitrogen and 5% concentration of hydrogen was discharged in the actual amount of emission at the expected leakage point in the gas box. Then, the sample collected at the potential ignition point was analyzed using a gas detector. The analyzed hydrogen concentration was converted into the concentration of the actual process chemical using the equivalent release concentration (ERC) and compared with the lower flammability limit (LFL). The detailed tracer gas test procedure involves the following 10 steps [24].
STEP 1: Determination of representative chemical.
STEP 2: Determination of tracer gas leakage rate.
STEP 3: Determination of gas leakage location and potential ignition source.
STEP 4: Measurement of the ventilation hole rate and pressure.
STEP 5: Installation of a leaking tube and subsequent sealing of the enclosure.
STEP 6: Measurement of the pressure inside the gas box.
STEP 7: Tracer gas leakage.
STEP 8: Sample analysis after stabilization of the concentration.
STEP 9: Result analysis.
STEP 10: Issuance of assessment report.
Figure 1 shows the schematic of the injection manifold.
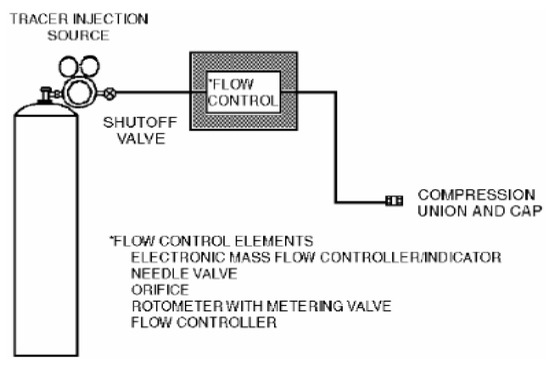
Figure 1.
Schematic of the injection manifold.
The hazard index (hazard index = LFL (ppm)/concentration (%)) values of the materials used in the semiconductor process were compared to select the material with the lowest value as the representative material. The tracer gas leakage rate was calculated using the leakage rate of the process pressure supplied to the gas box, and the parts with the possibility of leakage, such as piping, were selected. The duct traverse method, which is used to calculate the average value, was used to measure the rate and pressure of the ventilation hole. Thereafter, the gas box was sealed and the tracer gas was intentionally leaked. Because the process gas used in actual semiconductor manufacturing equipment is dangerous for direct use in testing, a gas mixture of H2 5% and N2 95% was used as the tracer gas. Gas mixed with H2 5% and N2 95% is classified as a noncombustible material on the Material Safety Data Sheet, and the concentration can be analyzed using a detector in the range appropriate for testing. The flow rate of the tracer gas was controlled with a gas regulator valve and leaked through flexible 0.25″ OD polypropylene tubing. Thereafter, the tracer gas concentration was analyzed using a multi-gas detector. The ERC was used to convert the measured concentration into the process concentration used in actuality.
where the process gas concentration (%) is the concentration of the material used in the actual process, the measured tracer gas concentration (ppm) is the concentration measured in the tracer gas experiment, and the injected tracer gas concentration (%) is the H2 concentration of the tracer gas. The tracer gas leak rate was determined to be 40 L/min considering only one scenario owing to time constraints. Five sampling locations that can be ignition sources, namely, FMS (Flow Management System), cable box, pressure gauge, PSW (Pressure Switch) connector, and MFC (Mass Flow Controller), were selected. The static pressure of the ventilation duct of the gas box was −68.8 Pa, and the measured value of the internal exhaust rate was 1.7 m3/min. The volume of the gas box used in the semiconductor process was approximately 0.1 m3 (0.48 m × 0.88 m × 0.24 m). The parameters used in the tracer gas test are listed in Table 2.
ERC = (Measured tracer gas conc.) × (Process gas conc.)/(Injected tracer gas conc.)
Table 2.
Parameters used in the tracer gas test.
2.2. Concentration Analysis Using CFD Simulation
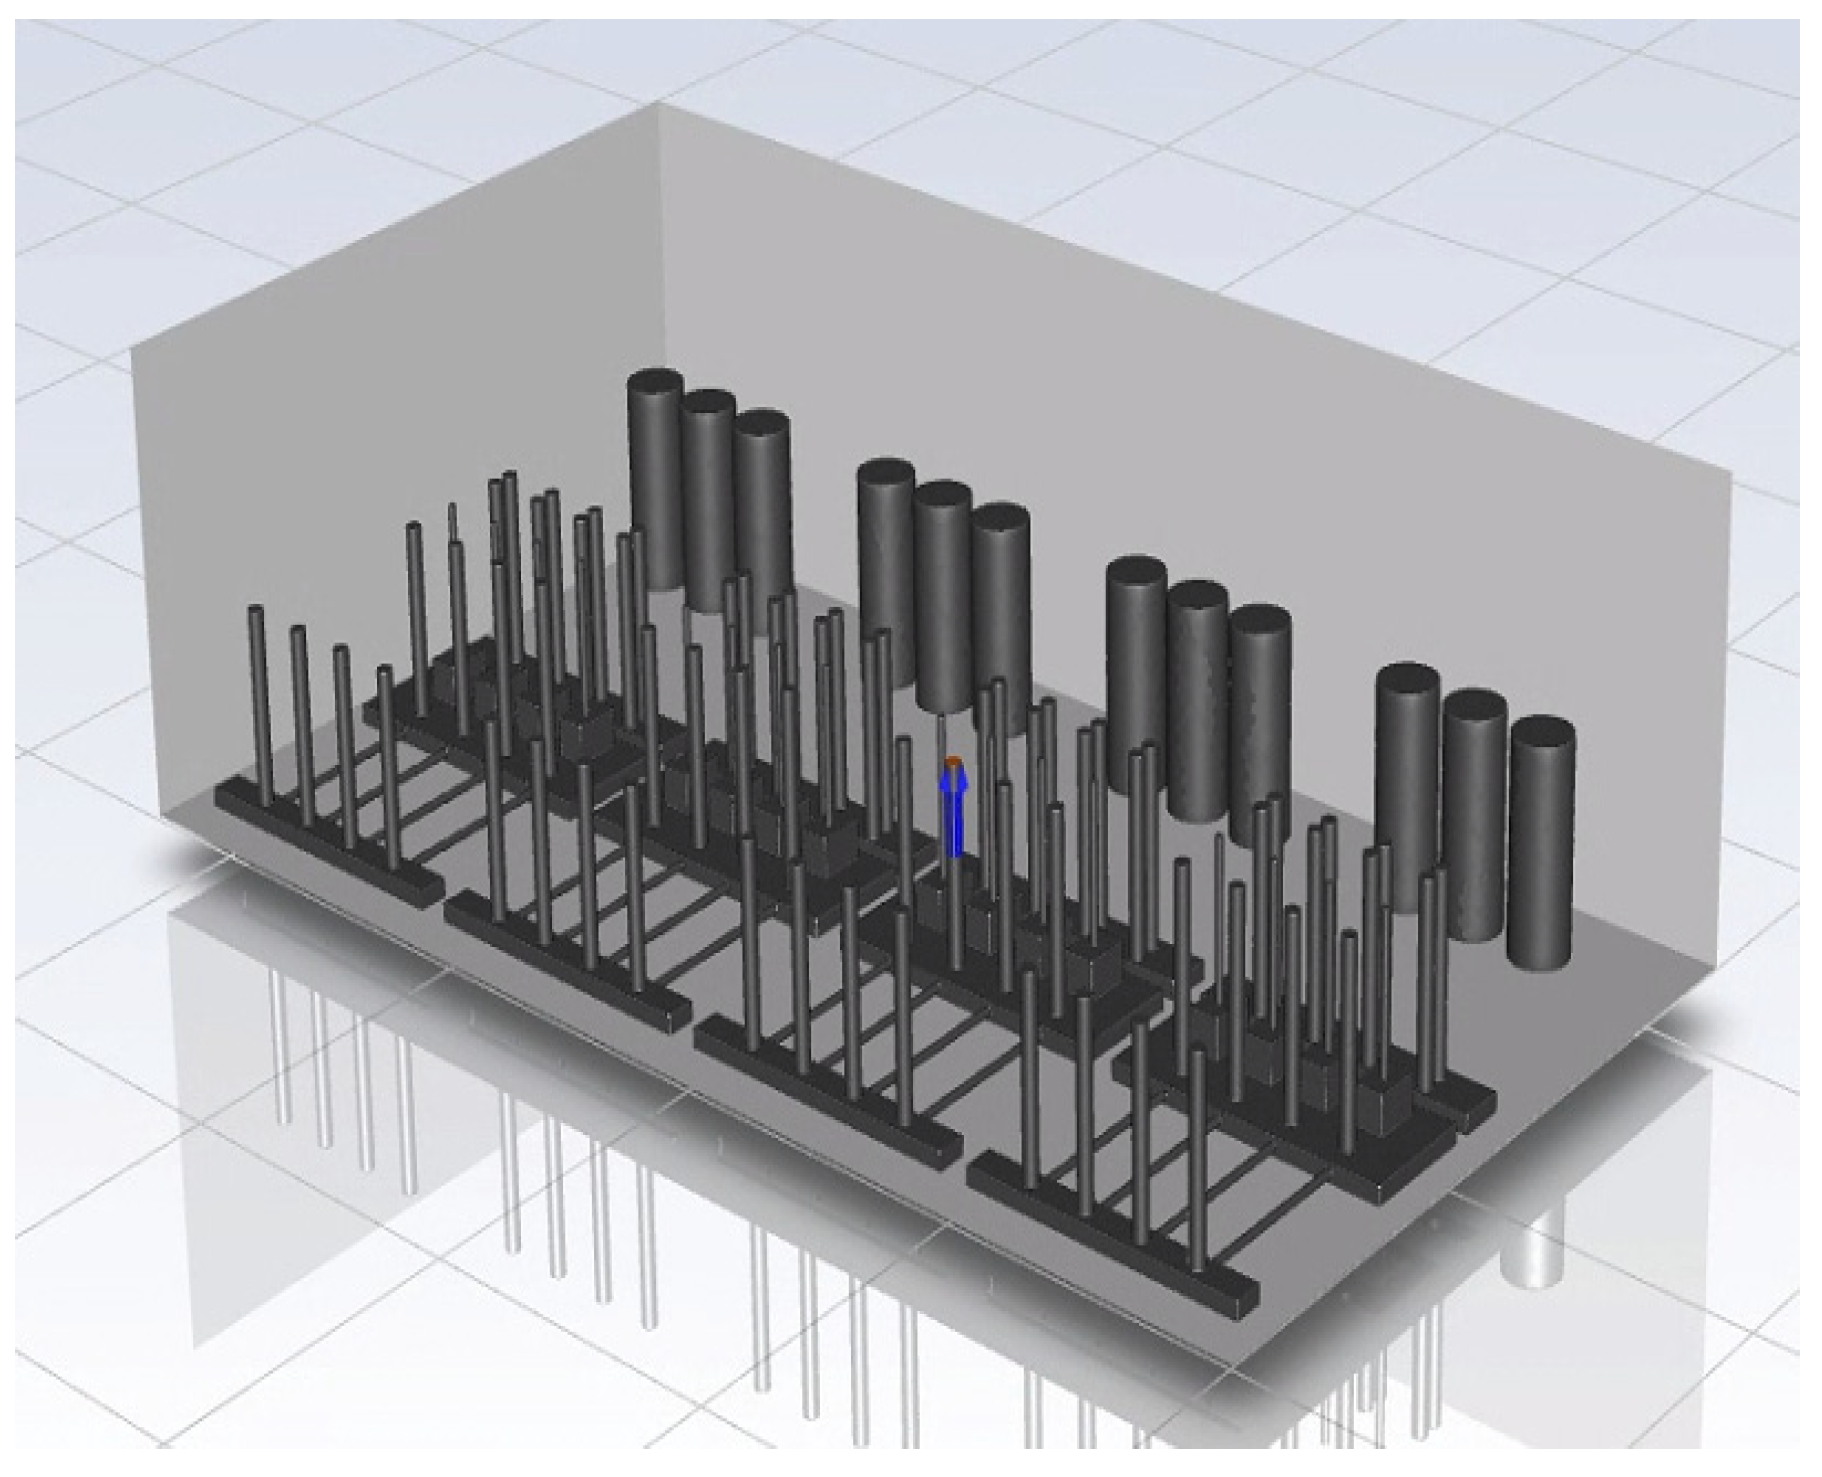
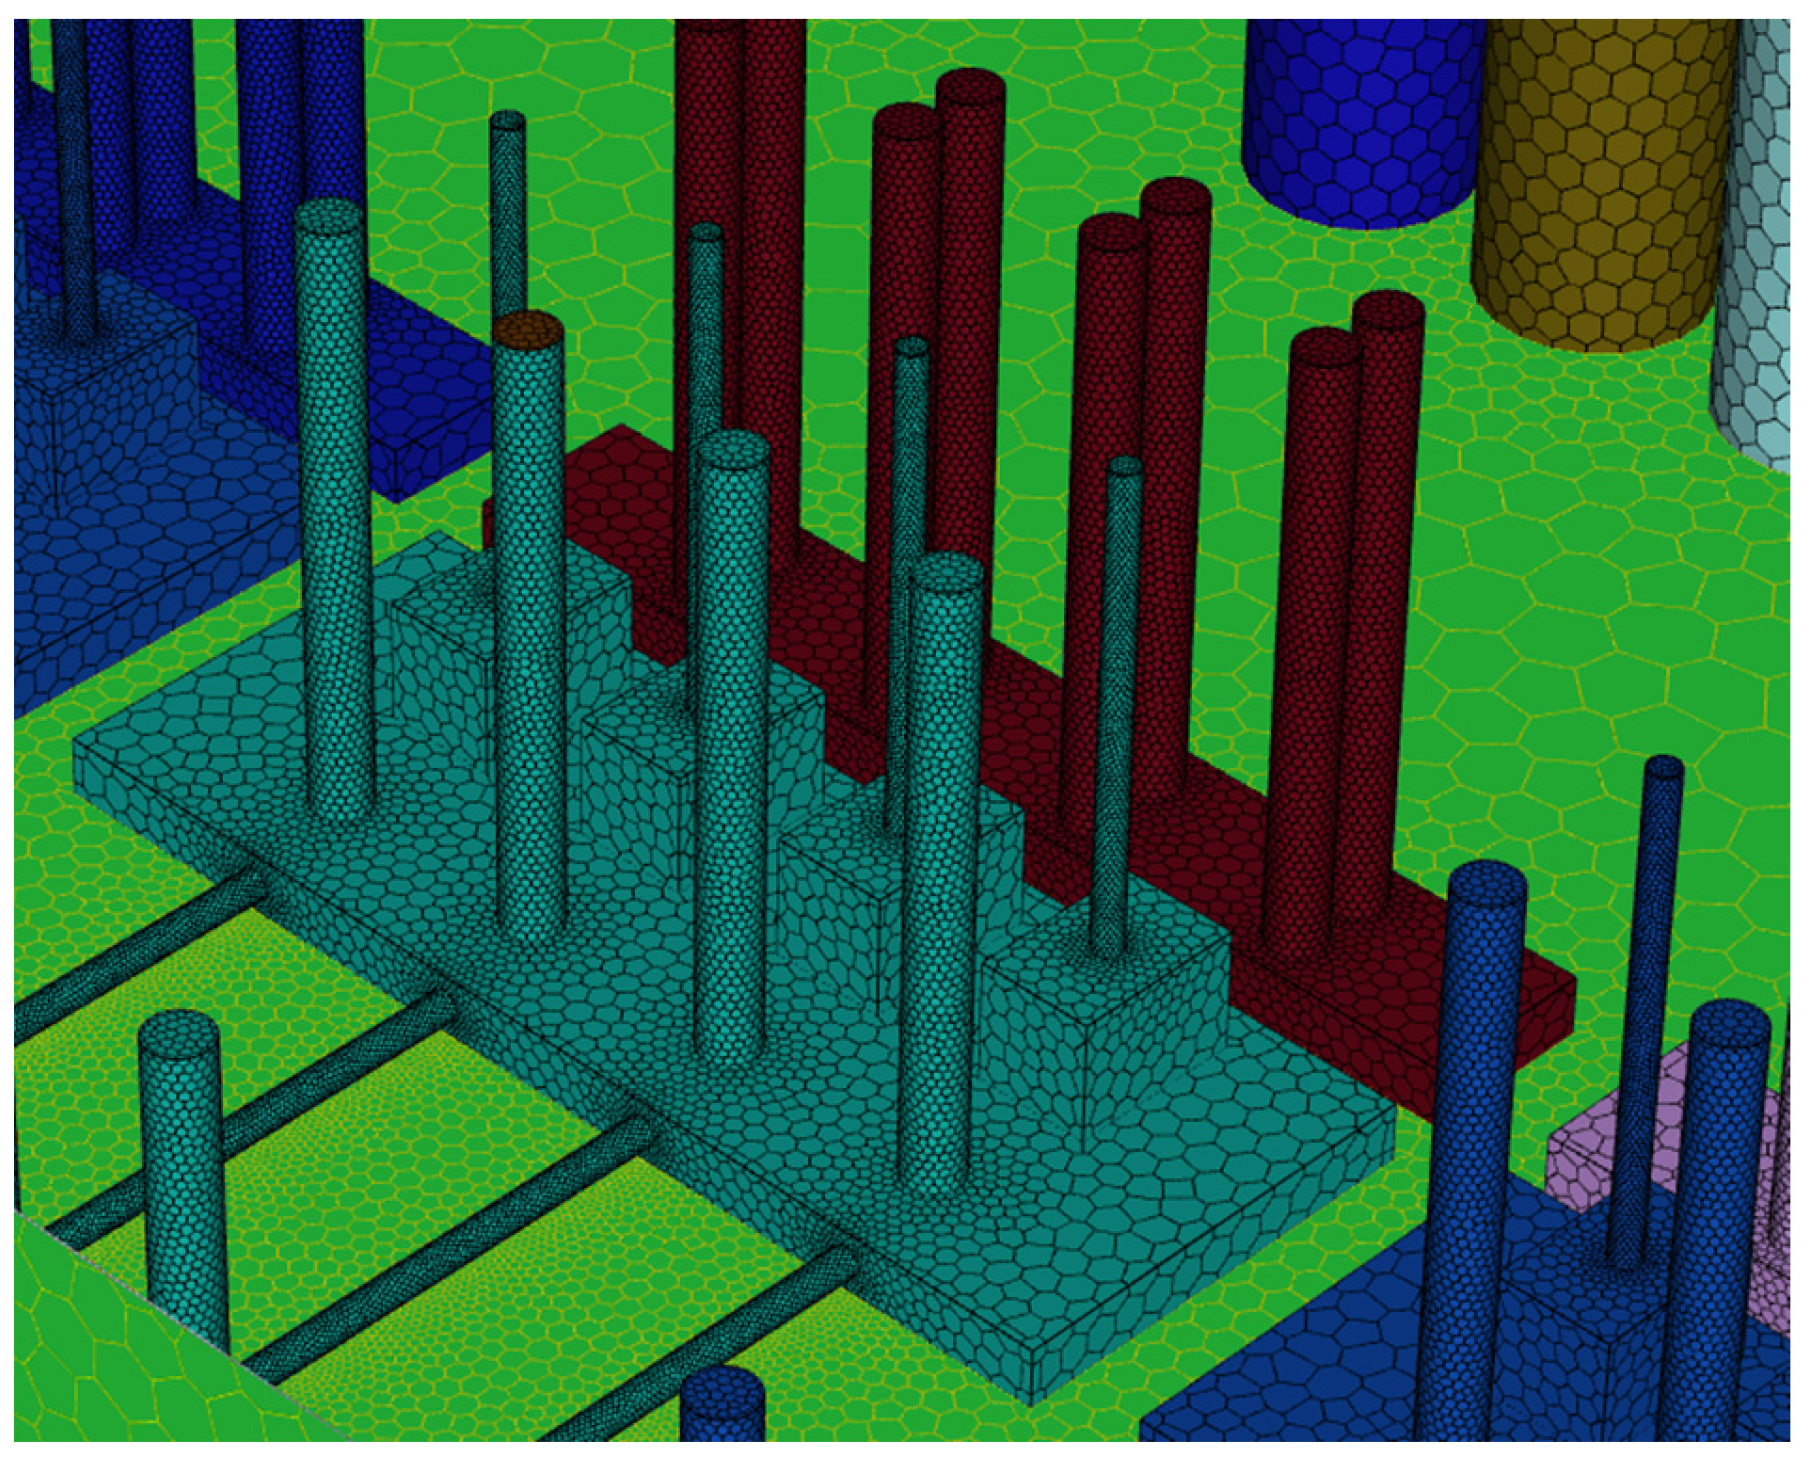
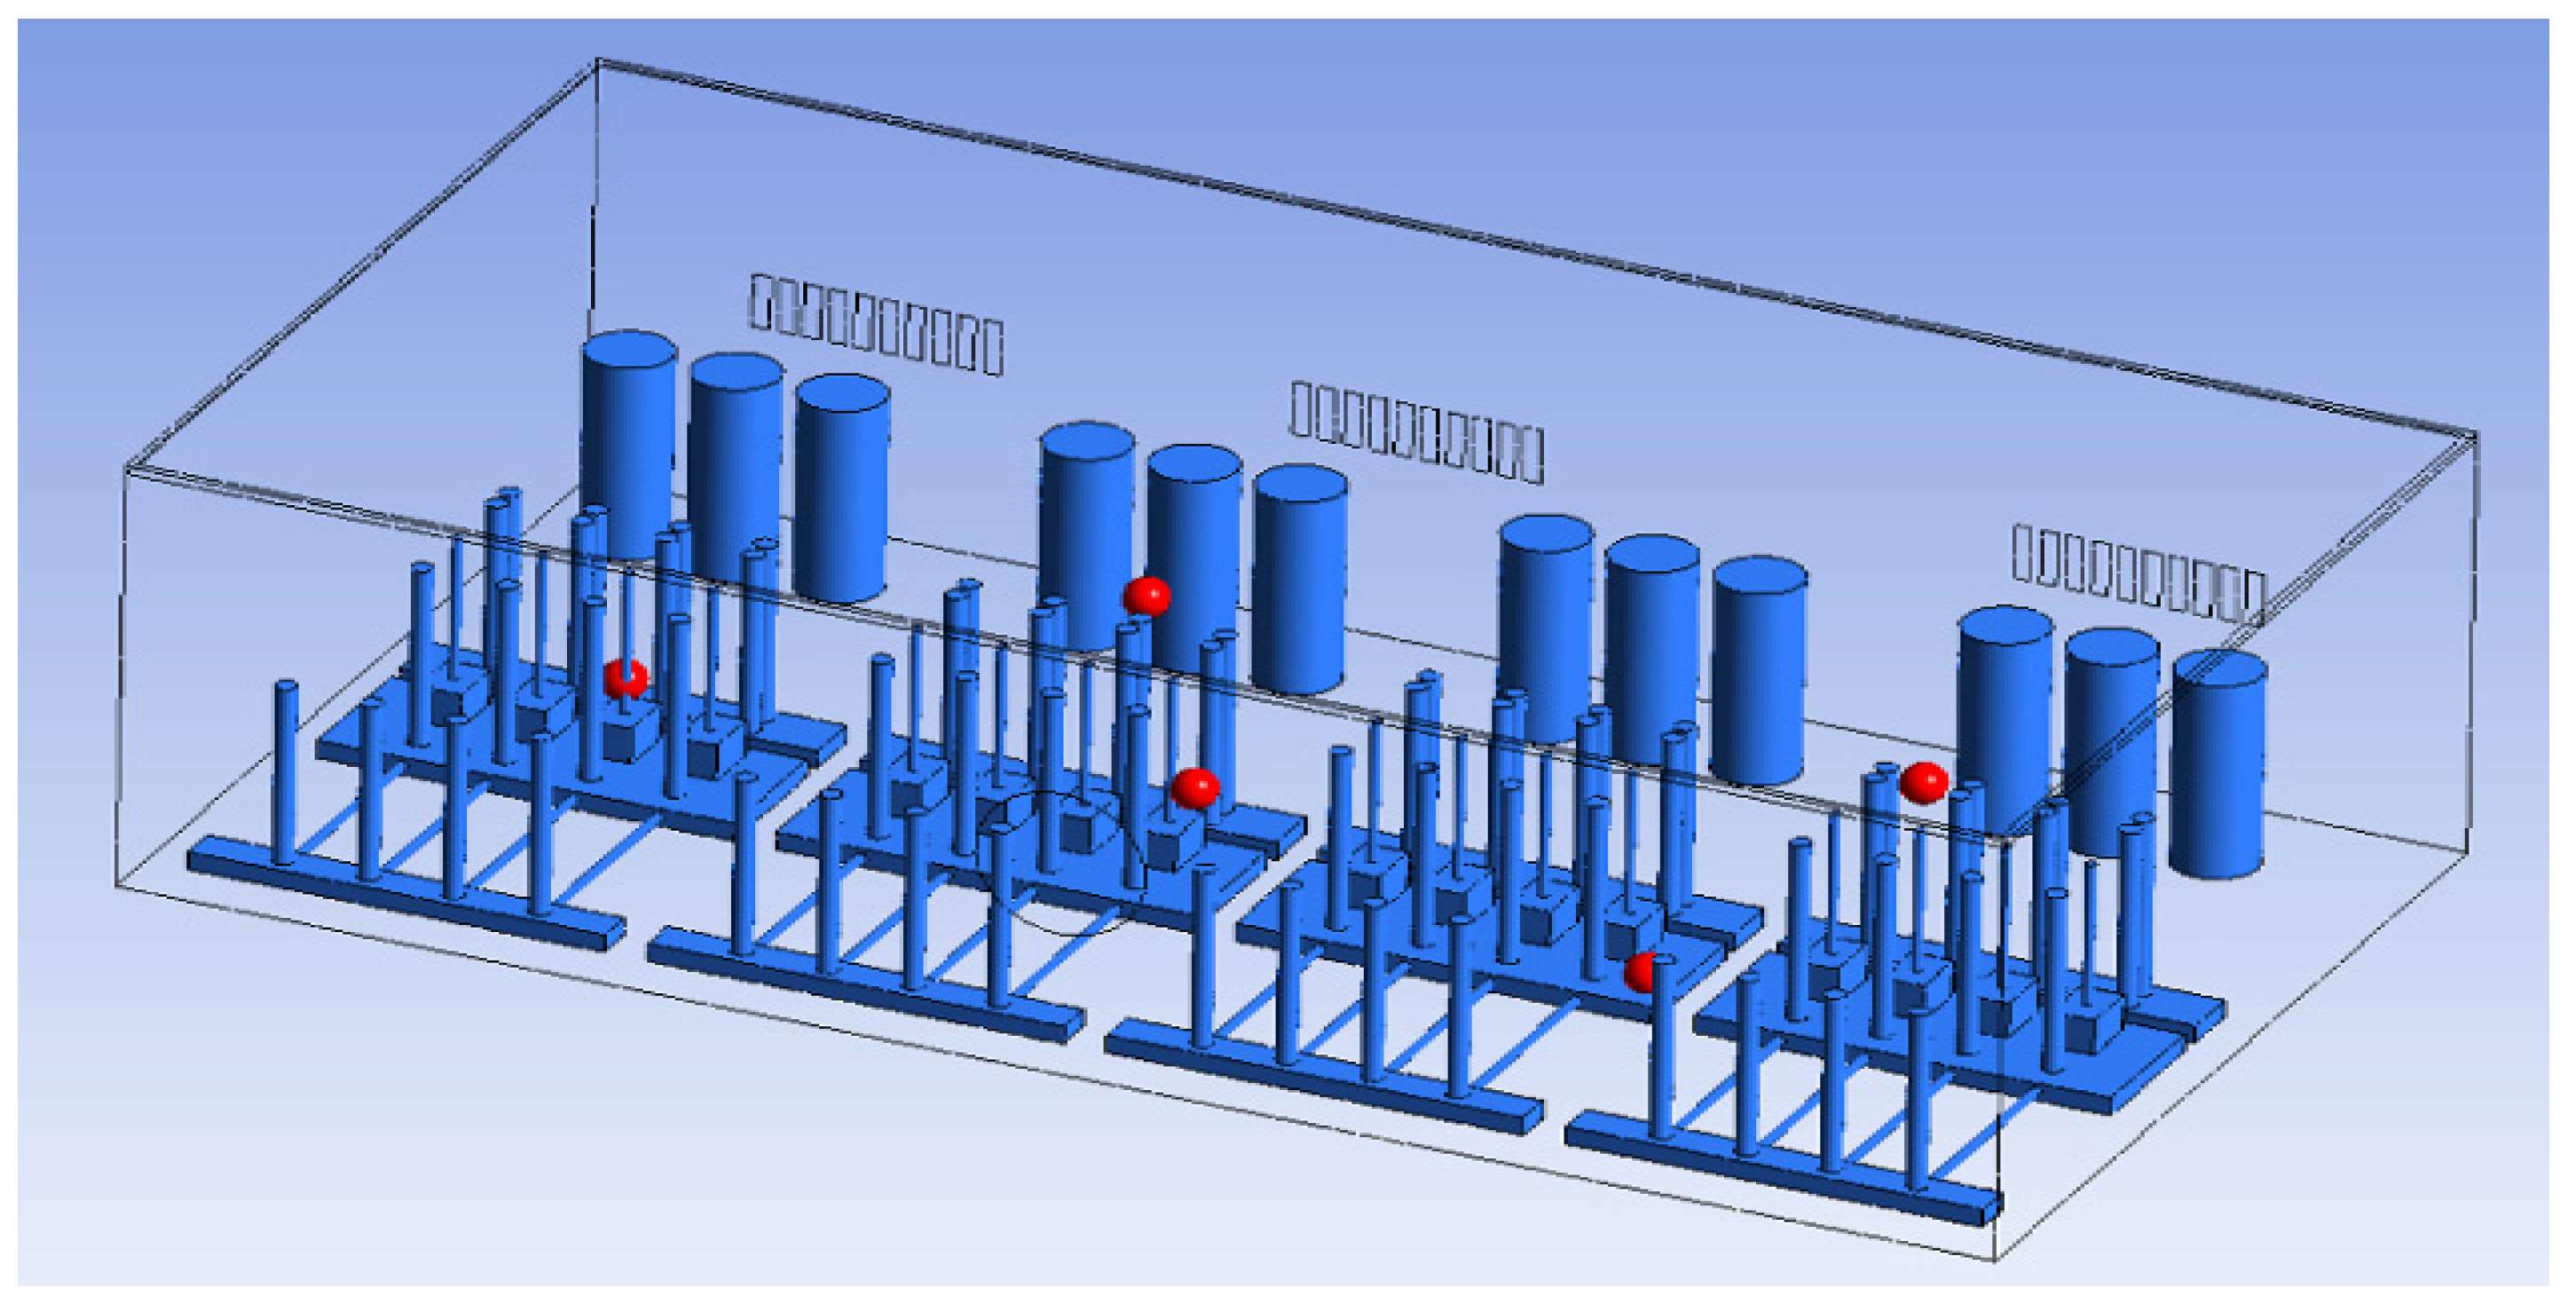
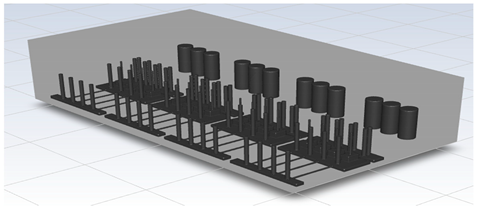
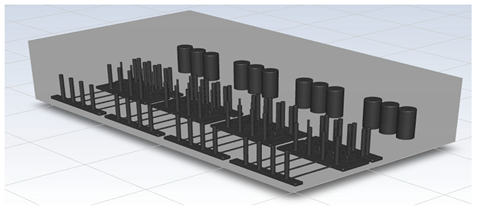
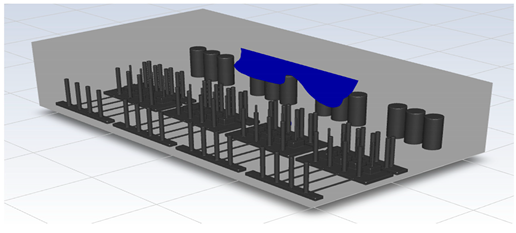
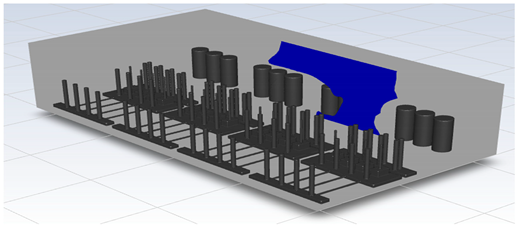
To perform CFD simulations, the inside of the gas box must be configured in 3D. The configuration performed as shown in Figure 2 with SpaceClaim, a computer-aided design program in ANSYS, and the shape of the actual semiconductor gas box was simplified. A large quantity of piping for various process gases used in the semiconductor production process was installed inside an actual gas box; however, creating an extremely precise shape requires a long time for mesh generation and solution. In the simulation analysis, only the main parts, such as the gas inlet, air inlet, and air outlet for exhaust, were created with dense grids. The type of mesh used was polyhedral, and parts other than the main ones were created with slightly relaxed grids by setting them with growth rates. The geometry and shape of the meshes are shown in Figure 3. The information related to mesh modeling is as follows. The number of nodes was 7,345,567, the number of faces was 9,255,656, the number of cells was 1,359,121, the minimum orthogonal quality was 0.21, and the aspect ratio was 10. Before this, the grid independence study had been performed. The model achieved grid independence when the number of grids are approximately 1,300,000, starting from 300,000.
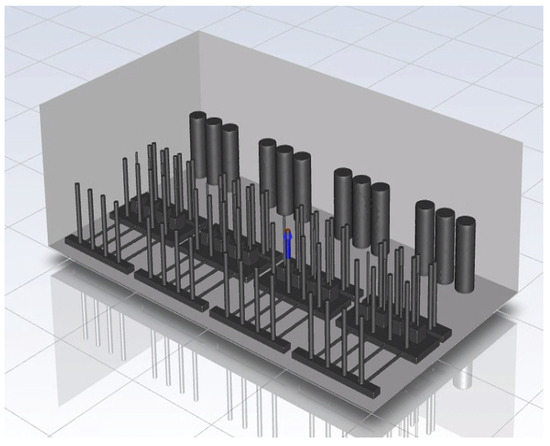
Figure 2.
Inside of the box in the CFD simulation.
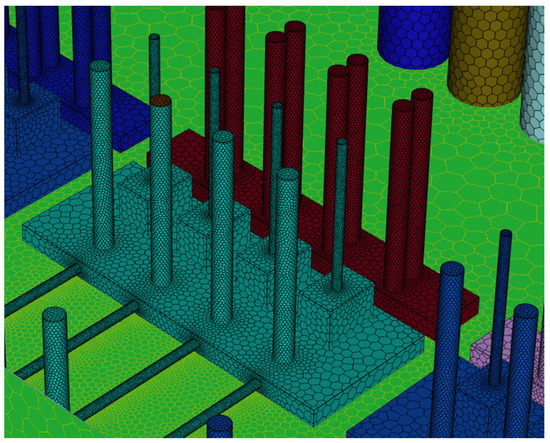
Figure 3.
Polyhedral mesh creation.
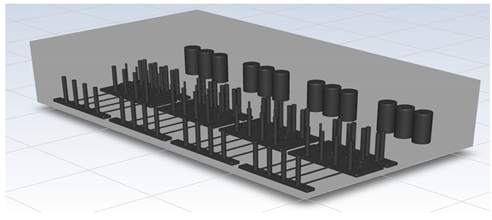
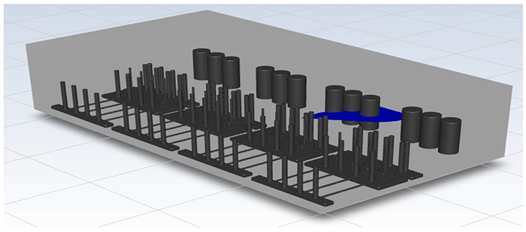
The shape of the box was the same as that used in the gas tracer test. With regard to the boundary conditions, the air inlet consisted of 24 pieces of 8 mm × 30 mm grills at the rear, and the air outlet consisted of a Ø80 mm hole at the front of the gas box. The gas inlet location was calculated under the condition of a 40 L/min release upward to the supply line fitting part in the gas box. The shape related to the boundary conditions is shown in Figure 4 and Table 3. For the analysis condition, the analysis was conducted in a steady state where H2 gas leakage occurred continuously.
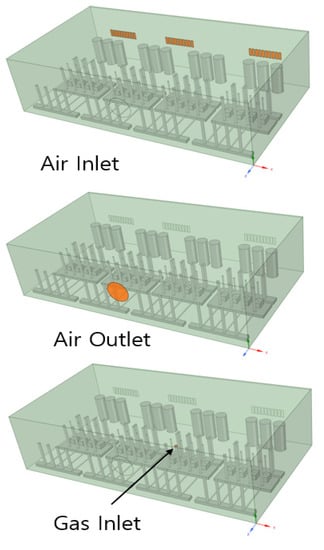
Figure 4.
Air inlet, air outlet, and gas inlet.
Table 3.
CFD simulation parameters.
It was assumed that the fluid is incompressible, and the governing equations are the continuity equation, momentum equation, and energy conservation equation, respectively, expressed in Equations (2)–(4) as follows:
where ρ is the density of the fluid (kg/m3), u is the velocity (m/s), T is the temperature (K), τij is the stress (Pa), h for enthalpy (J/kg), and Sh stands for enthalpy increase (kg/(m/s3). In order to simplify the numerical analysis, it is assumed that all physical properties including the steady state and densities are constant. The fluid flow was analyzed using a standard k-ε model as a turbulent flow and the species transport model was used for H2 concentration analysis. The governing equations, k-ε turbulence model, and species transport model equations were calculated using the Semi-Implicit Method for Pressure-Linked Equation and the SIMPLE method.
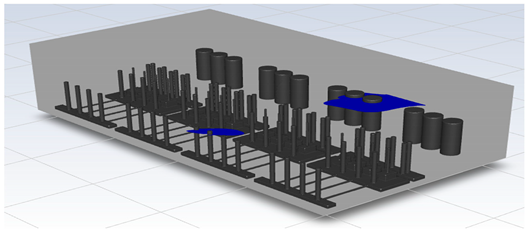
To identify the internal concentration, the same points as the sample locations of the tracer gas test in the gas box space (FMS, cable box, pressure gauge, PSW connector, and MFC) were designated as the monitoring points. The individual monitoring points are shown in Figure 5 and Table 4.

Figure 5.
Monitoring points (FMS, cable box, pressure gauge connector, PSW connector, MFC).
Table 4.
Monitoring points.
3. Results
3.1. Tracer Gas Test and Simulation Results
The ERC of the process chemicals can be calculated using the tracer gas concentration measured with the Dräger X-am 5000 multi-gas detector. The ERC was compared with the LFL of the process chemical, and an ERC lower than 25% of the LFL was considered acceptable. In the case of the FMS, which was the measurement sample, the measured H2 concentration was 170 ppm. The ERC value can be obtained using Equation (1).
ERC = 170 ppm × 100/5% = 3400 ppm
LFL of H2 = 40,000 ppm
ERC/LFL(%) = 3400 ppm/40,000 ppm × 100% = 8.5%
According to SEMI S6-0618 Section 8.8, Appendix 4, Section A4–4.1.1, if the ERC is less than 25% of the, the gas box is considered safe. For the FMS sample, the ERC value was 8.50% of the LFL, which was lower than 25% of the LFL. Therefore, the FMS sample can be considered safe. Table 5 presents the results of the tracer gas tests for the individual samples. The ERC/LFL (%) values for the five samples were lower than 25%, indicating that the samples were within the acceptable range.
Table 5.
Tracer gas test results.
3.2. CFD Simulation Result
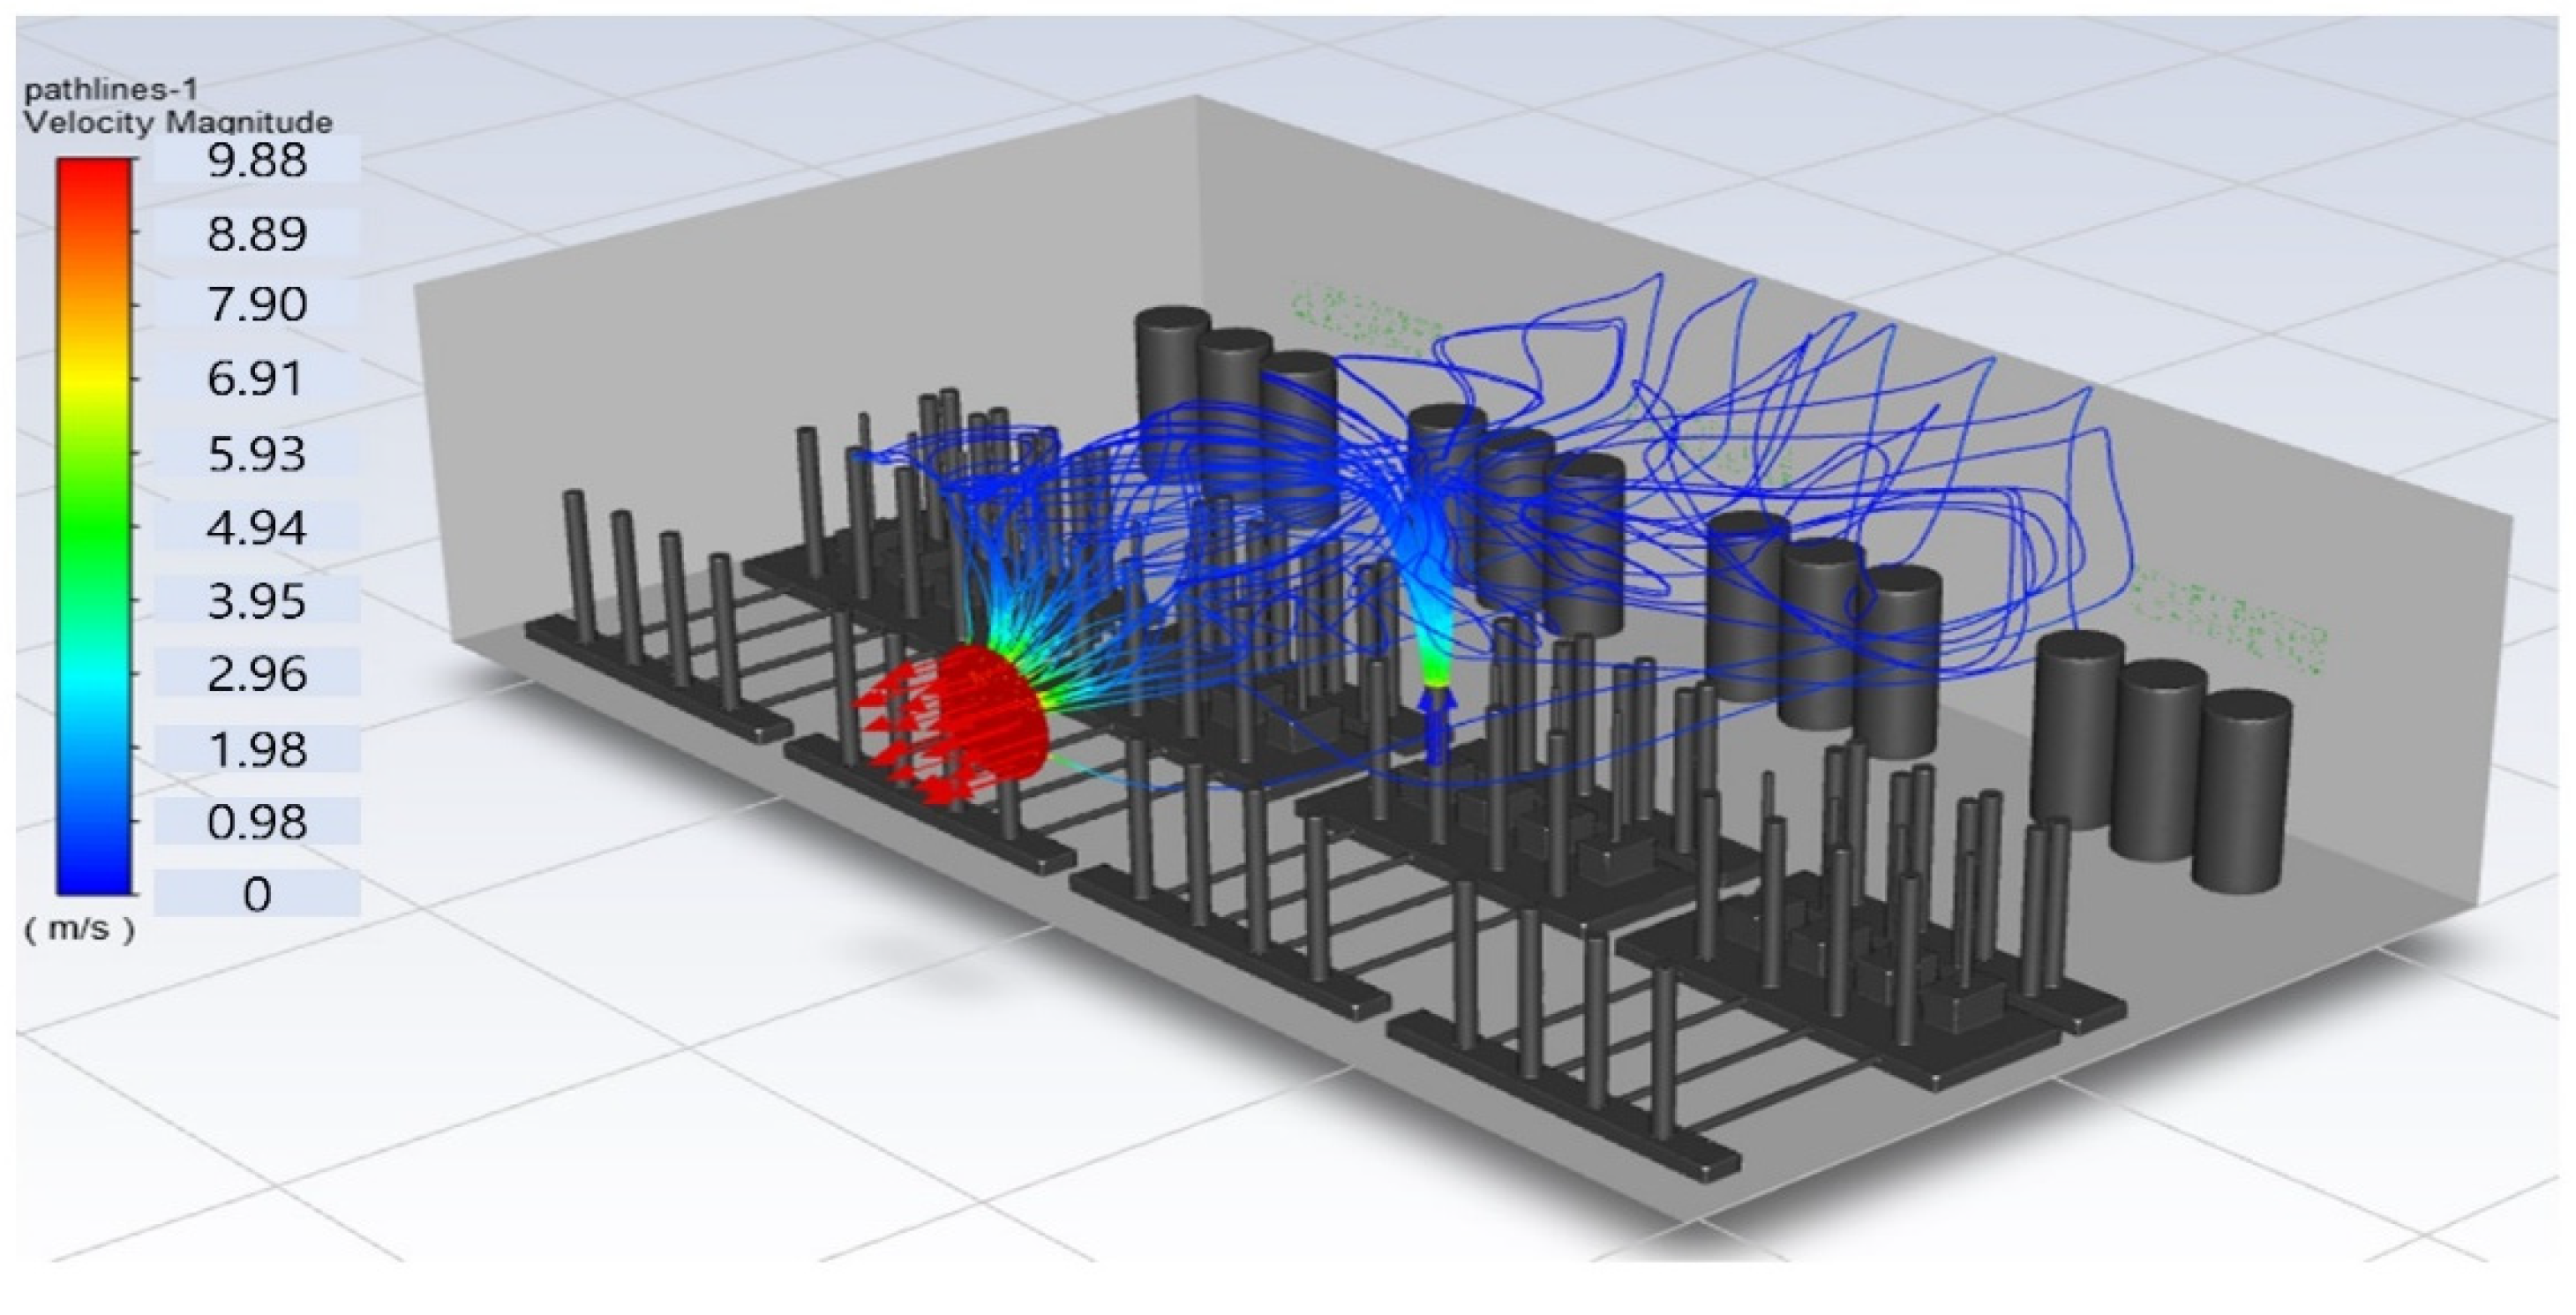
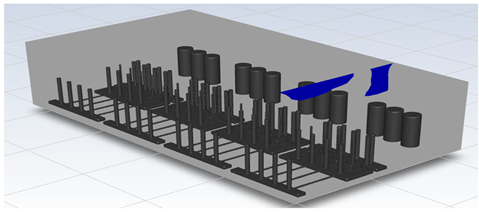
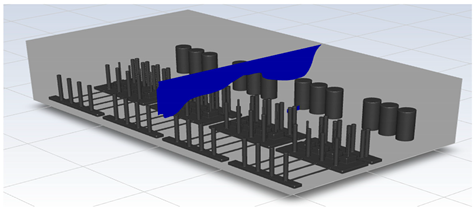
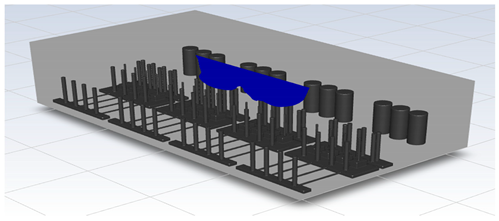
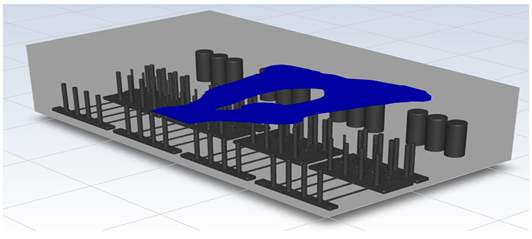
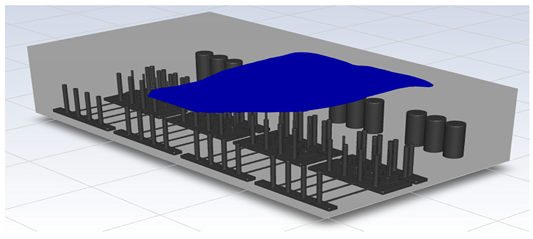
In this study, the situation of leakage in the gas box used in the semiconductor process was considered, and CFD simulations were performed under the same experimental conditions as those in the tracer gas test, such as the leakage rate, exhaust rate, and sampling locations. Table 6 shows the results for the individual samples. The ERC/LFL (%) values at the five sampling points (FMS, cable box, pressure gauge, PSW connector, and MFC) were lower than 25% and, thus, were within the acceptable range. In the case of ventilation flow, the shapes of the gas exhaust and the stream of the gas sucked into the air outlet are as shown in Figure 6, which shows the gas release and the formation of a stream sucked into the exhaust. The streamline of the leaked gas is shown in Figure 7. The exhaust rate for the Ø80 mm air outlet is shown with an average value of 9.24 m/s. The intake rate at the air inlets formed with 30 grilles is shown with an average value of 6.47 m/s. The volume of concentrations exceeding 25% of the LFL, which was the concentration of interest in the experiment, was approximately 1.2% of the total volume, and the relevant volume was divided into YZ, XZ, and XY sections, as shown in Table 7, Table 8, Table 9 and Table 10. According to the experimental results, the area with concentrations exceeding 25% of the LFL mainly formed around the gas inlet, and no area with concentrations exceeding 25% formed in the X = 600 and X = 800 parts of the YZ section and the Y = 100 part of the ZX section.
Table 6.
CFD simulation result.
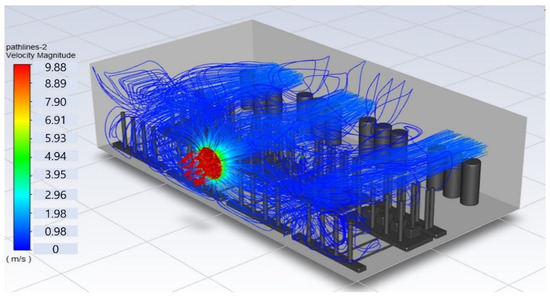
Figure 6.
Distribution of streamlines from air inlet in the gas box.

Figure 7.
Streamlines of the leaked gas (H2).
Table 7.
Identified X, Y, and Z positions on YZ, XZ, and XY sections, respectively.
Table 8.
Distribution of concentrations exceeding 25% of the LFL on the YZ section.
Table 9.
Distribution of concentrations exceeding 25% of the LFL on the ZX section.
Table 10.
Distribution of concentrations exceeding 25% of the LFL on the XY section.
3.3. Explosion Hazardous Area Setting According to IEC 60079-10-1
The explosion hazardous area setting is stipulated by the international standard IEC 60079-10-1 (Explosive Gas Atmospheres-Classification of Areas) and the domestic standard KS C IEC 60079-10-1 (Classification of Hazardous Areas-Explosive Gas Atmosphere). It is affected by leakage classes and ventilation and divides hazardous areas according to the possibility into Zone 0, Zone 1, Zone 2, and NE. The NE has hazards to a negligible extent in explosion hazard assessment, and an example has been presented in a previous study [25] as “the volume in which the average concentration of the natural gas cloud is 50% of the LFL is 1.0% or less of the enclosed space” [26].
The concentrations related to the LFL in the internal volume of the CFD simulation are shown in Table 11. The volume was within the NE range in the IEC standard.
Table 11.
Volume according to the concentration of interest.
3.4. Discussion
Both of the experimental and the simulation results show that the concentration in the box would be less than 25% LFL of H2. The Tracer test results show that the highest concentration among the monitor points is only 175 ppm, equivalently 3500 ppm considering the 1/20 dilution and the value is far less than 25% LFL. The CFD simulation results show that the highest concentration among the virtual monitor points is only 272 ppm, equivalently 5440 ppm considering the 1/20 dilution and the value is also less than 25% LFL. The highest (worst) concentrations in these two different approaches appeared at the same location, cable box.
On the other hand, there are some differences when comparing experimental and numerical results for each location and we compared them in logarithmic scale in Figure 8.
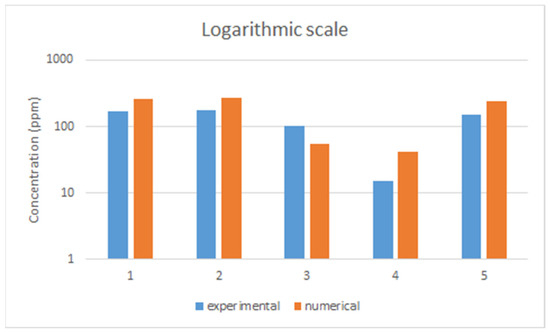
Figure 8.
Comparison of results (experimental vs. numerically calculated).
In fact, all concentrations fluctuated when they were measured and simulated. Furthermore, only the maximum concentration of each point was selected for fair comparison. Obviously, there were overlapped concentrations for all points during that time, although, the main reason for discrepancies is the geometry set-up. In the CFD simulation, the internal geometry of the gas box was not accurately reproduced and was simplified to reduce the calculation time. Therefore, the internal void volume was expected to be larger than that in the gas tracer test. This shows that the void volume difference between the two experiments, which led to a smaller number of times of exhausts per hour in the CFD simulation, affected the results.
4. Conclusions
In this study, the gas box (0.48 m × 0.88 m × 0.24 m) used in actual semiconductor processes, hydrogen (H2), a process material, and an exhaust system (air outlet: Ø40 mm, exhaust rate: 9.24 m/s) were used to conduct gas tracer tests and CFD flow analysis. The ERC values obtained through the concentration values at five sample points were lower than 25% of the LFL (maximum of 8.75%), thereby complying with the standard for exhaust systems of SEMI S6. The CFD flow analysis was conducted under the same experimental conditions as those used in the gas tracer tests, such as the boundary conditions, exhaust gas pressure, and gas leakage rate. The ERC values at the same five sample points were lower than 25% of the LFL (maximum of 13.6%), thereby complying with the standard for exhaust systems of SEMI S6. According to the results of this study, the concentrations measured in the two experiments were lower than 25% of the LFL, but there were slight differences by point, and the concentrations in the CFD simulation were generally higher. The reasons are discussed in Discussion. In addition, according to the results of the analysis related to the LFL concentration through the CFD simulation, the gas concentrations were within the NE of IEC 6079-10-1; thus, it was concluded that explosion-proof equipment would not be necessary in these kinds of gas boxes in semiconductor manufacturing facilities.
This study asserts that the semiconductor gas box process meets the SEMI S6 exhaust system standard. However, because the experiment considered only a single scenario, additional experiments on various scenarios that may occur in reality are necessary. Experiments at multiple leakage points, such as the fitting of valves, rather than at one leakage point, are necessary, and experiments with various leakage rates that can occur in reality, rather than a single scenario with a leakage rate of 40 L/min, are also required.
Author Contributions
Conceptualization, S.-e.K. and K.L.; methodology, S.-e.K.; software, S.J.; validation, C.K.; formal analysis, S.-e.K.; investigation, S.-e.K.; resources, K.L.; data curation, K.L.; writing—original draft preparation, S.-e.K.; writing—review and editing, C.K.; supervision, S.J.; project administration, S.J.; funding acquisition, S.J. All authors have read and agreed to the published version of the manuscript.
Funding
This work was supported by the National Research Foundation of Korea (NRF) grant funded by the Korea government (MSIT) (No. 2022R1F1A106546111) and by Korean Institute for Advancement of Technology (KIAT) grant funded by the Korea Government (MOTIE). (P0012787, The competency Development Program for Industry Specialist).
Institutional Review Board Statement
Not applicable.
Informed Consent Statement
Not applicable.
Conflicts of Interest
The authors declare no conflict of interest.
References
- Eckerman, I. The Bhopal Saga—Causes and Consequences of the World’s Largest Industrial Disaster; Universities Press: Hyderabad, India, 2005. [Google Scholar]
- Lee, K.; Kwon, H.; Cho, S.; Kim, J.; Moon, I. Improvements of safety management system in Korean chemical industry after a large chemical accident. J. Loss Prev. Process Ind. 2016, 42, 6–13. [Google Scholar] [CrossRef]
- Lee, K.; Lee, C. Evaluation of a mitigation system for leakage accidents using mathematical modeling. Korean Chem. Eng. Res. 2018, 35, 348–354. [Google Scholar] [CrossRef]
- Cho, J.; Kim, H.; Gebreselassie, A.L.; Shin, D. Deep neural network and random forest classifier for source tracking of chemical leaks using fence monitoring data. J. Loss Prev. Process Ind. 2018, 56, 548–558. [Google Scholar] [CrossRef]
- Kim, H.; Park, M.; Kim, C.W.; Shin, D. Source localization for hazardous material release in an outdoor chemical plant via a combination of LSTM-RNN and CFD simulation. Comput. Chem. Eng. 2019, 125, 476–489. [Google Scholar] [CrossRef]
- Occupational Safety and Health Act of the Republic of Korea. Act No. 18180 Article 23 (Honorary Occupational Safety Inspectors). 2021.
- Rules on OSH standards Article 311 (Selection of electrical appliances used in explosion hazards). 2021.
- IEC 60079-10-1; Explosive Atmospheres—Part 10-1: Classification of Areas—Explosive Gas Atmosphere. International Electrotechnical Commission: Geneva, Switzerland, 2013.
- International Electrotechnical Commission. IEC 60079-10-1: Explosive Atmospheres—Part 10-1: Classification of Areas—Explosive Gas Atmospheres. IEC 2015, 1, 46. [Google Scholar]
- KOSHA. GUIDE E-150—In Setting of Gas Explosion Danger Place General Guidelines. Korea Occupational Safety and Health Agency: Korea Occupational Safety and Health Agency, 2017; pp. 83–111. [Google Scholar]
- Ma, Z.; Guan, B.; Liu, X.; Zhang, T. Performance analysis and improvement of air filtration and ventilation process in semiconductor clean air-conditioning system. Energy Build. 2020, 29, 228. [Google Scholar] [CrossRef]
- Song, Y.-S.; Yoon, M.; Hyun, S.-H.; Lee, C.-W.; Yoon, Y.-S.; Kim, S.-M. A Study on Safety by Risk Assessment of Clean Room. Fire Sci. Eng. 2004, 18, 78–85. [Google Scholar]
- Park, C.; Kim, C. Risk assessment of Explosion of Mixed Dust Generated in Semiconductor Manufacturing. Trans. Korean Inst. Electr. Eng. 2018, 67, 474–478. [Google Scholar]
- Ngai, E.Y.; Huang, K.P.-P.; Chen, J.-R.; Shen, C.-C.; Tsai, H.-Y.; Chen, S.-K.; Hu, S.-C.; Yeh, P.-Y.; Liu, C.-D.; Chang, Y.-Y.; et al. Field tests of release, ignition, and explosion from silane cylinder valve and gas cabinet. Process Saf. Prog. 2007, 26, 265–282. [Google Scholar] [CrossRef]
- Yet-Pole, I.; Chiu, Y.-L.; Wu, S.-J. The simulation of air recirculation and fire/explosion phenomena within a semiconductor factory. J. Hazard. Mater. 2009, 163, 1040–1051. [Google Scholar]
- Kim, J.-D.; Han, S.-A.; Yang, W.-B.; Rhim, J.-G. A study on the Internal Flow Analysis of Gas Cylinder Cabinet for Specialty Gas of Semiconductor. J. Korean Inst. Gas 2020, 25, 15–21. [Google Scholar]
- Xu, Q.; Zhang, L.; Liang, W. Acoustic detection technology for gas pipeline leakage. Process Saf. Environ. Prot. 2013, 91, 253–261. [Google Scholar] [CrossRef]
- Song, Y.; Li, S. Gas leak detection in galvanised steel pipe with internal flow noise using convolutional neural network. Process Saf. Environ. Prot. 2021, 146, 736–744. [Google Scholar] [CrossRef]
- Hanna, S.R.; Hansen, O.R.; Ichard, M.; Strimaitis, D. CFD model simulation of dispersion from chlorine railcar releases in industrial and urban areas. Atmos. Environ. 2009, 43, 262–270. [Google Scholar] [CrossRef]
- Shen, R.; Jial, Z.; Parker, T.; Sun, Y.; Wang, Q. Recent application of Computational Fluid Dynamics (CFD) in process safety and loss prevention: A review. J. Loss Prev. Process. Ind. 2020, 67, 104252. [Google Scholar] [CrossRef]
- Song, D.; Lee, K.; Phark, C.; Jung, S. Spatiotemporal and layout -adaptive prediction of leak gas dispersion by encoding-prediction neural network. Process Saf. Environ. Prot. 2021, 151, 365–372. [Google Scholar]
- Kim, S.R.; Lim, K.Y.; Yang, W.B.; Rhim, J.G. A Study on the Explosion Hazardous Area in the Secondary Leakage of Vapor Phase Materials Based on the Test Results and the Leak Rate According to SEMI S6 in the Semiconductor Industry. J. Korean Inst. Gas 2020, 24, 15–21. [Google Scholar]
- SEMI S2: 2016. Environmental, Health, and Safety Guideline for Semiconductor Manufacturing Equipment. Available online: https://store-us.semi.org/products/s00200-semi-s2-environmental-health-and-safety-guideline-for-semiconductor-manufacturing-equipment (accessed on 10 September 2022).
- SEMI S6. Environmental, Health, and Safety Guideline for Exhaust Ventilation of Semiconductor Manufacturing Equipment. Available online: https://store-us.semi.org/products/s00600-semi-s6-environmental-health-and-safety-guideline-for-exhaust-ventilation-of-semiconductor-manufacturing-equipment (accessed on 10 September 2022).
- API. Recommended Practice 505: Recommended Practice for Classification of Locations for Electrical Installations at Petroleum Facilities Classified as Class I, Zone 0, Zone 1, and Zone 2, 2nd ed.; API: Washington, DC, USA, 2018. [Google Scholar]
- Jung, J.Y.; Lee, C.J. A Study on Gas Explosion Hazardous Ranges for International Electrotechnical Commission Technical Standards. J. Korean Soc. Saf. 2018, 33, 39–45. [Google Scholar]


Publisher’s Note: MDPI stays neutral with regard to jurisdictional claims in published maps and institutional affiliations. |
© 2022 by the authors. Licensee MDPI, Basel, Switzerland. This article is an open access article distributed under the terms and conditions of the Creative Commons Attribution (CC BY) license (https://creativecommons.org/licenses/by/4.0/).