Abstract
Load shedding control is an emergency control measure to maintain the frequency stability of the power system. Most of the existing load shedding methods use the extensive form of directly cutting off the outlet of the substation, featuring low control accuracy and high control cost. A network reconfiguration technique can adjust the topology of the distribution network and offers more optimization space for load shedding control. Therefore, this paper proposes a reconfiguration–load shedding coordination optimization scheme to reduce the power loss caused by load shedding control. In the proposed method, a load shedding mathematical optimization model based on distribution network reconfiguration is first established. The tie switches and segment switches in the distribution network are used to perform the reconfiguration of the distribution network, and the load switches are adopted to realize the load shedding. To improve the solving efficiency of the model, a solving strategy that combined a minimum spanning tree algorithm with an improved genetic algorithm is trailed to address the nonlinear and nonconvex terms. The application of the proposed method and model are finally verified via the IEEE 33 bus system, and the advantages in reducing the loss cost and the number of outage users are accordingly proven.
1. Introduction
With a large number of distributed generators (DG) connected and active loads such as electric vehicles and virtual power plants participating in power system dispatch, the power grid will be more intelligent and open in the future [1,2,3]. The connection of DG increases the structural complexity and reduces the inertia of the system, making the control of the power grid more challenging [4,5]. The grid frequency will drop more quickly when the power imbalance occurs due to the decrease of DG output and the increase of user demand [6,7], because the output of DG is easily affected by seasons, climate, and other reasons. Meanwhile, the voltage in some regions will also drop significantly [8] and there may be large area power outage in extreme cases [9,10]. Load shedding control is an essential means to prevent the system from experiencing frequency or voltage collapse [11]. A simple and efficient load shedding strategy is thus a necessity to ensure that the frequency and voltage of the distribution network are within a safe range and the loss of load shedding is minimized [12].
Load shedding is commonly formulated as a multi-objective, multi-constraint, and nonlinear integer combinatorial optimization problem. Various methods for load shedding of distribution networks have been proposed, including the priority order method [13] mathematical programming method [14,15], and graph-based method [16], etc. In Ref. [17], an analytic hierarchy process (AHP) is adopted for dynamically prioritizing the loads, based on changing priorities of loads and system critical natures of loads, which effectively reduced the shed power of the system. In Ref. [18], the loads were first classified into the fixed priority loads and random priority loads according to their types, and a random combination method was then adopted to determine the optimal load shedding for the random priority loads. The result proved that the proposed method is capable of recovering the frequency to nominal value without any overshoot. However, as the number of the nodes increases, the total number of possible combinations will grow exponentially, resulting in huge computing time. In Ref. [19], a load shedding algorithm aiming to maxmize the satisfaction of system components was proposed, which achieved the system optimum efficiently. In Ref. [20], the economic dispatch problem (EDP) was incorporated with the optimal load shedding to formulate a novel EDP without feasibility assumption. As a result, the proposed method could produce reasonable load shedding results in different situations. The methods in the aforementioned literature fully considered the load priority and the overshoot during the load shedding process. However, interruption cost, network loss, and other indexes are not considered in these methods. It cannot meet the diverse load shedding demand. In Ref. [14], an adaptive load shedding method based on a hierarchical structure was proposed. To reduce the computational efforts, the nonlinear terms in the model were linearized to convert the original mixed-integer nonlinear programming (MINLP) model into a mixed-integer linear programming (MILP) model. The results showed that the proposed method can effectively reduce the interruption cost and maintain the stability of the system voltage and frequency. However, the network loss and the possible influence was still not explored. Another MILP model for AC power flows suitable for load shedding problems was also developed in Ref. [15], where the power flow model was linearized to improve the solution efficiency. Unlike the above-mentioned methods, Ref. [16] introduced a graph theory-based method to divide the distribution network into multiple regions, so that the load shedding scheme in each region can be easily optimized by solving a small-scale MILP model. However, improper partitioning may result in suboptimal load shedding strategies.
It worthy of noting that although these classical methods are simple and effective, they obtain better results when the binary switching variables are relatively small. Once the number of binary switching variables keeps increasing, these classical algorithms will become time-consuming and may fall into the low efficiency and local optimum. To this end, more and more researchers suggest using intelligent algorithms to solve the load shedding problems. Ref. [21] proposed a hybrid particle swarm-based-simulated annealing optimization algorithm (PSO-B-SA) to solve load shedding problems. Ref. [22] used the genetic algorithm to determine the load shedding combination at each stage of under frequency load shedding. Ref. [23] introduced fuzzy rules to optimize the inertia weight and learning factor in particle swarm optimization (PSO) algorithm and effectively reached the optimal strategy in under voltage load shedding. This fuzzy PSO load shedding strategy was verified to be suitable for large-scale distribution networks. These practices also proved that the intelligent algorithms cannot be restricted by the constraints such as the continuity and derivability of the objective function and feature good global convergence performance in solving high-dimensional space, high complexity, and nonlinear problems.
However, most of the above load shedding strategies set switches on load nodes and minimize the total shedding loss by preferentially shedding user loads with low priority, which do not substantially reduce the shed power of users. Existing research has pointed out that distribution network reconfiguration can effectively reduce the network losses, improve node voltage levels, and balance loads. In Ref. [24], a mathematical model aiming at the minimum network loss was established for network reconfiguration and was solved by harmony search algorithm. The result showed that the network loss is reduced by more than 30% and the voltage level of some nodes is significantly improved by network reconfiguration. A mixed-integer second-order cone programming (MISOCP) model for network reconfiguration was also proposed by performing second-order cone relaxation on branch power flow equations in Refs. [25,26,27]. In Ref. [28], an improved genetic algorithm was used to solve the network reconfiguration model, which improved the computational efficiency. Therefore, since network reconfiguration can effectively reduce network loss, the distribution network reconfiguration process and the load shedding process can be combined by changing the states of tie switches, sectional switches, and load switches when there is a large power deficit in the distribution network. In this way, the shed power and the economic loss of power outage can be minimized.
Accordingly, a load shedding coordination optimization method for distribution network combined with the network reconfiguration process is proposed in this work, and the main contributions of this work can be summarized as:
- (1)
- A load shedding method coupled with topology reconfiguration strategy was proposed as well as a trailed solving strategy.
- (2)
- The influences of the most widely used optimization objectives and the shedding power on the topology of the distribution grid are studied to explore the change rules of the topology.
- (3)
- Two application scenarios of output power fluctuations of main grid and line failure of the distribution grid are studied to verify the effectiveness of the proposed method.
The rest of the paper is organized as follows. In Section 2 and Section 3, a mathematical coordination optimization model including line switches and load switches is established. In Section 4, the genetic algorithm with strong ability to deal with discrete variables and global search is utilized to solve the model that is high-dimensional, nonlinear, and discontinuous. In Section 5, the proposed method is tested on a 33-bus system. Taking the load shedding indexes such as the lowest economic loss, the minimum number of shedding users, and the lowest shedding load as main objective functions, this paper explores the topology change and load shedding effect of distribution network when the DG output in the main grid changes from 0 to its maximum. The influence of load priority, number of users, and line impedance on load shedding strategy is clarified by analyzing the variation law of distribution network topology. By comparing the results of the reconfiguration–load shedding strategy in this work and the traditional load shedding strategy, the advantages of the proposed method in reducing the shed power, the number of removed users and the economic loss during power outages are verified and our conclusions are drawn in Section 6.
2. Distribution Network Reconfiguration Based on Kruskal Algorithm
Distribution network generally adopts a closed-loop design and open-loop operation mode, featuring a radiation-type structure. For this purpose, Ref. [25] added spanning tree constraints to the reconfiguration model, and Ref. [29] generated radial constraints from the perspective of virtual power flow. These two constraints can ensure that the distribution network always satisfies the radial topology during the optimization and solution process. However, the application of these two constraints often brings two problems: first, additional integer variables will be introduced, which increases the search space and reduce the solution efficiency; second, the variables in the constraints fail to reflect the relationship between nodes and branches. To overcome these drawbacks, in this work, the minimum spanning tree algorithm is introduced to generate radial distribution network before the load shedding operation.
2.1. Generation of Radial Distribution Network Based on Kruskal Algorithm
In distribution network reconfiguration process, the change of network topology leads to uncertainty in the power flow direction of some lines. If a directed graph is used to describe the distribution network, the actual power flow may be inconsistent with the direction of the edge, which is inconvenient for the power flow calculation and will increase the search space at the same time. Thus, in this work, an undirected graph is adopted to illustrate the topology of the distribution network.
Based on the established undirected graph, the minimum spanning tree algorithm is conducted to generate multiple radial topological structures from the distribution network containing loops, and to decide the upstream and downstream relationships between the nodes. Once the network structure is determined, the hierarchical forward and backward substitution method [30] can be used for power flow calculation to obtain the state parameters of each node and branch. This process avoids the additional integer variables in the above constraints and effectively reduces the search space and the complexity of the reconfiguration optimization problem.
Since the distribution network topology with tie lines is still close to radial shape and belongs to the sparse graph, the Kruskal minimum spanning tree algorithm [31] is selected in this work. To traverse all possible spanning trees to the maximum extent, the edge weights are generated randomly. Once the undirected weighted graph of the distribution network is constructed, the Kruskal minimum spanning tree algorithm will be executed to obtain the radial distribution network.
2.2. Mathematical Model of Distribution Network Reconfiguration
2.2.1. Objective Function
The objective function of the distribution network reconstruction can be described as follows:
where is the total power loss of the distribution network, and are the current magnitude and resistance of line , and Ω stands for the node set.
2.2.2. Constraints
The AC power flow constraints [14] of the distribution network can be described as:
where and are the active power and reactive power generated at bus i; and are the active power and reactive load powers at bus i; is the voltage phasor at bus i and denotes the set of nodes connected to bus i; and are the conductance and susceptance of line ; is the phase angle difference between the buses i and j.
Operating constraints of distribution network can be expressed as
where Equations (4)–(6) are the bus voltage constraint, the line capacity constraint, and the line current constraint. and are the minimum voltage magnitude and maximum voltage magnitude at bus i, where and is the rated current of line .
Radial topology constraints are formulated as
where is the current topology structure of the distribution network, and denotes the set of radial topology structures of the distribution network.
3. Coordination Optimization Model of Distribution Network Reconfiguration and Load Shedding
3.1. Objective Function
There are four indexes that are commonly used to evaluate the pros and cons of load shedding strategies.
- (1)
- Total shed power
- (2)
- Total economic loss
- (3)
- Total number of shedding users
- (4)
- Over-shed power,
To meet different application requirements and take a better trade-off of these indexes, the following three optimization objectives for the load shedding are defined in terms of economy, security and user experience.
Objective function 1 is to minimize the shed power, the power loss, and the over-shed power at the same time.
Objective function 2 is to minimize the economic loss, the power loss, and over-shed power at the same time.
Objective function 3 is to minimize the number of shedding users, the power loss, and the over-shed power at the same time.
where , , and are the weights of shed power, the power loss, and the number of shedding users in the objective functions. According to the judgment matrix method [32,33], , , and .
3.2. Constraints
The AC power flow constraints of the distribution network are expressed as
Note that compared with Equations (2) and (3), the binary variables representing the switching state of the loads are added to constraints (14) and (15).
Active power input constraint at power source nodes is given as
where represents surplus active power.
Security operation constraints and radial topology constraints are the same as Equations (4)–(7).
Thus, the load shedding optimization problems are determined as
which is a non-convex mixed-integer nonlinear programming (MINLP) model due to the existence of nonlinear AC power flow constraints and a large number of binary switching variables.
4. Solving Strategy of Reconfiguration-Load Shedding Model of Distribution Network
Note that the network reconfiguration–load shedding coordination optimization model determined by Equations (4)–(7) and (11)–(16) features high nonlinearity, large scale, and strong non-convexity. To this end, an improved GA is used to solve this model and the algorithm flowchart is illustrated in Figure 1. This is because GA is not limited by the continuity and derivative of the objective function and has good global convergence performance in solving high-dimensional space, high complexity, and nonlinear problems [34]. In this work, the improvement of the GA mainly lies in the three aspects of the generation process of initial population, the crossover operator, and mutation operator.
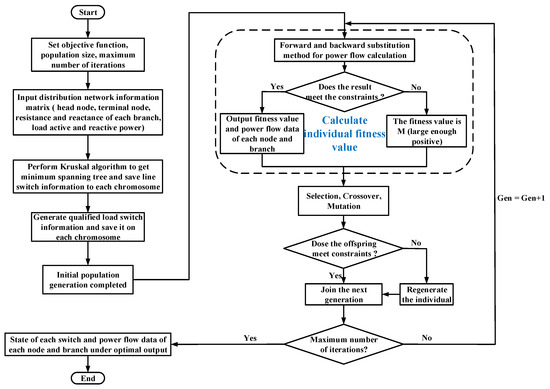
Figure 1.
Flowchart of the solving strategy.
4.1. Determination of Variables
In the proposed reconfiguration–load shedding model, two types of decision variables are considered. One is the binary variables to represent the states of line switches, such as tie switches and sectional switches, and another is the binary variables to represent the state of load switches. The structure of the distribution network is determined by the two state variables. At this time, the hierarchical forward–backward substitution method is used for power flow calculation to obtain the voltage, current, active power, and reactive power of each bus and line. Therefore, we combine these two decision variables as individuals of a genetic algorithm to finalize the whole solution process.
4.2. Generation of Initial Population
Since the distribution network needs to maintain a radial structure and the retained load cannot exceed the residual power, the individuals that determine the line switching variables and load switching variables of the topological structure cannot be generated in a random way. Thus, in this work, a method based on the Kruskal algorithm mentioned in Section 2.1 is proposed to generate switching states.
- (1)
- Input the information about nodes and branch connections that contain tie lines and generate weights of edges randomly.
- (2)
- Execute Kruskal algorithm to obtain spanning tree structures. The states of the reserved line switches are recorded as 1 and those of the disconnected line switches are recorded as 0 in the individual information, according to the obtained spanning tree structure.
- (3)
- Generate the states of load switches randomly and judge them according to the rule: if the retained load power is between the minimum retained power and the residual power, save the switches states of this group in the individual; otherwise, generate again.
Since the load shed power will keep changing all the time, the number of load switch states of zero is very small under low shed power. In this case, if the random generation method is adopted, the calculation time will increase significantly. To avoid this problem, we set the generation probability of the states of 0 and 1 according to the residual power to accelerate the formation of the initial population.
4.3. Crossover and Mutation Operation
To ensure that the individuals generated in the whole iteration process meet the topological connectivity, radial operation and no loop formation, the crossover operator is improved by a self-designed multi-point crossover method, and the catastrophe algorithm [35] is applied in the mutation operation. The two main crossover positions in the multi-point crossover method are set at the line switch and the load switch, respectively.
The crossover rule of line switches are as follows: Count the number of switches opened in each loop in parent topologies 1 and 2. Record two switches’ positions and get crossover operation if only one line switch is opened in both topologies and the disconnected positions are different. As shown in Figure 2, there are three loops of (2, 3, 9), (3, 4, 9, 10), and (3, 4, 5, 6, 7, 8) in the network. Loop (2, 3, 9) and loop (3, 4, 5, 6, 7, 8) have only one line switch opened, and the disconnected position is different in two parent topologies. Taking (3, 4, 5, 6, 7, 8) as an example, the opened line switch l34 and l68 are recorded and cross-operated to obtain two offspring with radial topology. Note that a single point crossover rule is applied at the load switch.
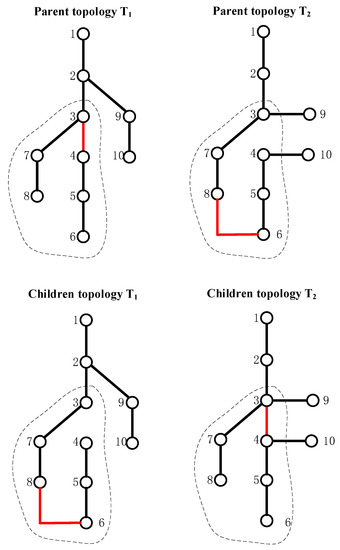
Figure 2.
Crossover operation of network topology.
The line switch mutation rule are as follows: Select only one line switch opened loop in the parent topology and move the disconnected position to other line in this loop to obtain the offspring with radial topology. As shown in Figure 3, taking the circle (3, 4, 5, 6, 7, 8) as an example, line switch l68 is opened in the parent topology. Close l68 and open another line l45 in this loop randomly to obtain the offspring topology. Note that the common mutation rule is adopted at the load switch.
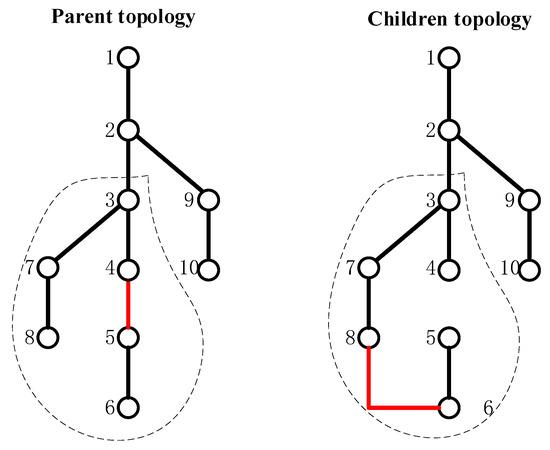
Figure 3.
Mutation operation of network topology.
The catastrophe algorithm is described as follows: If the best fitness value of 15 consecutive generations is the same before the program satisfies the termination condition, change the mutation rate from initial parameter 0.05 to 0.1. This can ensure the diversity of the population and avoid premature convergence. Finally, it is necessary to judge the feasibility of offspring obtained by crossover and mutation. If the spanning tree constraint is not satisfied or the retained load is greater than the system residual power, the population should be regenerated.
5. Case Study
IEEE 33 distribution network contains 32 branches, 5 tie branches, and 1 power supply. The first reference voltage is 12.66 kV and the three-phase power reference value is 10 MVA. The total network load is 5084.26 + 2547.32 j kVA. The basic network structure and the basic loops are given in Figure 4, and the parameters of each branch and load are given in Appendix A. Using the static load model, the total power consumption and the user load of the system are 3917.65 kW and 3715 kW normally. The initial power loss is 202.65 kW. The lowest bus bar voltage is 0.9133 p.u., and the five tie switches are normally open.
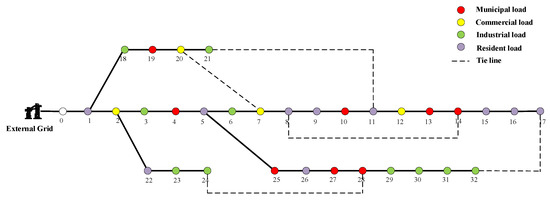
Figure 4.
IEEE 33 Distribution Network.
5.1. Validation of Distribution Network Reconfiguration
In this section, the effectiveness of the distribution network reconfiguration model is verified by solving the model to minimize the power loss of the network. Note that the state variables of the load switches are ignored. The parameters adopted in genetic algorithm are set as follows: the initial population size is 100 and the maximum iteration number is 50.
As shown in Figure 5, the optimal topology obtained by the proposed method is (7, 9, 14, 32, 37), which is the same as those in references [13,19]. After reconfiguration, the total power consumption and the active power loss of IEEE33 system are 3845.47 kW and 139.47 kW, implying a reduction of 31.18% in total power loss. The minimum node voltage of the system is improved to 0.9378 p.u., which is 2.68% higher than that of the initial structure. Thus, it can be concluded that the proposed model enables to obtain a better radial distribution network topology with smaller power loss and voltage difference of nodes when compared with the initial distribution network.
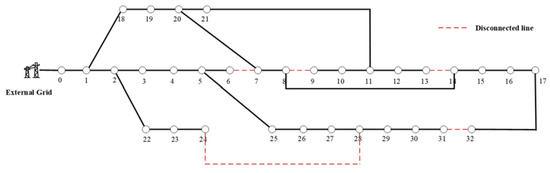
Figure 5.
Radial structure of IEEE distribution network.
5.2. Load Shedding Optimization Based on Distribution Network Reconfiguration
5.2.1. Scenario 1: Power Output Fluctuation of Main Grid
Assume that the maximum active power input of IEEE33 distribution network is 4000 kW and the synchronous generators such as thermal power and hydropower, and the DG such as wind power and photovoltaic generator contribute the same proportion of 50%. It is well known that the outputs of wind power and photovoltaic power are easily affected by seasons and weather changes, featuring significant uncertainty. In this scenario, based on the proposed reconfiguration-load shedding coordination optimization model, the effects of DG output on the distribution network topology, shed power, economic loss and the number of shedding users are explored during the change of DG total power output from 0 kW to 2000 kW with a step of 100 kW. The initial population size is set to 500 and the maximum iteration number is 100.
Figure 6 shows the comparison of load shedding results obtained by different methods with objective function 1. The results of multi-step load shedding method (MS), load shedding method without network reconfiguration (IS), and reconfiguration–load shedding method (RS) are separately denoted by a black column, a red column, and a blue column. Figure 7 and Figure 8 present the comparison of economic loss and the number of shedding users corresponding to the three load shedding methods.
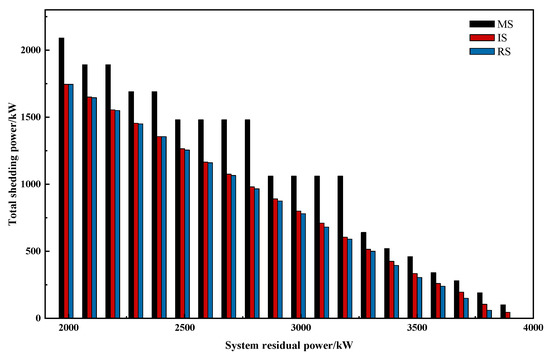
Figure 6.
Comparison of the total shed power after the load shedding.
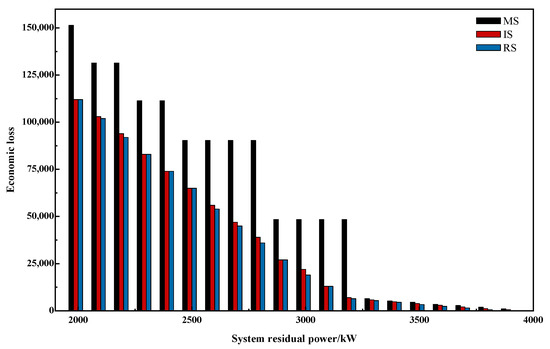
Figure 7.
Comparison of the economic loss after the load shedding.
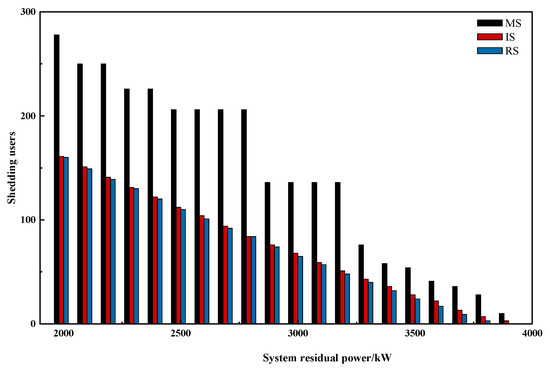
Figure 8.
Comparison of the total shedding users after the load shedding.
The results reveal that the shed power, economic loss, and the number of shedding users determined by IS and RS methods are far lower than those obtained by MS method. This is because as one of the precedence order methods, the main idea of the MS method is to form the load round table after prioritizing the interruptible load and then to shed load from low priority to high priority. The over-shed power is thus only determined by the active power Pj of a certain node. It can be seen that when the residual power of the system is in the intervals of (2600 kW, 2800 kW) and (3000 kW, 3200 kW), a large over-shed power of the whole system occurs due to the high active power Pj of node j. Moreover, the MS method ignores the fact that the system power loss after load shedding will be greatly reduced, resulting in an incomplete utilization of some active powers. However, in the case of the same distribution network structure, converting the shed power into the system residual power by the load retention idea, and using the genetic algorithm to solve the load shedding optimization problem can avoid the large over-shedding power caused by the MS method. In the meanwhile, the utilization rate of residual power can be improved and better load shedding results can be obtained.
Taking the test point with 3900 kW residual power as an example, it can be found that it does not require load shedding operation when the RS method is adopted, whereas 45 kW active load should be shed when IS method is used. To explore the reasons, the network losses under different residual power values are analyzed, as shown in Figure 9. Results in Figure 9 suggest that the shed power reduced by the MS method is not obvious when the system residual power is small (<3000 kW). This is because that the MS method reduces the network loss by adjusting the distribution network topology to achieve the purpose of less load shedding. Since the network loss is much smaller than the total load, the shed power reduced by the MS method is limited and will be affected by the system residual power of the distribution network. Theoretically, the power loss and the reduced shed power will decrease with the system residual power. However, the advantages of the MS method in reducing network loss are gradually highlighted under large system residual power, greater than 3000 kW for example, which effectively reduces the total load shedding. Therefore, it can be inferred that when the system residual power is in the interval of (3845.47 kW, 3917.65 kW), the power balance of the system can be sufficiently satisfied by reconfiguring the distribution network topology instead of performing the load shedding operation.
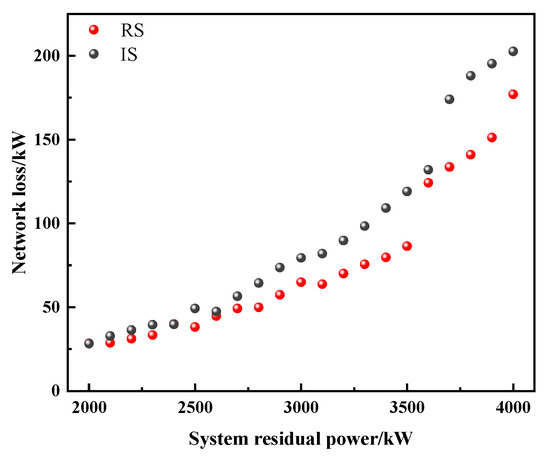
Figure 9.
Comparison of the network loss under different residual power of the system.
Table 1 summarizes ten distinct radial topologies of IEEE33 system obtained by RS method with objective function 1, indicating that the distribution network topology obtained by RS method changes with the residual power. It should be noted that the network topologies numbered as 1, 2, 4, 5, 7, and 9 appear once and 3 and 8 appear twice, while the rest is the same as the distribution network structure after reconfiguration in Section 4.1.

Table 1.
Topology analysis of reconfiguration-load shedding method.
According to Figure 6 and Figure 7, it can be found that the shed load and network loss are reduced more obviously when the residual power of the system is 2800 kW. Figure 10 shows the disconnected load distribution and network topology difference among the three methods under objective function 1. It can be seen that there is no obvious rule in the disconnected load distribution obtained by IS method, whereas the load shedding points determined by the RS method are close to the end of the branch. This is also the case at other test points. It suggests that the RS method will preferentially shed the load at the end of each branch to maintain the power balance of the system and achieve the minimum network loss and the lowest shed power.
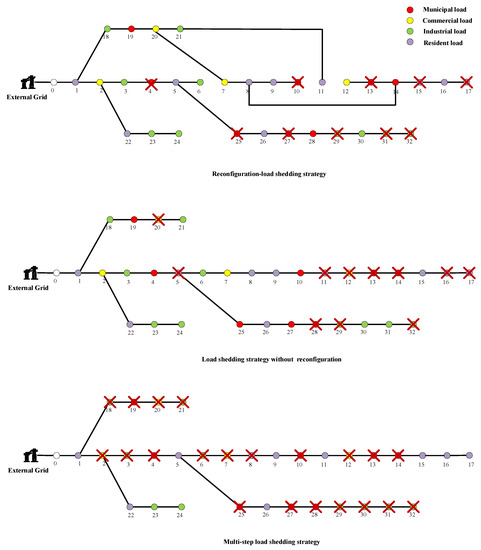
Figure 10.
Removed loads distribution with the lowest shed power as the main objective.
Figure 11 shows the disconnected load distributions and network topologies of the three methods under objective function 2. Results show that the disconnected load distributions corresponding to IS method and RS method are similar, where the residential loads with lower priority are removed first. The difference is that the IS method disconnects the industrial load of node 3 (120 kW), whereas the RS method disconnects the industrial load of node 18 (90 kW) so as to further reduces the shed load. These results prove that the proposed RS method is capable of selecting an appropriate network topology according to the system residual power and making the residual power distribution more reasonable.
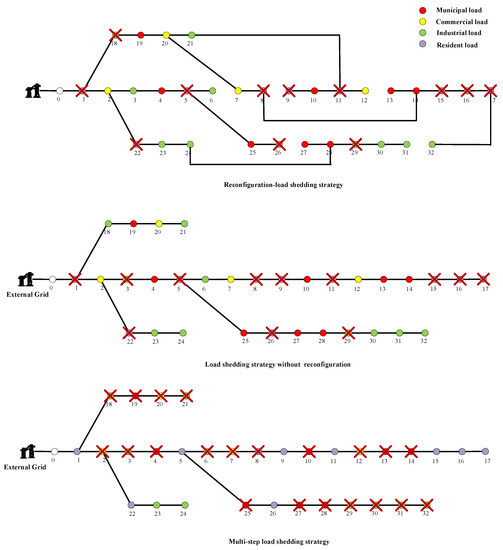
Figure 11.
Removed loads distribution with the lowest economic loss as the main objective.
5.2.2. Scenario 2: Power Fluctuation of Main Grid Combined with Transmission Line Fault
Assume that the active power provided by the main grid is only 2800 kW due to power fluctuation, and the line 3–4 fails to transmit power. To ensure the normal operation of the distribution network, it is necessary to reconfigure the topology of the distribution network to meet the topological connectivity and radiation, and to shed loads to ensure the power balance of the system at the same time. Since the MS method and the IS method are only applicable to distribution networks with the fixed topology, they are not suitable to this scenario. Thus, only the RS method can be applied to fix this problem with the following procedure:
- (1) Delete the fault line from the branch switch information matrix;
- (2) Generate an initial population by Kruskal algorithm;
- (3) Judge the individuals after crossover and mutation. If the switch of line 3–4 in the individual is closed, the individual is re-generated.
Figure 12 is the disconnected load distribution obtained by RS method under the objective function 1. The total shed power is 980 kW, which is slightly higher than that in Figure 6 (965 kW) when the line state is normal. It suggests that the RS method is not limited by individual line fault, and can find the optimal topology and the corresponding load shedding node combination in the remaining distribution network structures according to the line fault information. Compared with the existing load shedding methods, the proposed RS method has more advantages in this complex environment with both power fluctuation and line fault.
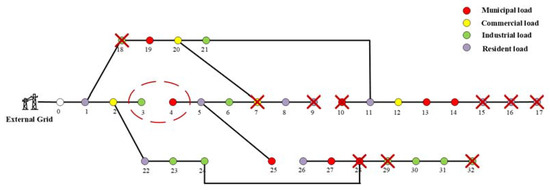
Figure 12.
Removed loads distribution in Scenario 2.
5.3. Effectiveness Analysis of the Improved GA
In this section, the improved genetic algorithm (IGA) and the traditional GA are used to optimize the load shedding scheme with the residual power of 2900 kW, in order to verify the effectiveness of the improvements in GA. The fitness values of the two algorithms are calculated three times respectively, as shown in Figure 13. It can be seen that GA reaches the optimal fitness value of 0.02799 for twice after more than 35 iterations, whereas the IGA finds the optimal fitness value of 0.02799 after less than 25 iterations in the three calculations. It indicates that IGA has better optimization ability and algorithm stability. It can also be seen from Figure 13 that the improvement of population generation method improves the overall quality of the initial population, while the improvement of crossover and mutation operators enhances the search ability of the algorithm. All these practices accelerate the convergence rate and improve the stability of the algorithm.
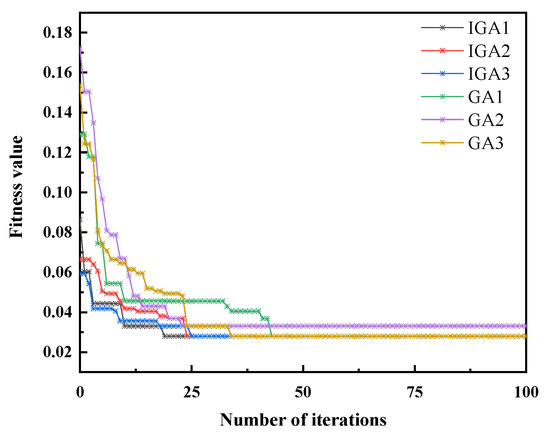
Figure 13.
Comparison of the fitness values obtained by various GAs.
6. Conclusions
In this work, a coordination optimization method for load shedding based on distribution network reconfiguration is proposed in this paper. A mathematical optimization model of reconfiguration–load shedding is first established with the consideration of tie switches, sectional switches, and load switches in the distribution network, and a solution strategy combined minimum spanning tree algorithm with genetic algorithm is trailed according to the characteristics of high dimension and nonlinearity of the model. The application of the proposed method is finally verified via IEEE33 system.
Results show that the introduction of the network reconfiguration in load shedding optimization is beneficial to adjust the topology of distribution networks and further reduces the network loss, the economic loss, and the number of shedding users. Compared with the existing load shedding methods, the proposed reconfiguration–load shedding method shows more advantages in a complex environment that involves both power fluctuations and line faults. Moreover, the trailed GA-based solving strategy can effectively deal with the nonlinear constraints of the power flow equations and reduce the number of the variables in load shedding model, further improving the solving efficiency of the reconfiguration–load shedding model. Future work will focus on the improvement of this method by applying it to large-scale systems and comparing the results with the latest load shedding methods.
Author Contributions
Conceptualization, K.W. and L.K.; Data curation, K.W.; Formal analysis, K.W. and L.K.; Funding acquisition, L.K. and S.Y.; Investigation, S.Y.; Methodology, K.W. and L.K.; Project administration, S.Y.; Software, K.W.; Supervision, L.K. and S.Y.; Validation, L.K.; Visualization, K.W.; Writing—original draft, K.W.; Writing—review & editing, L.K. and S.Y. All authors have read and agreed to the published version of the manuscript.
Funding
This research was funded by the projects (No. 52007143) sponsored by the National Natural Science Foundation of China (NSFC) and the key Research and Development Project of Shaanxi Province (No. 2022GY-185).
Conflicts of Interest
The authors declare no conflict of interest.
Appendix A
Table A1.
IEEE 33 System Parameter.
Table A1.
IEEE 33 System Parameter.
| Node i | Node j | Branch Impedance | Load at Node j/kW | Load Type | Load Priority | Users’ Number |
|---|---|---|---|---|---|---|
| 0 | 1 | 0.0922 + 0.047 j | 100 + 60 j | Resident | 3 | 10 |
| 1 | 2 | 0.4930 + 0.2511 j | 90 + 40 j | Commercial | 2 | 9 |
| 2 | 3 | 0.3660 + 0.1864 j | 120 + 80 j | Industrial | 2 | 10 |
| 3 | 4 | 0.3811 + 0.1941 j | 60 + 30 j | Municipal | 1 | 7 |
| 4 | 5 | 0.8190 + 0.7070 j | 60 + 20 j | Resident | 3 | 5 |
| 5 | 6 | 0.1872 + 0.6188 j | 200 + 100 j | Industrial | 2 | 24 |
| 6 | 7 | 0.7114 + 0.2351 j | 200 + 100 j | Commercial | 2 | 28 |
| 7 | 8 | 1.0300 + 0.7400 j | 60 + 20 j | Resident | 3 | 3 |
| 8 | 9 | 1.0440 + 0.7400 j | 60 + 20 j | Resident | 3 | 7 |
| 9 | 10 | 0.1966 + 0.065 j | 45 + 30 j | Municipal | 1 | 4 |
| 10 | 11 | 0.3744 + 0.1238 j | 60 + 35 j | Resident | 3 | 6 |
| 11 | 12 | 1.4680 + 1.155 j | 60 + 35 j | Commercial | 2 | 7 |
| 12 | 13 | 0.5416 + 0.7129 j | 120 + 80 j | Municipal | 1 | 18 |
| 13 | 14 | 0.5910 + 0.526 j | 60 + 10 j | Municipal | 1 | 10 |
| 14 | 15 | 0.7463 + 0.545 j | 60 + 20 j | Resident | 3 | 4 |
| 15 | 16 | 1.2890 + 1.721 j | 60 + 20 j | Resident | 3 | 12 |
| 16 | 17 | 0.3720 + 0.574 j | 90 + 40 j | Resident | 3 | 18 |
| 1 | 18 | 0.164 + 0.1565 j | 90 + 40 j | Industrial | 2 | 16 |
| 18 | 19 | 1.5042 + 1.3554 j | 90 + 40 j | Municipal | 1 | 20 |
| 19 | 20 | 0.4095 + 0.4784 j | 90 + 40 j | Commercial | 2 | 10 |
| 20 | 21 | 0.7089 + 0.9373 j | 90 + 40 j | Industrial | 2 | 6 |
| 2 | 22 | 0.4512 + 0.3083 j | 90 + 50 j | Resident | 3 | 8 |
| 22 | 23 | 0.8980 + 0.7091 j | 420 + 200 j | Industrial | 2 | 60 |
| 23 | 24 | 0.8960 + 0.7011 j | 420 + 200 j | Industrial | 2 | 70 |
| 5 | 25 | 0.203 + 0.1034 j | 60 + 25 j | Municipal | 1 | 6 |
| 25 | 26 | 0.2842 + 0.1447 j | 60 + 25 j | Resident | 3 | 6 |
| 26 | 27 | 1.0590 + 0.9337 j | 60 + 20 j | Municipal | 1 | 6 |
| 27 | 28 | 0.8042 + 0.7006 j | 120 + 70 j | Municipal | 1 | 11 |
| 28 | 29 | 0.5075 + 0.2585 j | 200 + 600 j | Industrial | 2 | 19 |
| 29 | 30 | 0.9744 + 0.9630 j | 150 + 70 j | Industrial | 2 | 14 |
| 30 | 31 | 0.3105 + 0.3619 j | 210 + 100 j | Industrial | 2 | 20 |
| 31 | 32 | 0.3410 + 0.5362 j | 60 + 40 j | Commercial | 2 | 6 |
| 7 | 20 | 2 + 2 j | Tie line | |||
| 8 | 14 | 2 + 2 j | Tie line | |||
| 11 | 21 | 2 + 2 j | Tie line | |||
| 17 | 32 | 0.5 + 0.5 j | Tie line | |||
| 24 | 28 | 0.5 + 0.5 j | Tie line |
References
- Silva, M.; Morais, H.; Vale, Z. An integrated approach for distributed energy resource short-term scheduling in smart grids considering realistic power system simulation. Energy Convers. Manag. 2012, 64, 273–288. [Google Scholar] [CrossRef]
- Aghamohammadi, M.R.; Shahmohammadi, A. Intentional islanding using a new algorithm based on ant search mechanism. Int. J. Electr. Power Energy Syst. 2012, 35, 138–147. [Google Scholar] [CrossRef]
- Jallad, J.; Mekhilef, S.; Mokhlis, H.; Laghari, J.; Badran, O. Application of hybrid meta-heuristic techniques for optimal load shedding planning and operation in an islanded distribution network integrated with distributed generation. Energies 2018, 11, 1134. [Google Scholar] [CrossRef]
- Sapari, N.M.; Mokhlis, H.; Laghari, J.A.; Bakar, A.H.A.; Dahalan, M.R.M. Application of load shedding schemes for distribution network connected with distributed generation: A review. Renew. Sustain. Energy Rev. 2018, 82, 858–867. [Google Scholar] [CrossRef]
- Li, R.; Wang, W.; Wu, X.; Tang, F.; Chen, Z. Cooperative planning model of renewable energy sources and energy storage units in active distribution systems: A bi-level model and pareto analysis. Energy 2019, 168, 30–42. [Google Scholar] [CrossRef]
- Karimi, M.; Mohamad, H.; Mokhlis, H.; Bakar, A.H.A. Under-frequency load shedding scheme for islanded distribution network connected with mini hydro. Int. J. Electr. Power Energy Syst. 2012, 42, 127–138. [Google Scholar] [CrossRef]
- Ketabi, A.; Hajiakbari Fini, M. Adaptive underfrequency load shedding using particle swarm optimization algorithm. J. Appl. Res. Technol. 2017, 15, 54–60. [Google Scholar] [CrossRef]
- Razmi, H.; Shayanfar, H.A.; Teshnehlab, M. Steady state voltage stability with avr voltage constraints. Int. J. Electr. Power Energy Syst. 2012, 43, 650–659. [Google Scholar] [CrossRef]
- Hashiesh, F.; Mostafa, H.E.; Khatib, A.R.; Helal, I.; Mansour, M.M. An intelligent wide area synchrophasor based system for predicting and mitigating transient instabilities. IEEE Trans. Smart Grid 2012, 3, 645–652. [Google Scholar] [CrossRef]
- Xue, Y.; Xiao, S. Generalized congestion of power systems: Insights from the massive blackouts in India. J. Mod. Power Syst. Clean Energy 2013, 1, 91–100. [Google Scholar] [CrossRef]
- Fu, X.; Wang, X. Determination of load shedding to provide voltage stability. Int. J. Electr. Power Energy Syst. 2011, 33, 515–521. [Google Scholar] [CrossRef]
- Mostafa, M.A.; El-Hawary, M.E.; Mbamalu, G.A.N.; Mansour, M.M.; El-Nagar, K.M.; El-Arabaty, A.M. A computational comparison of steady state load shedding approaches in electric power systems. IEEE Trans. Power Syst. 1997, 12, 30–37. [Google Scholar] [CrossRef]
- Shimoda, A.; Sunada, T. Priority order determination method for extracting services stepwise from monolithic system. In Proceedings of the 2018 7th International Congress on Advanced Applied Informatics (Iiai-Aai), Yonago, Japan, 8–13 July 2018. [Google Scholar]
- Shekari, T.; Gholami, A.; Aminifar, F.; Sanaye-Pasand, M. An adaptive wide-area load shedding scheme incorporating power system real-time limitations. IEEE Syst. J. 2018, 12, 759–767. [Google Scholar] [CrossRef]
- Brown, W.E.; Moreno-Centeno, E. Transmission-line switching for load shed prevention via an accelerated linear programming approximation of ac power flows. IEEE Trans. Power Syst. 2020, 35, 2575–2585. [Google Scholar] [CrossRef]
- Hosseinnezhad, V.; Rafiee, M.; Ahmadian, M.; Siano, P. Optimal island partitioning of smart distribution systems to improve system restoration under emergency conditions. Int. J. Electr. Power Energy Syst. 2018, 97, 155–164. [Google Scholar] [CrossRef]
- Ding, Z.; Cartes, D.A.; Srivastava, S. New load shedding scheme for islanded power systems. In Proceedings of the 2006 Ieee/Smc International Conference on System of Systems Engineering, Los Angeles, CA, USA, 24–26 April 2006. [Google Scholar]
- Laghari, J.A.; Mokhlis, H.; Karimi, M.; Bakar, A.H.A.; Mohamad, H. A new under-frequency load shedding technique based on combination of fixed and random priority of loads for smart grid applications. IEEE Trans. Power Syst. 2015, 30, 2507–2515. [Google Scholar] [CrossRef]
- Choi, Y.; Lim, Y.; Kim, H.-M. Optimal load shedding for maximizing satisfaction in an islanded microgrid. Energies 2017, 10, 45. [Google Scholar] [CrossRef]
- Fitri, I.R.; Kim, J.-S. Economic dispatch problem using load shedding: Centralized solution. IFAC-PapersOnLine 2019, 52, 40–44. [Google Scholar] [CrossRef]
- Sadati, N.; Amraee, T.; Ranjbar, A.M. A global particle swarm-based-simulated annealing optimization technique for under-voltage load shedding problem. Appl. Soft Comput. 2009, 9, 652–657. [Google Scholar] [CrossRef]
- Hong, Y.; Chen, P. Genetic-based underfrequency load shedding in a stand-alone power system considering fuzzy loads. IEEE Trans. Power Deliv. 2012, 27, 87–95. [Google Scholar] [CrossRef]
- Hong, Y.Y.; Hsiao, C.Y. Under-frequency load shedding in a standalone power system with wind-turbine generators using fuzzy pso. IEEE Trans. Power Deliv. 2022, 37, 1140–1150. [Google Scholar] [CrossRef]
- Rao, R.S.; Narasimham, S.V.L.; Raju, M.R.; Rao, A.S. Optimal network reconfiguration of large-scale distribution system using harmony search algorithm. IEEE Trans. Power Syst. 2011, 26, 1080–1088. [Google Scholar]
- Dorostkar-Ghamsari, M.R.; Fotuhi-Firuzabad, M.; Lehtonen, M.; Safdarian, A. Value of distribution network reconfiguration in presence of renewable energy resources. IEEE Trans. Power Syst. 2016, 31, 1879–1888. [Google Scholar] [CrossRef]
- Lee, C.; Liu, C.; Mehrotra, S.; Bie, Z. Robust distribution network reconfiguration. IEEE Trans. Smart Grid 2015, 6, 836–842. [Google Scholar] [CrossRef]
- López, J.C.; Lavorato, M.; Rider, M.J. Optimal reconfiguration of electrical distribution systems considering reliability indices improvement. Int. J. Electr. Power Energy Syst. 2016, 78, 837–845. [Google Scholar] [CrossRef]
- Mahdavi, M.; Alhelou, H.H.; Bagheri, A.; Djokic, S.Z.; Ramos, R.A.V. A comprehensive review of metaheuristic methods for the reconfiguration of electric power distribution systems and comparison with a novel approach based on efficient genetic algorithm. IEEE Access 2021, 9, 122872–122906. [Google Scholar] [CrossRef]
- Lavorato, M.; Franco, J.F.; Rider, M.J.; Romero, R. Imposing radiality constraints in distribution system optimization problems. IEEE Trans. Power Syst. 2012, 27, 172–180. [Google Scholar] [CrossRef]
- Fan, Z.; Cheng, C.S. A modified newton method for radial distribution system power flow analysis. IEEE Trans. Power Syst. 1997, 12, 389–397. [Google Scholar]
- Kruskal, J.B. On the shortest spanning subtree of a graph and the traveling salesman problem. Proc. Am. Math. Soc. 1956, 7, 48–50. [Google Scholar] [CrossRef]
- Habib, H.U.R.; Subramaniam, U.; Waqar, A.; Farhan, B.S.; Kotb, K.M.; Wang, S. Energy cost optimization of hybrid renewables based v2g microgrid considering multi objective function by using artificial bee colony optimization. IEEE Access 2020, 8, 62076–62093. [Google Scholar] [CrossRef]
- Liu, H.; Ji, Y.; Zhuang, H.; Wu, H. Multi-objective dynamic economic dispatch of microgrid systems including vehicle-to-grid. Energies 2015, 8, 4476–4495. [Google Scholar] [CrossRef]
- Cheng, Y.-F.; Shao, W.; Zhang, S.-J.; Li, Y.-P. An improved multi-objective genetic algorithm for large planar array thinning. IEEE Trans. Magn. 2016, 52, 1–4. [Google Scholar] [CrossRef]
- Sen, O.; Shi, X. Improved catastrophic genetic algorithms and its application in reactive power optimization. In Proceedings of the 2010 Asia-Pacific Power and Energy Engineering Conference, Chengdu, China, 28–31 March 2010. [Google Scholar]


Publisher’s Note: MDPI stays neutral with regard to jurisdictional claims in published maps and institutional affiliations. |
© 2022 by the authors. Licensee MDPI, Basel, Switzerland. This article is an open access article distributed under the terms and conditions of the Creative Commons Attribution (CC BY) license (https://creativecommons.org/licenses/by/4.0/).