
CO2 Emissions of Electric Scooters Used in Shared Mobility Systems


Department of Road Transport, Faculty of Transport and Aviation Engineering, Silesian University of Technology, 8 Krasińskiego Street, 40-019 Katowice, Poland
Energies 2022, 15(21), 8188; https://doi.org/10.3390/en15218188
Submission received: 8 September 2022
/
Revised: 26 September 2022
/
Accepted: 31 October 2022
/
Published: 2 November 2022
(This article belongs to the Special Issue Energy Transfer in Alternative Vehicles)
Abstract
:The development of the electric mobility market in cities is becoming more and more important every year. With this development, more and more electric scooters are appearing in cities. Currently, the restrictions that result from the upcoming trends are reducing the number of vehicles powered by combustion engines in favor of vehicles equipped with electric motors. Considering the number of electric vehicles, the dominant type is an electric scooter. The aim of this article is to determine the CO2 that is emitted into the atmosphere by using this type of vehicle. The main suppliers of this type of vehicle in cities are shared mobility systems. To recognize the research gap, consisting of the lack of CO2 emissions of an electric scooter type vehicle, studies were carried out on the energy consumption of an electric scooter and CO2 emissions, which were calculated based on the CO2 emission value needed to produce a given energy value kWh. The plan of the research performed was developed on the basis of the D-optimal plan of the experiment, thanks to which the results could be saved in the form of mathematical models based on formulas.
1. Introduction
Climate change happening in the world forces man to become more and more interested in harmful gases produced by humanity. One of the harmful greenhouse gases, whose emissions in 2010 amounted to up to 76%, is CO2 gas [1]. Noticing the harmful effects of CO2 emissions into the atmosphere, humanity strives to reduce CO2 emissions in all branches of the economy [2]. One of the solutions to reduce CO2 emissions is to introduce policies that aim to reduce the use of gas emission sources—vehicles powered by internal combustion engines. Policies introduced in many countries around the world are coordinating the use of electric vehicles to mix in urban agglomerations [1,3].
To reduce CO2 emissions, the Scandinavian countries have introduced a tax for owners of vehicles with an internal combustion engine that is 180% higher than the value of the tax on an electric vehicle [4]. In addition, owners of electric vehicles can count on free charging and parking of their vehicle in the city. The Chinese government is also paying a lot of attention to the development, research, and implementation of electrical vehicles. In addition, China is among the leading countries to demand an end to the use of internal combustion vehicles in favor of electric vehicles.
Another major contributing factor to CO2 production is the planning of fossil fuels, from which many countries in the world produce electricity [5].
Therefore, it can be concluded that the elimination of vehicles with internal combustion engines, in favour of electric vehicles, could result in a drastic reduction in CO2 emissions in cities since electric vehicles are advertised and presented as zero emission vehicles [6]. The question must therefore be asked: is the use of an electric vehicle a zero-emission vehicle? The research and results presented in this article indicate the answer to the question asked above.
With the development of electromobility and the emergence of electric vehicles, the availability of electric scooter vehicles in cities has increased exponentially. Kwangho et al. [7] found that the electric scooter works well as a last mile vehicle.
An electric scooter is a small device that allows you to move in an urban agglomeration, which is equipped with a low-power electric motor (usually about 300 W) and a battery that allows you to drive up to several dozen kilometers (depending on the scooter model) [8]. Due to the fact that electric scooters are available at every step in cities [9], and due to the possibility of their short-term rental from shared mobility systems, a research gap was noticed. What is the CO2 emission of an electric scooter? What is the difference between the emission of an electric scooter and a motor vehicle with an internal combustion engine? It is worth emphasizing that the number of scooter vehicles moving around the city can be from several to several times higher than motor vehicles with electric drive [10]. For example, in Poland in 2021, there were about 8000 vehicles with an electric motor, whereas there were over 500% more available electric scooters [11]. Therefore, an electric scooter is one of the possible ways to increase the level of environmental performance of transport while having a positive impact on the economic aspects and quality of life of residents [12,13]. The introduction of this type of vehicle has also forced a number of actions that led to changes in the culture of movement in terms of orientation towards electric vehicles, which are referred to as electromobility [14]. The entire article is divided into four main chapters. The first is an introduction. Another is the description of the methodology and materials used in the research. The next chapter presents the results. The article ends with a chapter where the research results were discussed and related to the research of other scientists.
2. Materials and Methods
The subject used to conduct research is an electric scooter used in shared mobility systems, which is available in many urban agglomerations. The scooter was equipped with an electric motor with a power of 300 W and a battery capacity of 475 Wh. Figure 1 show an electric scooter and examples of values recorded during the tests.
The research plan assumed that the rides made with an electric scooter would correspond to the routes and driving style of the users of these systems. Then, determining the value of electricity consumption for the tests carried out, calculations were made regarding CO2 emissions, which is the result of the consumption of electricity necessary to perform such a trip. The diagram of the research is shown in Figure 2.
The first step was theoretical preparation for the assumed research. The next step (the most important) was to properly plan the research. On the basis of the literature, the factors influencing the value of energy consumption of an electric scooter have been determined. After selecting the experiment factors, the plan was selected, thanks to which it is possible to determine individual passes that are necessary for the mathematical modeling of the studied phenomenon [15,16]. Experimental studies were carried out according to a statistically established plan of a polyselective experiment. The third step was to determine CO2 emissions based on electricity consumption. The last step of the research was the analysis of the obtained results and the presentation of appropriate conclusions.
Planning an experiment according to the D-optimal plan—Hartley’s plan—is one of the methods of describing phenomena. Hartley’s plan belongs to static, determined polyselection plans for three input values in which three different values are used for each input quantity The basic principle of creating polyselection plans is the deliberate selection of a combination of values of input quantities (within the previously assumed range) in such a way that it is possible to obtain the required scientific information under limited conditions [16]. The development of the plan consists of determining the dependence of the input quantities and their location relative to the base point—middle, zero. The experimental plans developed for the three input factors are based on a hypercube for which the coefficient α = 1. The entry factors that were selected for the experiment plan are: x1—the type of surface on which the scooter moves; x2—the distance covered; and x3—the scooter riding mode. Selected factors x1, x2, and x3 are factors that, in particular, affect the possibility of differentiating the energy consumption of the scooter—results from the kinematics of moving the vehicle and attempts to simulate different driving styles of users. Factor x3—the type of riding mode—limited the speed of movement of the scooter. In ECO mode, the maximum speed is 12 km/h; in NORMAL mode, the maximum speed is 20 km/h; and in TURBO mode, the maximum speed is 25 km/h. The overall form of the experiment plan on a standardized scale is restated in Table 1.
Thanks to the use of the general form of the experiment plan, it was possible to prepare a plan of experiments described in the makings on a real scale. Input factors have been introduced in the form of Formulas (1)–(3):
Values based on Formulas (1)–(3): −1, 0, and 1 represent the variability of the individual factors x1, x2, and x3. Based on Formula (4), it is possible to reconstruct the mathematical model of the phenomenon under study.
Where:
—results,
—input factor in the normalized scale,
—regression coefficients.
Supplemented by a general table with real-scale factors, Table 2 is shown.
3. Results
The results of the conducted research, which were carried out in accordance with the previously planned experiment plan, pre-set in Table 2, are presented in Table 3. Each run was repeated five times.
Thanks to the obtained results presented in Table 3 and the use of Formula (4), it was possible to determine the dependence of the impact of the selected factors x1, x2, and x3 on the CO2 emission value expressed in kg/100 km unit. Figure 3, Figure 4, Figure 5, Figure 6, Figure 7, Figure 8, Figure 9, Figure 10 and Figure 11 predict the dependence of the type of surface, distance travelled, and driving style on CO2 emissions, although some of the values shown in the diagrams are the result of prediction according to Formula (4). The biggest CO2 emissions will be emitted by moving an electric scooter on a paving stone over a distance of 1 km. The lowest emissions were recorded for a scooter that moves on an asphalt road while covering a 5 km route. It is worth noting that the lowest consumption is almost three times lower than the value of the maximum CO2 emissions that have been achieved.
By analyzing the graphs presented in Figure 3, Figure 4 and Figure 5, it can be concluded that, regardless of the occurrence of the surface, the greatest impact on the emission value will be generated by the distance at which the scooter moves. It is also worth emphasizing that the type of surface affects the range of achieved emission values.
Figure 6, Figure 7 and Figure 8 show the CO2 emission values when travelling different distances with an electric scooter. It is worth noting that the impact of the driving mode generates a linear increase in emission values, while the asphalt surface type generates the lowest CO2 emission values.
Figure 9, Figure 10 and Figure 11 show the CO2 emission values when moving a scooter in different riding modes. The greatest curiosity is the mode of moving the scooter in turbo mode. The extreme of the function is achieved for moving on the road paving stones. For other surfaces, the CO2 emission value is at the same level and increases with increasing distance.
4. Discussion and Conclusions
The results obtained during the research suggest quite interesting and valuable conclusions. The research is a continuation of research that has already been carried out on electric scooters used in urban shared mobility systems. Studies have shown that factors, such as the type of pavement, can influence the value of energy consumption by linear dependence. Additionally, the type of surface that is transversed can cause a twofold increase in CO2 emissions. Another factor, the length of the route, is characterized by the greatest variability of the final results, where electricity consumption and CO2 emissions can be increased by up to three times. The least variability is characterized by scooter riding modes. Choosing the right mode will limit the user’s CO2 emissions according to the presented results, the variability of which is small. The objectives of the study presented in this article have been proven and executed. The results obtained in these studies indicated the dependence of the length of movement of the scooter, the type of surface, and the mode of riding the electric scooter. This fills a research gap among other authors who have conducted research on this subject. Other authors, such as Wang et al., conducted a study of motor vehicles with an internal combustion engine where they focused on the effect of ambient temperature on CO2 emissions. The results indicate that a vehicle in low temperaments (−10 °C) emits more than two times more CO2 than a vehicle used at 40 °C. It is worth noting that the results achieved by a vehicle with an internal combustion engine (gasoline) are about 300 g/km, which gives 30 kg CO2/100 km. An electric scooter achieves a result 10 times smaller [17].
Buberger et al., in their article, touched on the total CO2 emissions resulting from all stages of the vehicle’s life. They found that vehicles running on renewable fuels (e.g., compressed biogas) have a similar impact on climate change as electric vehicles. Moreover, emissions of hybrid and electric vehicles are up to 89% lower compared to vehicles with an internal combustion engine. The total CO2− emissions of a vehicle with an internal combustion engine that burns 7l/100 km is about 49,500 kg. For comparison, an electric vehicle emits about 5500 kg of CO2 [18].
Reducing CO2 emissions is one of the key actions to improve the quality of climate cities. The emergence of alternative vehicles to replace a motor vehicle has made users more and more willing to choose electric scooters as the primary means of transport. When comparing the replacement of one combustion vehicle—or several—with a dozen or so scooters, it is worth considering whether the emission of a dozen or so electric scooters is an acceptable result. Furthermore, the number of electric scooters in cities is growing at an amazing pace. Currently, it is estimated that there are about 360,000 electric scooters in 30 cities in Europe alone [19]. Estimating that electric scooters cover a distance of up to 100 km per week, all electric scooters can emit up to approx. 58,320,000 kg of CO2 per year.
Sovacool, in his article, touched on what values of CO2 emissions are emitted into the atmosphere to produce 1 kWh of energy. Currently, the most advantageous forms of industrial energy production are nuclear power plants, which emit 1.4 g/1 kWh, whereas coal-fired power plant emissions are about 790 g/1 kWh [20]. Furthermore, it should be noted that a nuclear power plant does not directly emit greenhouse gas emissions, and the total CO2emissions result from the life cycle (as a result of the construction and operation of the power plant, the extraction and grinding of uranium, and the decommissioning of the power plant).
To sum up, the research carried out in this article touches on a very interesting and modern form of mobility in cities, which is currently one of the fastest growing branches of vehicle sharing in cities. Moving around with the different power modes of a scooter can more than double CO2 emissions. Cyclically, there are more and more operators providing scooter sharing services in cities, which means that the number of electric scooters in cities is increasing year by year. In the current era, it is necessary to consider, first of all, what source of energy the batteries of electric scooters are charged from. Studies have also shown that the highest CO2 emissions result from the use of energy from coal-fired power plants. Due to the increasing number of scooters in cities, one should consider whether cities should not have energy from renewable sources or, for example, solar energy. Of course, the conducted research also has limitations. Primarily, apart from the measurements made, the other results are the result of prediction, which results from the applied plan of the experiment. Another limitation is the impact of wind, which can increase aerodynamic drag and energy consumption. Studies with the influence of different wind speeds will be carried out in the future. The next planned research will complement the existing research in order to learn about the impact of other factors affecting CO2 emissions, such as electricity consumption or the dressage to which the user of this vehicle is exposed.
Funding
This research received no external funding.
Institutional Review Board Statement
Not applicable.
Informed Consent Statement
Not applicable.
Data Availability Statement
Not applicable.
Conflicts of Interest
The author declares no conflict of interest.
References
- The Emissions Reduction Obligation Quota Policy is Reinforced with Increasing the Share of Renewables in Vehicle Fuels. Available online: https://www.regeringen.se/pressmeddelanden/2020/09/branslebytet-forstarks-med-hogre-inblandning-av-fornybart-i-drivmedel/ (accessed on 7 August 2022).
- European Union. Regulation (EU) 2019/631 of the European Parliament and of the Council of 17 April 2019 setting CO2 emission performance standards for new passenger cars and for new light commercial vehicles, and repealing regulations (EC) No 443/2009 and (EU) No 510/2011. Available online: https://eur-lex.europa.eu/legal-content/PL/TXT/PDF/?uri=CELEX:32019R0631&from=EN (accessed on 7 August 2022).
- Morfeldt, J.; Davidsson Kurland, S.; Johansson, D.J.A. Carbon Footprint Impacts of Banning Cars with Internal Combustion Engines. Transp. Res. Part D Transp. Environ. 2021, 95, 102807. [Google Scholar] [CrossRef]
- Fridstrøm, L. The Norwegian Vehicle Electrification Policy and Its Implicit Price of Carbon. Sustainability 2021, 13, 1346. [Google Scholar] [CrossRef]
- Energy and the Environment Explained. Available online: https://www.eia.gov/energyexplained/energy-and-the-environment/where-greenhouse-gases-come-from.php (accessed on 7 August 2022).
- Towoju, O.A.; Ishola, F.A. A Case for the Internal Combustion Engine Powered Vehicle. Energy Rep. 2020, 6, 315–321. [Google Scholar] [CrossRef]
- Baek, K.; Lee, H.; Chung, J.-H.; Kim, J. Electric Scooter Sharing: How Do People Value It as a Last-Mile Transportation Mode? Transp. Res. Part D Transp. Environ. 2021, 90, 102642. [Google Scholar] [CrossRef]
- Kubik, A. Impact of the Use of Electric Scooters from Shared Mobility Systems on the Users. Smart Cities 2022, 5, 1079–1091. [Google Scholar] [CrossRef]
- Dias, G.; Arsenio, E.; Ribeiro, P. The Role of Shared E-Scooter Systems in Urban Sustainability and Resilience during the Covid-19 Mobility Restrictions. Sustainability 2021, 13, 7084. [Google Scholar] [CrossRef]
- Oeschger, G.; Carroll, P.; Caulfield, B. Micromobility and public transport integration: The current state of knowledge. Transp. Res. Part D Transp. Environ. 2020, 89, 102628. [Google Scholar] [CrossRef]
- The Number of Electric Cars in Poland is Growing! Available online: https://globenergia.pl/rosnie-liczba-samochodow-elektrycznych-w-polsce-efekt-mojego-elektryka/ (accessed on 7 August 2022).
- Pietrzak, K.; Pietrzak, O. Environmental Effects of Electromobility in a Sustainable Urban Public Transport. Sustainability 2020, 12, 1052. [Google Scholar] [CrossRef] [Green Version]
- The Future of Urban Mobility. Towards Networked, Multimodal Cities of 2050. Available online: https://www.adlittle.com/sites/default/files/viewpoints/adl_the_future_of_urban_mobility_report.pdf (accessed on 7 August 2022).
- Ingeborgrud, L.; Ryghaug, M. User perceptions of EVs and the role of EVs in the transition to low-carbon mobility. ECEEE Summer Study Proc. 2017, 325, 893–900. [Google Scholar]
- Turoń, K.; Kubik, A.; Chen, F. Operational Aspects of Electric Vehicles from Car-Sharing Systems. Energies 2019, 12, 4614. [Google Scholar] [CrossRef] [Green Version]
- Polański, Z. Współczesne Metody Badań Doświadczalnych; Wiedza Powrzechna: Warsaw, Poland, 1978. [Google Scholar]
- Wang, Y.; Zhao, H.; Yin, H.; Yang, Z.; Hao, L.; Tan, J.; Wang, X.; Zhang, M.; Li, J.; Lyu, L.; et al. Quantitative Study of Vehicle CO2 Emission at Various Temperatures and Road Loads. Fuel 2022, 320, 123911. [Google Scholar] [CrossRef]
- Buberger, J.; Kersten, A.; Kuder, M.; Eckerle, R.; Weyh, T.; Thiringer, T. Total CO2-Equivalent Life-Cycle Emissions from Commercially Available Passenger Cars. Renew. Sustain. Energy Rev. 2022, 159, 112158. [Google Scholar] [CrossRef]
- Li, A.; Zhao, P.; Liu, X.; Mansourian, A.; Axhausen, K.W.; Qu, X. Comprehensive Comparison of E-Scooter Sharing Mobility: Evidence from 30 European Cities. Transp. Res. Part D Transp. Environ. 2022, 105, 103229. [Google Scholar] [CrossRef]
- Sovacool, B.K. Valuing the Greenhouse Gas Emissions from Nuclear Power: A Critical Survey. Energy Policy 2008, 36, 2950–2963. [Google Scholar] [CrossRef]
Figure 1.
Electric scooter and sample values recorded during the tests.
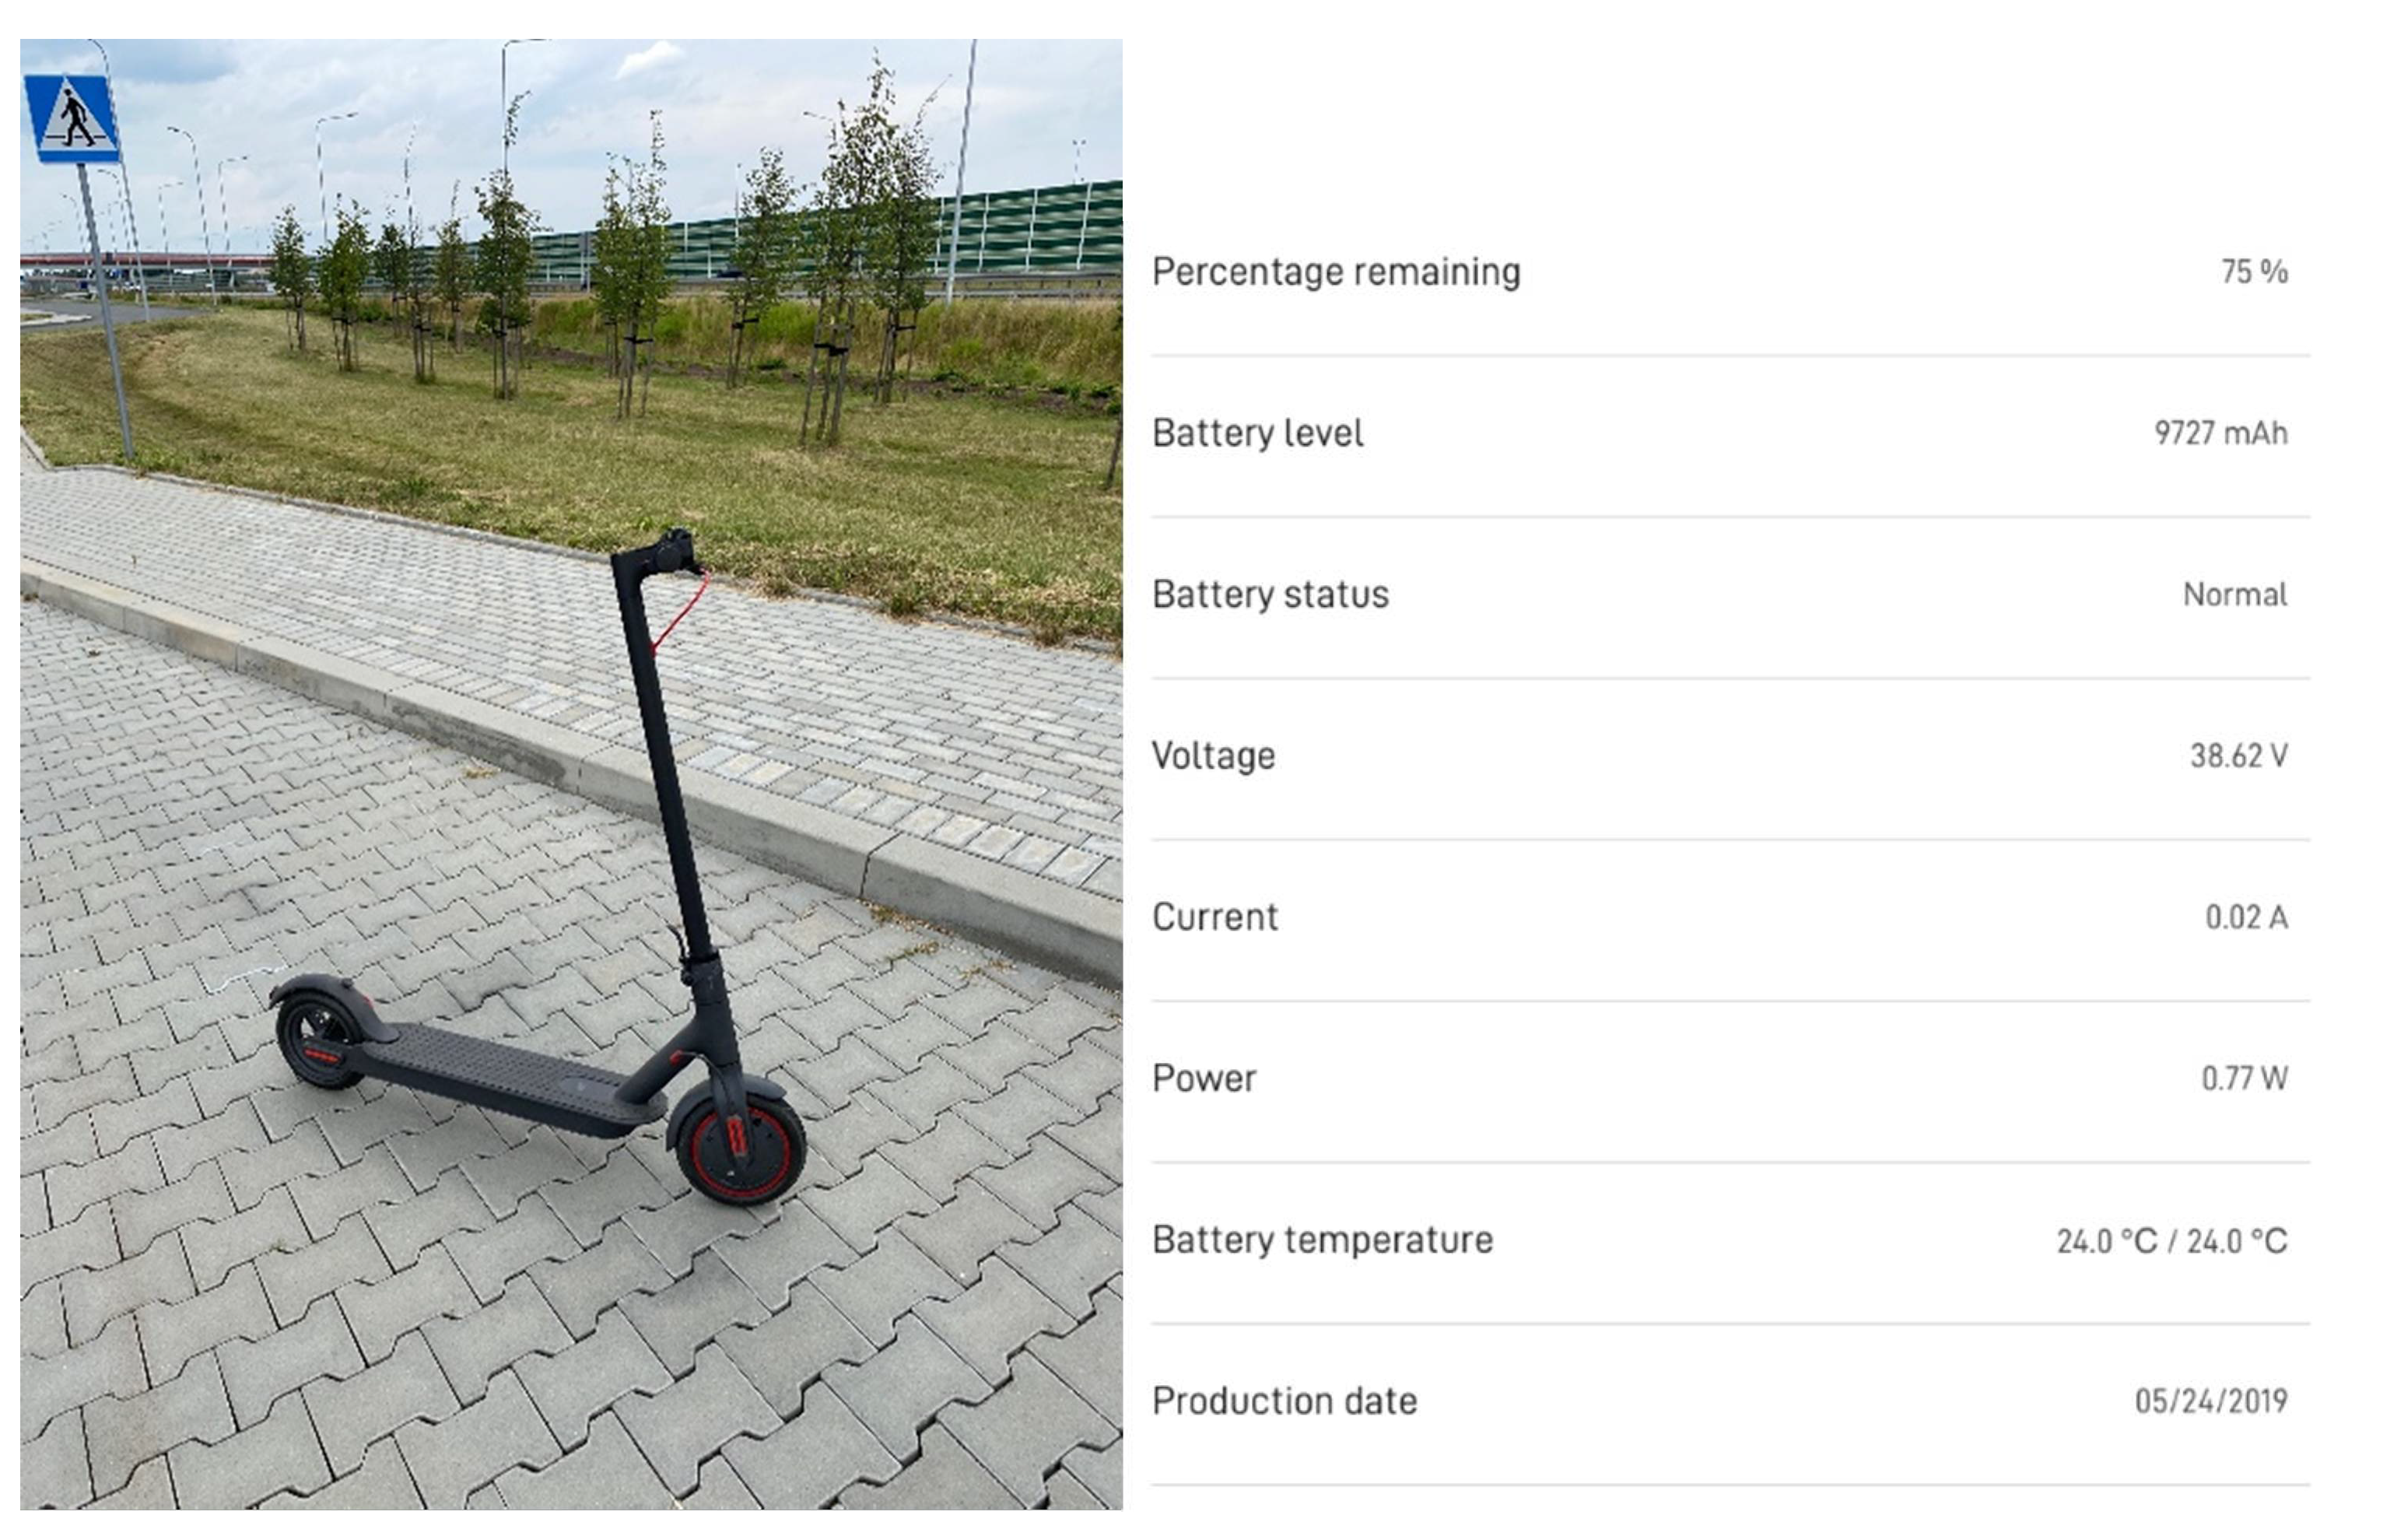
Figure 2.
The diagram of the research implementation plan.

Figure 3.
CO2 emission value depending on driving style and length for asphalt road driving.

Figure 4.
CO2 emission value depending on driving style and length for driving on paving stones.

Figure 5.
CO2 emissions depending on driving style and length for mixed road driving.

Figure 6.
CO2 emissions depending on driving style and type of surface when covering a distance of 1 km.
Figure 6.
CO2 emissions depending on driving style and type of surface when covering a distance of 1 km.

Figure 7.
CO2 emissions depending on driving style and type of surface when covering a distance of 5 km.
Figure 7.
CO2 emissions depending on driving style and type of surface when covering a distance of 5 km.

Figure 8.
CO2 emissions depending on driving style and type of surface when covering a distance of 10 km.
Figure 8.
CO2 emissions depending on driving style and type of surface when covering a distance of 10 km.

Figure 9.
CO2 emission value depending on the length of the route covered and the type of surface for steering in ECO mode.
Figure 9.
CO2 emission value depending on the length of the route covered and the type of surface for steering in ECO mode.

Figure 10.
CO2 emission value depending on the length of the route covered and the type of surface for steering in NORMAL mode.
Figure 10.
CO2 emission value depending on the length of the route covered and the type of surface for steering in NORMAL mode.

Figure 11.
CO2 emission value depending on the length of the route covered and the type of surface for TURBO mode.
Figure 11.
CO2 emission value depending on the length of the route covered and the type of surface for TURBO mode.


Table 1.
Experiment plan for standardized scale factors.
| Route No | X1 | X2 | X3 |
|---|---|---|---|
| 1 | −1 | −1 | 1 |
| 2 | 1 | −1 | −1 |
| 3 | −1 | 1 | −1 |
| 4 | 1 | 1 | 1 |
| 5 | −1 | 0 | 0 |
| 6 | 1 | 0 | 0 |
| 7 | 0 | −1 | 0 |
| 8 | 0 | 1 | 0 |
| 9 | 0 | 0 | −1 |
| 10 | 0 | 0 | 1 |
| 11 | 0 | 0 | 0 |
Table 2.
Experiment plan for real-scale factors.
| Route No | Type of Surface -X1 | Distance -X2 | Driving Type Mode -X3 |
|---|---|---|---|
| 1 | Asphalt/concrete road | 1 | turbo |
| 2 | Road cobblestones | 1 | eco |
| 3 | Asphalt/concrete road | 5 | eco |
| 4 | Road cobblestones | 5 | turbo |
| 5 | Asphalt/concrete road | 3 | normal |
| 6 | Road cobblestones | 3 | normal |
| 7 | Mixed road (50% Asphalt/concrete, 50% Road cobblestones) | 1 | normal |
| 8 | Mixed road (50% Asphalt/concrete, 50% Road cobblestones) | 5 | normal |
| 9 | Mixed road (50% Asphalt/concrete, 50% Road cobblestones) | 3 | eco |
| 10 | Mixed road (50% Asphalt/concrete, 50% Road cobblestones) | 3 | turbo |
| 11 | Mixed road (50% Asphalt/concrete, 50% Road cobblestones) | 3 | normal |
Table 3.
The results of the conducted research.
| Route No | Energy Consumption [kWh/100 km] | CO2 Emissions [kg/100 km] |
|---|---|---|
| 1 | 1.796 | 1.668 |
| 2 | 3.755 | 3.489 |
| 3 | 1.324 | 1.230 |
| 4 | 2.158 | 2.005 |
| 5 | 1.654 | 1.536 |
| 6 | 3.297 | 3.063 |
| 7 | 2.749 | 2.554 |
| 8 | 1.762 | 1.637 |
| 9 | 2.657 | 2.468 |
| 10 | 2.506 | 2.328 |
| 11 | 2.529 | 2.349 |
Publisher’s Note: MDPI stays neutral with regard to jurisdictional claims in published maps and institutional affiliations. |
© 2022 by the author. Licensee MDPI, Basel, Switzerland. This article is an open access article distributed under the terms and conditions of the Creative Commons Attribution (CC BY) license (https://creativecommons.org/licenses/by/4.0/).
Share and Cite
MDPI and ACS Style
Kubik, A. CO2 Emissions of Electric Scooters Used in Shared Mobility Systems. Energies 2022, 15, 8188. https://doi.org/10.3390/en15218188
AMA Style
Kubik A. CO2 Emissions of Electric Scooters Used in Shared Mobility Systems. Energies. 2022; 15(21):8188. https://doi.org/10.3390/en15218188
Chicago/Turabian StyleKubik, Andrzej. 2022. "CO2 Emissions of Electric Scooters Used in Shared Mobility Systems" Energies 15, no. 21: 8188. https://doi.org/10.3390/en15218188
Note that from the first issue of 2016, this journal uses article numbers instead of page numbers. See further details here.