Abstract
Conventional outage management practices in distribution systems are tedious and complex due to the long time taken to locate the fault. Emerging smart technologies and various cloud services offered could be utilized and integrated into the power industry to enhance the overall process, especially in the fault monitoring and normalizing fields in distribution systems. This paper introduces smart fault monitoring and normalizing technologies in distribution systems by using one of the most popular cloud service platforms, the Microsoft Azure Internet of Things (IoT) Hub, together with some of the related services. A hardware prototype was constructed based on part of a real underground distribution system network, and the fault monitoring and normalizing techniques were integrated to form a system. Such a system with IoT integration effectively reduces the power outage experienced by customers in the healthy section of the faulted feeder from approximately 1 h to less than 5 min and is able to improve the System Average Interruption Duration Index (SAIDI) and System Average Interruption Frequency Index (SAIFI) in electric utility companies significantly.
1. Introduction
The smart grid or intelligent grid is a modernized electricity network that can intelligently integrate varieties of digital computing and advanced communication technologies to effectively deliver sustainable, economical, and secure electricity supplies to consumers [1]. The development and implementation of smart grid technologies present numerous challenges, but the challenges continue to motivate electric power industry stakeholders such as utilities, vendors, manufacturers, regulators, governments, and consumers to recognize and address the challenging issues [2]. The smart grid has become the current trend of the grid system and can be described as a modern power generation and distribution infrastructure that can automate and manage the increasing complexity and needs of electricity in the 21st century [3]. To transfer traditional power grids to smart grids, a number of components and technologies have to be developed, such as distributed energy resources (DER), energy storage, power electronics, management (control, automation, monitoring, and protection), and communication [4]. Most electric power utilities use standard reliability metrics, such as the System Average Interruption Frequency Index (SAIFI) or System Average Interruption Duration Index (SAIDI), to evaluate the reliability of their electricity distribution [5]. Some of the parameters, such as interruption duration, the total number of customer interruptions and the total number of customers served, are essential to calculate the SAIDI and SAIFI values, and the shorter the interruption duration or the fewer the number of customer interruptions, the higher the reliability of the utility’s power supply. Supervisory Control and Data Acquisition (SCADA) systems are very well proven within the substation region, but there has been very little monitoring done on the distribution side due to the geographical distribution [6]. Although the SCADA systems used by utility companies have primarily relied on the circuit breaker tripping status to conclude a fault in a particular distribution feeder line, the technical crew still has to be physically dispatched to patrol the specific feeder section to locate the fault and then manually switch to isolate and earth the faulty section. This may take around 45 to 75 min before power is restored to the non-faulty section of the feeder, which only consists of outage report time, travel time for technical crew to reach the area, patrol time, and repair time [7]. Manual operations are usually required to isolate the faulty section, and this can take several hours, during which time many customers are without electricity [8]. For example, to locate a fault after the occurrence of a fault with the operation of protective relays and circuit breakers, a group will be dispatched to the faulted area to anticipate the faulted feeder by reclosing the substation breaker or other protective devices, such as reclosers, to confirm that the anticipated faulty feeder is downstream from the detachment point [9]. During this process, the supply to the consumers may be interrupted. Moreover, this kind of “hit and miss” strategy to identify the faulted feeder segment can result in unnecessary wear on protection equipment on the feeder being tried, reduce hardware life and expand the time required for support [9]. Not only that, testing by switching on the feeder may cause wear on the feeder cable or line and could lead to eventual failure. The proposed fault detection and monitoring via the Internet of Things (IoT) in the distribution feeder network can be used to address the problem above. By applying the concept of IoT, work can be done in a more efficient way as it provides scalability, interoperability, and enhanced security with the IoT platform.
Research Contribution
- ➢
- Design and development of hardware prototype for the fault monitoring and normalizing of a power distribution system based on part of a real distribution network system.
- ➢
- Integration of IoT technology with the power system to gather all the input data from the system and route it to different endpoints for data processing and visualization.
- ➢
- Accomplished field device control from the cloud.
- ➢
- The shortened duration of fault location enables the improvement of the SAIFI and SAIDI indices.
2. Problem Statement
Most utility companies utilize SCADA systems to gather real-time data information about a substation, transfer it back to a central site, and then carry out any necessary analysis and control. After that, the information will be displayed in a logical and organized order for humans to interpret and use accordingly. However, the SCADA system employed in the distribution network can only identify which distribution feeder line is faulty, and the technical crew still has to physically patrol the sections to detect the faulty section along the distribution feeder. It may take up to a few hours before the power supply is restored to the non-faulty feeder section, and all customers will experience power outages throughout the period. These conventional practices for outage management in utility companies are tedious, mainly because the technical crew takes a long time to locate the fault.
3. Literature Review
3.1. Smart Grid Components
To transfer a traditional power grid to a smart grid, a number of components and technologies have to be developed, such as distributed energy resources (DER), energy storage, power electronics, management (control, automation, monitoring, and protection), and communication [4]. The complexity and non-linearity of the power system network structure require comprehensive and developed management and communication components or technologies to ensure the reliability, security, and efficiency of the electric grid.
3.2. Outage Management
The fault management system is critical in grid systems as electrical equipment used in the system is vulnerable to the effect of faults such as short circuits or overloading faults, and if the fault is left unattended, power equipment in the power system and consumers’ equipment will be severely damaged, resulting in outage [8]. The intelligent monitoring and control enabled by modern information and communication technologies have become essential to realize the envisioned smart grid to deliver a reliable, secure, and cost-effective service that is not limited to fault management [9]. More specific capabilities of the fault management system come under the category of DA, which is a set of technologies that are applicable by utility companies to allow the remote monitoring, coordination, and control of distribution components in remote locations based on real-time data from sensors [7]. The number of interrupted customers and the customer interruption duration can be minimized, which is the goal of utility companies, to improve their standard reliability indices, SAIDI and SAIFI [10]. The conventional method for fault detection and service restoration relies on customer reports during outages, where when the fault occurs, customers will call the utility company through the customer service hotline and report the outage [11]. Once the utility receives the report from customers and all the details have been recorded, the utility company will send a technical crew to the reported area to patrol and locate the faulted section. This conventional method for fault detection and service restoration possesses several disadvantages, such as reliability (long customer interruption duration and a large number of customer interruptions), the non-efficient use of personnel and resources, and possible damage to power equipment [7].
3.3. Existing Fault Monitoring Techniques
The key factor to be improved in the conventional method is to identify the exact location of the fault as soon as possible or to be able to anticipate the fault occurrence [7]. By doing so, the technical crew no longer has to spend time patrolling the faulted area and locating the fault and can focus directly on the troubleshooting or repair of the section, and the customer interruption duration can be reduced significantly. Numerous proposals and techniques for identifying and locating faults are available with different capabilities of fault location, and most of them are based on the sensing of the parameters of the fault in transmission or distribution systems with the help of intelligent electronic devices (IEDs) associated with the switches in the feeder network [11]. In [12], a monitoring system of electrical assets that provides a response to an abnormal operating condition of any electrical asset was proposed. The central command processor helps to determine fault location, type, and response using the data obtained from the sensors. The advancement of new technologies and growing real-time monitoring and control capabilities are increasing the feasibility of applying various schemes in a broader fashion in distribution systems. In contrast to the limited real-time data obtained from protective devices due to fewer monitoring devices in the past, now, most distribution equipment, such as power lines, cables, circuit breakers, switches, and transformers, can be monitored to overcome the limitation of the conventional real-time supervision of distribution systems. Moreover, the use of IEDs as controllers based on voltage and current sensors, fault indicators, the utilization of SCADA technologies, the development of automatic meter reading technology, and high-speed communication technologies enables fast and accurate responses to fault situations, with real-time monitoring features [13]. The fault location method includes artificial intelligence-based methods such as Artificial Neural Networks (ANN), Support Vector Machines (SVMs), and fuzzy logic. Some of the proposals integrate wavelet transform techniques with fuzzy logic to enable fast and accurate fault detection and classification. The common problem with all these existing methods is that they help to detect and analyze the fault, but the normalization of the distribution system is not considered.
3.4. Smart Measurement Devices
The usage of accurate and smart measurement devices is quite low in distribution networks due to the high prices of the devices, and the installation of numerous phasor measurement units (PMUs) or smart meters could result in high data traffic together with large computational loads [14]. Taking advantage of advanced metering, the need to rely on manual outage mapping using customers’ calls, measurements of voltage and current components at the substation, and network electrical parameters as fault location techniques can be reduced. Smart meters can be installed along the feeder to record the pre-and during-fault voltages, and the difference between pre-and during-fault voltages is then used to detect the faulted bus, where the faulted bus corresponds to the point where the highest voltage drop is observed [15]. A proposal in [16] uses the voltage sag vector from smart meters and an impedance matrix to produce a current vector that is sparse enough, with one non-zero element that corresponds to the bus at which a fault occurs. The integration of automated outage mapping techniques with smart meters that have built-in voltage sag measurement capabilities is frequently used as a fault location technique to improve accuracy and precision in fault location by reducing computing demand and the possibility of multiple estimations [16]. The reference in [15] and other sensitivity studies show that voltage sags for all buses on a feeder can be estimated from a few voltage sag measurements along the feeder, with satisfactory performance even with a reduced number of feeders.
3.5. Distribution Automation (DA) Application
All of the fault detection, classification, and location techniques reviewed above can then be used as high-quality fault information for processing and utilization in self-healing or normalizing systems to achieve DA. Numerous DA applications have been proposed, and some are commercially available in the market with different capabilities; these applications share a common purpose, which is to achieve the self-normalizing or healing capability, high reliability, and power quality of the grid system. One of the most popular DA applications is Fault Location, Isolation, and Service Restoration (FLISR), which is the utilization of advanced protective and switching devices to automatically locate and isolate faulted feeder sections and restore the maximum number of customers located in the healthy sections [7]. The centralized solution uses SCADA-enabled switches and sensors to detect an outage at critical points in the distribution location, assess the failed pattern, detach the goof, and carry out the operation in the failed areas [17]. The information gathered at the SCADA system can be processed at the distribution, operation, or substation level to achieve the highest feeder optimization, with more complicated switching logic and adequate load distribution, by considering all the constraints [12,18].
3.6. Advancement in Communication Technologies
We should consider contingencies in any of the schemes to ensure the reliability and effectiveness of the schemes before deploying them in the complex distribution network to achieve DA. For example, great resilience of the communication networks or intact communication links between the IEDs or agents are required in DA applications as they must be able to communicate the essential monitoring or control information to the automated switches or recloses in case the grid system is damaged or not functioning properly [19]. Thus, a high-performance communication network infrastructure is needed as a base for bidirectional links for real-time monitoring and control, with stringent requirements such as the fast delivery of massive amounts of reliable data. The integration of high-speed wireless communication technologies such as the Global System for Mobile Communication (GSM) or Wi-Fi in fault management applications can be used to achieve IoT for real-time monitoring and control over physical devices [20]. GSM also has the low-cost implementation of the short message service (SMS), known as text messaging, to send and receive messages in text, and it is particularly useful in remote data monitoring and communication due to its ability to transfer bidirectional data with accurate output [20,21]. The lack of a real-time monitoring system can lead to serious failures, such as damage to the underlying equipment’s connections due to the late identification and recognition of unexpected situations, becoming a threat to humans nearby [22]. Thus, the author in [23] proposed a GSM-based signaling system that will detect the changes in the voltage–current parameters of distribution transformers; wherever the present threshold is exceeded, the microcontroller will initiate a message instantly to the person in charge via a GSM modem for the prediction of fault type and location based on the parameters. A fault detection system for low tension (LT) pillars can enable automation on the low-voltage side of distribution networks, where the fault information (fuse blown status) will be sent from the LT pillars to an intermediate via ZigBee communication and then transmitted to the main control center using a GSM technique [24]. Cellular technologies such as GSM, often coupled with GPRS (general packet radio service) for data transfers, are commonly used to achieve the IoT for fault detection and monitoring applications that do not require large amounts of data transfer [25,26,27]. The IoT can be termed as the third wave of the information industry (after the computer and the internet and mobile communication network) that consists of sensor technology, communication networks, internet technology, and intelligent computing technology to achieve the real-time collection of things, reliable transmitting, and the intelligent computation and control of things [28,29]. IoT technology has been slowly integrated into the industrial operation environment with the extensive deployment of wireless sensor networks, embedded systems, and cheap sensors to achieve industrial automation in the context of Industry 4.0; this technology can be addressed as Industrial IoT (IIoT) [30,31]. Hidden information can be extracted via data mining for accurate fault prediction or detection so that a more efficient use of manpower or resources can be achieved due to condition-based maintenance instead of periodic maintenance [32]. The IoT platform is essential for managing the stream of data generated from individual sensors [33,34,35,36]. A number of middleware or IoT platforms are currently available in the market to provide an abstract view of their functionalities through the interoperability between heterogeneous data sources in terms of hardware or software [37,38].
3.7. SCADA Technologies
The SCADA (Supervisory Control and Data Acquisition) system is a centralized control system that is used extensively in the utility industry to achieve industrial automation, where its primary responsibility is to monitor electrical equipment based on field devices such as remote terminal units or IEDs installed in specific equipment in distribution networks and carry out appropriate control actions based on the data acquired. The SCADA technique has been very well proven within the substation region, and the system is being utilized to build human–machine interfaces (HMIs) with graphical user interface (GUI) functions so that engineers and technicians are able to monitor and control the system remotely. The SCADA system lacks interoperability as the integration of devices into different models or versions requires seamless programmability for devices and sensors compared to the IoT, where protocols such as MQTT (message queuing telemetry transport) allow interoperability over various devices. The SCADA system has limitations in analyzing historical data compared to the IoT, which helps utility companies to gain insights from all the data stored by using big data processing and machine learning algorithms for the fault prediction and normalizing systems.
3.8. Microsoft Azure
Azure is a cloud computing platform that allows developers to publish web applications running on different frameworks and written in different programming languages, such as any .NET language, node.js, php, Python, and Java. Cloud providers offer different levels of services and can be classified into three main categories, such as Infrastructure as a Service (IaaS), Platform as a Service (PaaS), and Software as a Service (SaaS). IaaS is the delivery of hardware in terms of servers, storage, and networks, together with associated software such as operating systems virtualization technology and file systems as a service. PaaS provides operating systems, programming language execution environments, databases, and web servers; in other words, a virtualized computing platform. Lastly, SaaS is where the providers host and manage the application service software in their database, and users that use the services do not manage the infrastructure and platform on which their applications run [39,40]. The IoT Azure Hub is essential in order to implement the IoT reference architecture to support a wide variety of devices and different processing patterns with high security and extensibility [41,42]. The authors of [43] proposed an elevator monitoring application implemented in the cloud, where Microsoft Azure was used in its development. The fault detection and the notification response were quite fast, around 5 s using the Azure notification hub, and the database enabled the storing of fault information for data mining.
4. Research Methodology
4.1. Research Consideration
Most utility companies depend solely on customer calls and the tripping status of the upstream circuit breaker to conclude the fault on a specific distribution feeder [18]. By the time the supply is restored to the non-faulty section of the feeder, all the customers within that section would have experienced a power outage of between 45 to 75 min, which is 1 h approximately. The time analysis for conventional outage management procedures is shown in Figure 1 below.
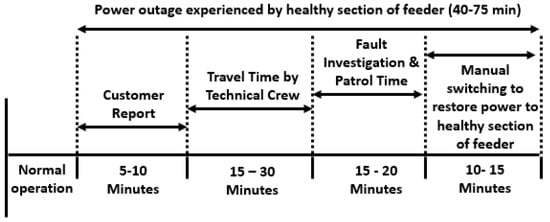
Figure 1.
Conventional outage management procedures.
It is possible to improve the conventional outage management procedures by shortening the duration of power outages experienced by customers in the healthy section of the feeder. A major portion of time can be saved as the fault location is done automatically by the monitoring system and the technical crew is no longer required to patrol the line to locate the fault. Moreover, the duration of the outage can be further reduced by implementing the remote control of field switchgears so that the technical crew will not have to reach the site for the manual control of switchgears, either for isolation or restoration. Therefore, to have a system that is able to shorten the duration of the outage experienced by customers, the system must fulfill two important features—one is smart fault monitoring and the other is the remote control of field switchgears. Apart from that, both important features will be integrated with the concept of IIoT to achieve real-time distribution structural awareness, faster fault localization, and the remote control of switchgears to restore supply to the non-faulty feeder sections. The performance of the system is shown in Figure 2. The time taken for supply restoration to the healthy section of the feeder can be shortened to less than 5 min after the implementation of such a system. The deployment of such a system is expected to improve the SAIFI and SAIDI indices significantly due to the shortened time for fault localization and the normalizing of the system.
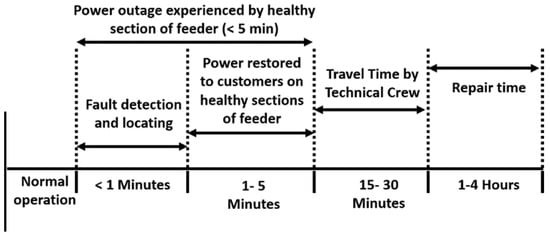
Figure 2.
With smart fault detection and remote control.
4.2. Structure of Distribution Feeder Network
The structure of an 11 kV distribution feeder system is shown in Figure 3. This structure is a hybrid system with a combination of underground (UG) feeders and overhead lines (OHLs); however, the majority of the distribution feeder networks are UG due to the low incident rates for UG construction. The UG distribution feeder is connected in a ring main circuit with a normally open point (NOP) assigned by the utility company based on load balancing calculations [44]. The purpose of such a point is to avoid circulating current, and in case a fault occurs on the line, the normally open point can be switched on after the isolation of the fault to allow some portion of the faulted circuit (non-faulty feeder section) to be restored quickly. The identification of the cable fault at the switchgear terminal is normally made by observing the switchgear, where carbonization on the metal case of the switchgear (cable box) will indicate the cable fault at specific switchgears. However, for UG cables, locating the fault of the feeder line between switchgears is tedious compared to fault locating for OHLs due to the nature of the UG cable, which is not visible as it is buried underground. Several techniques are available to locate faults in UG cables, such as sectionalizing, the thumping method, time-domain reflectometry (TDR), the arc reflection method (ARM), the impulse current method (ICM), and the blavier test.
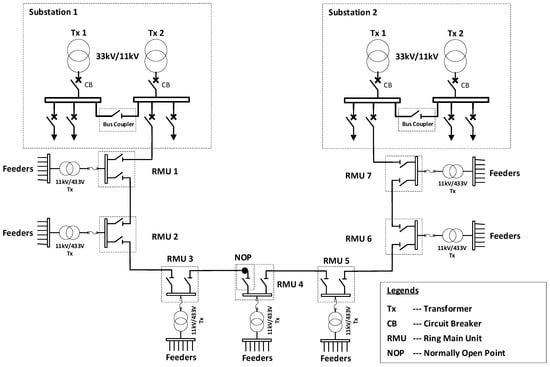
Figure 3.
The 11 kV distribution feeder system.
4.3. Hardware Prototype Configuration
In order to demonstrate the functionality of our proposed concept, a hardware prototype was constructed based on the distribution feeder configuration discussed in the previous section. The design of this hardware prototype is important so that it can best illustrate the real scenario of distribution feeder line systems. The design of this hardware prototype is shown in Figure 4. Autotransformers (415 V/290 V) were used to simulate the 33 kV/11 kV transformers, 18W LED bulbs to represent the loads, and double pole double throw relays (DPDT) to represent switchgears. However, not all DPDT relays were used as switchgears; for example, relays DPDTS1 and DPDTS2 were used to represent the operation of the upstream circuit breakers for the substations. The prototype monitoring system, in this case, is based on two inputs—one is the DPDT relay status and the other is the fault alert information. Since the output of the DPDT relay status corresponds to the energization of the respective relay coils, some circuit designs and logic will be implemented on the relay coil side in order to obtain the relay state. Next, the fault alert information can be obtained by using fault alert switches to indicate the fault occurring on a specific line. In the real distribution system, two-state real-world information will be acquired by using an isolated voltage or current source to sense the position of the remote contact (open or closed) at the telemetered or motorized switchgears. For fault identification in the distribution system, the signals or inputs can be tapped directly from fault sensors, such as voltage, current, temperature, vibration, or light sensors. The NodeMCU will be used as the IoT device to gather all the inputs, the DPDT relay, and the fault alert status. These inputs are very important to establish whether such a fault monitoring system would be capable of visualizing the current condition of the distribution system. PCF8574 modules were used to extend the I/O pins of the NodeMCU due to the large input and output requirements in this research. The NodeMCU, with built-in ESP8266 Wi-Fi, aided in providing internet connectivity for the system. Apart from that, the circuit design and wiring must be designed in such a way that IoT devices will be able to read all DPDT relay statuses and fault alert signals while being ready to accept any control commands from the cloud for the remote-control operation of relays.
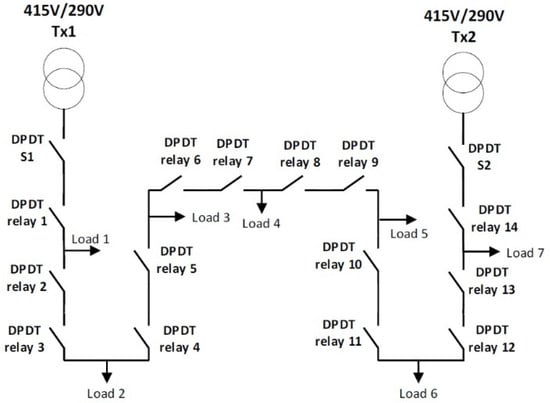
Figure 4.
Design of the hardware prototype.
Figure 5 shows the proposed system architecture. Both relay and fault alert status will be used as inputs to the system, while the IoT device (NodeMCU) is used as an IoT gateway to transmit the telemetry data to the cloud or receive the control commands from the cloud. The IoT Hub will be the platform that is used to transmit or receive the data to or from the IoT device. This prototype consists of 415 V/290 V step-down transformers, which represent the 33 kV/11 kV transformers of a real-time power distribution system. The DPDT relays in the prototype represent the 11 kV switchgears of the power distribution system, and LED bulbs represent the loads in the power distribution system. The structure of this hardware prototype is based on the sample part of a ring main 11 kV distribution feeder network to best simulate the system. In short, the development of this research is divided into four categories, which are hardware prototype configuration, IoT device programming, Azure cloud platforms, and web application development. Next, the testing of the system was done by simulating faults on specific sections on the feeder line, and all observations were recorded.
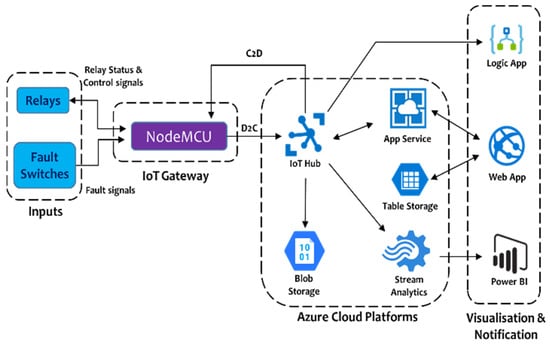
Figure 5.
The proposed system architecture.
4.4. Hardware Configuration
The hardware prototype was built to test and prove the functionality and feasibility of this system before it is implemented in a real-scenario distribution system. Thus, the hardware setup mainly followed the 11 kV distribution feeder in regional distribution networks in terms of the ring main circuit. From Figure 6, the major components used were 2 autotransformers, the control box as the IoT device that contains the NodeMCU, 14 DPDT relays positioned in a loop, 7 LED bulbs as loads, and 7 fault alert switches.
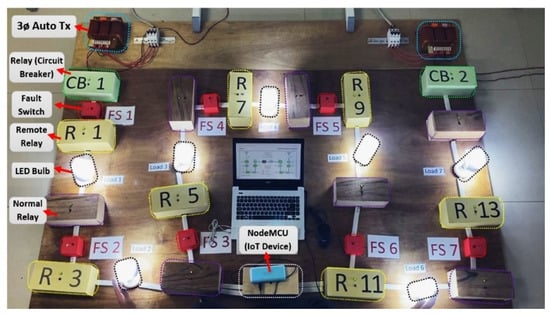
Figure 6.
Hardware setup.
Figure 7 shows the schematic diagram of the hardware setup. Based on the configuration in the figure above, a total of seven LED bulbs (loads) was connected in parallel to the single-phase supplies, with DPDT relays (switchgears) in between.
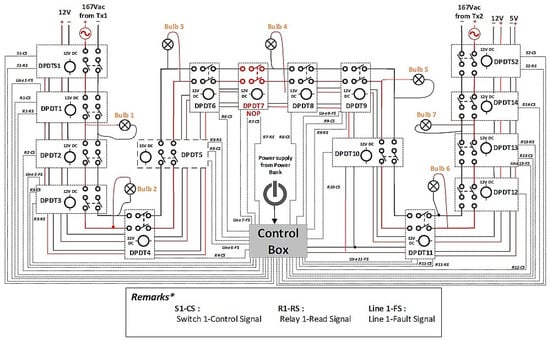
Figure 7.
Schematic diagram for hardware setup.
4.4.1. Autotransformer
The three-phase autotransformer had a secondary line voltage of 290 V, which was stepped down from 415 V. As a safety precaution, the autotransformer wye-point must first be connected to neutral to stabilize the voltages. The star point was grounded to limit voltages to the ground, and in the event of a ground fault, it could be tripped as protection. A single-phase voltage of 167 V was used as the supply source so that there was no phase difference between each source, which is crucial in this case to avoid explosions or equipment damage during synchronizing switching.
4.4.2. Double Pole Double Throw Relays and Fault Switch
From the hardware setup, it can be seen that a total of 16 DPDT relays were used in the prototype, and two of the relays, DPDTS1 and DPDTS2, were used to simulate the working of the upstream circuit breaker in the distribution system. To make the system cost-effective and practical, only seven of the relays were remote-monitored and had remote-control features. Those relays were positioned in between the normal relays. The real-time status of the seven DPDT relays is essential as it provides the input data for the distribution system modeling in the cloud. Moreover, the remote control of the seven DPDT relays is also important for the normalizing part of the system so that it can be switched to either “closed” or “open” according to the control commands received from the cloud. Apart from the DPDT relay status, fault alert input will be another input to this system. The faults along the line are located using fault switches, where the status of the fault will then be read by the IoT device and sent to the cloud for processing and monitoring. Note that the number of fault switches corresponds to the number of remote-control relays and are located near them. This is because fault sensors will normally be installed together with the telemetered and motorized switchgears so that both share a common communication structure to save cost.
4.4.3. IoT Device Development
During IoT device development, various functionalities and features, such as Wi-Fi module interfacing, relay status reading and control, fault alert reading, and smart algorithm for circuit breaker simulation operations, are essential to ensure the working of this smart fault monitoring and normalizing system. Figure 8 below shows that the IoT device starts connecting to Wi-Fi immediately after connecting a power supply to it. Since the user has input its credentials earlier, the device will reconnect to Wi-Fi automatically.
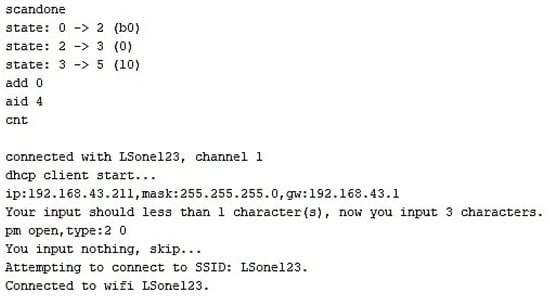
Figure 8.
IoT device initiation and Wi-Fi connection.
Figure 9 shows the device connecting to the IoT Hub. After reading all the input data and formatting it into the JSON format, the IoT device will start sending all data to the IoT Hub, as shown in Figure 10. Since the connection to the IoT Hub is not yet established, the process of connecting to the Hub is started while putting the data on hold. The connection to the IoT Hub will only be started once the IoT device is powered on.
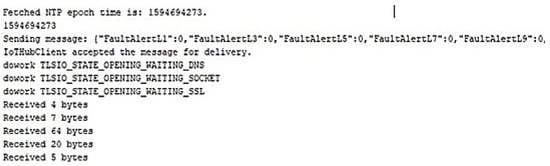
Figure 9.
Connect to the IoT Hub.
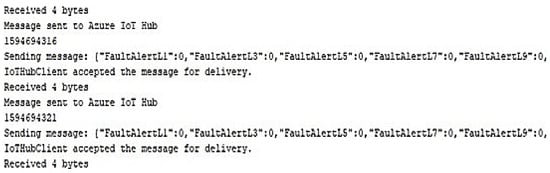
Figure 10.
Sending input data to the IoT Hub.
4.4.4. Web Application Development
The web designs for smart fault monitoring and remote-control websites are shown in Figure 11 and Figure 12, respectively. Both web applications were written in Node.js, and each consists of front-end (client-side) and back-end (service-side) scripts to ensure the applications work properly.
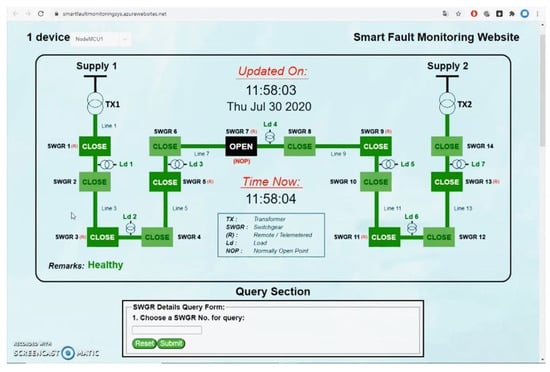
Figure 11.
Smart fault monitoring website.
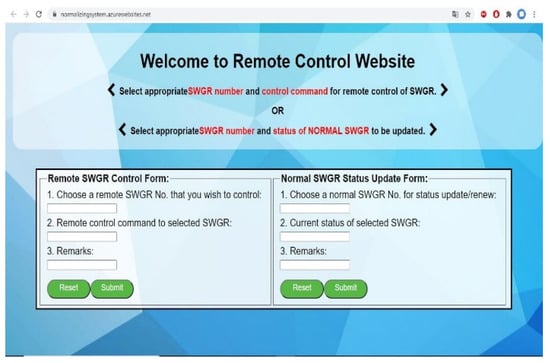
Figure 12.
Remote-control website system testing.
All the code editing, testing, and debugging for the web applications were done in Visio Studio Code because it had various features that could ease application development, such as “IntelliSense”, built-in git commands, and various choices of extension.
As shown in Figure 12, the coding of this remote-control website can be classified into three important parts, one under service-side scripts and the other two as client-side scripts. “app.js” will be the service-side script that receives the HTTP POST request from the client (web browser), and the data stored in the request body will pass to form the processing function as an argument.
5. Results and Discussions
The testing of the smart fault monitoring and normalizing system was done in two modes—one to let the system operate under normal operating conditions and the other to simulate the fault in the hardware prototype.
5.1. Normal Operating Condition
Under healthy operation conditions, all red LEDs are in the off condition, with no indication of faults, whereas all DPDT relays are in the “closed” mode except for the normally open point (NOP- DPDT Relay 7). Moreover, all seven LED bulbs (Loads) light up as usual, as shown in Figure 6. The smart fault monitoring website is opened by using the web browser, and only authorized persons may enter it. After successfully signing in, we noticed that the current configuration of the hardware prototype (distribution system) was updated and modeled in real-time on the fault monitoring website, as shown in Figure 11. The “updated on” field provides the date and time information of the system modeling and is refreshed every two to four seconds, depending on the upload speed. Moreover, the green color lines indicate that the lines are energized and that the current system is in a “healthy” mode, as implied in the “remarks” field.
5.2. Simulating Fault on Line 11
In order to demonstrate the behavior of the system, a fault on Line 11 was simulated using a fault switch. When the fault switch on line 11 in the hardware was triggered, the red LED for Line 11 lit up and the supply to the LED bulbs that were connected before the NOP for Supply 2 turned off immediately (LEDs 4, 5, 6, and 7) as shown in Figure 13.
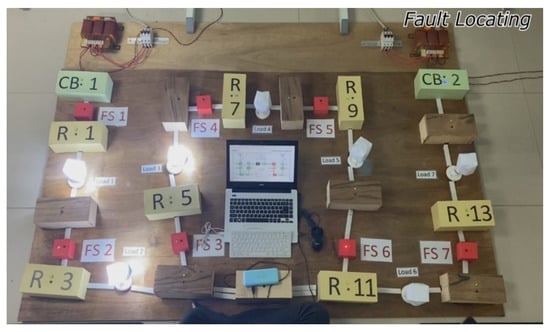
Figure 13.
Hardware situation when the fault on Line 11 (FS6) is triggered.
The red light from the LED on Line 11 implies that a fault has occurred on Line 11, and the DPDTS2 (representing Circuit Breaker 2) turned off immediately to cut off the supply to LEDs 4, 5, 6, and 7. In the meantime, the system modeling on the smart fault monitoring website was renewed with the fault alert occurring on Line 11, as shown in Figure 14 below. Not only that, with built-in smart “remarks”, the monitoring website immediately provided suggestions for the isolation of the fault, which informed the user to “open” Switchgears 9 and 11. After a few seconds, an email notification alert with fault details was sent to the user to request immediate control action. The next action after the fault alert is to perform the fault isolation via the remote-control website. The same authentication process is required for the user to login into the remote-control website. After the user inputs and submits the specific control commands for closing Switchgears 9 and 11, the control commands will be sent to the server for processing.
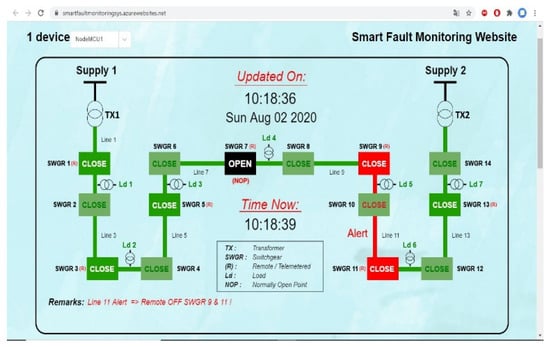
Figure 14.
Smart fault monitoring website with a fault on Line 11.
The server will invoke the direct method on the IoT device based on the control command received and return the result to the website after the acknowledgment message is received from the IoT device. The process of remote control from the website to the IoT device is shown in Figure 15 below. Figure 16 shows the sample output from the remote-control web after a command is submitted to the cloud.
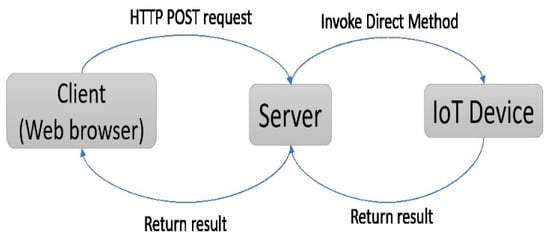
Figure 15.
Communication between client and IoT device.
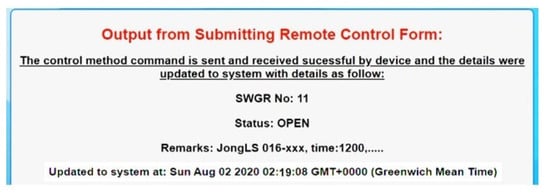
Figure 16.
Sample output from the remote-control web after a control command is sent.
After the isolation procedures, restoration must be performed to restore the supply to the non-faulty section of the feeder, in this case, Load 4 (LED 4). Thus, Switchgear 7 (NOP) was remotely “closed” to restore supply to Load 4 from the neighboring Supply Source 1 (Transformer 1). The DPDTS2 (Circuit Breaker 2) is remotely closed to resume the supply to loads 6 and 7.
From the hardware prototype in Figure 17, we can observe that LED Bulb 4 continued to light up by taking the supply from the first transformer, while LED Bulbs 6 and 7 were restored with the supply taken from the second transformer. In the monitoring web application in Figure 18, the system was refresh successfully, where both Switchgears 9 and 11 (Relays 9 and 11) were closed and given the remark of “maintenance needed”.
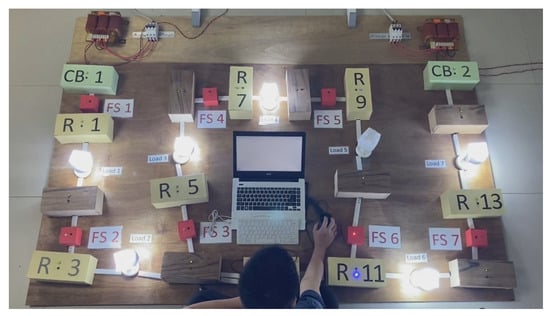
Figure 17.
Hardware prototype after restoration steps.
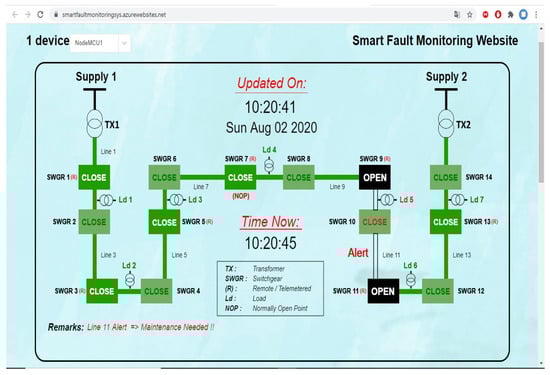
Figure 18.
Monitoring website after restoration.
5.3. Simulating Faults on Lines 5 and 7
Apart from simulating only one fault, faults were simulated on two lines of the feeder line in Section 5 and 7. The results from this testing were similar to the testing in the previous section. When Fault Switches 3 and 4 on the hardware were triggered, the red LEDs for Lines 5 and 7 lit up and the supply to the LED bulbs that were connected before the NOP for Supply 1 turned off immediately (LED Bulbs 1, 2, and 3), as shown in Figure 19 above. The system modeling in the smart fault monitoring website was refreshed with the fault alert that occurred on Lines 5 and 7, as shown in Figure 20 below. The difference is that the smart “remarks” provided isolation suggestions for both lines, where one was to turn off Switchgears 3 and 5 and the other was to turn off Switchgear 5. The email notification alert with fault details was then sent to the user as usual.
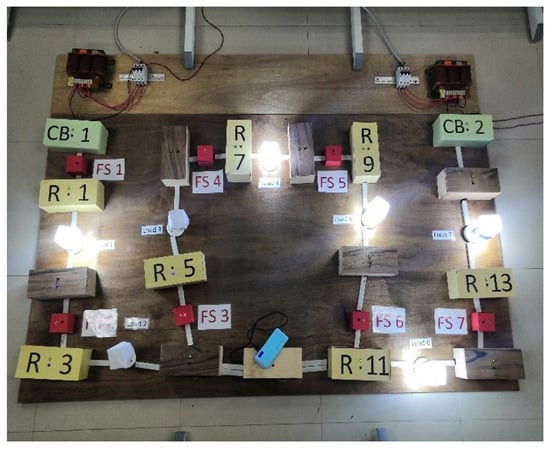
Figure 19.
Hardware prototype with faults on Lines 5 and 7.
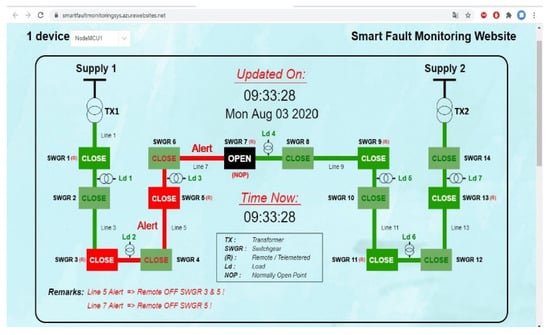
Figure 20.
Smart fault monitoring website with faults on lines 5 and 7.
The only restoration procedure, in this case, is to remotely close the DPDTS1 (Circuit Breaker 1) to resume the supply to Load 1. After restoration, LED Bulb 1 was restored with the supply taken from the first transformer, as shown in Figure 21. In the monitoring web application, as shown in Figure 22, the system was refreshed successfully, where both Switchgears 3 and 5 (Relays 3 and 5) were closed and given remarks of “maintenance needed” for both lines.
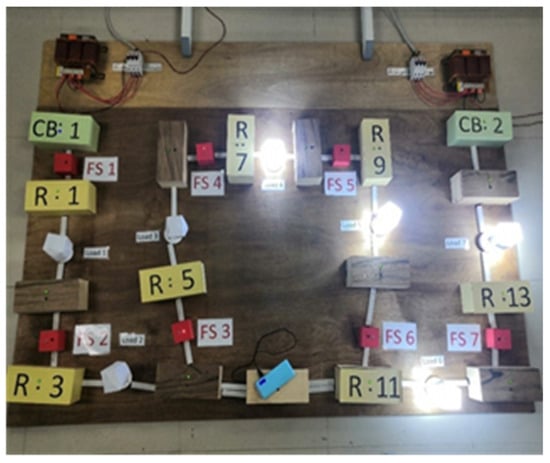
Figure 21.
Hardware after restoration for LED Bulb 1.
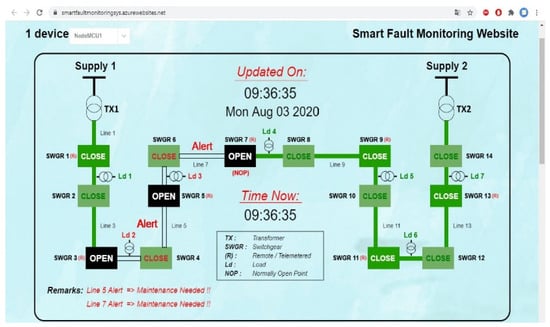
Figure 22.
Monitoring website after restoration for Load 1.
5.4. Performance of the System
To verify the performance of the system, the system was restarted and run a couple of times to collect some time data. There were two types of time data that we focused on: one was the instant of time that data were read by the IoT device (read time), and the other was the instant of time that data were received by the web server (web time). The system is run to read 14 data, and each data consist of pairs of read time and web time. A total of three sets of data were collected for higher accuracy. Figure 23 shows the data analysis for read time and web time. The read time is extracted from the epoch time by converting it to local time and recording the last two digits of it, whereas web time is extracted from the “Queue Time Utc” during data retrieving from IoT Hub’s event hub. From the analysis, significant large read intervals were observed for each dataset, which were 16, 18, and 16 s, respectively. It is because the IoT device was in the initialization mode to make necessary queries and connections before transmitting the first data to the IoT Hub. The corresponding read intervals for each data varied between two and three intervals. The average read interval or the sample time for each set of data was calculated (excluding the large read interval), which was 2.17, 2.25, and 2.33 s, respectively. The delay between the web time and read time for each dataset was calculated, and the average delays for each set of data were 1.12, 1.03, and 1.30 s, respectively.
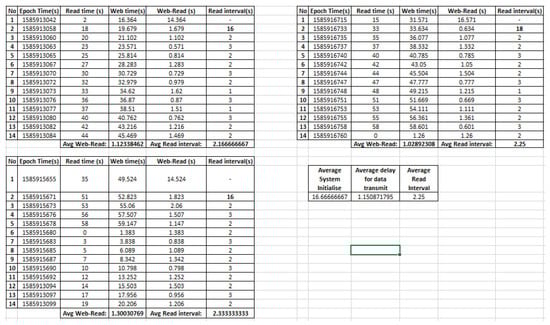
Figure 23.
Data analysis for read time and web time.
Apart from that, the performance of email notification alerts was also being evaluated. A series of fault reports were made, and an email sending duration of 6 to 10 s was observed, as shown in Figure 24 below.
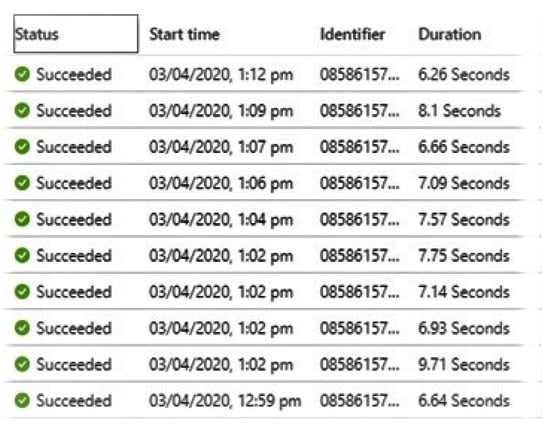
Figure 24.
Duration for email notification alert.
The average time taken for various aspects of the system is summarized in Figure 25. The system initialization took around 16.67 s on average, starting from the operation of the IoT device, by making necessary queries and connections until the first set of data was transmitted to the IoT Hub. For the corresponding data, the system shows outstanding performance, where the delay in the data transmitting from the IoT device to the cloud was only 1.15 s on average before the operator was able to view the real-time distribution system status.
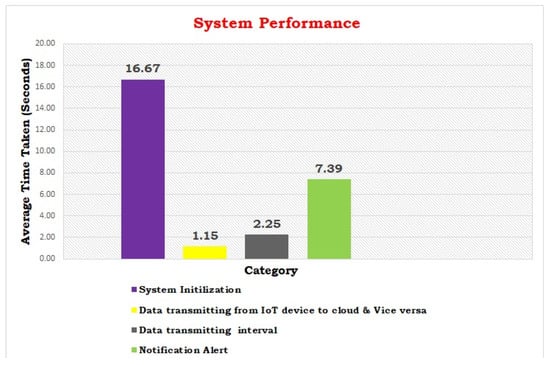
Figure 25.
System performance.
For example, the delay in the data transmission between the IoT device and the cloud was only 1.15 s on average. The operator was able to observe the execution of the control command by the IoT device after a short delay (1.15 s). The system is capable of transmitting the data after a short gap, which was 2.27 s on average (user-definable). The average time taken to send an email notification alert to the operator was around 7.39 s on average. The notification on fault alert is very important for the operator to be notified of the fault occurring in the distribution system if he or she is away from the monitoring website. The time for the conventional SCADA system to visualize the distribution system might be longer if the field devices are far from the central SCADA system. The nature of the cloud communication employed in this system enables the operator to monitor the status of the sub-distribution system in near real-time, without regard for where the operators are currently.
6. Conclusions
Conventional methods of addressing power outage issues in distribution systems are tedious and complex due to the lack of fault monitoring and normalizing systems in secondary distribution systems. The researchers have successfully designed and proposed a smart fault monitoring and normalizing system using the Azure cloud computing platform, which accelerates the fault location, isolation, and restoration processes from approximately one hour to, eventually, less than 5 min, as tabulated in Table 1.

Table 1.
Proposed system performance.
The shortened duration of fault location enables improvement on the SAIFI and SAIDI indices. With the integration of the power distribution system and IoT technology, smart fault detection, monitoring, and normalization are achieved. The time spent on fault location can be reduced significantly as the fault can be located within a few minutes without the need to dispatch a technical crew to physically patrol and identify the fault along the distribution feeder. Since the fault location can be performed automatically with inputs from various sensors and protective relays in switchgear, the supply can be remotely restored to non-faulty feeder sections immediately after the fault alert from this proposed system. The proposed system would be cost-effective as not all the switchgears in the field have to be remote-monitored or telemetered. Apart from that, this system would be able to work alongside existing SCADA systems to provide fault monitoring and control in secondary distribution networks, and thus, the additional costs of integrating this system into existing systems in the power industry can be ignored.
Author Contributions
Project administration, Investigation, G.P.; Resources, Writing–review & editing, A.A.S.; Validation, Resources, P.G.; Funding acquisition, Validation, D.G.; Funding acquisition, Validation, M.M.V.; Writing–original draft, J.L.s. All authors have read and agreed to the published version of the manuscript.
Funding
This research received no external funding.
Data Availability Statement
Not applicable.
Conflicts of Interest
The authors declare no conflict of interest.
Abbreviations
Internet of Things (IoT); System Average Interruption Duration Index (SAIDI); System Average Interruption Frequency Index (SAIFI); Distributed Energy Resources (DER); Supervisory Control and Data Acquisition (SCADA); Distribution Management System (DMS); Distribution Automation (DA); Phasor Measurement Units (PMUs); Intelligent Electronics Devices (IED); Fault Location, Isolation, and Service Restoration (FLISR); Global System for Mobile Communication (GSM); GPRS (General Packet Radio Service); Infrastructure as a Service (IaaS); Platform as a Service (PaaS); Software as a Service (SaaS); Graphical User Interface (GUI); Underground (UG); Overhead Lines (OHLs); Normally Open Point (NOP); Time-Domain Reflectometry (TDR); Arc Reflection Method (ARM); Impulse Current Method (ICM); Ring Main Units (RMUs); Double Pole Double Throw relays (DPDTs).
References
- Tuballa, M.L.; Abundo, M.L. A review of the development of Smart Grid technologies. Renew. Sustain. Energy Rev. 2016, 59, 710–725. [Google Scholar] [CrossRef]
- El-hawary, M.E. The Smart Grid—State-of-the-art and Future Trends. Electr. Power Compon. Syst. 2014, 42, 239–250. [Google Scholar] [CrossRef]
- U.S. Department of Energy. What is the Smart Grid? Available online: https://www.smartgrid.gov/the_smart_grid/smart_grid.html (accessed on 6 October 2019).
- Yildiran, N.; Tacer, M.E. The Future’s Power System: Smart Grid. Int. J. Electron. Mech. Mechatron. Eng. 2016, 6, 1047–1055. [Google Scholar] [CrossRef]
- Gupta, P.; Chhabra, J. IoT based Smart Home design using power and security management. In Proceedings of the 2016 International Conference on Innovation and Challenges in Cyber Security (ICICCS-INBUSH), Greater Noida, India, 3–5 February 2016; pp. 6–10. [Google Scholar] [CrossRef]
- Tom, R.J.; Sankaranarayanan, S. IoT based SCADA integrated with Fog for power distribution automation. In Proceedings of the 2017 12th Iberian Conference on Information Systems and Technologies (CISTI), Lisbon, Portugal, 21–24 June 2017. [Google Scholar]
- Agüero, J.R. Applying Self-Healing Schemes to Modern Power Distribution Systems. In Proceedings of the 2012 IEEE Power and Energy Society General Meeting, San Diego, CA, USA, 22–26 July 2012. [Google Scholar]
- Nath, R.; Thakur, R. ZigBee and GSM Based Fault Detection System for Low Tension Pillar. In Intelligent Communication, Control and Devices; Springer: Singapore, 2018; pp. 761–768. [Google Scholar]
- Pawar, R.R.; Wagh, P.A.; Deosarkar, S.B. Distribution Transformer Monitoring System Using Internet of Things (IoT). In Proceedings of the 2017 International Conference on Computational Intelligence in Data Science (ICCIDS), Chennai, India, 2–3 June 2017. [Google Scholar]
- Suresh, S.; Nagarajan, R.; Sakthivel, L.; Logesh, V.; Mohandass, C.; Tamilselvan, G. Transmission Line Fault Monitoring and Identification System by Using Internet of Things. Int. J. Adv. Eng. Res. Sci. 2017, 4, 9–14. [Google Scholar] [CrossRef]
- Gungor, V.C.; Sahin, D.; Kocak, T.; Ergut, S.; Buccella, C.; Cecati, C.; Hancke, G.P. Smart Grid Technologies: Communication Technologies and Standards. IEEE Trans. Ind. Inform. 2011, 7, 529–539. [Google Scholar] [CrossRef]
- Xu, X.; Chen, T.; Minami, M. Intelligent fault prediction system based on internet of things. Comput. Math. Appl. 2012, 64, 833–839. [Google Scholar] [CrossRef]
- Yang, F.; Stoupis, J.; Donde, V. Feeder automation for an electric power distribution system. U.S. Patent 8,121,740 B2, 21 February 2012. [Google Scholar]
- Shende, P.; Thakur, A.; Muley, D.; Gadekar, S. PLC Based Fault Location, Isolation and Service Restoration for Distribution System. In Proceedings of the International Conference on Communication and Information Processing (ICCIP) 2019, Choqing, China, 15–17 November 2019. [Google Scholar]
- Chen, K.; Huang, C.; He, J. Fault detection, classification and location for transmission lines and distribution systems: A review on the methods. High Volt. 2016, 1, 25–33. [Google Scholar] [CrossRef]
- Sánchez-Ayala, G.; Agüerc, J.R.; Elizondo, D.; Lelic, M. Current trends on applications of PMUs in distribution systems. In Proceedings of the 2013 IEEE PES Innovative Smart Grid Technologies Conference (ISGT), Washington, DC, USA, 24–27 February 2013. [Google Scholar]
- Wang, B.; Xu, W.; Pan, Z. Voltage sag state estimation for power distribution systems. IEEE Trans. Power Syst. 2005, 20, 806–812. [Google Scholar] [CrossRef]
- Peter, G.; Bin Iderus, S. Design of enhanced energy meter using GSM prepaid system and protective relays. Mater. Today Proc. 2021, 39, 582–589. [Google Scholar] [CrossRef]
- Fan, K.; Gao, M.; Xu., B.; Zhang, X. Distributed Distribution Automation system based on the identification of tie-switch. In Proceedings of the 2014 IEEE PES General Meeting|Conference & Exposition, National Harbor, MD, USA, 27–31 July 2014. [Google Scholar]
- Jasu, S.; Dubey, B.K.; Pandey, D.K. Fault Location, Isolation, and Service Restoration (FLISR) Technique using IEC 61850 GOOSE. In Proceedings of the 2013 IEEE Power & Energy Society General Meeting, Vancouver, BC, Canada, 21–25 July 2013. [Google Scholar]
- Sugarek, J.P. Fault Location, Isolation, and Service Restoration Technologies Reduce Outage Impact and Duration; U.S. Department of Energy Office of Electricity Delivery and Energy Reliability: Washington, DC, USA, 2014.
- Oancea, C.D. GSM infrastructure used for data transmission. In Proceedings of the 2011 7th International Symposium on Advanced Topics in Electrical Engineering (ATEE), Bucharest, Romania, 12–14 May 2011. [Google Scholar]
- Peter, G.; Iderus, S.B. Trust and deadline aware scheduling algorithm for cloud infrastructure using ant colony optimization. In Proceedings of the 2016 International Conference on Innovation and Challenges in Cyber Security (ICICCS-INBUSH), Greater Noida, India, 3–5 February 2016; pp. 187–191. [Google Scholar] [CrossRef]
- Rahman, S.; Dey, S.K.; Bhawmick, B.K.; Das, N.K. Design and implementation of real time transformer health monitoring system using GSM technology. In Proceedings of the 2017 International Conference on Electrical, Computer and Communication Engineering (ECCE), Cox’s Bazar, Bangladesh, 22–23 December 2017. [Google Scholar]
- Sarkar, J.; Ugle, S.; Yadav, A.; Ugale, U. Distribution Line Fault Detection & GSM Module Based Fault Signaling System. Int. J. Res. Appl. Sci. Eng. Technol. 2016, 4, 452. [Google Scholar]
- Tie, Z.; Wang, Z. GPRS-based fault monitoring for distribution grid. In Proceedings of the 2010 IEEE/ASME International Conference on Mechatronic and Embedded Systems and Applications, Qingdao, China, 15–17 July 2010. [Google Scholar]
- Zhang, H.; Deng, Z.; Liu, L. Design of Remote Fault Diagnosis System Based on GPRS Technique. J. Jiangsu Univ. Sci. Technol. (Nat. Sci. Ed.) 2006, 20, 54–57. [Google Scholar]
- Zhang, B.; Wang, M. How Will the Improvements of Electricity Supply Quality in Poor Regions Reduce the Regional Economic Gaps? A Case Study of China. Energies 2021, 14, 3456. [Google Scholar] [CrossRef]
- Maier, A.; Sharp, A.; Vagapov, Y. Comparative Analysis and Practical Implementation of the ESP32 Microcontroller Module for the Internet of Things. In Proceedings of the 2017 Internet Technologies and Applications (ITA), Wrexham, UK, 12–15 September 2017. [Google Scholar]
- Wang, S.; Wan, J.; Li, D.; Zhang, C. Implementing Smart Factory of Industrie 4.0: An Outlook. Int. J. Distrib. Sens. Netw. 2016, 12, 3159805. [Google Scholar] [CrossRef]
- Wan, J.; Tang, S.; Shu, Z.; Li, D.; Wang, S. Software-Defined Industrial Internet of Things in the Context of Industry 4.0. IEEE Sens. J. 2016, 16, 7373–7380. [Google Scholar] [CrossRef]
- Chen, F.; Deng, P.; Wan, J.; Zhang, D.; Vasilakos, A.V.; Rong, X. Data Mining for the Internet of Things: Literature Review and Challenges. Int. J. Distrib. Sens. Netw. 2015, 11, 431047. [Google Scholar] [CrossRef]
- Ahmed, M.M.; Soo, W.L. Supervisory Control and Data Acquisition System (SCADA) based customized Remote Terminal Unit (RTU) for distribution automation system. In Proceedings of the 2008 IEEE 2nd International Power and Energy Conference, Johor Bahru, Malaysia, 1–3 December 2008. [Google Scholar]
- Ahmed, M.M. New Supervisory Control and Data Acquisition (SCADA) Based Fault Isolation System for Low Voltage Distribution Systems. In Proceedings of the International Conference on Computer and Communication Engineering (ICCCE 2010), Kuala Lumpur, Malaysia, 11–12 May 2010. [Google Scholar]
- Peter, G.; Praghash, K.; Sherine, A.; Ganji, V. A Combined PWM and AEM-Based AC Voltage Controller for Resistive Loads. Math. Probl. Eng. 2022, 2022, 1–11. [Google Scholar] [CrossRef]
- Vandikas, K.; Tsiatsis, V. Performance Evaluation of an IoT Platform. In Proceedings of the 2014 Eighth International Conference on Next Generation Mobile Apps, Services and Technologies, Oxford, UK, 10–12 September 2014. [Google Scholar]
- Patti, E.; Acquaviva, A. IoT platform for Smart Cities: Requirements and implementation case studies. In Proceedings of the 2016 IEEE 2nd International Forum on Research and Technologies for Society and Industry Leveraging a Better Tomorrow (RTSI), Bologna, Italy, 7–9 September 2016. [Google Scholar]
- Guth, J.; Breitenbücher, U.; Falkenthal, M.; Leymann, F.; Reinfurt, L. Comparison of IoT platform architectures: A field study based on a reference architecture. In Proceedings of the 2016 Cloudification of the Internet of Things (CIoT), Paris, France, 23–25 November 2016. [Google Scholar]
- Bhardwaj, S.; Jain, L.; Jain, S. Cloud computing: A study of infrastructure as a service (IAAS). Int. J. Eng. Inf. Technol. 2010, 2, 60–63. [Google Scholar]
- Pflanzner, T.; Kertesz, A. A survey of IoT cloud providers. In Proceedings of the 2016 39th International Convention on Information and Communication Technology, Electronics and Microelectronics (MIPRO), Opatija, Croatia, 30 May–3 June 2016. [Google Scholar]
- Microsoft Azure IoT Reference Architecture, Microsoft Corporation. 2019. Available online: https://azure.microsoft.com/en-us/blog/azure-iot-reference-architecture-update/ (accessed on 24 November 2019).
- Al-Qaseemi, S.A.; Almulhim, H.A.; Almulhim, M.F.; Chaudhry, S.R. IoT Architecture Challenges and Issues: Lack of Standardization. In Proceedings of the 2016 Future Technologies Conference (FTC), San Francisco, CA, USA, 6–7 December 2016. [Google Scholar]
- Suárez, A.D.; Parra, O.J.S.; Forero, J.H.D. Design of an Elevator Monitoring Application using Internet of Things. Int. J. Appl. Eng. Res. 2018, 13, 4195–4202. [Google Scholar]
- Justin, F.; Peter, G.; Stonier, A.A.; Ganji, V. Power quality improvement for vehicle-to-grid and grid-to-vehicle technology in a microgrid. Int. Trans. Electr. Energy Syst. 2022, 2022, 2409188. [Google Scholar] [CrossRef]


Publisher’s Note: MDPI stays neutral with regard to jurisdictional claims in published maps and institutional affiliations. |
© 2022 by the authors. Licensee MDPI, Basel, Switzerland. This article is an open access article distributed under the terms and conditions of the Creative Commons Attribution (CC BY) license (https://creativecommons.org/licenses/by/4.0/).