Abstract
The reliability of the compressor system determines the gas supply safety. An important method to improve the reliability is to set up standby compressors in stations, conducted by the standby compressor or power. A lack of quantitative assessments of standby compressors often results in more spare compressors or power than actually needed, which wastes money. In this study, a reliability-based method is proposed to determine the numbers and positions of the standby compressors, which can reduce investments, and ensure reliability. Firstly, Monte Carlo method was used to calculate the compressor outage probability of the whole pipeline, respectively, through which the initial number of standby compressors was obtained. Further, the standby schemes were designed, in which the positions of the failed compressors were obtained by the Monte Carlo simulation. Moreover, the worst situation in which the compressors were shut down was used to test the standby scheme, calculating the flow reliability, pressure boundary, and total power. Finally, using the Xin–Yue–Zhe pipeline as a case study, the results indicate that the number of standby compressors in the improved schemes was reduced by seven and the pipeline reliability reached 96.86%.
1. Introduction
The economic recession caused by COVID-19 has become inevitable. Reducing investments and increasing efficiency will be the main focal points for the design, operation, and maintenance of natural gas (NG) pipelines for the managers and operators. Moreover, a reliable gas supply should be guaranteed. The compressor system (CS) is the power source of the long-distance NG pipeline, of which the operating state determines the pipeline flow and pressure, determining the reliability of the pipeline system. The reliability of the CS firstly refers to the operating reliability of a single compressor in a compressor station, and then refers to the reliability of the entire CS. Both depend on the compressor outage probability, including the failure probability and the scheduled outage probability. For the whole pipeline system, an important method to improve the reliability is to set up standby compressor units in the compressor stations, including unit standby and power standby. The unit standby needs the station to be equipped with standby units, resulting in increased investment and a large number of idle units [1]. The power standby has a certain amount of surplus on the basis of the designed power demand. When a unit fails to work, the surplus power is applied to restore the flow and pressure of the entire pipeline, which means that, under normal conditions, the compressor unit with surplus power will work in a low load/efficiency state [2]. In addition, for the actual design or operation of the CS, the way to set up the standby compressors is mainly based on expert experience. In order to increase the reliability of the pipeline, the conducted standby compressor plan is often conservative, which means the number or power of standby compressors is more than needed. The investment in compressor stations accounts for about 20% to 25% of the total investment in the gas pipeline system, and the investment in compressor accounts for more than half of the investments in compressor stations. Moreover, the annual operating costs of the compressor stations account for about 40% to 50% of the total operating costs of the gas pipeline, of which the power costs of the compressors account for more than 70% [3]. Thereafter, reducing pipeline investments or operating costs without reducing reliability and safety has become the main focal point of pipeline managers and engineers. This is also the field of experience in the West–to–East Gas Transmission Project. Therefore, it is of great significance to design a standby compressor scheme for the CS based on reliability analyses.
The reliability of a pipeline system is treated as a complex task [4]. The main focus at present is on the degradation mechanisms [5,6,7,8,9,10,11] and structural integrity of the pipe [12,13,14]. Structural integrity is influenced by loadings, such as corrosion or leakage, defined by thermal–hydraulic processes. The reliability of energy network systems also depends on the reliability of the installed equipment and the supply source. Praks et al. [15] presented a probabilistic model to study the security of the supply source in a gas network. The model is based on Monte Carlo simulations with graph theory and is implemented in the software tool ProGasNet. Monforti and Szikszai [16] presented a developed model, MC–GENERCIS, aimed to assess the robustness of the EU transnational gas transmission system during both normal and special operating conditions, including high-demand situations and/or supply shortages. Szikszai and Monforti [17] developed a time-dependent model to assess responses to NG supply crises based on the Monte Carlo simulations, which were also discussed by Flouri et al. [18]. Pambour et al. [19] quantified the impact of disruption events in coupled gas and electricity transmission networks on the security of energy supply by a model named SAInt. The importance of the hydraulic characteristic was stressed. Fu estimated the failure probability of gas supply using the central moment method [20] and data-driven model [21], respectively. Fan et al. [22] developed an evaluation method to calculate the gas supply reliability of the Shaanxi–Beijing NG pipeline systems. Yu et al. [23] proposed a novel methodology to assess the gas supply reliability of NG transmission pipeline systems, considering both gas supply capacity and market demand uncertainties, which were integrated into a single Monte Carlo simulation. Shaikh et al. [24] evaluated China’s NG supply security and employed a system-oriented modeling approach, namely, the ecological network analysis (ENA), to integrate all critical compartments of China’s NG supply system. Lu et al. [25] applied an ecological network analysis to simulate the NG supply system in China and systematically measured its overall security level, in which the network information analysis, structural analysis, and utility analysis were conducted. These research studies focused on the reliability analyses of the gas supply source or the relation between the supply and the demand market, neglecting the installed equipment on the pipelines, which included underground gas storage, liquefied natural gas (LNG) terminals, and compressor stations. Li thought that the safe and efficient operation and management of large-scale NG pipeline network systems should be carried out with the objectives of analyzing the reliability indicators, system reliability, unit reliability, reliability data, and reliability management framework of the pipeline network system. Further, Su et al. [26] thought that when the supply reliability assessment of NG pipeline networks was conducted, the failure probabilities of installed equipment should be considered. Compared with pipelines, compressor stations, LNG terminals, and NG storage [27] are relatively stable in their operation conditions, which means the failure probabilities can be obtained from the historical data. In general, some research has been devoted to various perspectives on the gas transmission network under uncertainty or reliability analyses. However, the evaluation of the capability of a gas transmission network to withstand the impact of a compressor outage has not received much attention [28], especially considering compressor operation styles in stations (i.e., serial, parallel, or both) [29]. A complex and large-scale gas transmission network in China includes pipelines, compressor stations, regulators, valves, and other components. They experienced challenges in evaluating the network capability to withstand the impact of the compressor outage [30].
Catchpole presented British Gas Corporation’s experience of gas compressor reliability growth to date and showed the methods that were used to evaluate operational trends, indicating the reliability growth of gas turbine-powered compressor units. Petrova et al. [31] obtained a mathematical model for determining the reliability of the compressor unit based on the compressor failure mode combined with the control and measurement instruments, showing a calculation method for the compressor failure rate. Tran et al. [32] put forward an effective maintenance policy for compressors at the national grid in the United Kingdom to mitigate the loss of network capability. Woo et al. [33] suggested a reliability methodology to improve the lifetime of a mechanical system, such as a compressor, which could contribute to gas supply safety. Gentsch and King [34] contributed to the modeling and supervision of multi-stage centrifugal compressors coping with real gas processes and steady-to-highly transient operating conditions. Li et al. [35] proposed a novel ejector-based detection system for thermodynamic measurements of compressors to promote their reliability. In the present research studies on the reliability analyses of compressors, the reliability of the compressor itself is the main focus. To consider the impact of the compressor stations on the gas transmission network capability, a standby compressor unit is always applied. Sidney Pereira dos Santos et al. [36] noted that a standby compressor unit was determined by the reliability of the compressor, and proposed a periodic/unscheduled maintenance strategy for the Bolivia–Brazil gas pipeline to calculate the reliability of the CS. Chen [37] believed that in order to ensure the pipeline gas supply, each compressor station should be equipped with at least one standby unit. Tang discussed the compressor station plans for the West–East Gas Pipeline. The unit standby and power standby modes were compared, considering factors such as the operation, unit maintenance, and investment. Though the impacts of the compressor unit on the gas pipelines were discussed, the quantitative reliability analysis was little cared about, which led to the fact that the standby plan was always designed according to the experiences, causing great investments in the compressor numbers or power.
The main contribution of this study was to design a method to optimize the standby scheme for the CS based on the reliability analysis. Firstly, the ratio of the actual flow that withstands the compressor outage to the designed flow was defined as the index to evaluate the reliability, in which the flow can be calculated by the combined pipeline and compressor equations after the standby scheme is determined. Then, Monte Carlo method was used to calculate the compressor outage probability of the whole pipeline, respectively, through which the initial number of standby compressors was obtained, considering the gas storage capacity of the pipeline. Further, the standby schemes were designed with the help of the initial number, in which the positions of the failed compressors were obtained by the Monte Carlo simulation, to find out the effective standby scheme that could satisfy the flow and pressure boundary. Moreover, according to the influence of the compressor outage on the pipeline flow, the worst situation in which the compressors were shut down was used to test the standby scheme, calculating the flow reliability, pressure boundary, and total power. Finally, the standby scheme, which has the largest reliability with minimum power, was determined. The results of the case study indicate that for the Xin–Yue–Zhe (XYZ) pipeline, which had 20 standby compressors in the original scheme, the number of standby compressors in the improved schemes was reduced by seven and the pipeline reliability reached 96.86%.
This paper is organized as follows. Section 2 presents the methods for the standby compressors based on the reliability analysis, feasibility analysis, and economic analysis, which are flow boundary, pressure boundary, and power, respectively. Section 3 describes the details of the XYZ pipeline project, for which the standby scheme was designed and validated. Finally, the conclusions and future work are provided in Section 4.
2. Methods
2.1. Reliability Index for CS
2.1.1. Definition of Reliability Index
For the compressor, there are many indices for reliability analyses, such as reliability, cumulative failure probability, failure rate, average life, etc. [38]. Because the reliability of the CS will influence the reliability of the pipeline system, the gas supply safety will also be influenced [39]. For the gas supply, the commonly used reliability index can be defined as:
where is the reliability index; is the designed or planned transportation flow of the pipeline; and is the flow under the standby plan of the CS, which can be obtained by solving the following equation:
where is the end pressure of the pipeline; is the starting pressure of the pipeline; is the height difference between the end point and the starting point of the pipeline; and are the heights of the i segment, of which the length is ; is the flow under standard conditions; is the flow coefficient; is the efficiency coefficient, which is generally 0.9~0.95; is the correction coefficient for the flow state, which equals to 1 when the flow falls in the fully developed turbulence state.
2.1.2. Pipeline Model
- (1)
- Flow equation.
The simplified structure of the gas pipeline network is shown in Figure 1.
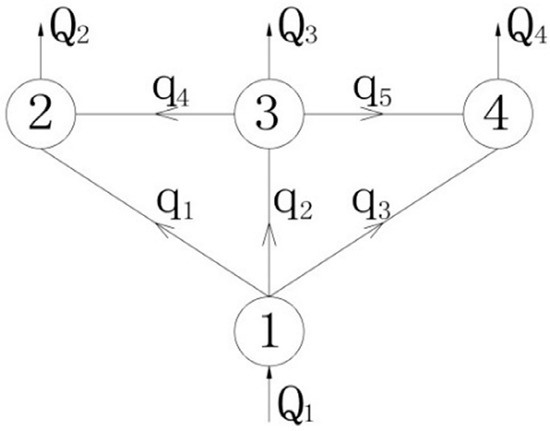
Figure 1.
Gas pipeline.
According to Kirchhoff’s first law [40], the flow balance equation can be written as follows:
where is the gas flow into node; is the absolute flow in the pipeline between , nodes, and ; is the coefficient, when there is no pipe connection at the node, , and when the gas flows from to , , otherwise .
- (2)
- Boundary conditions.
- 1.
- Intake/offtake volume constraint.
The intake gas volume of the pipeline depends on the gas supply source, and the offtake volume should be able to meet the user’s demand. Therefore,
where is the intake volume of node ; is the offtake volume; is the allowable minimum intake volume; is the allowable maximum intake volume; is the allowable minimum offtake volume; is the allowable maximum offtake volume.
- 2.
- Intake/offtake pressure constraint.
The intake and offtake pressure of the gas pipeline are constrained by the design pressure. The maximum pressure should not be larger than the design pressure. In addition, the minimum intake pressure is affected by the supply source, and the minimum offtake pressure needs to meet the user’s requirements. Therefore,
where is the intake pressure of the node ; is the offtake pressure; is the allowable minimum intake pressure; is the allowable maximum intake pressure; is the allowable minimum offtake pressure; is the allowable maximum offtake pressure.
- (3)
- Parallel compressor combination model.
Because most of the compressor units in the stations for the long-distance gas pipelines adopt the parallel mode, a parallel model for the compressor units in the station was applied in this study.
When solving the equations above, the nonlinear equations should be solved by the iteration method, which will become more complicated, especially when the CS is also considered. To accurately calculate the gas flow, pressure, and power for the standby scheme, a commercial software SPS was applied for further calculation.
2.2. Standby Scheme Design
The number and position of the standby compressors for each scheme should be confirmed, which means the number and position will determine the flow reliability. The purpose of the standby scheme is to turn on the standby unit when the working unit is shut down with failure or scheduled maintenance, by which the flow and pressure in the pipeline can be ensured. Therefore, the steps for the standby scheme can be carried out as follows:
- (1)
- Input the total number m of the compressors. NG pipelines have large gas storage capacities, which can stand for a certain period of time after the compressor is shut down. We confirm the outage probability for the single compressor and calculate the outage time using Monte Carlo simulation method. When equals , the number of compressors can be regarded as the maximum number of compressors out of working together, which can also be regarded as the initial or minimum numbers of the standby compressors.
- (2)
- After the initial number is confirmed, standby schemes can be obtained. For each standby scheme, there are faulted situations, which can be simulated by the Monte Carlo simulation, in which the position that has the larger influence on the pipeline system should be set as the faulted compressor position.
- (3)
- We use SPS to simulate the standby scheme with the worst faulted situation to calculate the flow and pressure, by which the reliability index R can be obtained. If , the standby scheme can be available. If , step (3) should be repeated to validate the standby scheme (i+1). All available plans will perform a set .
- (4)
- When the set is empty, steps (2)~(3) are repeated.
- (5)
- We calculate the power for each scheme in set and output the scheme with the minimum power.
The steps for the standby scheme can be seen in Figure 2.
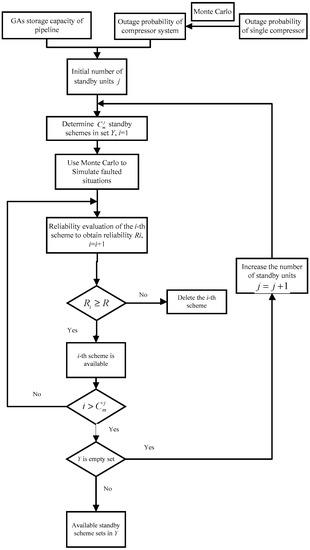
Figure 2.
Program steps for the standby scheme.
2.2.1. Outage Probability of Single Compressor
According to the North American Electric Reliability Commission, in 2005 [41], the outage probability of a single compress was determined as 7.06%.
2.2.2. Monte Carlo Simulation
The outage probability and time for the CS can be calculated using the Monte Carlo simulation method, which can be further used to calculate the initial number of standby units. The detailed steps of the Monte Carlo simulation can be seen in the S1 section of Supplementary Materials.
After the initial number is confirmed, standby schemes can be obtained. For each standby scheme, there are faulted situations, which can be simulated by the Monte Carlo simulation.
2.3. Feasibility and Economic Analysis of the Standby Scheme
After the standby scheme is confirmed, the flow of the pipeline for each standby scheme can be calculated, by which the flow reliability can be obtained. Further, the pressure boundary for each standby scheme can be used to validate the feasibility of the scheme. Moreover, an economic analysis of the power of the scheme should be conducted.
2.3.1. Feasibility Analysis with Pressure Boundary
The feasibility of the standby scheme means that when some of the compressor units are shut down, the normal operation of the pipeline can be guaranteed by turning on the standby unit.
After the standby scheme is obtained, the set of commonly used units is , the set of faulted units is , and the set of compressor units in the standby scheme is . For the unit, the compressor set in the operating state is . Moreover, the working condition of the standby scheme should be calculated using SPS. If none of the following boundaries exist, the standby scheme can be regarded as satisfied.
- (1)
- The inlet pressure of the compressor is lower than the required inlet pressure;
- (2)
- The operating pressure over a long distance is significantly lower than the designed one.
2.3.2. Economic Analysis with Power
After the feasibility analysis of the standby scheme, the flow and power of different schemes will vary, through which, the following index can be defined:
where is the power of the i–th compressor; is the number of compressors; is the pipeline flow; E is the economic parameter.
3. Case Study
The Xin–Yue–Zhe (XYZ) pipeline was used for the case study; it runs from the first station in Yining, Xinjiang, to the last station in Shaoguan, Guangdong, with a total length of 8372 km. Passing through 13 provinces, the pipeline has 1 main line and 6 branch lines, of which 23 compressor stations are applied to transport NG with 30 billion m3 per year. The total length of the main line is 4160 km, which has 20 compressor stations and 14 distribution stations. According to the design plan, each of the 20 compressor stations is equipped with 2 to 3 commonly used compressors, and with one standby compressor, which means 20 more compressors should be equipped as the standby units. The pipeline system is shown in Figure 3.
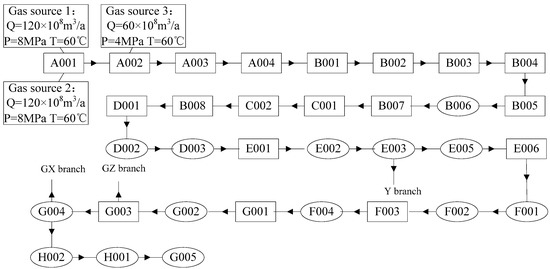
Figure 3.
XYZ pipeline project.
The square blocks represent the compressor station and the ellipse blocks represent the distribution station. The detailed information of the compressor station can be seen in Table 1.

Table 1.
Compressors under working conditions.
SPS can be applied to calculate the pressure and flow along the pipeline. The boundary conditions are set as follows: gas sources 1 and 2 have the same parameters, which can be regarded as one source with the pressure boundary; gas source 3 and each distribution point are set as the flow boundary; the outlet pressure and maximum power for the compressor are set. The results can be seen in S2 of Supplementary Materials section.
The results of the numerical simulation indicate that the flow meets the design requirements and the power for each compressor satisfies the power consumed by gas transportation. The outlet pressure falls into the design pressure range, and the inlet pressure meets the need for the compressor. These indicate that the numerical model can be applied for further simulations.
In Figure 3, there are three gas sources for the XYZ pipeline, which are the inlets from the A001 and A002 stations, respectively. If the compressors in these two stations fall in an outage, the pipeline will not work. Therefore, stations A001 and A002 must be equipped with standby compressor units. The optimization of standby scheme is only for the remaining 18 stations.
3.1. Standby Scheme for the Remaining 18 Stations
3.1.1. Boundary Conditions for the Compressor Stations
- (1)
- Pressure boundary conditions.
There are 27 distribution points that serve as the gas sources for the downstream users. The pressure boundaries for each distribution station can be obtained as shown in Table 2.
Table 2.
Pressure boundaries of each distribution point.
In Table 2, the pressure boundaries in most of the distribution stations should be larger than 4 MPa, and the pressures of E003, G003, G004, and H002 stations are higher, which should be considered in priority.
- (2)
- Shaft power.
The designed power for the compressor in Table 1 can be used to calculate the shaft power, considering the efficiency of the driving mode, which is 55% for the electric driving mode and 85% for the combustion mode, respectively. In addition, the shaft power of the compressor can vary within a range of 110% for the upper limit, and 75% for the lower limit, respectively. The calculated shaft power limits can be seen in Table 3.
Table 3.
Power limits.
3.1.2. Number of Standby Compressor Units
- (1)
- Pipeline gas storage capacity.
When the gas sources and all of the compressor stations fail, the gas storage capacity of the XYZ pipeline can withstand the gas transportation for a period. Using the pressure boundaries for each distribution station, the pressure distribution of the whole pipeline can be seen in Figure 4.
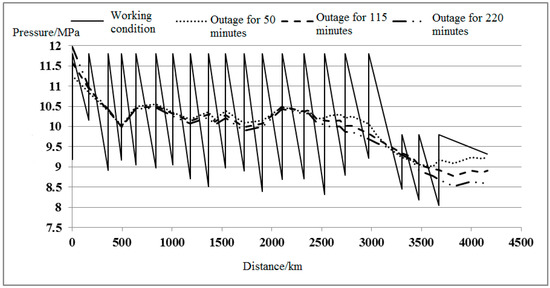
Figure 4.
Pressure changes along the pipeline after the compressors are shut down.
In Figure 4, as the time went for 220 min after the compressors were shut down, the pressure of station G003 decreased to 8.69 MPa, which would not supply the gas if the pressure continued to decrease. Therefore, the longest time to withstand the gas due to gas storage capacity was 220 min.
- (2)
- Number of compressors in the outage.
The outage probability for the single compressor unit was 7.06%. The outage probability and time calculated by the binomial distribution method and Monte Carlo method can be seen in Table 4.
Table 4.
Outage probability and time.
In Table 4, the probability of 10 compressors being shut down at the same time was 0.12%, of which the outage time was 0.45 days or 648 min; the probability of 11 units being shut down at the same time was 0.03%, and the time was 0.12 days or 172.8 min. Likewise, the outage time of 10 compressors was 0.4015 days or 578.16 min; the outage time of 11 compressors was 0.146 days or 210.24 min. Therefore, according to the withstanding time by the capacity, the maximum number that was shut down at the same time was 11, which means the number of standby compressors should be more than 11.
Therefore, there will be at least standby schemes.
3.1.3. Standby Scheme
When the initial number of standby compressor units is 11 and the reliability index is assumed at 100%, according to the steps for the standby scheme in Figure 2, the pressure boundary for each standby scheme can be obtained by Equation (2). If the pressure satisfies the boundary in Table 2, the scheme can be regarded as available. Thereafter, 13 schemes are available as shown in Table 5.
Table 5.
Standby scheme.
The schemes in Table 5 validate that 11 standby compressor units can be applied as the standby scheme.
3.2. Reliability and Economic Analysis
3.2.1. Reliability Analysis
The 13 standby schemes obtained in Table 5 were reduced from 20 standby compressors, of which, the flow reliability should be calculated, using the SPS simulation.
To calculate the flow, the position of the faulted compressor should be confirmed first. Considering that, for each standby scheme there are kinds of faulted compressor schemes, which can be simulated by the Monte Carlo method. If the standby scheme satisfies the worst situation, the standby scheme can be regarded as reliable.
When two or more compressors in one station fail, the probability is 0.5% or 1%, respectively. Therefore, in most of the actual situations, the outage with one compressor in a station has the highest probability. When there is only one compressor shut down in a station, reduced flow and power can be obtained, as seen in Figure 5.
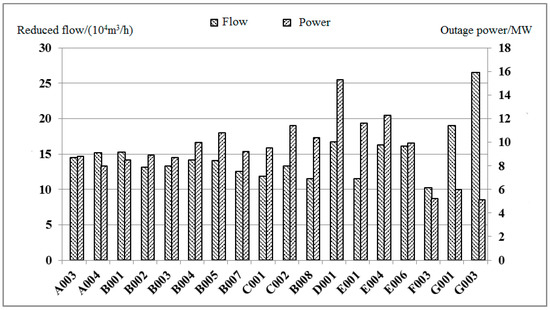
Figure 5.
Influence of different faulted compressor positions on flow and power.
According to the reduced flow in Figure 5, the outage compressor stations should be set as the following sequence: G003, G001, D001, E004, E006, B001, A004, A003, B004, B005, B003, C002, B002, B007, C001, E001, B008, F003. If the compressor in the station without the standby compressor fails, which will lead to more severe consequences, the faulted compressor should be set in the station without standby compressors. Both aspects being taken into consideration, the worst compressor positions shutting down—corresponding to the standby compressors—should be set, as shown in Table 6.
Table 6.
Positions of the faulted compressors.
If one compressor (from the stations shown in Table 6) is shut down, and the standby compressor starts, the number of compressors under working conditions can be seen in Table 7.
Table 7.
Numbers of working compressors.
When the compressors in Table 7 are working, the pressure, flow, and temperature of the pipeline can be obtained, of which, the pressure of stations E003, G003, G004, and H002 are obtained in Table 8.
Table 8.
Pressures of the take points in different schemes.
The pressures in Table 8 are higher than the pressure boundaries, which means the standby schemes are available.
The flow of the main pipeline can be seen in Table 9.
Table 9.
Flow of different standby schemes.
In an actual situation, the flow volume with negative fluctuations of 5% can be accepted, which means the reliability index of the pipeline can be determined as R = 95% [42]. Therefore, the standby schemes in Table 9 are all reliable.
3.2.2. Economic Analysis
Through the above analyses based on the flow reliability and the pressure boundary, 13 standby schemes are reliable and available. However, since the power for different schemes is different, the economic analysis should be conducted by calculating the power; the results can be seen in Table 10.
Table 10.
Shaft power of compressor stations for different schemes.
Moreover, can be calculated using the power in Table 10, of which the results can be seen in Table 11.
Table 11.
Evaluation parameter E.
In Table 11, Scheme 2 has the smallest cost, indicating that Scheme 2 is the optimal standby scheme. A total of 13 standby compressors are required, which is reduced by 7, and the pipeline reliability can reach 96.86%.
4. Conclusions and Policy Implications
In this study, an optimization method for the compressor standby scheme was designed and developed using the reliability analysis and economic analysis based on the Monte Carlo simulation. The following conclusions and policy implications were drawn:
- (1)
- The flow reliability was proposed according to the ratio of the actual flow, which withstands the compressor outage to the designed flow.
- (2)
- The binomial distribution method and Monte Carlo method were used to calculate the compressor outage probability of the whole pipeline, respectively, through which the initial number of standby compressors was obtained, considering the gas storage capacity of the pipeline.
- (3)
- The standby schemes were designed with the help of the Monte Carlo simulation, to find out the effective standby scheme that could satisfy the flow and pressure boundaries.
- (4)
- According to the influence of the compressor outage on the pipeline flow, the worst situation in which the compressors were shut down was used to test the standby scheme, calculating the flow reliability, pressure boundary, and total power. The standby scheme that had the largest reliability with minimum power was determined.
- (5)
- The proposed method was applied in the case study of the Xin–Yue–Zhe (XYZ) pipeline. The number of standby compressors was reduced to 13 from 20 and the pipeline reliability reached 96.86%.
- (6)
- In the future, because the outage probability determines the final compressor system, the outage probability of the single compressor should be noticed as the historical data are recorded. Moreover, the operation styles and the number of compressors in stations should be considered according to the actual situation. In addition, a method to calculate the flow of the pipeline more precisely will be required to accelerate the standby scheme design process.
Supplementary Materials
The following supporting information can be downloaded at: https://www.mdpi.com/article/10.3390/en15218305/s1, Figure S1: Flow diagram of the optimal multiplier; Figure S2: Principle diagram of importance sampling method; Figure S3: Principle diagram of modified importance sampling method; Figure S4: Main line graph under design condition; Table S1: Compressor shaft power.
Author Contributions
Software, X.L.; investigation, X.L.; data curation, Y.L.; writing—original draft preparation, Y.X.; writing—review and editing, Y.X.; supervision, Q.F. All authors have read and agreed to the published version of the manuscript.
Funding
This research was funded by the Guangdong Provincial Key R&D Program (grant number 2019B111102001).
Institutional Review Board Statement
Not applicable.
Informed Consent Statement
Not applicable.
Data Availability Statement
Not applicable.
Conflicts of Interest
The authors declare no conflict of interest.
References
- Li, G.Q.; Sun, L.G.; Mao, P.P.; Liu, S.S. New technologies used in compressor station design of long–distance gas pipeline. Oil Gas Storage Trans. 2012, 31, 884–886. [Google Scholar]
- Tang, S.H.; Chen, X.X. Discussion on Optimization Arrangement & Equipment Distribution of Compressor Stations in West–east Pipeline. Petro. Eng. Constr. 2003, 29, 12–14. [Google Scholar]
- Wang, L.; Luo, Z.P. Compressor style determination for natural gas main pipelines. China Chem. Trade 2012, 3, 47–48. [Google Scholar]
- Rimkevicius, S.; Kaliatka, A.; Valincius, M.; Dundulis, G.; Janulionis, R.; Grybenas, A.; Zutautaite, I. Development of approach for reliability assessment of pipeline network systems. Appl. Energy 2012, 94, 22–33. [Google Scholar] [CrossRef]
- Efimenko, L.A.; Konovalova, O.V.; Efimenko, A.M. Evaluating pipeline causes from metal structural mechanics states. Chem. Pet. Eng. 1999, 35, 56–58. [Google Scholar] [CrossRef]
- Baker, T.N.; Rochfort, G.G.; Parkins, R.N. Pipeline rupture—Conclusion. Stress–corrosion cracking studies prompt changes in pipeline operating conditions. Oil Gas J. 1987, 2, 37–38. [Google Scholar]
- Mercer, W.L. Stress–corrosion cracking of mild steel in phosphate solution. In Sixth Symposium on Line Pipe Research; American Gas Association: Houston, TX, USA, 1979; pp. W1–W32. [Google Scholar]
- Iverson, W.P. Microbial corrosion of metals. Adv. Appl. Microbiol. 1987, 32, 1–36. [Google Scholar]
- Seventh Report of the European Gas Pipeline Incident Data Group. 1970–2007 [Document Number EGIG 08. TV–B.0502, 2008]. Available online: https://scirp.org/reference/referencespapers.aspx?referenceid=1113055 (accessed on 15 July 2022).
- Suna, Y.; Ma, L.; Morris, J. A practical approach for reliability prediction of pipeline systems. Eur. J. Oper. Res. 2009, 198, 210–214. [Google Scholar] [CrossRef]
- Crawley, F.K.; Lines, I.G.; Mather, J. Oil and gas pipeline failure modelling. Process Saf. Environ. Prot. 2003, 81, 3–11. [Google Scholar] [CrossRef]
- Han, Z.Y.; Weng, W.G. An integrated quantitative risk analysis method for natural gas pipeline network. J. Loss Prev. Process Ind. 2010, 23, 428–436. [Google Scholar] [CrossRef]
- Amirat, A.; Chateauneuf, A.; Chaoui, K. Reliability assessment of underground pipelines under the combined effect of active corrosion and residual stress. Int. J. Press. Vessel. Pip. 2006, 83, 107–117. [Google Scholar] [CrossRef]
- Eser, P.; Chokani, N.; Abhari, R. Impact of Nord Stream 2 and LNG on gas trade and security of supply in the European gas network of 2030. Appl. Energy 2019, 238, 816–830. [Google Scholar] [CrossRef]
- Praks, P.; Kopustinskas, V.; Masera, M. Probabilistic modelling of security of supply in gas networks and evaluation of new infrastructure. Reliab. Eng. Syst. Saf. 2015, 144, 254–264. [Google Scholar] [CrossRef]
- Monforti, F.; Szikszai, A. A MonteCarlo approach for assessing the adequacy of the European gas transmission system under supply crisis conditions. Energy Policy 2010, 38, 2486–2498. [Google Scholar] [CrossRef]
- Szikszai, A.; Monforti, F. GEMFLOW: A time dependent model to assess responses to natural gas supply crises. Energy Policy 2011, 39, 29–36. [Google Scholar] [CrossRef]
- Flouri, M.; Karakosta, C.; Kladouchou, C.; Psarras, J. How does a natural gas supply interruption affect the EU gas security? A Monte Carlo simulation. Renew. Sustain. Energy Rev. 2015, 44, 785–796. [Google Scholar] [CrossRef]
- Pambour, K.A.; Erdener, B.C.; Bolado-Lavin, R.; Dijkema, G.P.J. SAInt—A novel quasi–dynamic model for assessing security of supply in coupled gas and electricity transmission networks. Appl. Energy 2017, 203, 829–857. [Google Scholar] [CrossRef]
- Fu, X.; Zhang, X. Failure probability estimation of gas supply using the central moment method in an integrated energy system. Appl. Energy 2018, 219, 1–10. [Google Scholar] [CrossRef]
- Fu, X.; Li, G.; Zhang, X.; Qiao, Z. Failure probability estimation of the gas supply using a data–driven model in an integrated energy system. Appl. Energy 2018, 232, 704–714. [Google Scholar] [CrossRef]
- Fan, M.; Gong, J.; Wu, Y.; Kong, W. Gas supply reliability analysis of the Shaanxi–Beijing gas pipeline network based on the simplified topological structure. Nat. Gas Ind. 2017, 37, 123–129. [Google Scholar]
- Yu, W.; Song, S.; Li, Y.; Min, Y.; Huang, W.; Wen, K.; Gong, J. Gas supply reliability assessment of natural gas transmission pipeline systems. Energy 2018, 162, 853–870. [Google Scholar] [CrossRef]
- Shaikh, F.; Ji, Q.; Fan, Y. Evaluating China’s natural gas supply security based on ecological network analysis. J. Clean. Prod. 2016, 139, 1196–1206. [Google Scholar] [CrossRef]
- Lu, W.; Su, M.; Fath, B.D.; Zhang, M.; Hao, Y. A systematic method of evaluation of the Chinese natural gas supply security. Appl. Energy 2016, 165, 858–867. [Google Scholar] [CrossRef]
- Su, H.; Zhang, J.; Zio, E.; Yang, N.; Li, X.; Zhang, Z. An integrated systemic method for supply reliability assessment of natural gas pipeline networks. Appl. Energy 2018, 209, 489–501. [Google Scholar] [CrossRef]
- Yu, W.; Gong, J.; Song, S.; Huang, W.; Li, Y.; Zhang, J.; Hong, B.; Zhang, Y.; Wen, K.; Duan, X. Gas supply reliability analysis of a natural gas pipeline system considering the effects of underground gas storages. Appl. Energy 2019, 252, 113418. [Google Scholar] [CrossRef]
- Li, M.F.; Zheng, H.L.; Xue, X.D.; Xue, L.N.; Ai, M.Y.; Ma, W.H. Reliability evaluation and management of PetroChina’s large–scale system of natural gas pipeline networks. J. Nat. Gas Geosci. 2019, 4, 287–295. [Google Scholar] [CrossRef]
- Mao, P.; Xu, Q.; Yuan, L.; Wang, X. Comparision of backup mode of compressor unit in gas compressor station of gas pipeline. Oil Gas Storage Trans. 2015, 6, 646–648. [Google Scholar]
- Catchpole, J.O.; Kelly, M.J.; Musgrave, C. Reliability growth of gas turbine powered compressor units. Reliab. Eng. 1984, 8, 235–254. [Google Scholar] [CrossRef]
- Petrova, I.M.; Filimonov, M.A. Reliability Assessment of the Compressor Connecting Rods. J. Mach. Manuf. Reliab. 2018, 47, 142–146. [Google Scholar] [CrossRef]
- Tran, T.H.; French, S.; Ashman, R.; Kent, E. Impact of compressor failures on gas transmission network capability. Appl. Math. Model 2018, 55, 741–757. [Google Scholar] [CrossRef]
- Woo, S.W.; Pecht, M.; O’Neal, D.L. Reliability design and case study of the domestic compressor subjected to repetitive internal stresses. Reliab. Eng. Syst. Saf. 2020, 193, 106604. [Google Scholar] [CrossRef]
- Gentsch, M.; King, R. Real–time estimation of a multi–stage centrifugal compressor performance map considering real–gas processes and flexible operation. J. Process Control 2020, 85, 227–243. [Google Scholar] [CrossRef]
- Li, X.; Wang, X.; Zhang, Y.; Fang, L.; Deng, N.; Zhang, Y.; Jin, Z.; Yu, X.; Yao, S. Experimental and economic analysis with a novel ejector–based detection system for thermodynamic measurement of compressors. Appl. Energy 2020, 261, 114395. [Google Scholar] [CrossRef]
- dos Santos, S.P.; Bittencourt, M.A.S.; Vasconcellos, L.D. Compressor Station Availability: Managing Its Effects on Gas Pipeline Operation. In Proceedings of the 2006 International Pipeline Conference, Calgary, AB, Canada, 25–29 September 2006; American Society of Mechanical Engineers: Calgary, AB, Canada, 2006. [Google Scholar]
- Chen, R.G. Power of compressor for natural gas pipelines. Petro. Design 2000, 6, 1–3. [Google Scholar]
- Li, M.F.; Zhou, L.J.; Zheng, H.L. Current reliability assessment techniques for natural gas pipeline networks in China. Oil Gas Storage Trans. 2015, 5, 464–468. [Google Scholar]
- Zhang, Z.J.; Xie, Q.Q.; Wen, J.B. Reliability evaluation method for gas trunk line. Oil Gas Storage Trans. 2014, 8, 807–812. [Google Scholar]
- Li, Y.X.; Yao, G.Z. Design and Management for Natural Gas Pipelines; China University Petroleum Press: Dongying, China, 2009. [Google Scholar]
- North American Electric Reliability Council; NERC Report of January 2005; Princeton Forrestal Village: Princeton, NJ, USA, 2005.
- Ai, M. Discussion on issues regarding the reliability of large-scale oil and gas pipeline network systems. Oil Gas Storage Transp. 2013, 32, 1265–1270. [Google Scholar]


Publisher’s Note: MDPI stays neutral with regard to jurisdictional claims in published maps and institutional affiliations. |
© 2022 by the authors. Licensee MDPI, Basel, Switzerland. This article is an open access article distributed under the terms and conditions of the Creative Commons Attribution (CC BY) license (https://creativecommons.org/licenses/by/4.0/).