Article

Characteristics of the Fracture Process Zone for Reservoir Rock with Various Heterogeneity

1
Key Laboratory of Shale Gas and Geoengineering, Institute of Geology and Geophysics, Chinese Academy of Sciences, Beijing 100029, China
2
Innovation Academy for Earth Science, CAS, Beijing 100029, China
3
Chinese Society for Rock Mechanics and Engineering, Beijing 100029, China
*
Author to whom correspondence should be addressed.
Energies 2022, 15(22), 8332; https://doi.org/10.3390/en15228332
Submission received: 8 October 2022 / Revised: 4 November 2022 / Accepted: 6 November 2022 / Published: 8 November 2022
(This article belongs to the Special Issue Fracture Mechanics and Energy Geo-Structures)

Abstract

:
Hydraulic fracturing for oil-gas and geothermal reservoir stimulation is closely related to the propagation of Mode I crack. Nonlinear deformation due to rock heterogeneity occurs at such crack tips, which causes the fracture process zone (FPZ) to form before the crack propagates unsteadily. However, the relationship between the FPZ characteristics and rock heterogeneity still remains elusive. We used three rock types common in reservoirs for experimental investigation, and each of them includes two subtypes with different heterogeneity due to grain size or microstructural characteristics. Drawing on the experiment results, we calculated the FPZ size (represented by the radius of an assumed circular FPZ) in each cracked chevron-notched Brazilian disk, and we reproduced the formation process of the FPZ in marble using the discrete element method. We showed that strong heterogeneity is favorable to large FPZ size, can enhance the ability of crack generation and make crack morphology complex. Coupling the Weibull distribution with fracture mechanics, the dependence of the FPZ size on heterogeneity degree can be theoretically explained, which suggests that the inherent heterogeneity of rocks sets the physical foundation for formation of FPZs. These findings can improve our recognition of propagation mechanisms of Mode I cracking and provide useful guidelines for evaluating reservoir fracability.

Graphical Abstract

1. Introduction

Hydraulic fracturing is extensively used to stimulate oil-gas and geothermal reservoirs. This technique involves the propagation of cracks driven by injected fluids. The majority of the hydraulic cracks can be viewed as Mode I cracks, as defined by fracture mechanics [1], because fluid pressures imposing on crack surfaces are approximately equivalent to remote tensions in nature. Therefore, the propagation mechanism of Mode I crack is a significant fundamental subject for raising the conductivity of fracture networks by hydraulic fracturing.
Natural rocks usually contain various microscopic structures, such as mineral grain boundaries, cleavages, interfaces, pores, and cracks [2,3,4]. Compared to mineral crystal, these structures are local weak zones in rocks. Furthermore, various rock-forming mineral grains usually have distinct mechanical properties, and the contacts between grains can also be different. Lan et al. [5] referred to these terms of heterogeneity as geometric, elastic and contact heterogeneities. These properties make the distribution of mesoscopic strength in rocks heterogeneous, and micro cracking will initiate from tips of microstructures due to stress concentration [6]. Micro cracks arising around the tips connect and coalesce progressively with increasing load, forming macroscopic cracks and causing them to extend in an unstable manner, i.e., spontaneous propagation under unchanged load. Such a zone at a crack tip in which many micro cracks grow is called a fracture process zone (FPZ) [7]. The formation of FPZs represents the preparation process for the unstable crack propagation and indicates the nonlinear rock deformation. The size of the FPZs (e.g., length and width) suggests the degree of the nonlinearity and is thereby one of the most critical parameters for characterizing the cracking behavior of rocks.
To this end, quite a few researchers have investigated the effect of various factors on the FPZ size. For example, Labuz et al. [8] observed that FPZs in Rockville granite (average grain size 10 mm) were longer than those in Charcoal granite (average grain size 1 mm) during double-cantilever-beam tests. Moazzami et al. [9] reported that the FPZ length differs across lithology, which may also be related to different grain sizes. Zietlow and Labuz [10] proposed an approximately linear relation between the width of the FPZ and the logarithm of the grain size. These studies suggest that FPZ size can be positively related to grain size, and this speculation is consolidated by the nanoscale observation [11]. The scale effect of specimen on the FPZ size is similar to the effect of grain size: the FPZ size was observed to grow with the scale of specimens, increasing in both single-edge notch bending and semi-circular bend tests [9,12,13].
The importance of microstructures to the FPZ size have been recognized. For example, Haidar et al. [14] found that the existence of pores caused the distribution regions of acoustic emission (AE) events in front of notch tips (i.e., FPZs) to extend. Guha Roy et al. [15] investigated the effect of joints and showed a negative correlation between the FPZ size and joint spacing.
The aforementioned research revealed that the FPZ size is highly dependent on the physical, geometrical and structural properties of rocks. In fact, these properties can be associated with heterogeneity: grain size and microstructure can influence the strength spatial distribution within rocks, and large specimens usually contain more microstructures. Several researchers [16,17,18] pointed out that the heterogeneity of reservoir rocks have impacts on its fracability, i.e., the possibility for reservoirs to create adequate fractures permitting fluid transportation. For example, Yang et al. [18] showed that the hydraulic fracture path becomes smooth as the heterogeneity degree of a reservoir decreases, which is unfavorable to connecting pores and natural preexisting cracks. Reliable fracability evaluation is a critical issue in hydraulic fracturing design. Considering that both the FPZ size and fracability rely on reservoir heterogeneity, the former may be useful for evaluating the latter.
However, the relationship between the characteristics of the FPZ (such as its size and formation process) and heterogeneity has not yet been clarified, and the mechanism behind the impact of heterogeneity on fracability also remains to be uncovered. To this end, we investigated the effect of heterogeneity on the FPZ characteristics through experiments, numerical simulations and mechanical analysis. The expected findings can improve our understanding of the essential mechanism of FPZ formation, which sets a firm physical foundation for a reliable evaluation of fracability.

2. Materials and Methods

2.1. Lithology, Texture Characteristics and Heterogeneity

We purchased marble, limestone and shale from the construction material market in Beijing, China for the experimental investigations. Marble was reported to comprise certain geothermal reservoirs [19], and limestone and shale are common lithology of conventional and unconventional oil-gas reservoirs. Therefore, engineering implications in energy resources exploitation can be acquired from research into these rock types. The texture and composition information of the used rock materials were acquired through petrographic microscopy observation and X-ray diffraction (XRD) analysis (using X’Pert PRO MPD; PANalytical Ltd., Spectris Group, London, UK).
The marble with a massive structure includes subtypes J and K. J mainly consists of dolomite (Table 1), and it is medium-grained marble with a homogranular texture. The major composition of coarse-grained marble K is calcite. Their average grain sizes are 1–2 mm and 2–4 mm (Figure 1a,b), respectively. The marble K is more heterogeneous because larger grains usually have lower boundary cohesion [20], which results in significant differences of strength between grains and contacts.
The used massive cryptocrystalline limestone specimens consist only of calcite (Table 1). They can be divided into subtypes P and N according to the characteristics of the ooid. The limestone P contains homogeneous ooid whose size is close to 2 mm (Figure 1c). The ooid size of N falls in the range of 1–5 mm, and coarse calcite grains are observed in the matrix (Figure 1d). In addition, the ooid size of the N has a wider range that corresponds to a heterogeneous size distribution. The coarse calcite grains also enhance the heterogeneity. For these reasons, the limestone N is more heterogeneous than P.
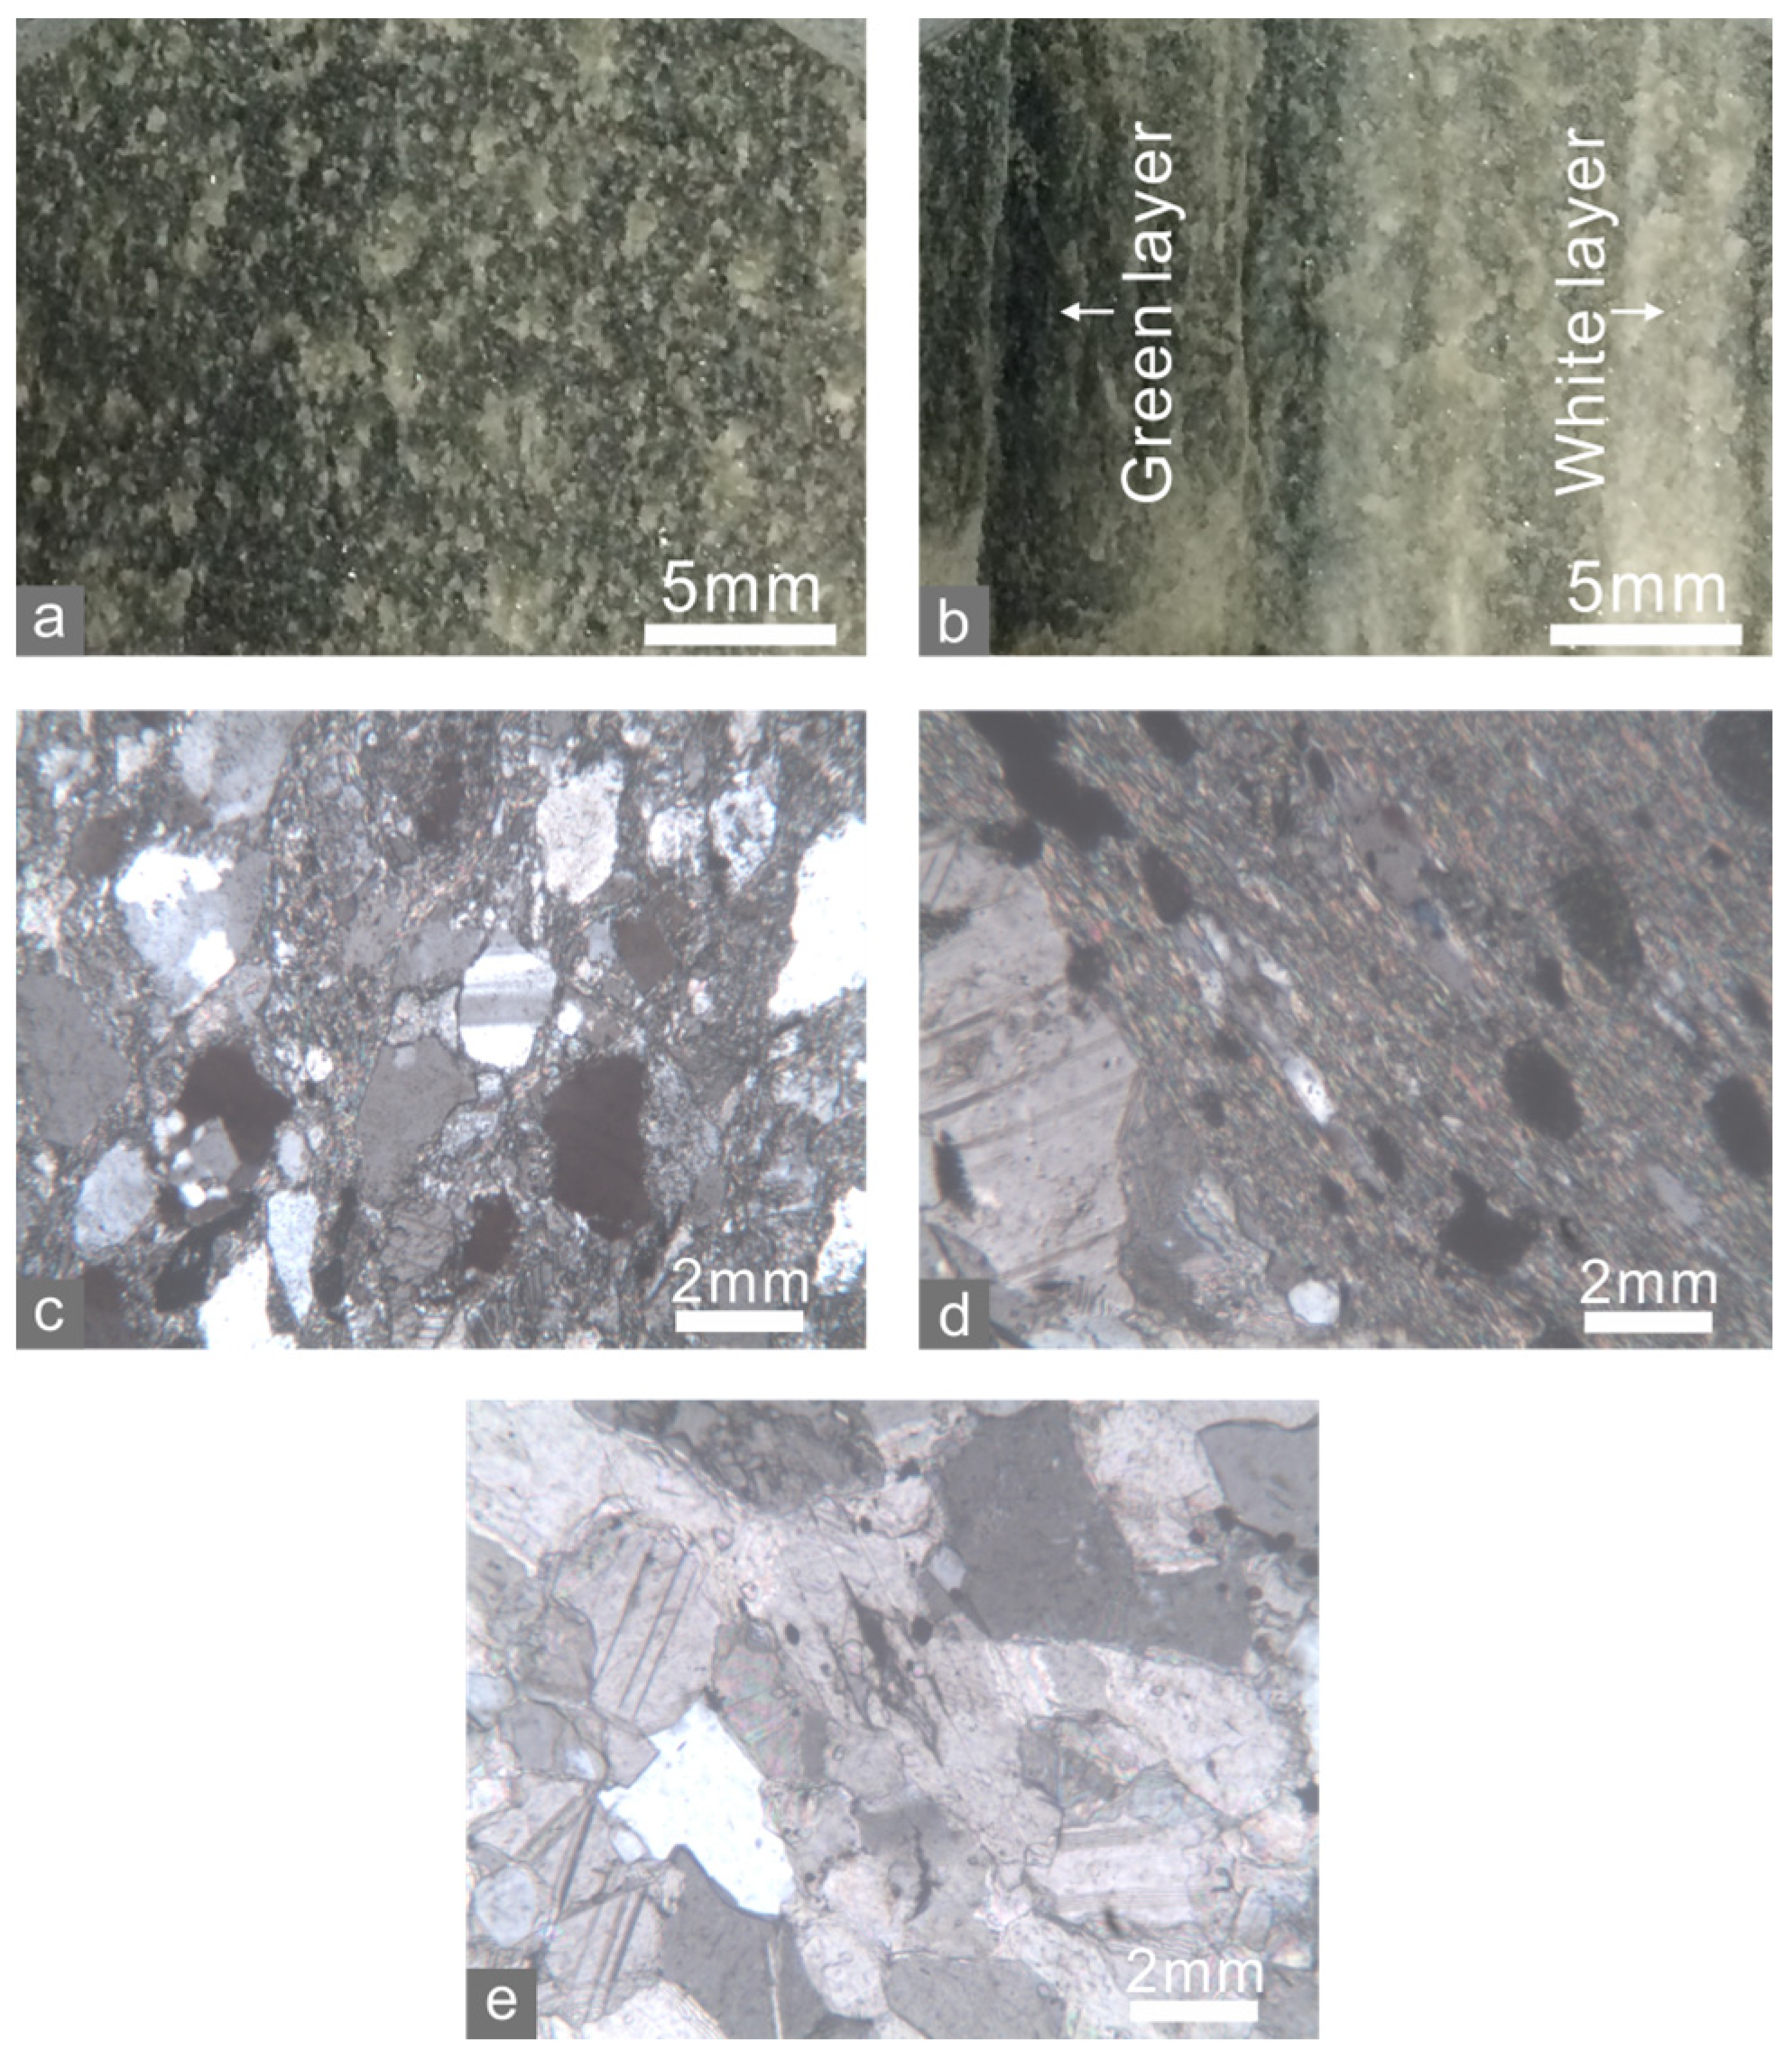
The shale can be divided into subtypes S1 and S2 owing to their different characteristics of mineral distribution. The shale comprises white (mainly calcite and quartz) and green minerals (their XRD results are shown in Table 1). The white minerals scatter homogeneously in each layer of S1, mixing with the green minerals (Figure 2a), whereas white and green layers are alternative in S2 (Figure 2b); therefore, S2 is more heterogeneous than S1. Corresponding to the XRD results, microscopy observation of S1 shows ~2 mm quartz, feldspar and calcite grains (white minerals) inset into fine-grained matrix (green minerals) (Figure 2c). The matrix existing as green layers in S2 is constituted by oriented fine grains (Figure 2d), and the white layers are composed of coarse calcite and quartz grains (Figure 2e).

2.2. Measurement Method of the FPZ Size

The FPZ size can be measured directly during or after rock mechanical experiments using various techniques, e.g., AE monitoring [21] and digital image correlation [22]. These methods are usually limited to relatively intact and large specimens so that sensors can be set to carry out observations. However, such specimens can be difficult to obtain using slim cores collected from exploring wells. Another measurement method is to calculate the FPZ size based on certain parameters measured by experiments [23]. The general expression of the FPZ size rc is as follows [1]:
r c = α ( K IC σ Y ) 2
where KIC is the Mode I fracture toughness, σY is the yield strength, and α is a coefficient related to specimen geometry. The σY is determined by yield criterion: the Mises and Tresca criteria are suited for metals, while the maximum tensile strength criterion is widely used for rocks, because the yield strength σY of rocks under tension often lies close to their tensile strength σt [11]. Based on this criterion, the FPZ is assumed to be a circular region that is centered by the crack tip, and thus the FPZ size is represented by its radius. The calculation formula of the radius [7] is
r c = 1 2 π ( K IC σ t ) 2 .
Considering its convenience and reliability [11], we use this method to measure the FPZ size.

2.3. Measurement Methods of Tensile Strength and Mode I Fracture Toughness

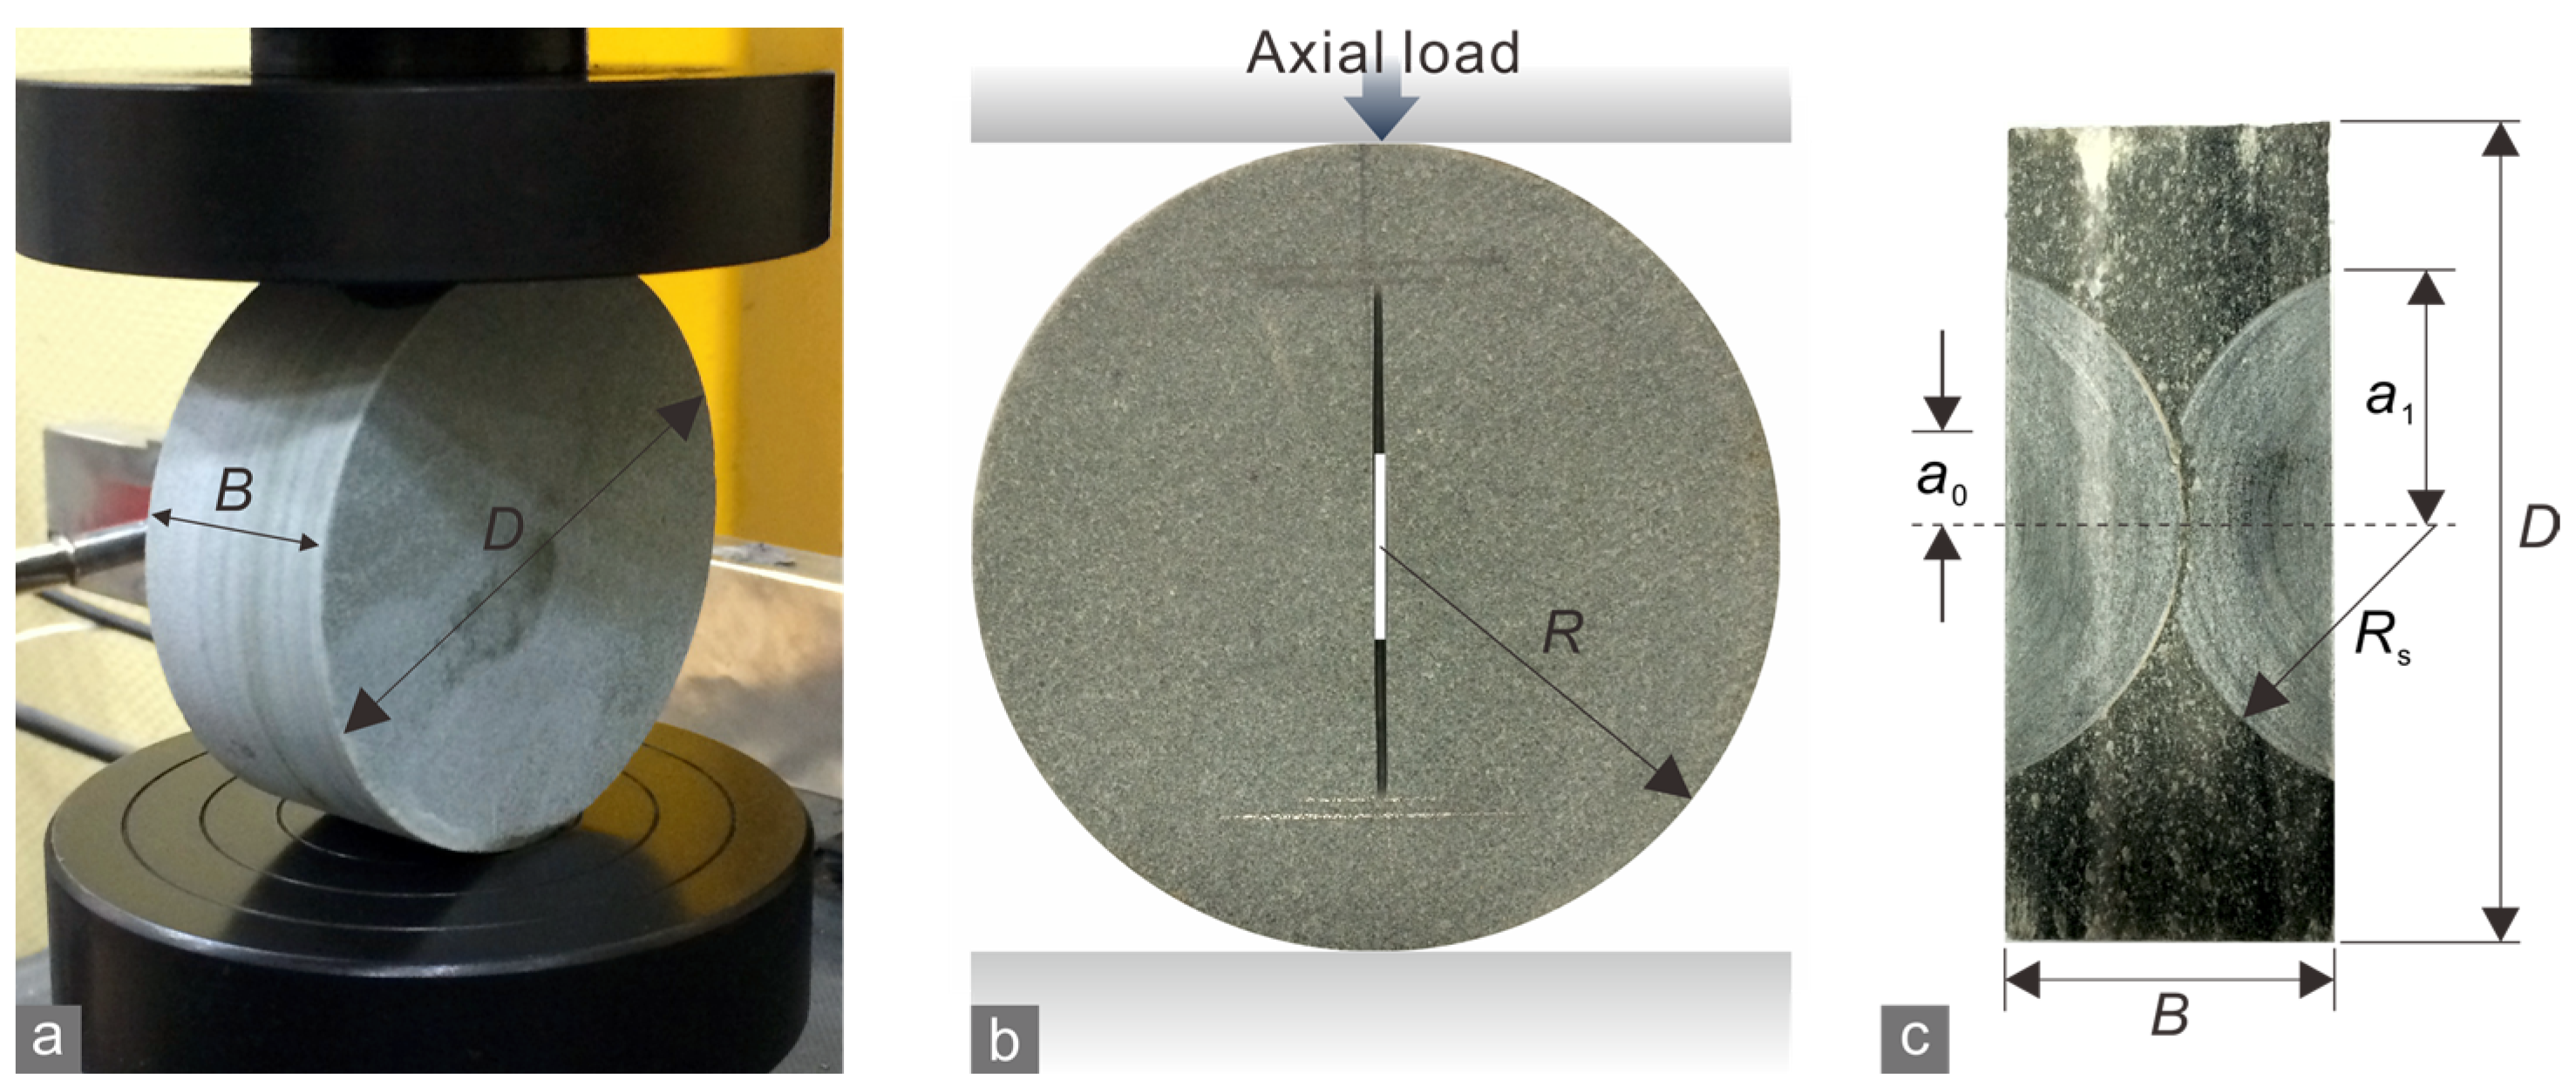
The calculation of the FPZ radius using Equation (2) requires the σt and KIC of rocks. The Brazilian disk (BD) test that International Society for Rock Mechanics (ISRM) [24] and American Society for Testing Materials (ASTM) [25] recommend is the most extensively used method for measuring the tensile strength of rocks. Referring to the suggestion from ASTM [25] that the range of thickness (B)-to-diameter (D) ratio is 0.2–0.75 and the diameter of BD specimens should be larger than 50 mm, the BD specimens is set to be 75 mm in diameter and 30 mm in thickness (Figure 3a). Each BD test was performed at a constant displacement rate of 0.06 mm/min by an MTS servo-control testing machine (series CMT) until the specimen ruptured. The tensile strength σt is calculated by
σ t = 2 P max π B D
where Pmax is the maximum applied axial load. BD tests were conducted on at least three specimens in parallel with the same lithology, and their average strength was taken as the tensile strength of the rock type.
The KIC of rocks can be measured using several methods [26,27,28], as the ISRM recommended, including the chevron-notched three-points round bar, the chevron-notched short rod, the semi-circular bend and the cracked chevron-notched Brazilian disk (CCNBD). We used the CCNBD test because it gives stable and reliable results. What is more important, CCNBD specimens have similar boundary conditions and geometry to BD specimens, which can eliminate the effects of loading conditions and size as much as possible.
The notched crack of each CCNBD specimen was created by a circular diamond saw. The actual values of the geometric parameters (shown in Figure 3b,c) were measured to confirm that the dimensionless parameters α1 and αB of all CCNBD specimens fall within the valid range (Figure 4). The procedure of the CCNBD test is identical to that of the BD test and adopts the same experimental apparatus.
According to [28], KIC can be calculated using this formula:
K IC = P max Y min * B R
where Pmax is the maximum axial load applied in the test, Y*min is the critical dimensionless stress intensity value, and R is the disk radius. Y*min is determined by
Y min * = u e v α 1
where u and v are constants that are determined by α0 and αB [28], and α1 = a1/R.

2.4. Discrete Element Method (DEM) and Grain-Based Model

We used Particle Flow Code in Two Dimensions (PFC2D), a popular commercial code drawing on the discrete element method (DEM) to reproduce the experimental results. PFC2D is based on the bonded-particle assumption [29] that rock is represented by an assembly of inter-bonded circular particles. The mechanical behavior of rock is dominated by the microscale properties and constitutive relations of the bonded contacts between the particles. When a component of the contact force in the normal and shear directions exceeds the tensile or shear bond strength, the successive breakage of bonds viewed as crack propagation occurs.
The primary drawback of conventional PFC2D is lacking consideration of grain structures. However, crystalline rocks usually contain polygonal minerals, of which the microstructure including grain shape and size strongly influences the mechanical behaviors of rocks [30]. To address this issue, a grain-based model (GBM) with polygon-tessellation grain boundaries taking grain breakage into account has been implemented in PFC2D [31,32]. Using DEM with GBM modeling, we simulated the experimental results for marble J and K.
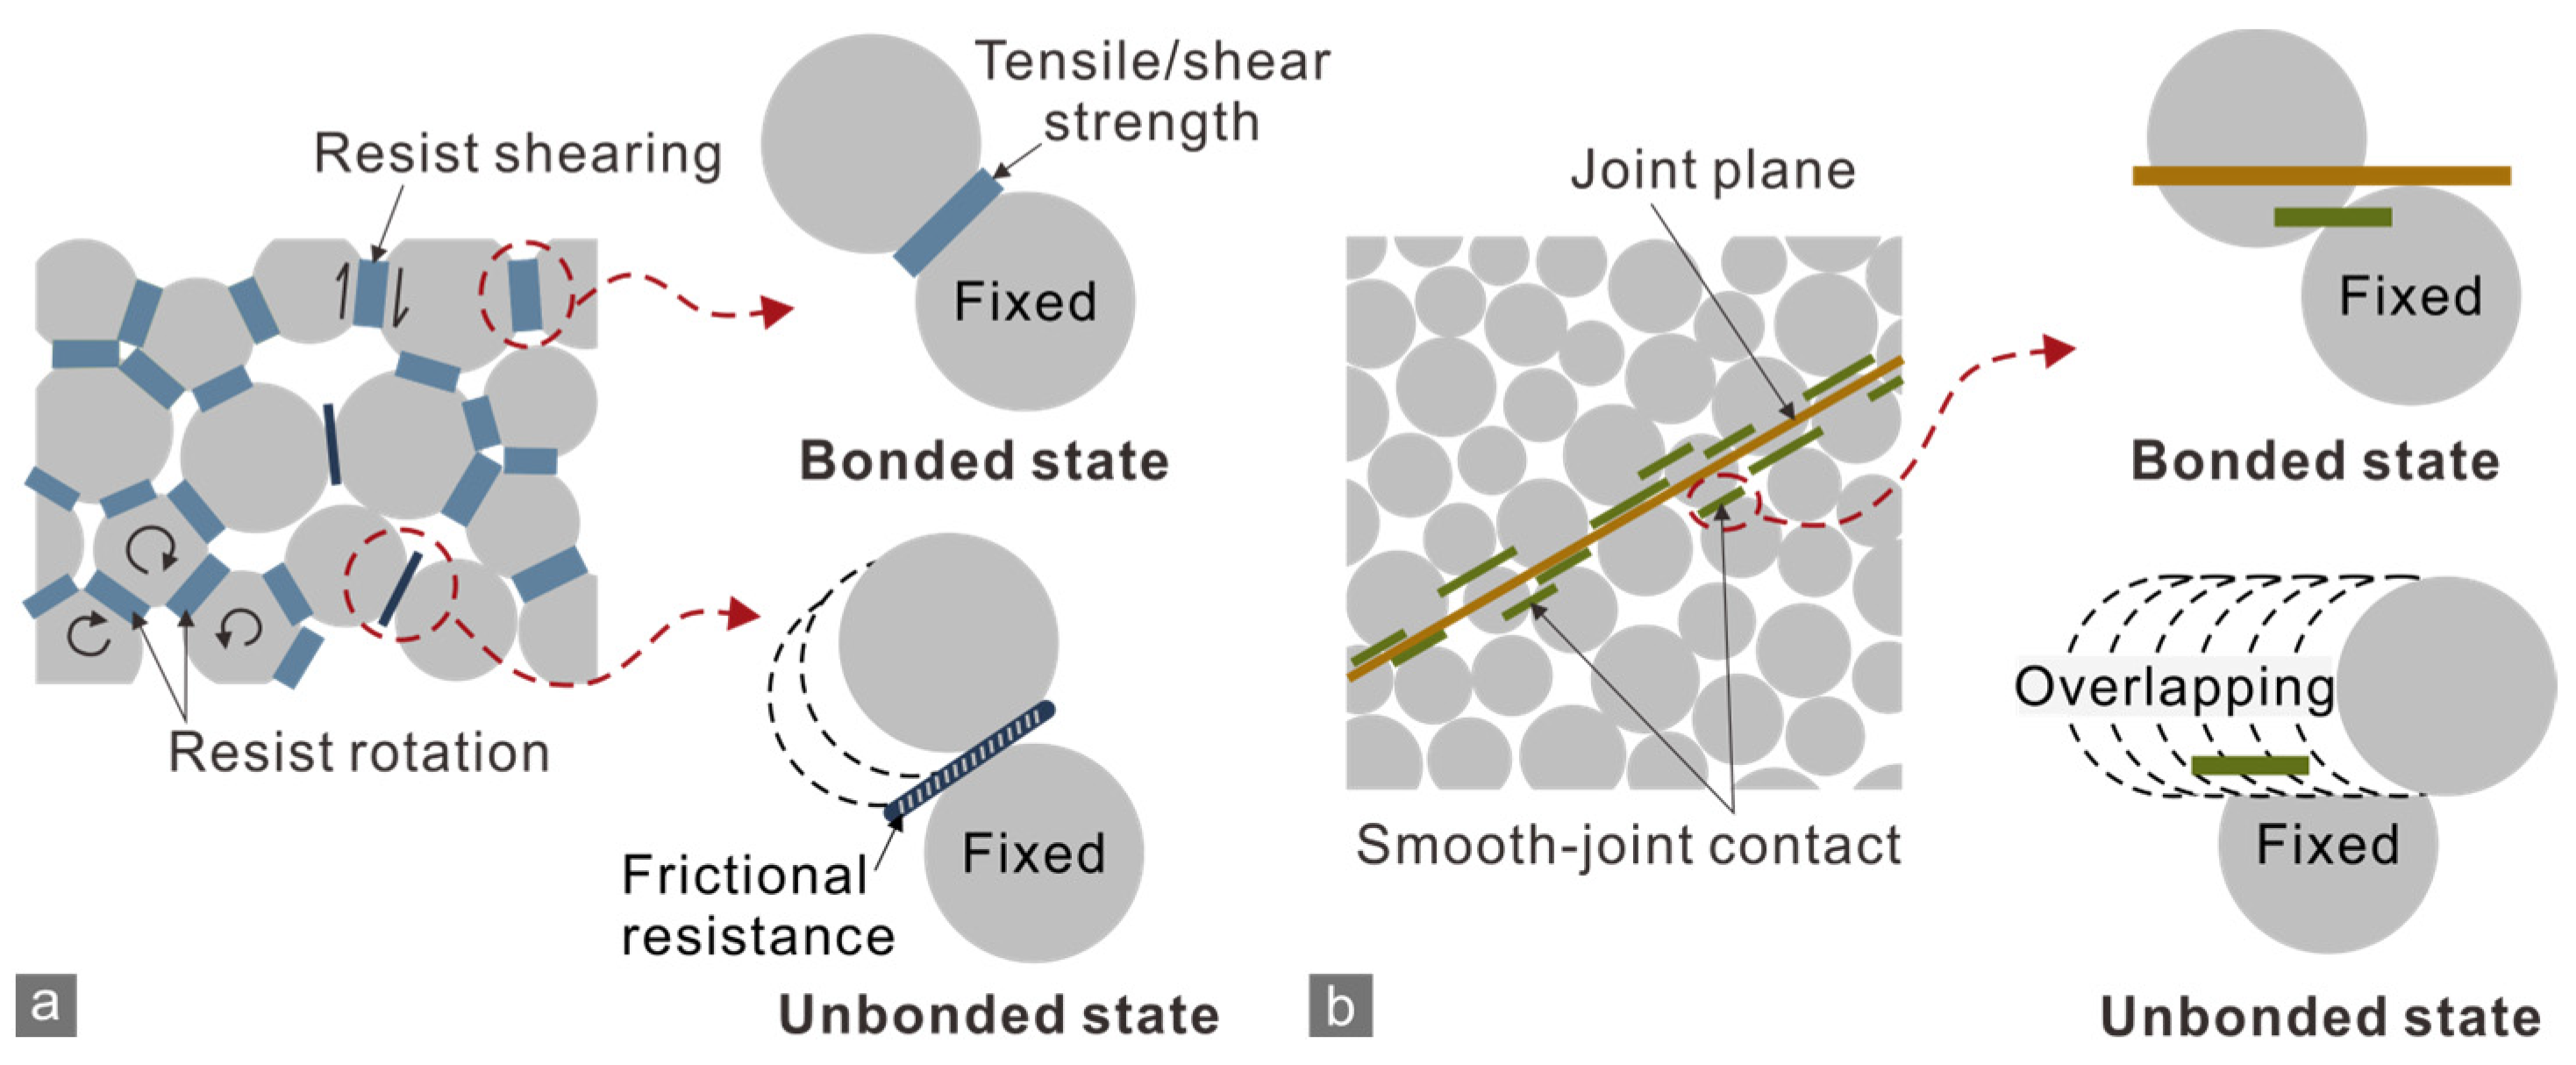
To implement the GBM of marble, an initial particle aggregate with a particle size distribution consistent with microscopy observations is created firstly (Figure 5a), and then we develop Voronoi-tessellation mineral boundaries [33] along the particle boundaries (Figure 5b). Next, the larger particles of the initial aggregate will be replaced by smaller circular particles (Figure 5c). Finally, soft-bonded (Figure 6a) and smooth-joint models (Figure 6b) expressing bonded and unbonded behaviors are assigned on intra-grain and inter-grain contacts, respectively (Figure 5d).
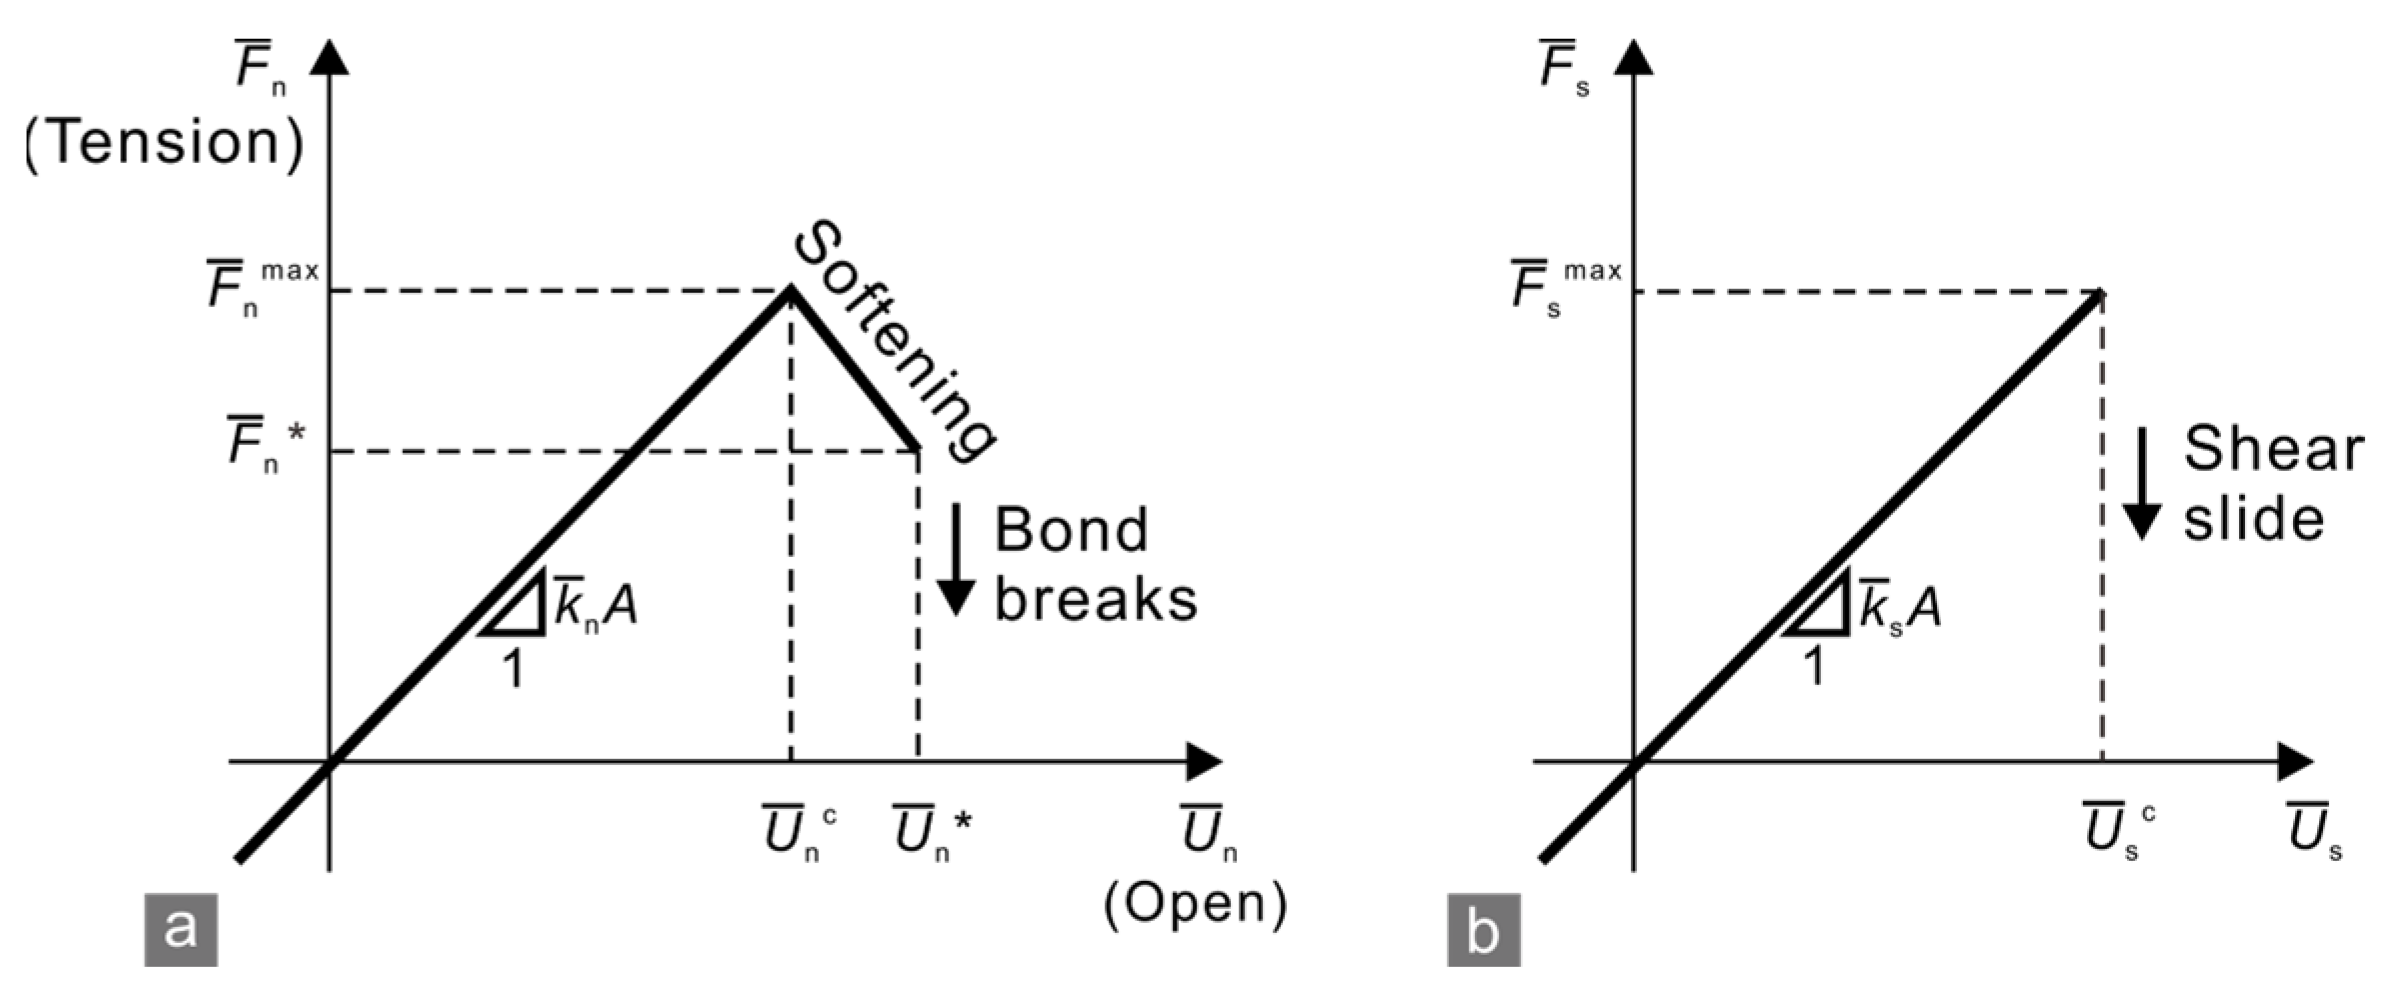
The recently developed soft-bonded model [34] is a more reliable one to characterize intra-grain contact because the strain-softening property of the bonds is considered [35]. When the bond tensile strength is attained, the bond failure displays a softening regime (Figure 7a), i.e., the bond force in its normal direction declines, causing breakage, and then the contact shifts to an unbonded state (Figure 7b). In the unbonded state a force and moment can be transmitted at the contact point, and the contact provides frictional force that resists sliding.
The smooth-joint contacts [36] are assigned on the two sides of a grain boundary, removing the previous bonds. The orientation of the contacts is parallel to the boundary. Once the bonds break, their behavior changes to friction. This contact model allows the overlapping of particles in an unbonded state (Figure 6b).

2.5. Model Setup and Parameter Calibration

Four GBMs were created to simulate the BD and CCNBD tests on marble J and K specimens. Each model comprised ~20,000 circular particles with a 0.2–0.3 mm radius. The GBMs were positioned between two stiff walls representing the loading end and platform of a compression machine, and the walls moved toward each other at the same constant velocity to result in a quasi-static loading rate.
The BD test results were used to calibrate the microscale parameters of the particles and intra- and inter-grain contacts. The approximate values of these parameters were determined referring to the elastic properties of rock-forming minerals [37] and the previous research [38], and then the calibration was achieved iteratively through trial and error [32]. When the simulated load–displacement curves and crack morphology fitted well with the observations in the BD tests (Figure 8), the rationality of the adopted microscale parameters (Table 2) was confirmed. Thus, the simulation results of CCNBD test based on the calibrated parameters are reliable.

3. Results

3.1. Tensile Strength, Fracture Toughness and FPZ Radius

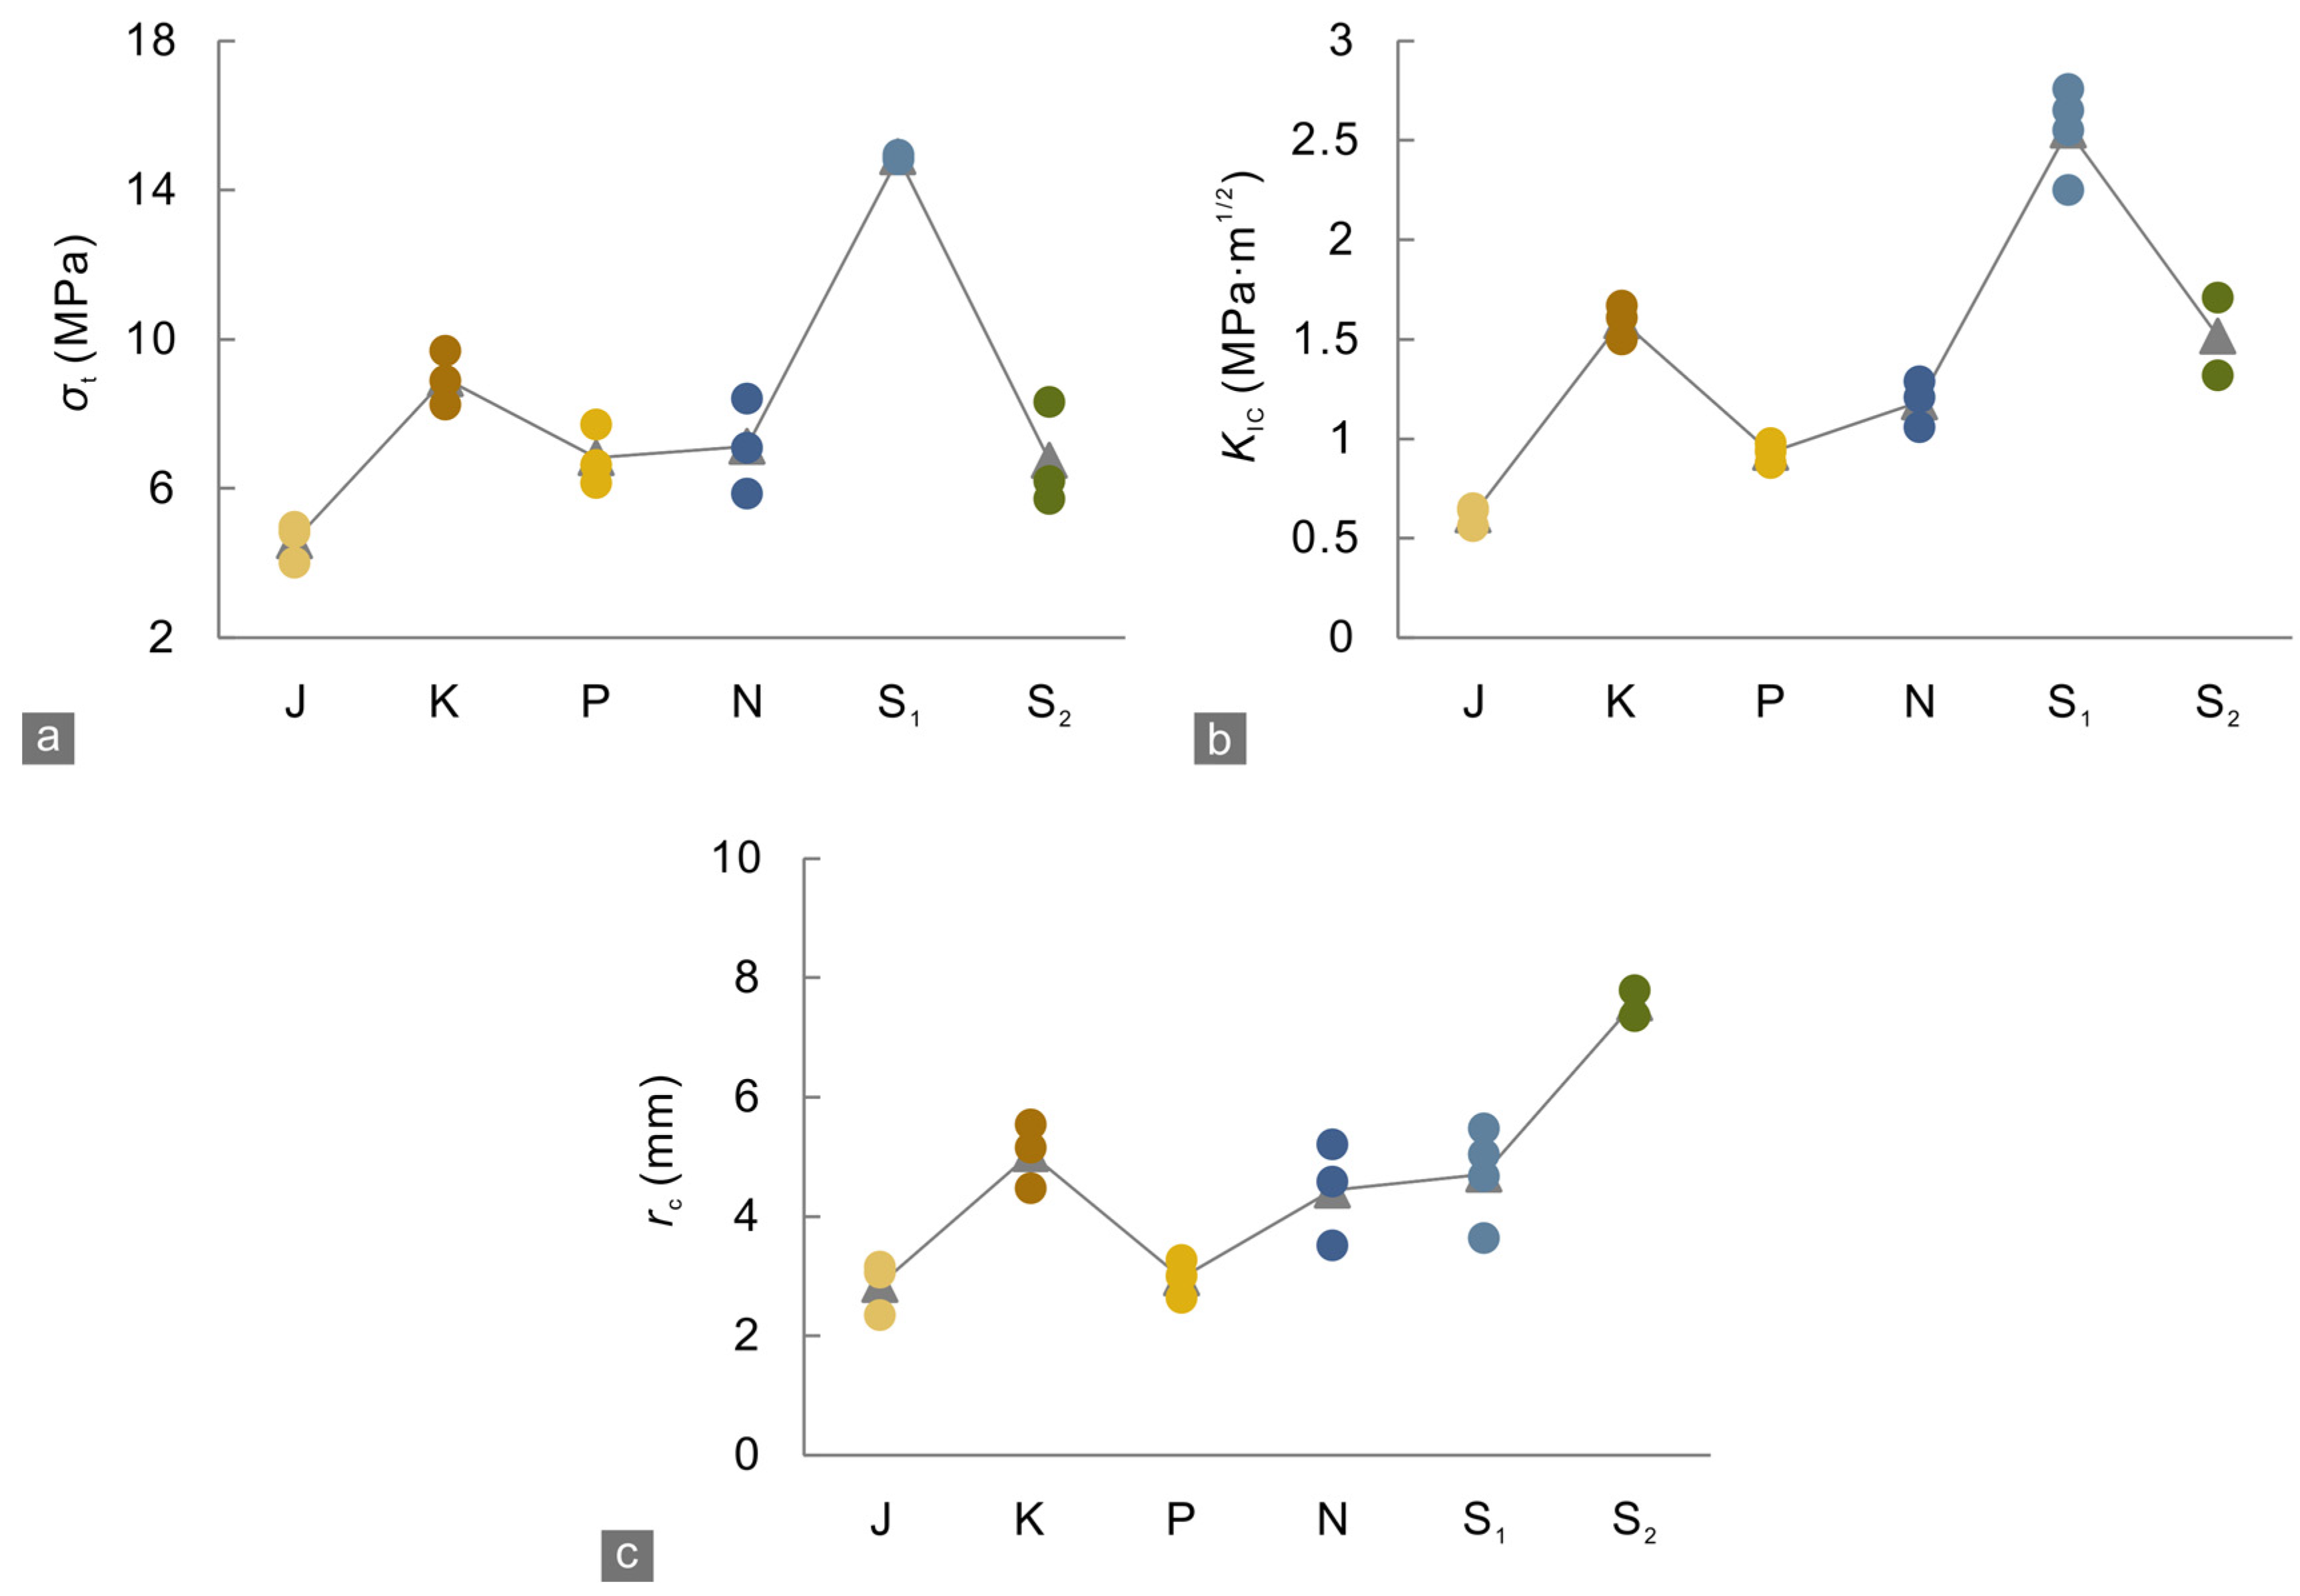
The tensile strength σt and Mode I fracture toughness KIC did not exhibit a consistent correlation with heterogeneity of the rocks (Figure 9a,b). The more heterogeneous N had greater values of σt and KIC than P did, whereas the values of these properties of S2 were smaller than those of the relatively homogeneous S1.
The more heterogeneous subtypes of the marble, limestone and shale (K, N and S2) generated FPZs with a larger rc than the relatively homogeneous subtypes (J, P and S1) did (Figure 9c). The increasing trend of rc with the rising degree of heterogeneity of rocks suggests that strong heterogeneity is favorable for forming a larger FPZ. The variation trend of rc with rock types was not consistent with those of the σt and KIC (Figure 9), indicating that the FPZ radius is dependent on neither tensile strength nor fracture toughness.
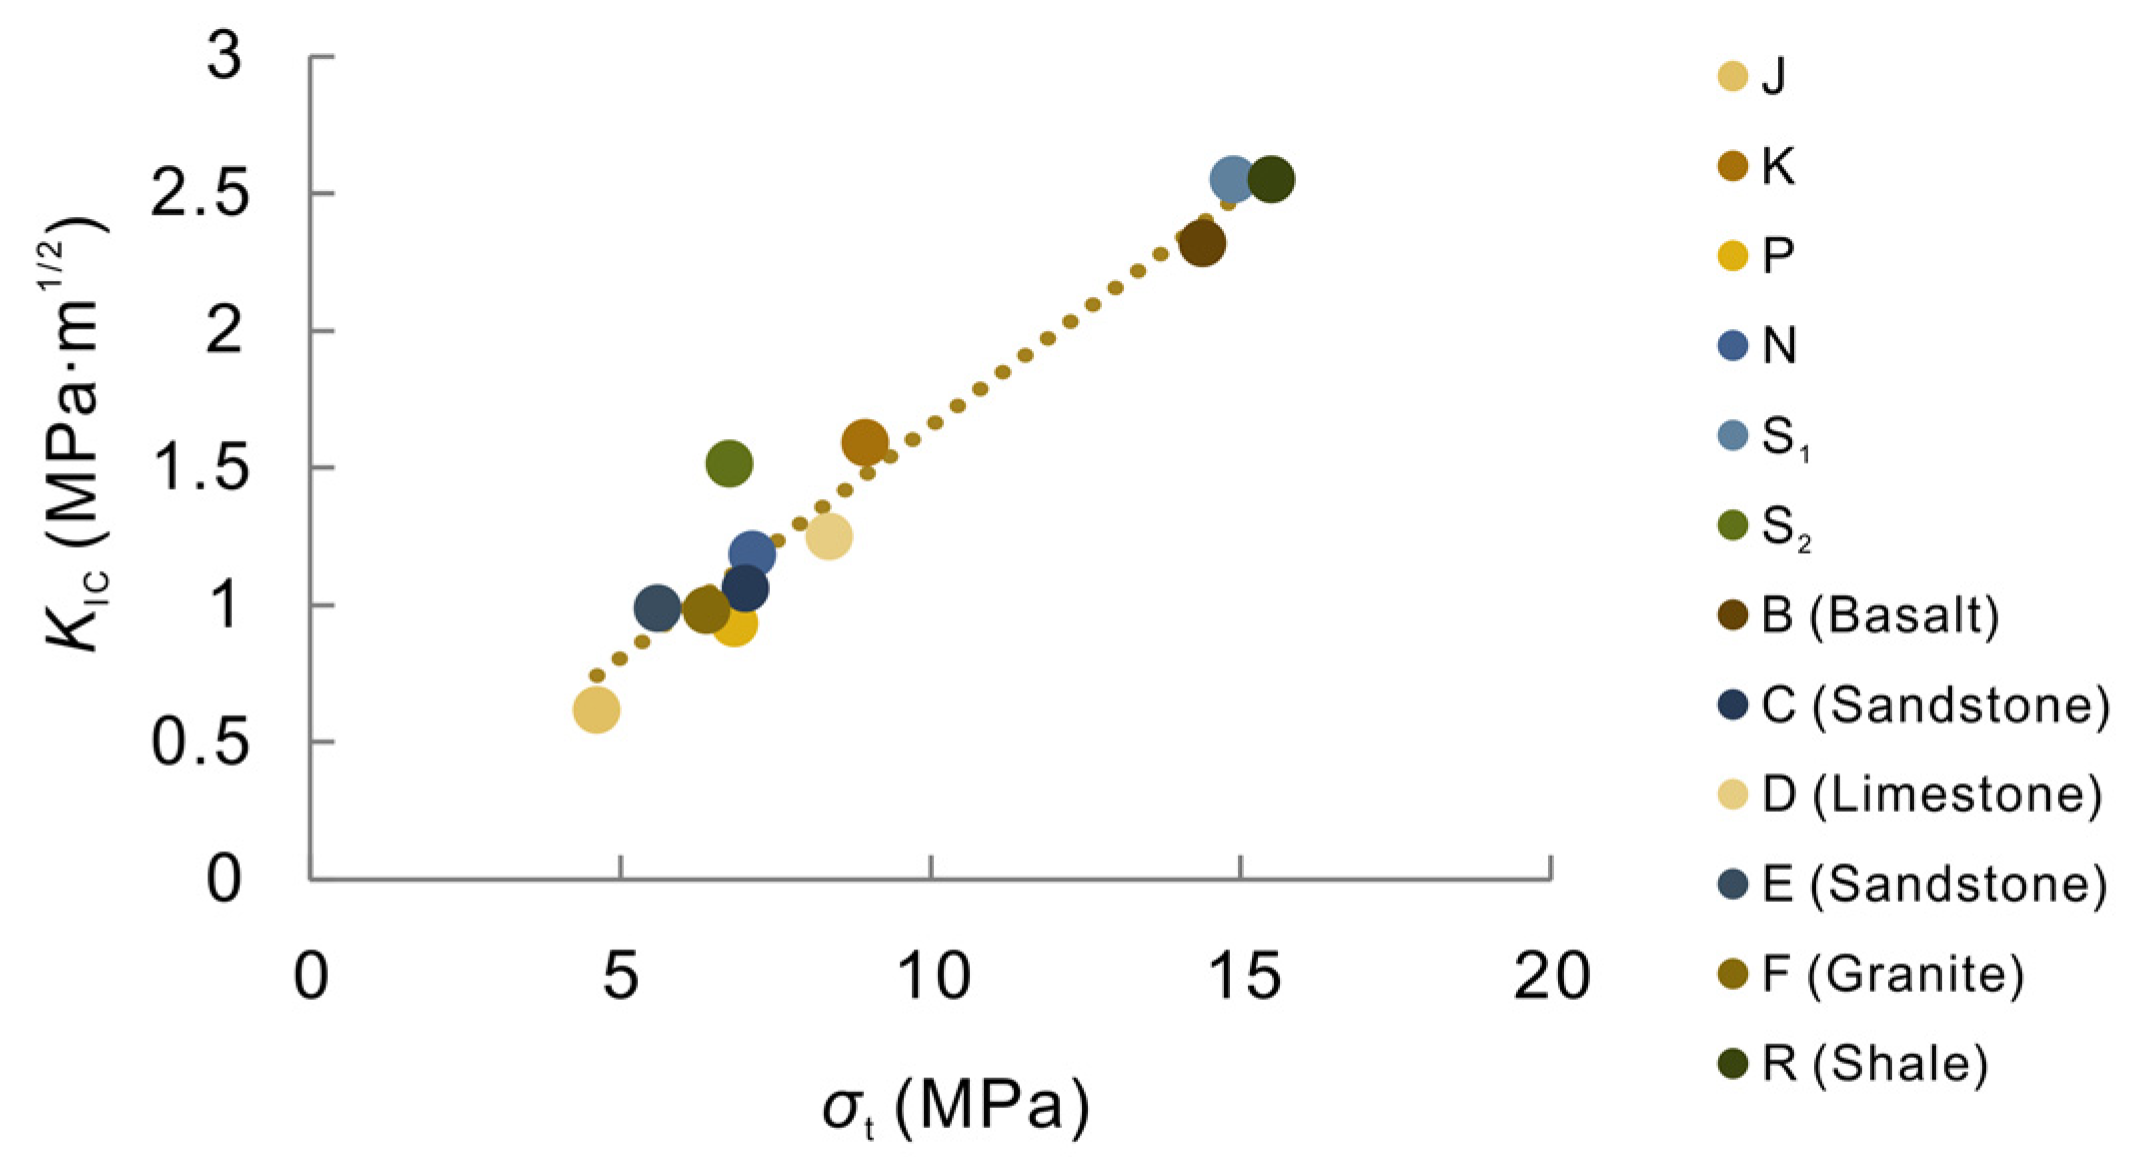
The present and previous experimental results [39] showed that tensile strength and Mode I fracture toughness displayed a positive linear correlation (Figure 10), which indicates that the ratios of the two properties change within a narrow range.

3.2. Crack Morphology

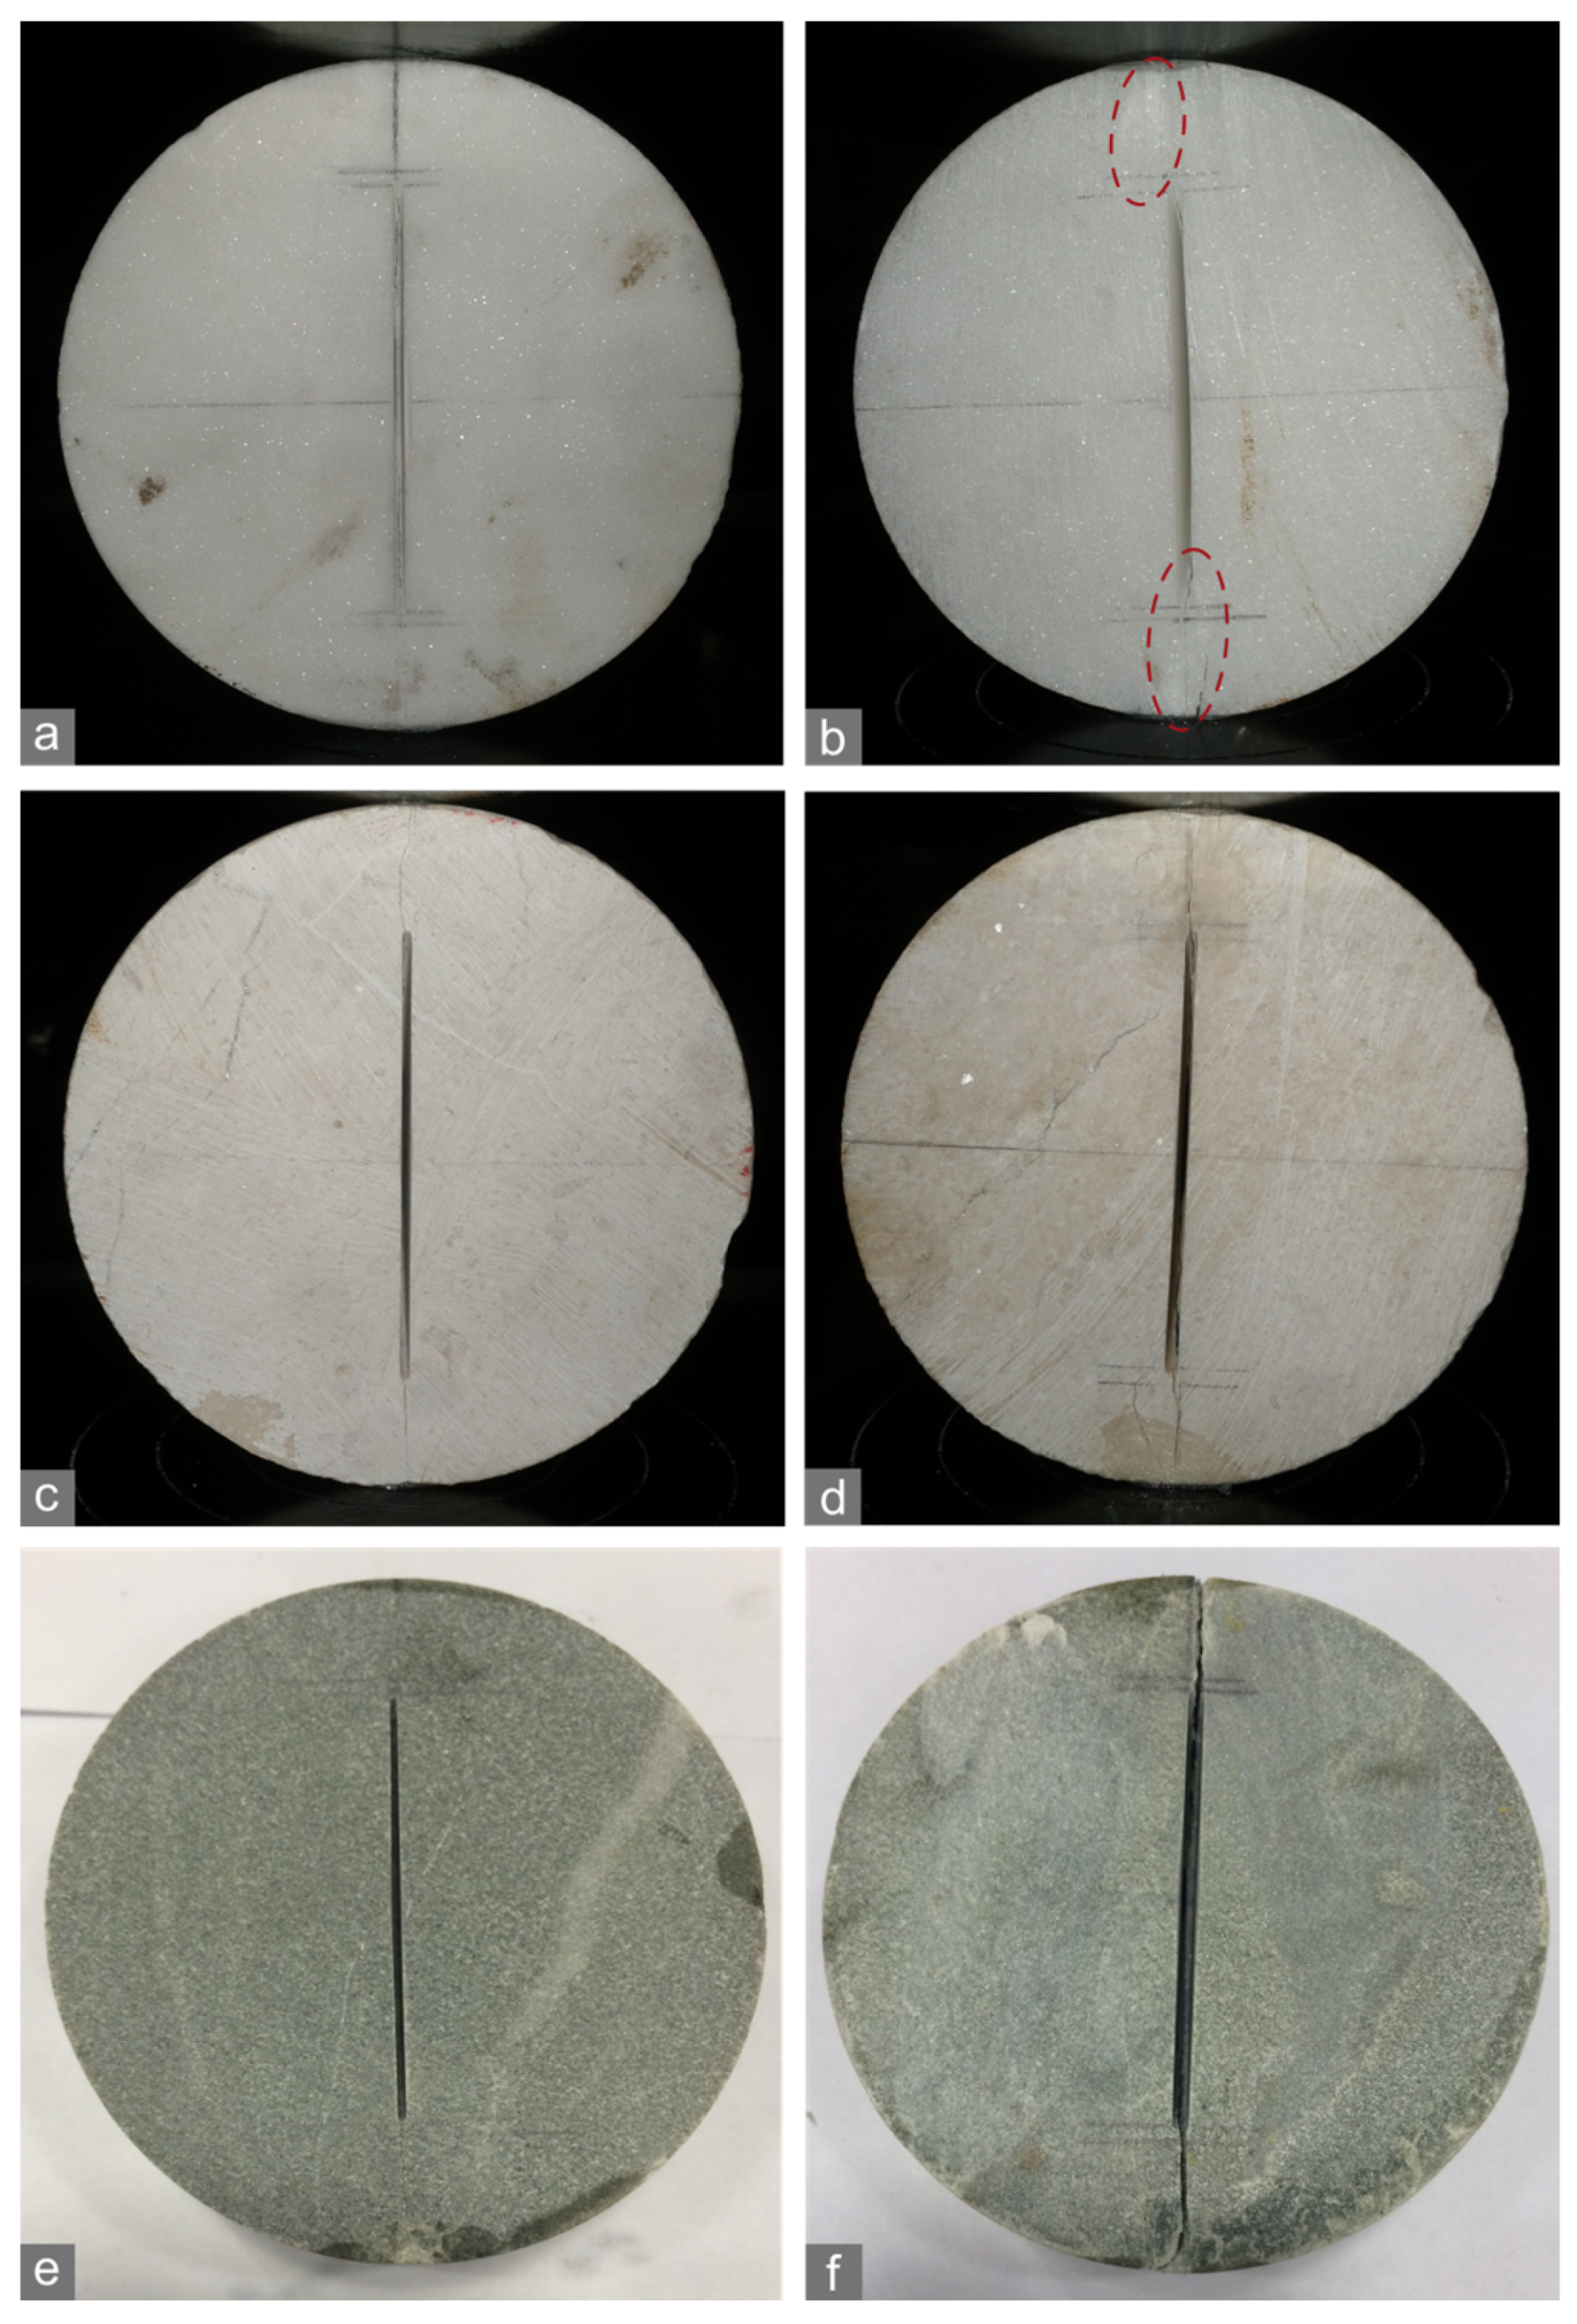
The specimens of the subtypes with stronger heterogeneity and larger FPZ size generated more curving, irregular (even branched) cracks with great apertures (Figure 11). Some of these specimens were dramatically broken into several parts soon after the macroscopic rupture occurs, resulting in relatively rough cracking surfaces with quite a few fragments and powders. That is, the larger FPZ sizes correspond to the more complex morphology of cracks.
Specially, white patches were notable in front of the notched crack tips on the surface of marble K specimens (Figure 11b). Such patches, which were commonly observed on crystalline rock (e.g., marble [40] and granite [41]) with medium or coarse grain size, were attributed to high-density micro cracks and indicated that the FPZ size was considerable enough to be visible.
In contrast, the less heterogeneous rock specimens generate relatively straight cracks with small apertures (Figure 11). In particular, no discernible white patches indicating an FPZ were observed in the relatively homogeneous marble J specimens when the imposed loads approach the maximums (Figure 11a) because of their smaller FPZ size.

3.3. Characteristics of the FPZ in DEM Models for the Marble

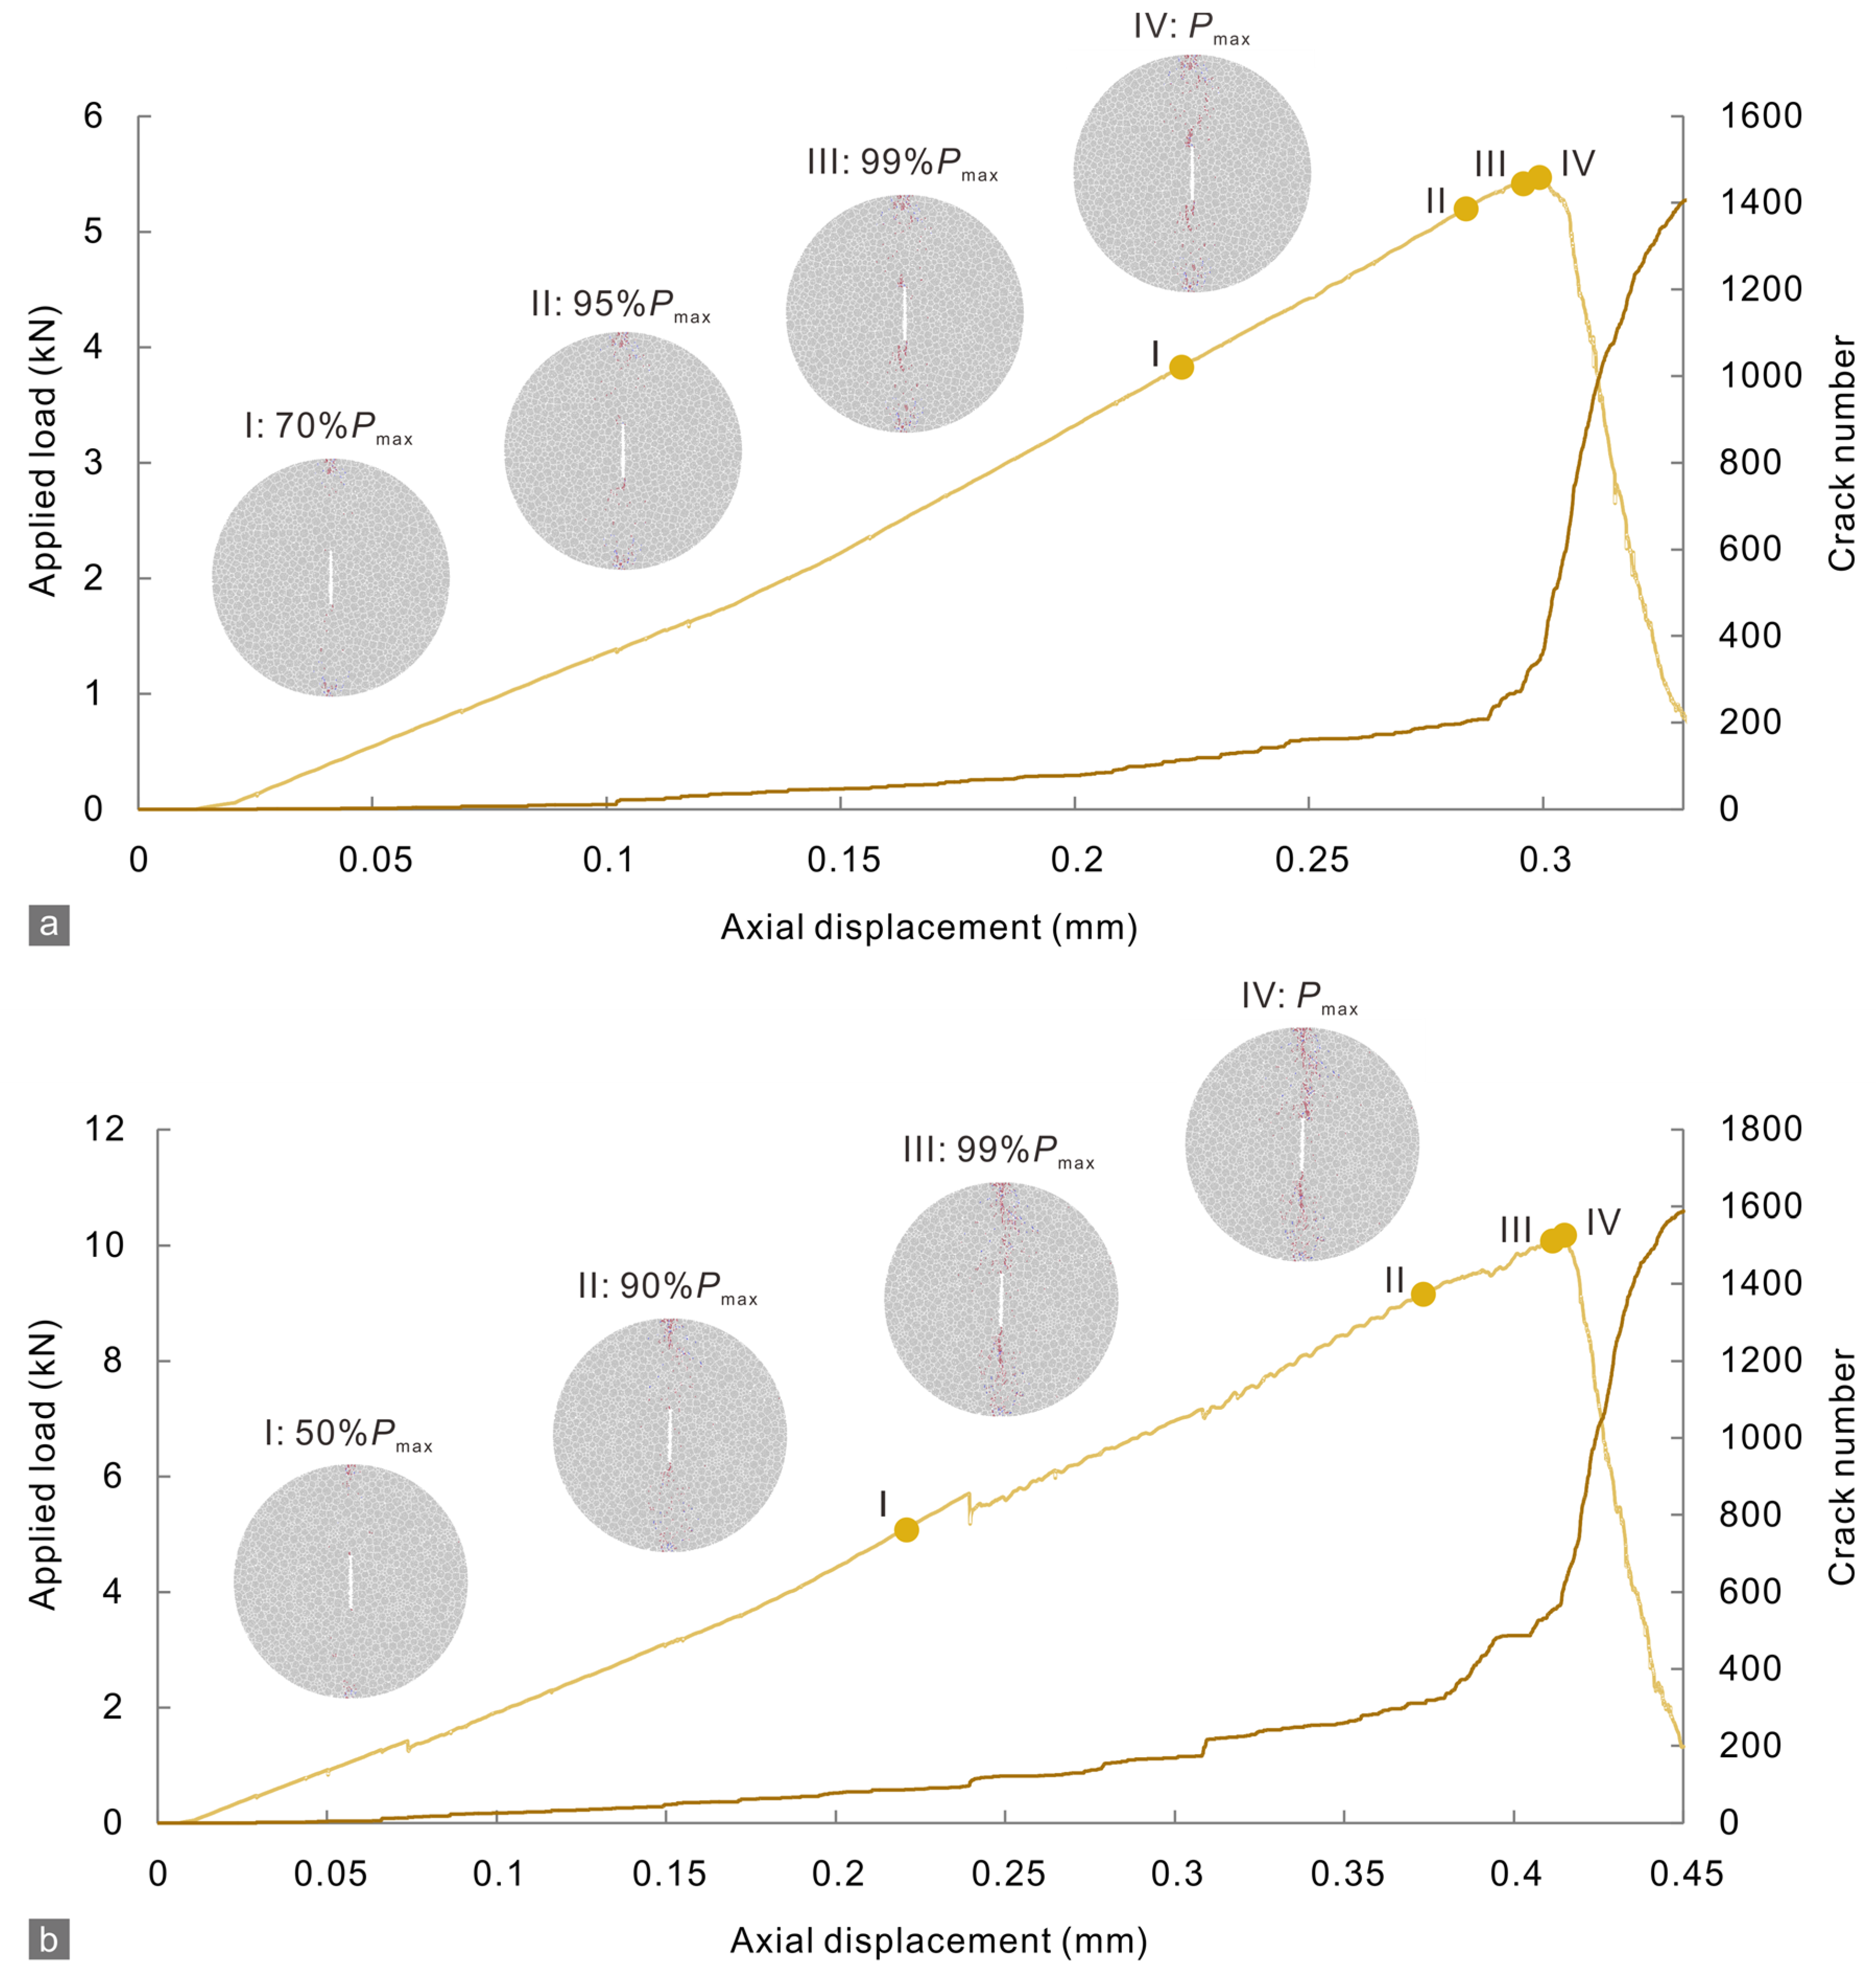
The DEM simulations showed that marble J and K specimens had similar FPZ formation processes (Figure 12). Micro cracking initiates around the two notched crack tips in each specimen owing to strong stress concentration. As the applied load increases, they gradually grow along the direction approximately parallel to the notched crack, and the number rises at a generally stable rate. When the density of micro cracks is high enough to form macroscopic cracks, the growth rate of the micro crack begins to accelerate dramatically. Once the load reaches its peak value, the FPZ size will also reach its maximum, and then the macroscopic cracks will propagate unsteadily and cross the whole specimen, which results in the rupture of the specimen characterized by a sharp post-peak stress drop, as the macroscopic cracks connect with those micro cracks initiating from the point where a specimen contacts the loading end (or platform). When the load drops to an approximately constant level corresponding to the residual strength of the specimen, the whole loading process terminates.
The normalized load levels (the ratio of a certain applied load to the maximum load) corresponding to the initiation and acceleration onset of micro crack growth are quite different for the two marble subtypes (Figure 12). Initiation and acceleration of micro crack growth arises respectively at ~50%Pmax and ~90%Pmax in marble K, which are lower than those levels in marble J (~70%Pmax and ~95%Pmax). In other words, crack growth occurred earlier (more easily) in marble K than it did in marble J, although the former has higher strength. Furthermore, K also generated more micro cracks than J did. J and K specimens generated 345 and 624 micro cracks during their pre-peak stages, and the total number of micro cracks generated within their whole loading processes are 1404 and 1588. For the same reason, more zigzags (due to local drops of load representing crack generation) are visible on the displacement–load curve of marble K, which suggests stronger non-linearity of deformation.
Consistent with the above results of micro crack number, the crack distribution range in the marble K specimen is larger than that in the marble J specimen when the specimens were loaded to attain their peak-load points (Figure 12), suggesting greater size (especially the length) of the FPZ.
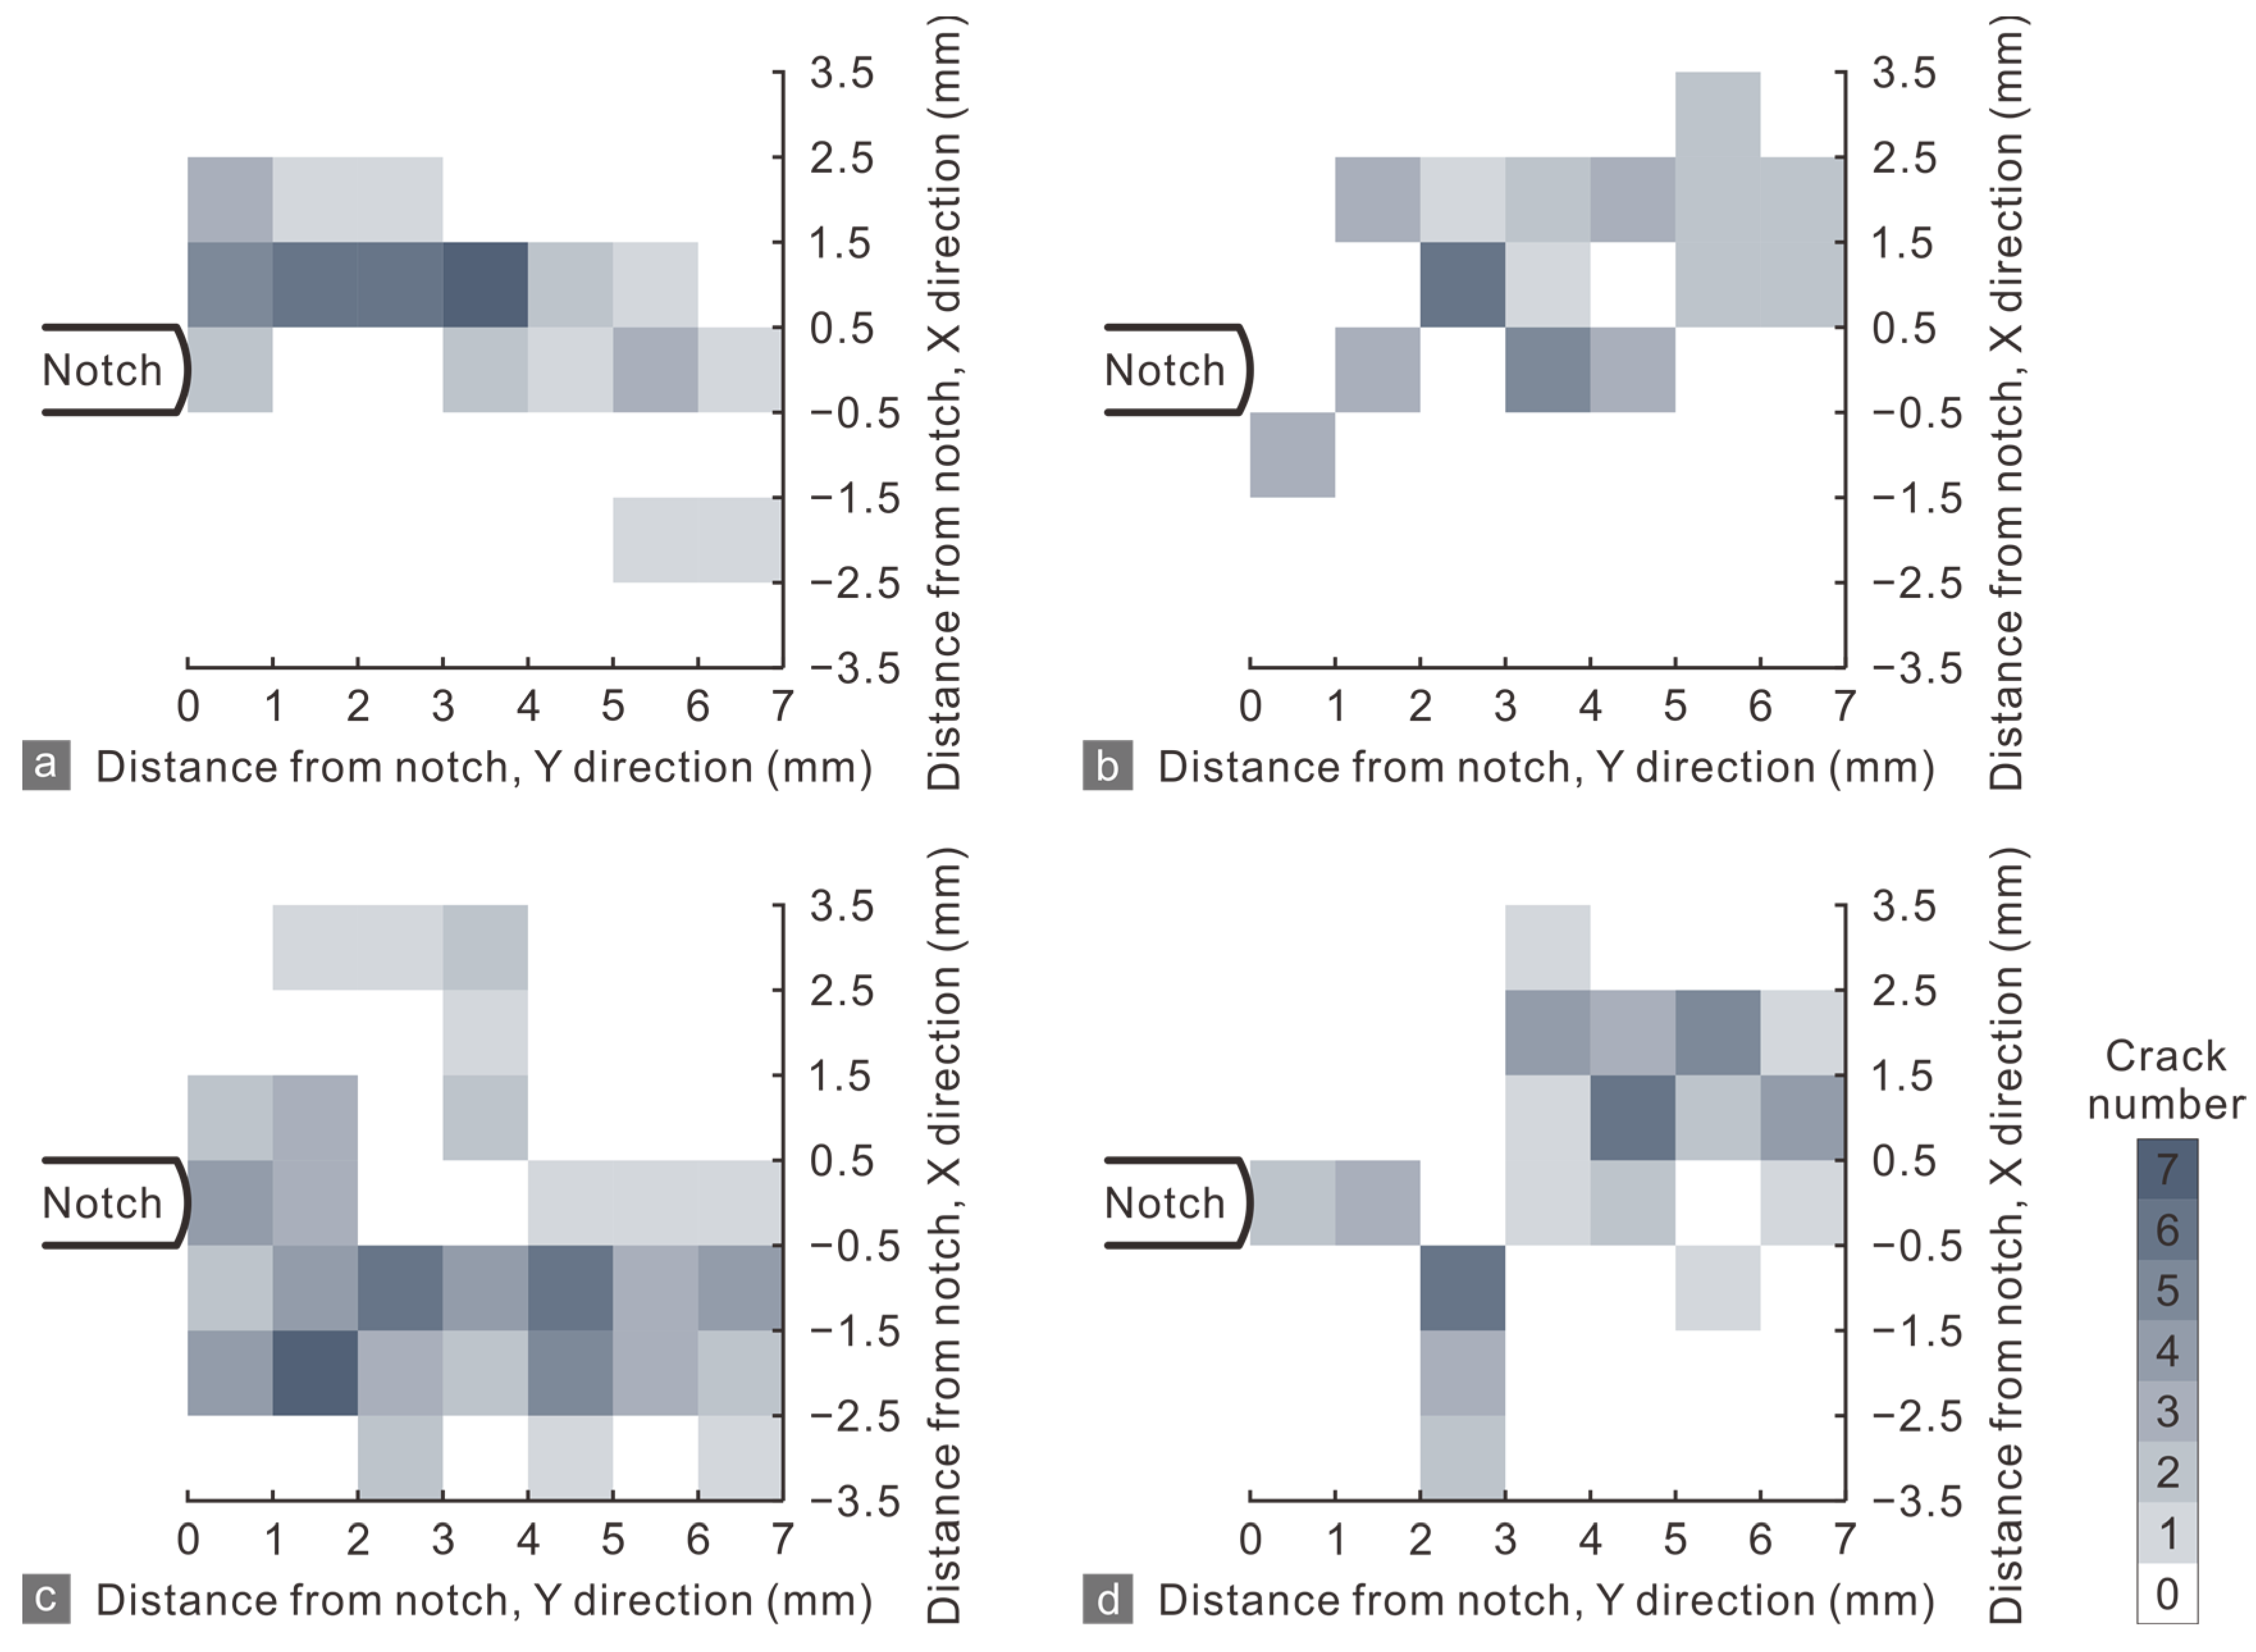
To conduct a more quantitative investigation on the morphology of the FPZ, we defined a 7 × 7 mm2 study area at each notched crack tip that consists of 1 × 1 mm2 observation windows, counted the crack number within each window and obtained the spatial distribution of micro crack density. The background density of micro cracks in the DEM models was viewed as ≤ 3/mm2 because this density level representing minor non-linear deformation was reached in the early loading stage. On the basis of this, we showed that the micro crack density at a notched crack tip is usually relatively high, defining the core zone of a FPZ, and the density gradually decreases to a low background level as the distance from the tip in either X or Y direction increases (Figure 13). Areas with micro crack density greater than the background level were defined as FPZs. In this context, the maximum length of FPZs of marble J and K are 5 mm and 7 mm, and their maximum width are 3 mm and 4 mm. Although the actual shape of FPZs was not circular, the FPZs in J and K are roughly distributed within the assumed circles with radii of 2.9 mm and 5.0 mm, respectively. Therefore, it is reasonable to represent the FPZ size by radius rc. Furthermore, the DEM simulations showed that marble K with stronger heterogeneity generated a larger FPZ, which agrees with the experimental results.

4. Discussion

4.1. Effects of Heterogeneity

Heterogeneity suggests that the local strength can differ across areas of a rock specimen. Marble K showed lower normalized loads that correspond to the initiation and acceleration of micro crack growth, because strongly heterogeneous rock with a wider distribution range of local strength can contain more weak zones, which is more favorable to micro crack generation. However, such cracking is usually small-scale and cannot trigger the unstable propagation of macroscopic cracks and the rupture of the specimen, because many strong local zones serve as the barriers arresting the small-scale cracking. In this context, unstable propagation requires adequate micro cracks to gather in front of the crack tip, which involves a progressive cracking process and generates a large nonlinear deformation zone, i.e., a FPZ of a large size.
Regarding a relatively homogeneous rock specimen, local strength in different areas can be similar. Before the applied stress reaches the general strength of matrix and microstructures, very few small cracks arise, and thus the FPZ size is small. However, extensive cracking will dramatically occur in the vicinity of the crack tip once the general strength is reached, which causes unstable propagation of macroscopic cracks soon after the formation of the FPZ. If a kind of brittle material is virtually homogeneous, its deformation will be linear elastic, and thus cracks propagate without any FPZ formation [10]. Therefore, the heterogeneity degree of rocks determines the nonlinearity of the deformation at crack tip, and strong heterogeneity corresponds to large FPZ size, as our experiment and simulation results revealed. In conclusion, heterogeneity sets the physical foundation for the existence of a FPZ.
Larger grain size and specimen size and a greater number of cracks (pores) can enhance rock heterogeneity [42,43,44], which explains why these properties can promote the formation of large FPZs. Different minerals are also expected to influence the heterogeneity of rocks as well as the FPZ formation. However, their effects involving multiple factors such as specific mineral types and their proportions can be very complicated. Furthermore, it is difficult to exclude the effects of grain shape and size when investigating this issue using natural rocks. Therefore, we suggest DEM investigations using recently developed polymineral GBM [35] be conducted in the future.
Stronger heterogeneity generally suggests more weak zones as sources of cracking; nevertheless, it does not indicate lower tensile strength and fracture toughness, because these two parameters representing the ability to resist deformation and failure rely not only heterogeneity but also the level of general strength.

4.2. Why the FPZ Size Depends on Rock Heterogeneity

To clarify the dependence of the FPZ size on heterogeneity, we used a statistical distribution coupling with fracture mechanics. Rock in the vicinity of a crack tip can be viewed as an aggregation of a certain number of elements that represent different types of mineral grains (and microstructures) of various sizes; therefore, these elements have different strengths. Assuming that each element is elastic-brittle and their tensile strengths follow the Weibull distribution [45], the rupture probability P of the elements (i.e., the probability of unstable propagation of a macroscopic crack) is
P = 1 exp [ ( σ σ 0 ) m ]
where σ is the tensile stress, σ0 is the general tensile strength of the elements, and m is the Weibull modulus. Larger m values indicate that the elements with strengths σ0 occupy a greater proportion of all elements; otherwise, the element strengths can be very different and fall in a wide range. Though rock heterogeneity can be classified into several types, their effect can be summarized as resulting in a heterogeneous strength distribution. Hence, the parameter m represents the strength heterogeneity of rock and is called the heterogeneity index [46,47].
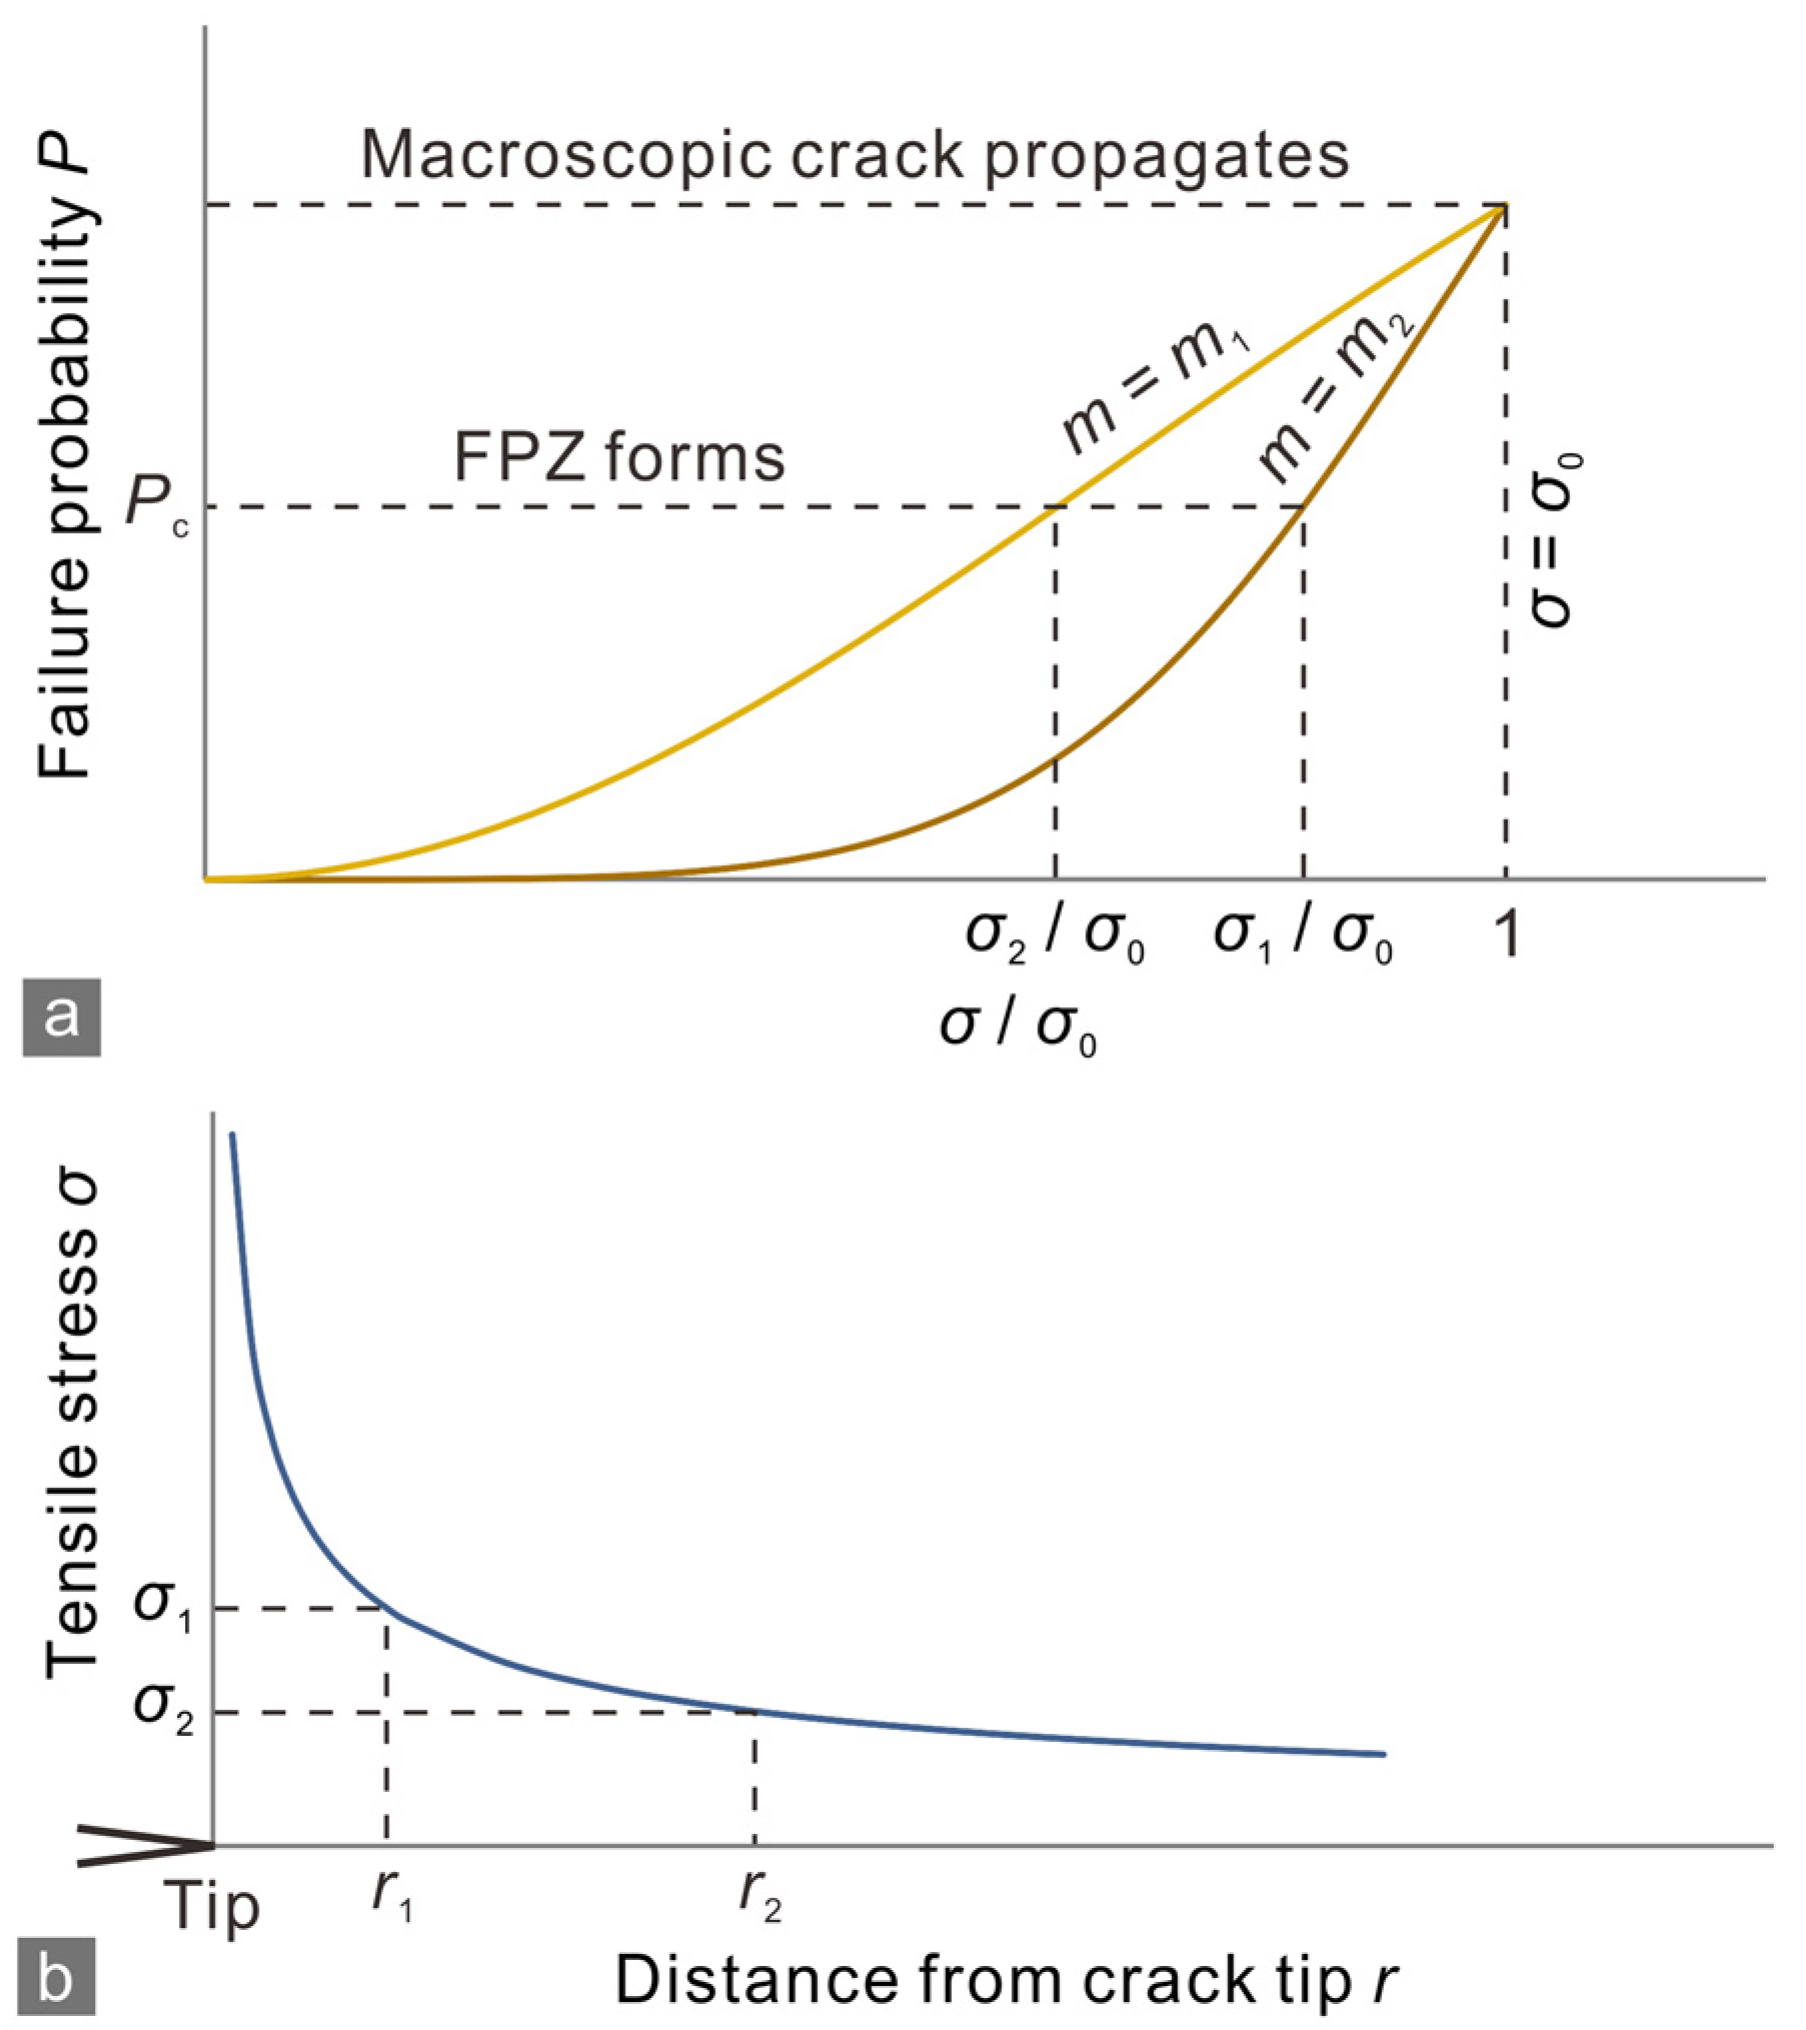
The elements fail as the tensile stress at crack tip increases, thereby raising the failure probability. When the stress reaches σ0, most elements within the FPZ have failed, indicating the onset of the macroscopic crack propagation (Figure 14a). Therefore, the FPZ forms before the stress reaches σ0. Provided that rocks have identical σ0 but different heterogeneity indices m1 and m2, we assumed that the FPZ forms when their failure probability reaches Pc:
P c = 1 exp [ ( σ 1 σ 0 ) m 1 ] = 1 exp [ ( σ 2 σ 0 ) m 2 ]
where σ1 and σ2 (σ1 < σ0, σ2 < σ0) correspond to FPZ formation. If m1 > m2 (Figure 14a), we can derive
σ 1 > σ 2 ,
which suggests that a small m value (strong heterogeneity) corresponds to the lower stress level that can cause the elements near the crack tip to fail (Figure 14a).
Based on the assumption that each element is elastic-brittle, the linear elastic fracture mechanics is still valid to describe the stress state at crack tip before unstable propagation. The tensile stress at a Mode I crack tip can be written as
σ = K I 2 π r cos θ 2 ( 1 + sin θ 2 sin 3 2 θ )
where KI is the Mode I stress intensity factor, and r and θ are the polar coordinate system parameters from the crack tip. The fracture angle for a pure Mode I crack is zero. Therefore, we substitute
K I = σ π a
and θ = 0 into Equation (9) and obtain
σ = σ a 2 r
where a is the half-length of crack, r represents the distance from the crack tip, and σ is the remote boundary stress proportional to the general strength σ0. Equation (11) gives the relationship between the σ and r in a certain boundary condition, and the corresponding diagram (Figure 14b) shows that the tensile stress gradually declines with the growing distance from crack tip.
Table 1 and σ2 can respectively result in two FPZs with size r1 and r2, and r1 < r2. As Figure 14b illustrates, the tensile stress within the zones defined by r1 and r2 exceeds σ1 and σ2, which permit the failed elements within the zones to form the FPZs.
If the rock has an identical m value but different general strengths σ0 and σ0’, Equation (7) becomes
P c = 1 exp [ ( σ 1 σ 0 ) m ] = 1 exp [ ( σ 2 σ 0 ' ) m ]
which yields
σ 1 σ 0 = σ 2 σ 0 '
Substituting Equation (11) into (13) leads to
σ 1 σ 0 1 r 1 = σ 2 σ 0 ' 1 r 2
Since the ratio of remote boundary stress to general strength is approximately a constant once the m value is determined [48], the ratios in the Equation (14) can be eliminated, and thus we come to
r 1 = r 2 .
Combing Equation (10) with Equation (14), one can obtain that the Mode I fracture toughness is also proportional to the general strength and come to the same conclusion as Equation (15) formulated. The above theoretical analysis links the heterogeneity index to the FPZ size, confirms the dependence of the FPZ size on heterogeneity, and suggests that the FPZ size is not determined by either the tensile strength or the Mode I fracture toughness.
As formulated in Equation (2), the tensile strength and Mode I fracture toughness lie in the numerator and the denominator, and thus neither parameter is more important than the other in influencing FPZ size. What is more important to the FPZ size is their ratio relationship. Since the tensile strength and fracture toughness are both proportional to general strength, and the proportionality coefficients are determined by m value [47,48], the ratio of tensile strength to fracture toughness can vary within a certain range (Figure 9), which indicates that FPZ size has an upper limitation and the limitation may depend on the range of heterogeneity degree [49], because the heterogeneity degree of rocks cannot be infinite. This may explain why the FPZ size becomes approximately constant after specimen size increases to reach a certain level [13].

4.3. Implications of the FPZ Size

The experiment and numerical simulation results suggest that specimens with strong heterogeneity generate a greater number of micro cracks and exhibit more irregular crack morphology. As the theoretical analysis demonstrates, strong heterogeneity can raise the probability of cracking within a larger range at the vicinity of a crack tip, extending the FPZ size. Since a large FPZ comprises a great number of micro cracks, the stress fields at the tips of Mode I cracks can be very complex owing to the interaction between the micro cracks; under this circumstance, macroscopic cracks consisting of the scattered micro cracks can propagate following curving, even bifurcate, paths, deviating from the direction as linear elastic fracture mechanics predicts.
Large FPZs in certain types of reservoir rock may imply that such rocks have strong fracability [50], i.e., they are suitable for conducting hydraulic fracturing. A great number of cracks can be generated when such rocks are stimulated by injected fluids, and the hydraulic fractures with curving morphology probably connect with more preexisting cracks and pores, raising the conductivity of reservoirs. Therefore, optimization of designing hydraulic fracturing highly relies on reliable fracability evaluation of reservoir rocks. Uncovering the dependence of the FPZ size on heterogeneity can provide important guidelines for the fracability evaluation.

5. Conclusions

We conducted experiments and numerical simulations on rocks with different heterogeneities and showed that strong heterogeneity resulted in large FPZ sizes. The mechanical mechanism behind this positive correlation is explained using the Weibull distribution and fracture mechanisms, which shows that strong heterogeneity enhances the probability of cracking within a larger FPZ. The existence of a FPZ and its size rely on the inherent property of rocks: heterogeneity.
Furthermore, nonlinear deformation involving generation of cracks can easily occur in heterogeneous rocks with larger FPZs, which causes a greater number of micro cracks and a more complex crack morphology. The relationships between heterogeneity, FPZ size and crack morphology suggest that FPZ size can be useful for fracability evaluation of reservoir.
These findings improve our recognition to the mechanical mechanism of Mode I crack propagation and the intrinsic rules it adheres to, and they show significant engineering implications in evaluations of reservoir fracability.

Author Contributions

Conceptualization, J.N. and H.C.; methodology, J.N., M.Z. and H.C.; validation, J.N.; formal analysis, H.C.; investigation, H.C., M.Z. and J.N.; resources, J.N.; writing—original draft preparation, H.C.; writing—review and editing, J.N., M.Z. and H.C.; visualization, H.C. and M.Z.; funding acquisition, J.N. and H.C. All authors have read and agreed to the published version of the manuscript.

Funding

This research was funded by the National Natural Science Foundation of China, grant numbers 42107184 and 41602330.

Data Availability Statement

All the data required to evaluate the conclusions of this study are present in the paper. The authors will provide additional data related to this paper upon request.

Conflicts of Interest

The authors declare no conflict of interest.

References

  1. Lawn, B.R.; Wilshaw, T.R. Fracture of Brittle Solids; Cambridge University Press: New York, NY, USA, 1975. [Google Scholar]
  2. Liu, G.; Chen, Y.; Du, X.; Wang, S.; Fernández-Steeger, T.M. Evolutionary analysis of heterogeneous granite microcracks based on digital image processing in grain-block model. Materials 2022, 15, 1941. [Google Scholar] [CrossRef] [PubMed]
  3. Wang, Y.; Han, J.; Xia, Y.; Long, D. New insights into the fracture evolution and instability warning predication for fissure-contained hollow-cylinder granite with different hole diameter under multi-stage cyclic loads. Theor. Appl. Fract. Mech. 2022, 119, 103363. [Google Scholar] [CrossRef]
  4. Wang, Y.; Mao, T.; Xia, Y.; Li, X.; Yi, X. Macro-meso fatigue failure of bimrocks with various block content subjected to multistage fatigue triaxial loads. Int. J. Fatigue 2022, 163, 107014. [Google Scholar] [CrossRef]
  5. Lan, H.; Martin, C.D.; Hu, B. Effect of heterogeneity of brittle rock on micromechanical extensile behavior during compression loading. J. Geophys. Res. Solid Earth 2010, 115. [Google Scholar] [CrossRef]
  6. Shirole, D.; Walton, G.; Hedayat, A. Experimental investigation of multi-scale strain-field heterogeneity in rocks. Int. J. Rock Mech. Min. Sci. 2020, 127, 104212. [Google Scholar] [CrossRef]
  7. Atkinson, B.K. Fracture Mechanics of Rock; Academic Press: London, UK, 1987. [Google Scholar]
  8. Labuz, J.F.; Shah, S.P.; Dowding, C.H. Measurement and description of tensile fracture in granite. J. Eng. Mech. 1989, 115, 1935–1949. [Google Scholar] [CrossRef]
  9. Moazzami, M.; Ayatollahi, M.; Akhavan-Safar, A. Assessment of the fracture process zone in rocks using digital image correlation technique: The role of mode-mixity, size, geometry and material. Int. J. Damage Mech. 2020, 29, 646–666. [Google Scholar] [CrossRef]
  10. Zietlow, W.K.; Labuz, J.F. Measurement of the intrinsic process zone in rock using acoustic emission. Int. J. Rock Mech. Min. Sci. 1998, 35, 291–299. [Google Scholar] [CrossRef]
  11. Brooks, Z. Fracture Process Zone: Microstructure and Nanomechanics in Quasi-Brittle Materials. Ph.D. Thesis, Massachusetts Institute of Technology, Boston, MA, USA, 2013. [Google Scholar]
  12. Fakhimi, A.; Tarokh, A. Process zone and size effect in fracture testing of rock. Int. J. Rock Mech. Min. Sci. 2013, 60, 95–102. [Google Scholar] [CrossRef]
  13. Tarokh, A.; Makhnenko, R.Y.; Fakhimi, A.; Labuz, J.F. Scaling of the fracture process zone in rock. Int. J. Fract. 2017, 204, 191–204. [Google Scholar] [CrossRef]
  14. Haidar, K.; Pijaudier-Cabot, G.; Dubé, J.F.; Loukili, A. Correlation between the internal length, the fracture process zone and size effect in model materials. Mater. Struct. 2005, 38, 201–210. [Google Scholar] [CrossRef] [Green Version]
  15. Guha Roy, D.; Singh, T.N.; Kodikara, J. Influence of joint anisotropy on the fracturing behavior of a sedimentary rock. Eng. Geol. 2017, 228, 224–237. [Google Scholar] [CrossRef]
  16. Han, Z.; Zhou, J.; Zhang, L. Influence of grain size heterogeneity and in-situ stress on the hydraulic fracturing process by PFC2D modeling. Energies 2018, 11, 1413. [Google Scholar] [CrossRef] [Green Version]
  17. Tang, H.; Li, S.; Zhang, D. The effect of heterogeneity on hydraulic fracturing in shale. J. Pet. Sci. Eng. 2018, 162, 292–308. [Google Scholar] [CrossRef]
  18. Yang, T.H.; Tham, L.G.; Tang, C.A.; Liang, Z.Z.; Tsui, Y. Influence of heterogeneity of mechanical properties on hydraulic fracturing in permeable rocks. Rock Mech. Rock Eng. 2004, 37, 251–275. [Google Scholar] [CrossRef]
  19. Davraz, A.; Nalbantçılar, M.T.; Varol, S.; Önden, İ. Hydrogeochemistry and reservoir characterization of the Konya geothermal fields, Central Anatolia/Turkey. Geochemistry 2022, 82, 125867. [Google Scholar] [CrossRef]
  20. Gunes Yilmaz, N.; Karaca, Z.; Goktan, R.M.; Akal, C. Relative brittleness characterization of some selected granitic building stones: Influence of mineral grain size. Constr. Build. Mater. 2009, 23, 370–375. [Google Scholar] [CrossRef]
  21. Li, X.; Marasteanu, M. The fracture process zone in asphalt mixture at low temperature. Eng. Fract. Mech. 2010, 77, 1175–1190. [Google Scholar] [CrossRef]
  22. Spagnoli, A.; Carpinteri, A.; Ferretti, D.; Vantadori, S. An experimental investigation on the quasi-brittle fracture of marble rocks. Fatigue Fract. Eng. Mater. Struct. 2016, 39, 956–968. [Google Scholar] [CrossRef]
  23. Erarslan, N. Microstructural investigation of subcritical crack propagation and Fracture Process Zone (FPZ) by the reduction of rock fracture toughness under cyclic loading. Eng. Geol. 2016, 208, 181–190. [Google Scholar] [CrossRef]
  24. ISRM Commission on Standardization of Laboratory and Field Tests. Suggested methods for determining tensile strength of rock materials. Int. J. Rock Mech. Min. Sci. Geomech. Abstr. 1978, 15, 99–103. [Google Scholar] [CrossRef]
  25. ASTM D3967-16; Standard Test Method for Splitting Tensile Strength of Intact Rock Core Specimens. American Society of Testing Materials: West Conshohocken, PA, USA, 2016; pp. 1–5. [CrossRef]
  26. Kuruppu, M.D.; Obara, Y.; Ayatollahi, M.R.; Chong, K.P.; Funatsu, T. ISRM-suggested method for determining the Mode I static fracture toughness using semi-circular bend specimen. Rock Mech. Rock Eng. 2014, 47, 267–274. [Google Scholar] [CrossRef] [Green Version]
  27. ISRM Commission on Standardization of Laboratory and Field Tests. Suggested methods for determining the fracture-toughness of rock. Int. J. Rock Mech. Min. Sci. 1988, 25, 71–96. [Google Scholar] [CrossRef]
  28. Fowell, R.J.; Xu, C.; Dowd, P.A. An update on the fracture toughness testing methods related to the cracked chevron-notched Brazilian disk (CCNBD) specimen. Pure Appl. Geophys. 2006, 163, 1047–1057. [Google Scholar] [CrossRef]
  29. Potyondy, D.O.; Cundall, P.A. A bonded-particle model for rock. Int. J. Rock Mech. Min. Sci. 2004, 41, 1329–1364. [Google Scholar] [CrossRef]
  30. Nikolić, M.; Karavelić, E.; Ibrahimbegovic, A.; Miščević, P. Lattice element models and their peculiarities. Arch. Comput. Method Eng. 2018, 25, 753–784. [Google Scholar] [CrossRef] [Green Version]
  31. Potyondy, D.O. A grain-based model for rock: Approaching the true microstructure. In Proceedings of the Rock Mechanics in the Nordic Countries 2010, Kongsberg, Norway, 9–12 June 2010; pp. 225–234. [Google Scholar]
  32. Zhou, J.; Lan, H.; Zhang, L.; Yang, D.; Song, J.; Wang, S. Novel grain-based model for simulation of brittle failure of Alxa porphyritic granite. Eng. Geol. 2019, 251, 100–114. [Google Scholar] [CrossRef]
  33. Nikolic, M.; Ibrahimbegovic, A. Rock mechanics model capable of representing initial heterogeneities and full set of 3D failure mechanisms. Comput. Methods Appl. Mech. Eng. 2015, 290, 209–227. [Google Scholar] [CrossRef]
  34. Itasca Consulting Group Inc. PFC2D—Particle Flow Code in 2 Dimensions; Itasca Consulting Group Inc.: Minneapolis, MN, USA, 2019. [Google Scholar]
  35. Zhai, M.; Xue, L.; Bu, F.; Yang, B.; Ding, H. Microcracking behaviors and acoustic emission characteristics of granite subjected to direct shear based on a novel grain-based model. Comput. Geotech. 2022, 151, 104955. [Google Scholar] [CrossRef]
  36. Pierce, M.; Cundall, P.; Potyondy, D.; Ivars, D.M. A synthetic rock mass model for jointed rock. In Proceedings of the 1st Canada-U.S. Rock Mechanics Symposium, Vancouver, BC, Canada, 27–31 May 2007. [Google Scholar]
  37. Schön, J.H. Physical Properties of Rocks: Fundamentals and Principles of Petrophysics, 2nd ed.; Elsevier: Amsterdam, The Netherlands, 2015; Volume 65. [Google Scholar]
  38. Bahrani, N.; Kaiser, P.K.; Valley, B. Distinct element method simulation of an analogue for a highly interlocked, non-persistently jointed rockmass. Int. J. Rock Mech. Min. Sci. 2014, 71, 117–130. [Google Scholar] [CrossRef] [Green Version]
  39. Niu, J. Research on the Fracture Mechanics Index of Rock Fracability Evaluation. Ph.D. Thesis, University of Chinese Academy of Sciences, Beijing, China, 2015. [Google Scholar]
  40. Wong, L.N.Y.; Einstein, H.H. Crack coalescence in molded gypsum and Carrara marble: Part 2—Microscopic observations and interpretation. Rock Mech. Rock Eng. 2009, 42, 513–545. [Google Scholar] [CrossRef]
  41. Morgan, S.P.; Johnson, C.A.; Einstein, H.H. Cracking processes in Barre granite: Fracture process zones and crack coalescence. Int. J. Fract. 2013, 180, 177–204. [Google Scholar] [CrossRef] [Green Version]
  42. Cesano, D.; Bagtzoglou, A.C.; Olofsson, B. Quantifying fractured rock hydraulic heterogeneity and groundwater inflow prediction in underground excavations: The heterogeneity index. Tunn. Undergr. Space Technol. 2003, 18, 19–34. [Google Scholar] [CrossRef]
  43. Sabri, M.; Ghazvinian, A.; Nejati, H.R. Effect of particle size heterogeneity on fracture toughness and failure mechanism of rocks. Int. J. Rock Mech. Min. Sci. 2016, 81, 79–85. [Google Scholar] [CrossRef]
  44. Mahabadi, O.K.; Tatone, B.S.A.; Grasselli, G. Influence of microscale heterogeneity and microstructure on the tensile behavior of crystalline rocks. J. Geophys. Res. Solid Earth 2014, 119, 5324–5341. [Google Scholar] [CrossRef]
  45. Weibull, W. A statistical distribution function of wide applicability. J. Appl. Mech. 1951, 13, 293–297. [Google Scholar] [CrossRef]
  46. Tang, C.A.; Liu, H.; Lee, P.K.K.; Tsui, Y.; Tham, L.G. Numerical studies of the influence of microstructure on rock failure in uniaxial compression—Part I: Effect of heterogeneity. Int. J. Rock Mech. Min. Sci. 2000, 37, 555–569. [Google Scholar] [CrossRef]
  47. Liu, H.Y.; Roquete, M.; Kou, S.Q.; Lindqvist, P.A. Characterization of rock heterogeneity and numerical verification. Eng. Geol. 2004, 72, 89–119. [Google Scholar] [CrossRef]
  48. Zhu, W.; Tang, C.A. Micromechanical model for simulating the fracture process of rock. Rock Mech. Rock Eng. 2004, 37, 25–56. [Google Scholar] [CrossRef]
  49. Yang, B.C.; Qin, S.Q.; Xue, L.; Chen, H.R. The reasonable range limit of the shape parameter in the Weibull distribution for describing the brittle failure behavior of rocks. Rock Mech. Rock Eng. 2021, 54, 3359–3367. [Google Scholar] [CrossRef]
  50. Meng, F.; Wong, L.N.Y.; Zhou, H. Rock brittleness indices and their applications to different fields of rock engineering: A review. J. Rock Mech. Geotech. Eng. 2021, 13, 221–247. [Google Scholar] [CrossRef]
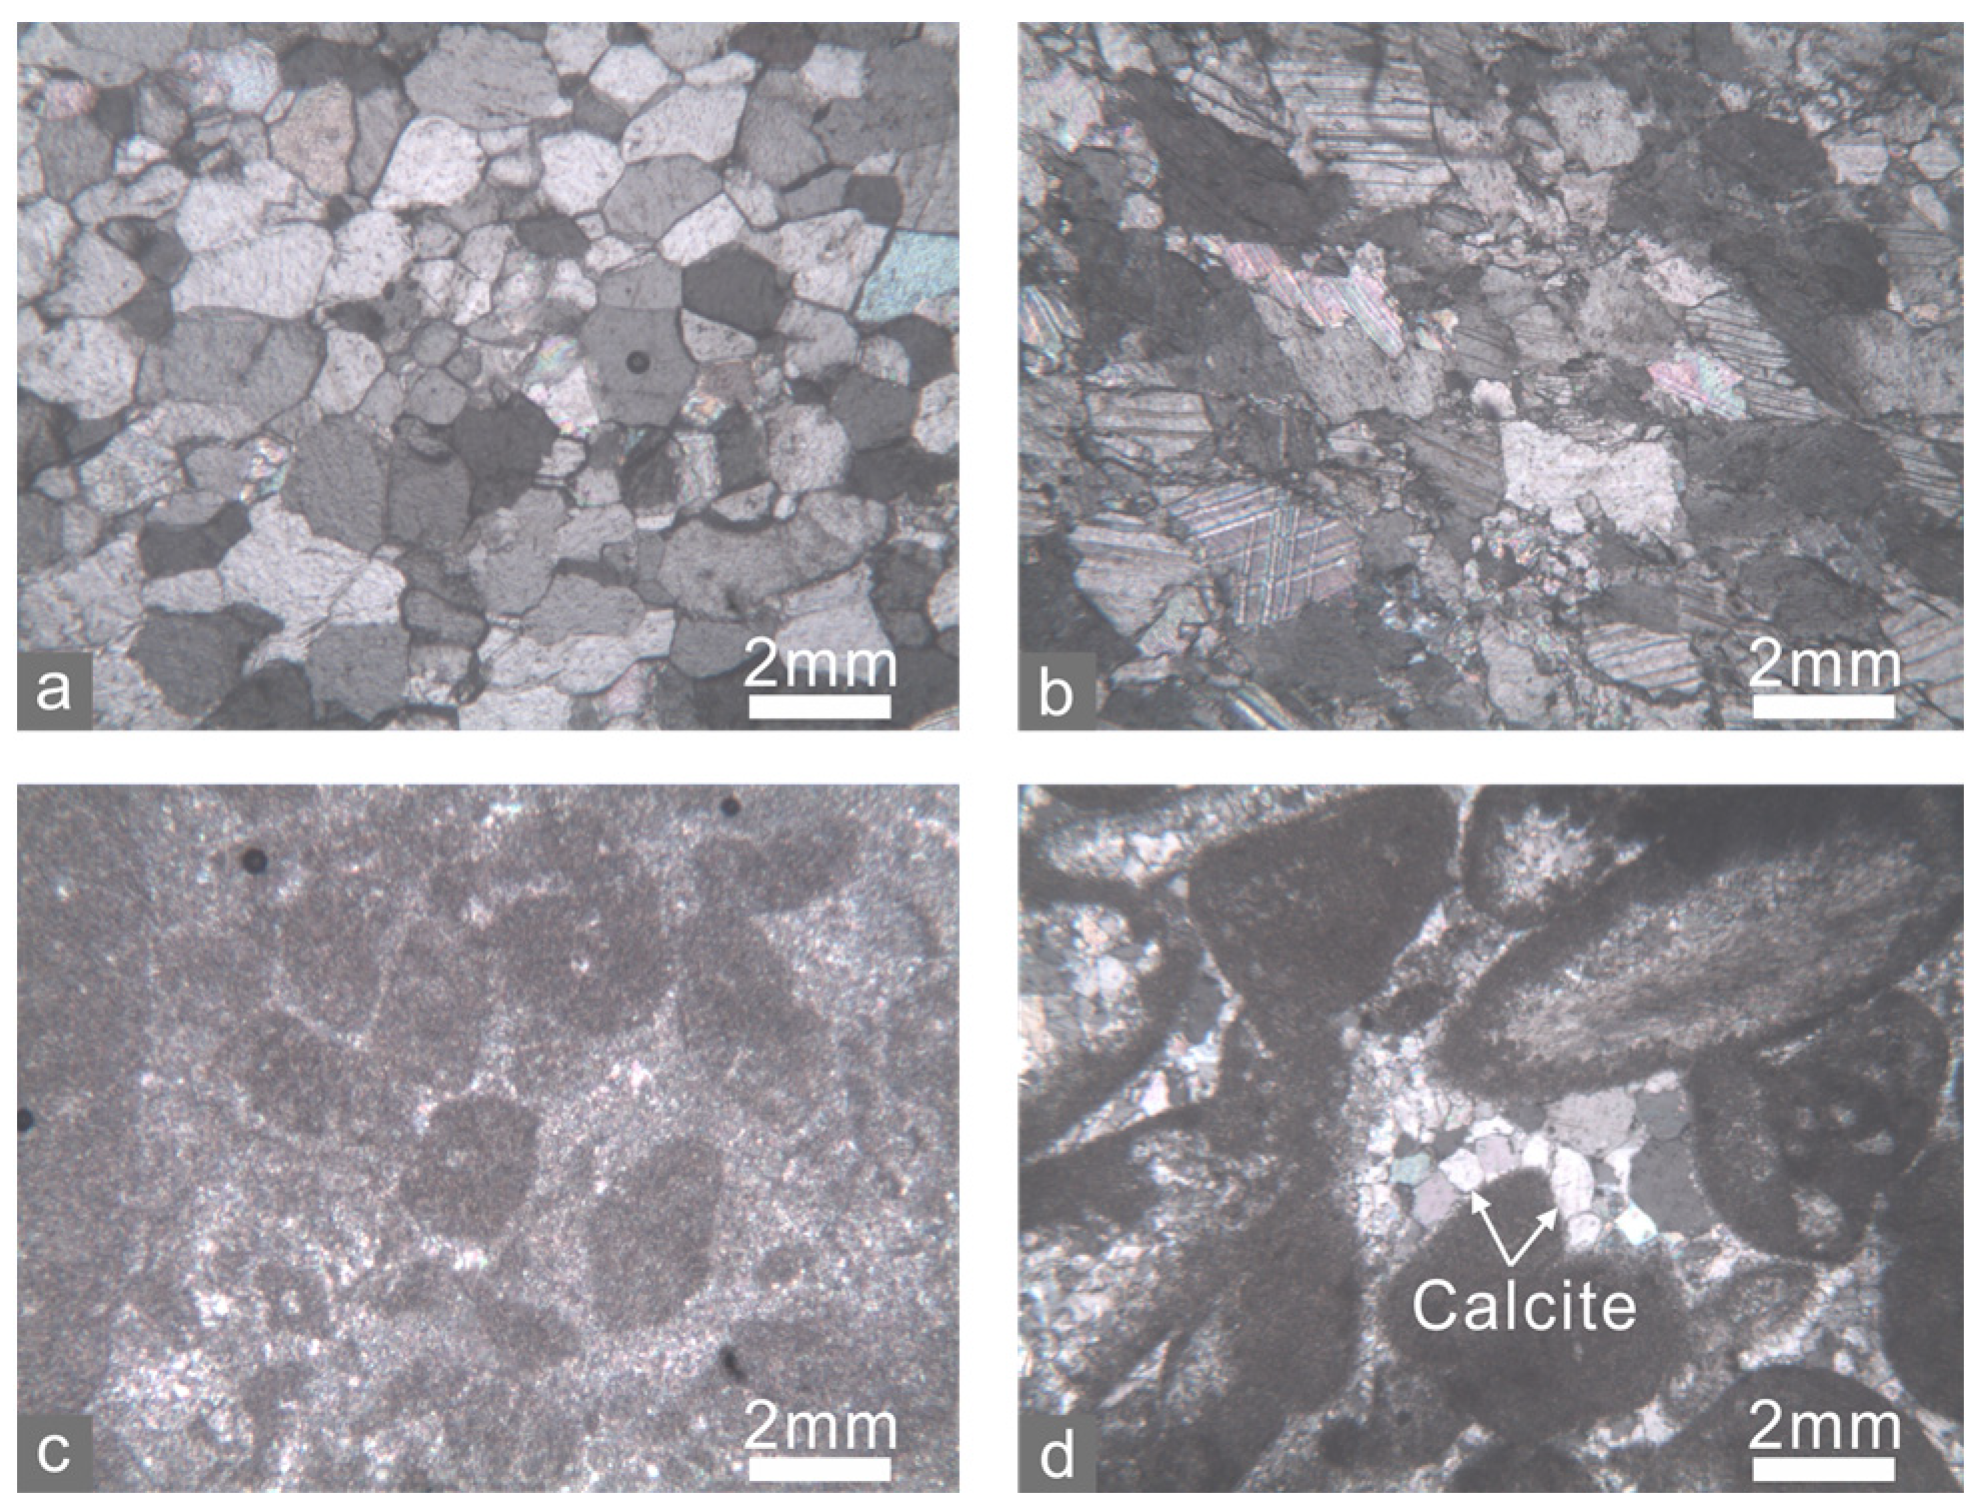
Figure 1. Microstructures of marble (a) J, (b) K, limestone (c) P and (d) N.
Energies 15 08332 g001
Figure 2. Characteristics of mineral distribution in shale (a) S1 and (b) S2, and microscopy observation results of (c) S1, (d) green and (e) white layers in S2.
Energies 15 08332 g002
Figure 3. (a) An ongoing BD test on shale. Thickness B = 30 mm and diameter D = 75 mm. (b) Orthographic and (c) side profiles of a CCNBD shale specimen. Geometric parameters: diameter D = 75 mm, radius R = 37.5 mm, thickness B = 30 mm, saw radius Rs = 25 mm, initial chevron-notched crack length a0 = 8.45 mm, and final chevron-notched crack length a1 = 23.5 mm.
Energies 15 08332 g003
Figure 4. Valid range for parameters α1 and αB (blue shadow, [28]) and the distribution of parameter values for all of the prepared CCNBD specimens. Dimensionless parameters: α0 = a0/R, and αB = B/R.
Energies 15 08332 g004
Figure 5. (ad) Modeling procedure of GBM for marble. Grey circles are particles, and black lines define the polygonal minerals in (b,c). The light and dark blue curves in (d) denote intra- and inter-grain contacts.
Energies 15 08332 g005
Figure 6. Schematic of bonded and unbonded state for (a) soft-bonded and (b) smooth-joint models.
Energies 15 08332 g006
Figure 7. Force–displacement relationship of soft-bonded contact in (a) bonded [35] and (b) unbonded state. F ¯ n : normal force; F ¯ n max : peak normal force; F ¯ n * : normal force corresponding to bond breakage; F ¯ s : tangential shear force; F ¯ s max : peak tangential shear force; U ¯ n : normal displacement; U ¯ n c : normal displacement corresponding to peak normal force; U ¯ n * : normal displacement corresponding to bond breakage; U ¯ s c : tangential displacement corresponding to onset of shear slide; k ¯ n : normal stiffness; k ¯ s : tangential stiffness; A: cross-sectional area.
Energies 15 08332 g007
Figure 8. Load–displacement relationship of experimental (dark blue curves) and numerical (light blue curves) results for (a) marble J and (b) K in the BD test and the corresponding fracture morphology.
Energies 15 08332 g008
Figure 9. (a) Tensile strength, (b) Mode I fracture toughness and (c) FPZ radius of the six rock types. Grey triangles mean averages.
Energies 15 08332 g009
Figure 10. Linear correlation between tensile strength and Mode I fracture toughness. The data of rocks B–F and R refer to [39].
Energies 15 08332 g010
Figure 11. Crack path and aperture observed in the CCNBD specimens of (a) marble J, (b) marble K, (c) limestone P, (d) limestone N, (e) shale S1, and (f) shale S2. Dashed circles in (b) denote the white patches indicating FPZs.
Energies 15 08332 g011
Figure 12. Applied load and crack number vs. axial displacement relationship for (a) marble J and (b) K in the simulated CCNBD test and the crack morphology corresponding to certain levels of applied load. Points I: micro crack growth from notched crack tips; II: onset of accelerated growth of micro crack; III: formation of macroscopic cracks; IV: peak-load point with the FPZ size reaching its maximum.
Energies 15 08332 g012
Figure 13. Micro crack number distribution within study areas (7 × 7 mm2) at the vicinity of the upper and lower notched crack tips of (a,b) marble J and (c,d) K. X and Y directions are respectively perpendicular and parallel with the notched crack.
Energies 15 08332 g013
Figure 14. (a) P vs. σ/σ0 relationship corresponding to different heterogeneity indices m (m1 > m2). (b) Schematic of the tensile stress distribution in the vicinity of crack tip.
Energies 15 08332 g014
Table 1. XRD results of the experiment materials.
SampleQuartz (%)Orthoclase (%)Plagioclase (%)Calcite (%)Dolomite (%)Clay (%)
J///1.898.2/
K///96.04.0/
P///100.0//
N///100.0//
S148.2/17.213.9/20.7
S2 (green layer)19.91.54.155.3/19.2
S2 (white layer)16.4//81.8/1.8
Table 2. Calibrated microscale parameters of marble J and K.
ElementsMicroscale ParameterMarble JMarble K
ParticlesDensity (kg/m3)26902690
Effective modulus (GPa)7070
Normal to shear stiffness ratio1.51.5
Friction coefficient0.60.6
Soft-bonded intra-grain contactEffective modulus (GPa)10.015.0
Normal to shear stiffness ratio2.02.0
Friction coefficient0.60.6
Tensile strength (MPa)18.037.5
Cohesion (MPa)72.0150.0
Friction angle (°)45.045.0
Softening factor0.10.1
Softening tensile strength factor0.70.7
Smooth-joint inter-grain contactTensile strength coefficient0.30.3
Cohesion coefficient0.80.8
Friction angle coefficient0.60.6
Friction adjustment coefficient0.50.5
Normal stiffness coefficient0.80.8
Shear stiffness coefficient0.150.15
Publisher’s Note: MDPI stays neutral with regard to jurisdictional claims in published maps and institutional affiliations.