Article

Equivalent Inertia Estimation of Asynchronous Motor and Its Effect on Power System Frequency Response

1
School of Electric Power, Civil Engineering and Architecture, Shanxi University, Taiyuan 030006, China
2
State Grid Shanxi Electric Power Research Institute, Taiyuan 030001, China
*
Author to whom correspondence should be addressed.
Energies 2022, 15(22), 8350; https://doi.org/10.3390/en15228350
Submission received: 10 October 2022 / Revised: 29 October 2022 / Accepted: 3 November 2022 / Published: 8 November 2022

Abstract

:
With the increase in renewable energy penetration, the traditional synchronous generator is gradually replaced, resulting in the decrease in system inertia level and the weakening of frequency modulation capability. In addition to synchronous inertia, load inertia of asynchronous motors also widely exists in power systems, but its effect on system frequency stability has not been fully studied. To this end, based on the detailed model of asynchronous motor, the amplitude–phase motion equation based on potential after transient reactance is proposed, and then the phase motion equation of potential after transient reactance is derived to evaluate the equivalent inertia of asynchronous motor under electromechanical time scale. The equivalent inertia of asynchronous motor is studied theoretically by building the system frequency response model. The results show that the equivalent inertia of asynchronous motor can essentially improve the system frequency stability, while showing time-varying characteristics due to the combined effect of slip frequency and rotor speed. The analyses are validated with time-domain simulation results. The proposed method lays a foundation for mechanistic understanding of the frequency characteristics of the equivalent inertia of asynchronous motors affected by active and reactive power and its influence on the system frequency characteristics.

1. Introduction

With the development of renewable energy, a large number of synchronous power sources are gradually replaced by wind power, photovoltaic and other non-synchronous power sources. Since the non-inertia response characteristics of non-synchronous power sources are under traditional control strategy, the continuous reduction in synchronous power sources makes the total system inertia level decrease and the system frequency characteristics deteriorate, which may cause system failure or even grid blackout in serious cases [1]. However, the asynchronous motor, which has a high proportion on the load side, can essentially provide certain inertia support to the system frequency disturbance [2,3]. In this context, the influence of asynchronous motor inertia level on the system frequency characteristics during black-start is particularly prominent. The importance of studying the inertia response of grid-connected asynchronous motors and estimating the inertia level of asynchronous motors for system frequency stability during black-start cannot be overstated.
Asynchronous motors have attracted the attention of scholars in recent years because they can provide inertia support to system frequency disturbance by releasing rotor kinetic energy [4,5,6,7]. To accurately estimate the inertia level of asynchronous motor in the system frequency disturbance, the rotational inertia of asynchronous motor is obtained by calculating the ratio of rotor kinetic energy to its capacity [8,9], and then the influence of asynchronous motor on the system frequency characteristics is analyzed. The effect of asynchronous motors on the system frequency characteristics was defined in [10,11] as a damping factor, and in fact asynchronous motors are able to provide some inertial support to the system frequency perturbations by means of grid connection. The above literature describes the rotational inertia of asynchronous motors, which determines the change rate of rotor speed when power disturbance occurs, and cannot represent the total inertia of asynchronous motor when the system frequency disturbance occurs. In fact, the sensitivity between the output power of asynchronous motor and the rate of change of system frequency determines the inertia level when the system energy is unbalanced. Based on the detailed model of asynchronous motor, the relationship between the output power of asynchronous motor and the rate of change of system frequency is studied by transfer function in [12], and the influence of asynchronous motor inertia on the system frequency response characteristics is clarified. Based on the concept of average system frequency and the method of polynomial fitting, the total system inertia is obtained in [13] by the ratio of system disturbance power change to the rate of change of system frequency at the moment of disturbance, based on which the total system inertia is subtracted from the inertia of synchronous and fixed-speed wind turbines in the system to obtain the inertia of asynchronous motor load [14]. The estimation methods applied in the above literature have high requirements on generator parameters and the overly mathematical theoretical derivation ignores to a certain extent the physical laws of asynchronous motors [15].
On the premise of considering the internal law of asynchronous motors, this paper reflects the inertia response of asynchronous motor when the system is disturbed by the relationship between potential after transient reactance, which represents the dynamic characteristics of asynchronous motor, and the input and output power. Based on this method, the amplitude–phase motion equation based on potential after transient reactance is proposed and its frequency response is analyzed. Secondly, the phase motion equation of potential after transient reactance is obtained by using the small-signal analysis method, and the equivalent inertia of asynchronous motor is estimated by the phase motion of potential after transient reactance. Finally, the equivalent inertia of asynchronous motor is theoretically analyzed by building the system frequency response model, and the simulation verification is carried out based on the infinite single-machine system in the process of black-start. The results show that the equivalent inertia of asynchronous motor can effectively improve system frequency dynamic characteristics.

2. Amplitude-Phase Motion Equation Based on Potential after Transient Reactance

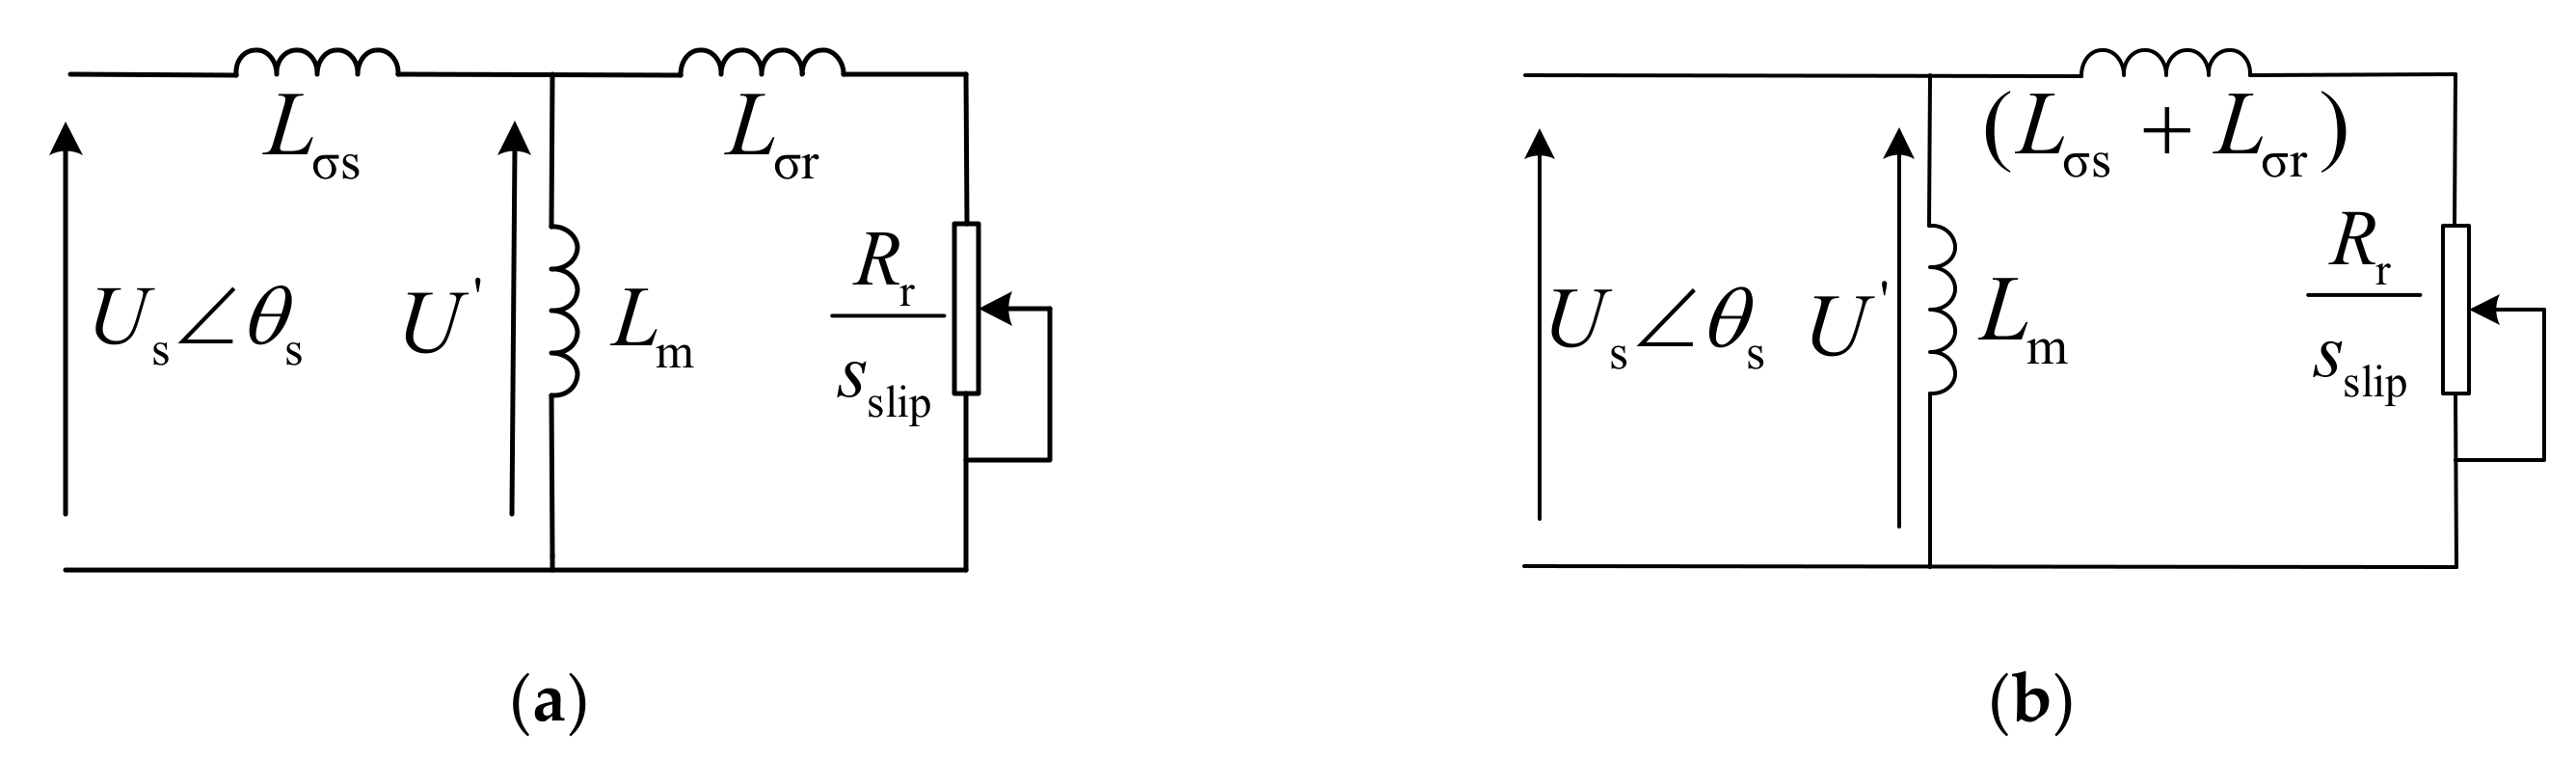
2.1. Model Derivation

In the study of power system stability, it is widely used to characterize the dynamic characteristics of asynchronous motors by the motion law of potential after transient reactance [10,16]. Different from [15], which does not consider the internal laws of asynchronous motors, based on the modeling method of asynchronous motors in [10], this paper ignores the stator winding electromagnetic transient and stator resistance, and shorts the rotor windings. The per unit electrical equation of asynchronous motor can be summarized as follows.
Stator voltage equation:
u d s + ω s ψ q s = 0 u q s ω s ψ d s = 0 u d r = 0 = R r i d r ( ω s ω r ) ψ q r + 1 ω base d ψ d r d t u q r = 0 = R r i q r + ( ω s ω r ) ψ d r + 1 ω base d ψ q r d t
where ψ, i, u, and Rr denote flux linkage, current, voltage, and rotor resistance, respectively; the subscripts d and q denote the components on the d-axis and q-axis, respectively; the subscripts s and r denote the variables of the stator and the rotor, respectively, and ωbase, ωs, and ωr are the base value of angular speed, the angular speed of the rotating magnetic field, and the rotor speed respectively.
In Equation (1), the relationship between flux linkages and currents is
ψ d s = L s i d s + L m i d r ψ q s = L s i q s + L m i q r ψ d r = L r i d r + L m i d s ψ q r = L r i q r + L m i q s L s = L σ s + L m L r = L σ r + L m
where Lσs, Lσr, and Lm are the stator leakage reactance, the rotor leakage reactance, and the magnetizing reactance.
After combining the stator voltage equations and expressing the result in phasor form, we have
U s = j X s I s + U
From Equation (3), the electromagnetic transients and the stator resistance of stator winding of asynchronous motor are neglected at the electromechanical time scale, and the rotor-side reactance is converted to the stator side to obtain the equivalent circuit diagram, as shown in Figure 1a. Since the stator leakage reactance and the rotor leakage reactance are far less than the excitation reactance, the equivalent circuit shown in Figure 1a can be converted to an equivalent circuit diagram, as shown in Figure 1b, where U′ denotes the potential amplitude after transient reactance, Us denotes the stator-side terminal voltage amplitude, θs denotes the stator-side terminal voltage phase, and sslip denotes slip.
From Figure 1b, it can be seen that the potential after transient reactance U is equal to the motion law of the stator-side terminal voltage Us. From this, the vector U′ rotating speed ωs is
ω s = ω + ω r
where ω is slip frequency.
The motion law of potential after transient reactance U′ can describe the dynamic characteristics of asynchronous motor. By studying the variation law of vector U′ rotating speed, the amplitude–phase motion equation based on potential after transient reactance can be obtained as
1 ω base d u d t = R r L r u + R r L m 2 ω s L r 2 u Q e 1 ω base d θ d t = R r L m 2 ω s L r 2 u 2 P e ( ω s ω r )
The rotor motion in asynchronous motor reflects the balance between mechanical power and air-gap power according to
P e P m = 2 H d ω r d t
where Pe represents the air-gap power that is the numeric equivalent of the active power consumed by asynchronous motor [17], and Pm is the mechanical power that can be modeled as a function of rotor speed:
P m = f ( ω r )
The detailed expression of mechanical power is shown in Appendix A.
The relationship between slip sslip and slip frequency ω can be written as
ω = s slip ω s
The relationship between ωs and the phase θ of potential after transient reactance is
ω s = d θ d t

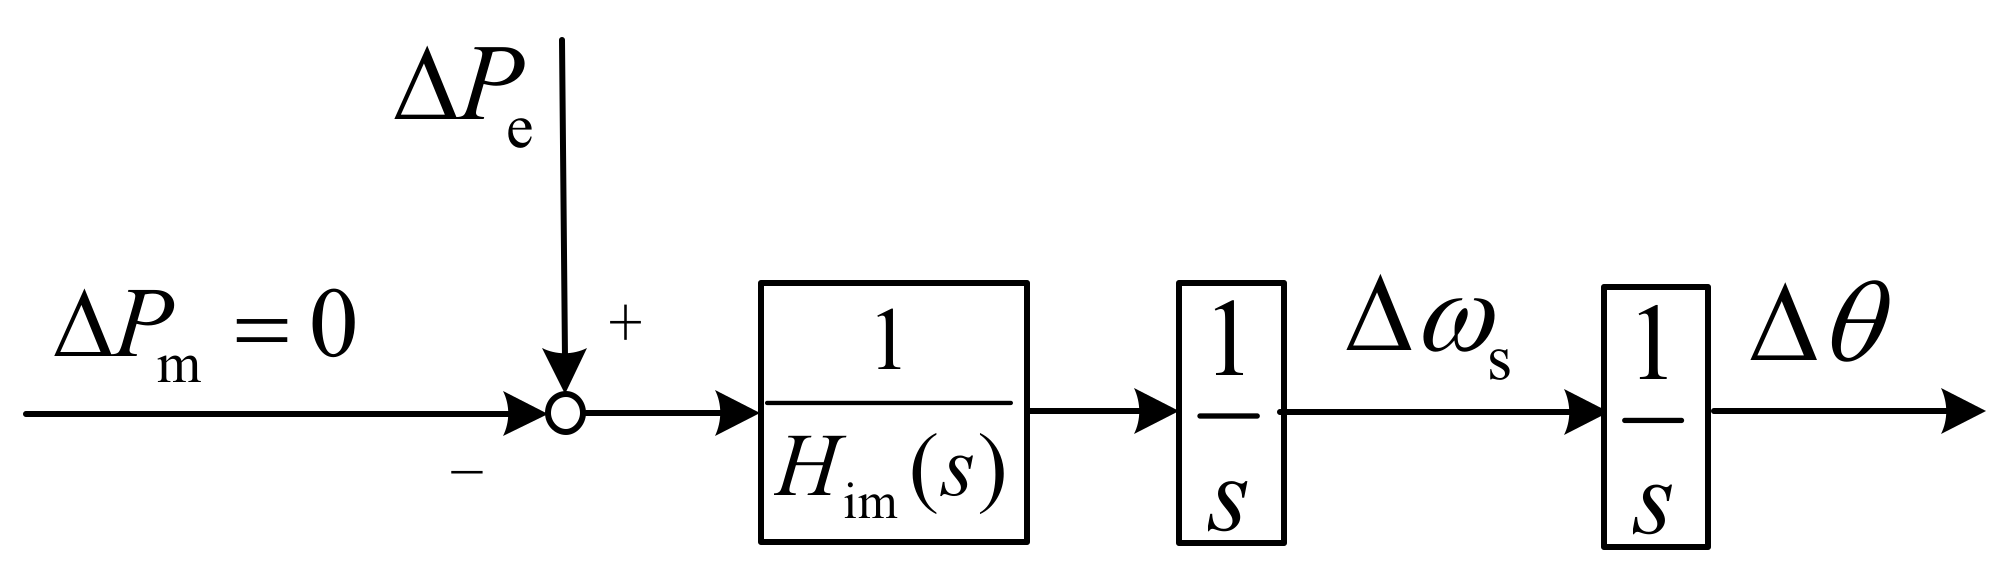
2.2. Model Analysis and Definition of Equivalent Inertia Him

For the single-machine infinite system structure in the process of black-start, as shown in Figure 2, combined with Equation (5), the amplitude–phase motion equation based on potential after transient reactance, as shown in Figure 3, can be established.
In Figure 2, the asynchronous motor load is connected to the infinite grid. U′∠θ denotes the potential after transient reactance of asynchronous motor. Xg is line reactance and PD is load disturbance. In Figure 3, when the system power is unbalanced, the change in active power transmitted from the grid to asynchronous motor causes the change in rotor speed, resulting in the change in both phase and frequency of potential after transient reactance. This change causes the power exchange between asynchronous motor and the grid, which in turn affects the active power absorbed by asynchronous motor. In addition, when system frequency changes and there is a problem of voltage stability, the amplitude change in potential after transient reactance affects the reactive power absorbed by asynchronous motor through the grid. Combining with Equation (5), it can be seen that the reactive power change causes the frequency change in potential after transient reactance. Therefore, when a frequency disturbance occurs in the grid and there is a voltage stability problem, the change in voltage magnitude of asynchronous motor causes the frequency change in potential after transient reactance, which in turn affects the inertia level of asynchronous motor during the grid frequency disturbance.
Through the above analysis, the amplitude–phase motion equation, based on potential after transient reactance shown in Figure 3, deeply reflects the dynamic characteristics of asynchronous motor. Distinct from the inertia time constant describing rotational inertia, the inertia level of asynchronous motor during grid frequency perturbation is directly related to the change law of potential after transient reactance rotating speed. Therefore, this paper estimates the inertia level of asynchronous motor during the grid frequency disturbances by defining the equivalent inertia Him that reflects the change law of potential after transient reactance rotating speed.

3. Equivalent Inertia Estimation of Asynchronous Motors in Electromechanical Time Scales

The relationship between the input power variation in asynchronous motor and the frequency variation in potential after transient reactance is non-linear, and it is difficult to quantify the equivalent inertia Him of asynchronous motor by existing mathematical tools. In this section, the amplitude–phase motion equation based on potential after transient reactance is linearized and derived at the stable operating point by small-signal modeling, and the phase motion equation of potential after transient reactance containing equivalent inertia is obtained. The equivalent inertia of asynchronous motor is analyzed theoretically.

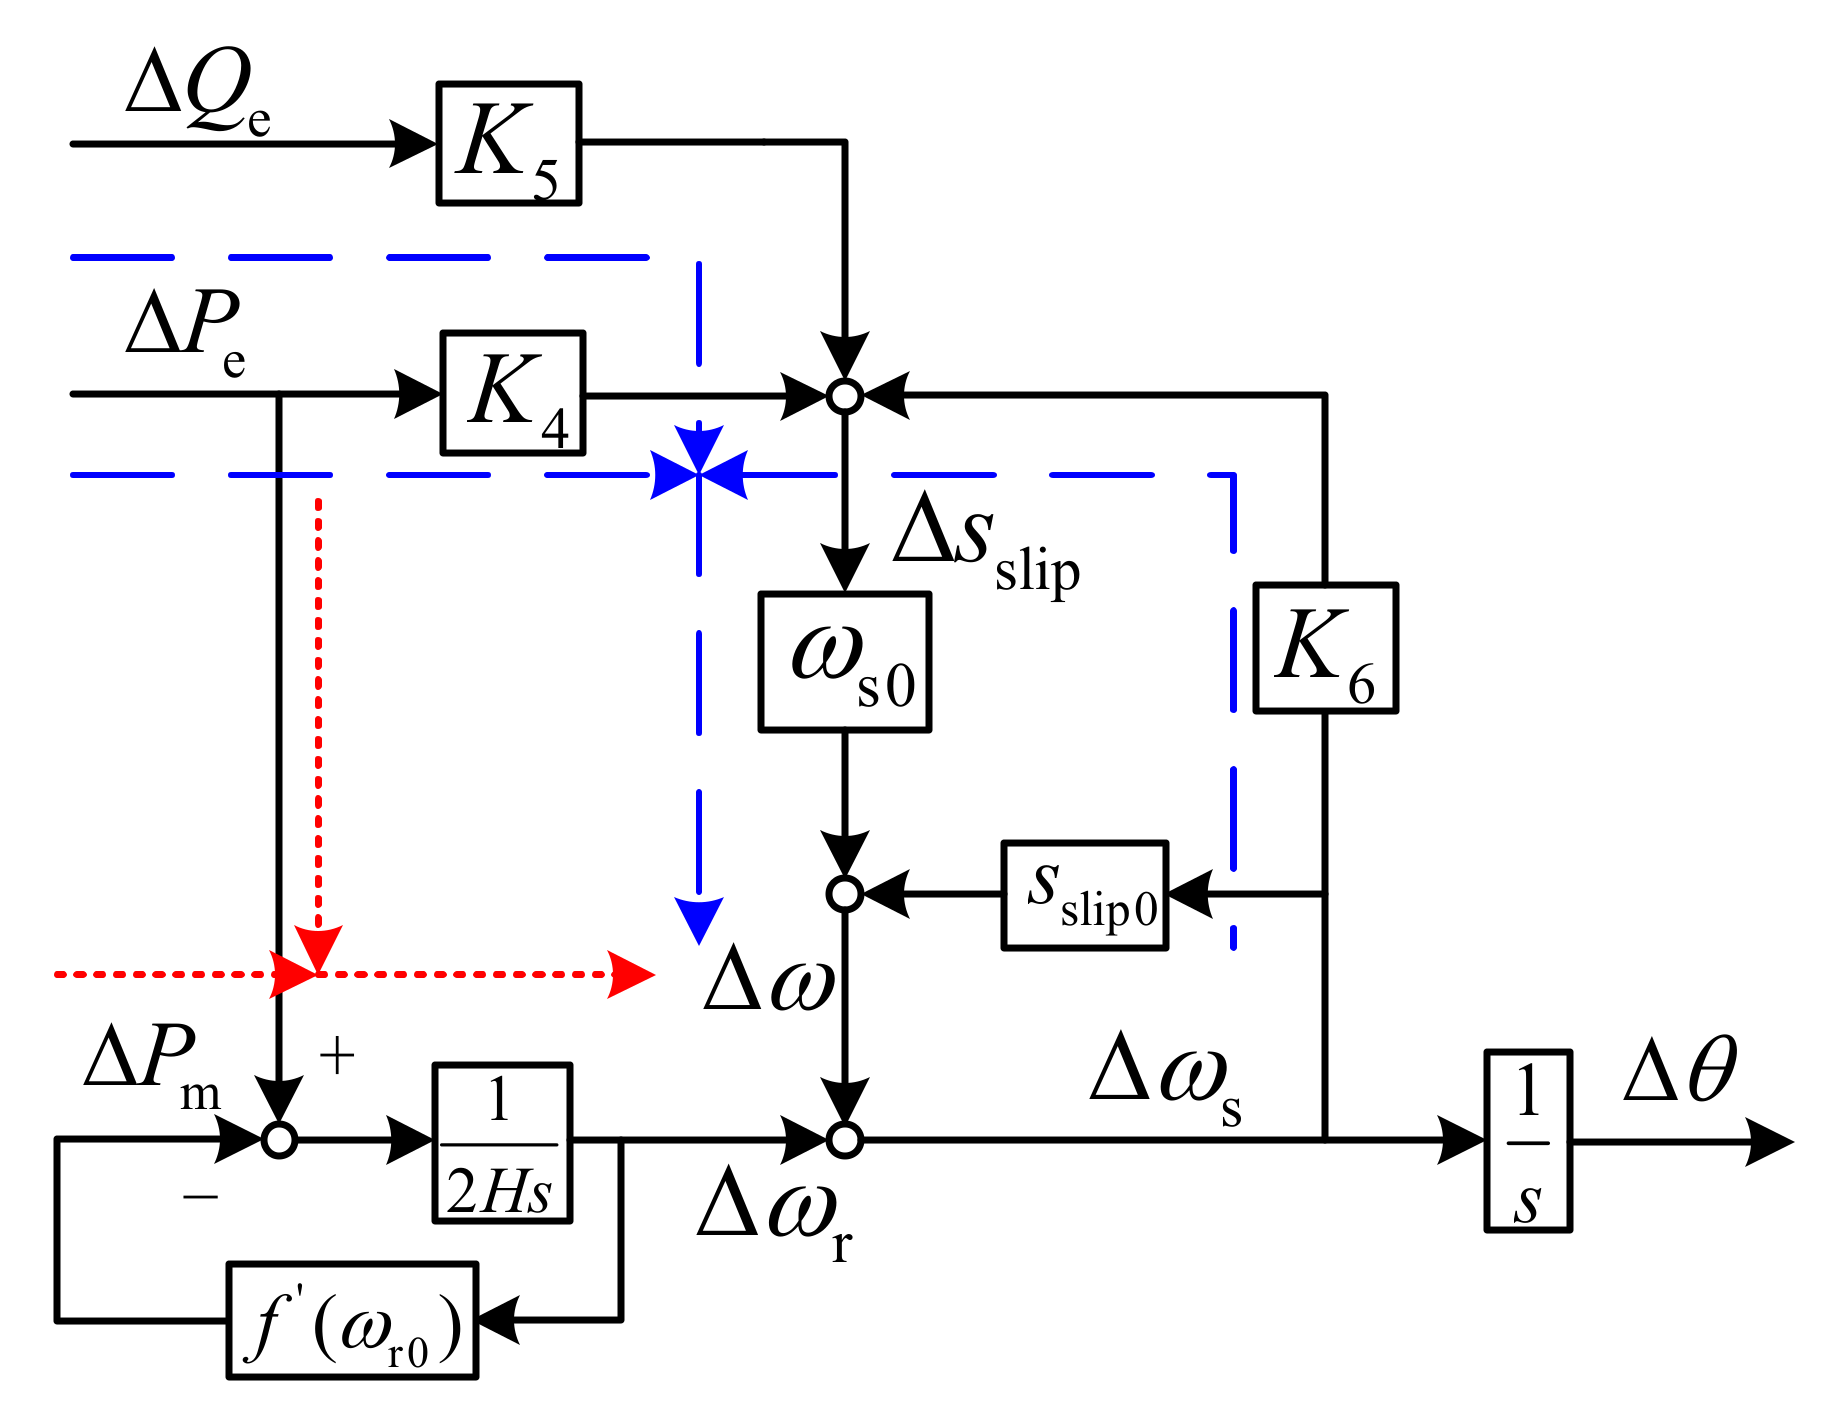
3.1. Small-Signal Modeling of the Phase Motion Equation of Potential after Transient Reactance

Linearization of the rotor motion equation of asynchronous motor at the stable operating point can be obtained:
Δ P e Δ P m = 2 H s Δ ω r
where the mechanical power is linearized at the stable working point according to Equation (7):
Δ P m = f ( ω r 0 ) Δ ω r
Similarly, linearizing Equations (4), (8), and (9), we obtain
Δ ω s = Δ ω + Δ ω r
Δ ω = s slip 0 Δ ω s + ω s 0 Δ s slip
Δ ω s = s Δ θ
After linearization of the amplitude and phase motion equation of potential after transient reactance at the stable working point, the amplitude U′ of potential after transient reactance and the variation in slip sslip are expressed by the variation in active power Pe, reactive power Qe, and the frequency ωs of potential after transient reactance:
Δ U = K 1 Δ P e + K 2 Δ Q e + K 3 Δ ω s
Δ s slip = K 4 Δ P e + K 5 Δ Q e + K 6 Δ ω s
where the detailed expressions of K1~K6 are shown in Appendix A.
According to Equations (10)–(14) and (16), the small-signal block diagram of the phase motion equation of potential after transient reactance based on the inertial time constant is shown in Figure 4.
Since slip frequency and slip in Equations (13) and (16) are intermediate variables in the process of small-signal analysis, the frequency expression for potential after transient reactance can be obtained by substituting Equations (13) and (16) into Equation (12).
Δ ω s = K 4 ω s 0 1 s slip 0 K 6 ω s 0 Δ P e + K 5 ω s 0 1 s slip 0 K 6 ω s 0 Δ Q e + 1 1 s slip 0 K 6 ω s 0 Δ ω r
It can be seen from Equation (17) that the frequency change in potential after transient reactance is mainly affected by parameters K5, K6, operating point, active power, and reactive power. When the system is at a low operating point, the influence of a small frequency disturbance on the amplitude change in potential after transient reactance can be ignored, i.e., ΔU′ = 0. Then, Equation (18) can be obtained from Equation (15).
Δ Q e = K 1 K 2 Δ P e K 3 K 2 Δ ω s
Considering the variation in mechanical power with a disturbance of 0 pu ΔPm, substituting Equations (10), (11), and (18) into Equation (17) gives
Δ ω s = ω s 0 ( K 2 K 4 K 1 K 5 ) [ 2 H s + f ( ω r 0 ) ] + K 2 ( 1 s slip 0 ) K 2 + ω s 0 ( K 3 K 5 K 2 K 6 ) ( Δ P e Δ P m ) [ 2 H s + f ( ω r 0 ) ]
Equation (19) is arranged into the form for the rotor motion Equation (6) of asynchronous motor, and the phase motion equation of potential after transient reactance with equivalent inertia under the electromechanical time scale is obtained.
H im ( s ) s Δ ω s = Δ P e Δ P m
where
H im ( s ) = Y 1 s + Y 2 Y 3 s 2 + Y 4 s
where detailed expressions for Y1~Y4 are shown in Appendix A.
Based on Equations (14) and (20), the phase motion equation of potential after transient reactance with equivalent inertia is shown in Figure 5. It can be seen from Figure 5 that, different from the inertia time constant representing rotational inertia, the equivalent inertia Him(s) is a transfer function and is affected by multiple parameters.

3.2. Equivalent Inertia Analysis of Asynchronous Motor

When a power disturbance occurs in the system, both slip frequency and rotor speed of asynchronous motor respond, as shown in Figure 4. The slip frequency instantaneous response, which is affected by active power, reactive power, and the frequency of potential after transient reactance, causes the frequency change in potential after transient reactance. At this time, the inertia support of asynchronous motor to the power grid is very small. As the rotor speed is constrained by rotational inertia, the response speed is slow, and the rotor speed responds after the effect of slip frequency regulation to provide inertia support for system frequency. In summary, the inertia of asynchronous motor is not a constant in the frequency disturbance process.
It can be seen from Figure 5 that the unbalanced power adjusts the phase motion of potential after transient reactance through the equivalent inertia. Therefore, Figure 6 analyzes the inertia response characteristics of asynchronous motor by setting different operating points for equivalent inertia Him(s) on the premise that other parameters remain unchanged. As can be seen from the amplitude–frequency characteristic of equivalent inertia Him(s) in Figure 6, when the operating point drops, the amplitude of equivalent inertia Him(s) also decreases in the low frequency band, which is reflected in the grid frequency disturbance, and the inertia level of asynchronous motor also decreases; otherwise, the inertia level increases with the increase in the operating point.

4. Effect of Equivalent Inertia of Asynchronous Motor on Frequency Characteristics of Black-Start System

Based on the phase motion equation of potential after transient reactance with equivalent inertia proposed in the previous section, this section discusses the effect of equivalent inertia of asynchronous motor on the system frequency characteristics when load disturbance increases during black-start. Figure 7 shows the system structure of a grid-connected asynchronous motor, where SG represents the synchronous generator and IM represents the grid-connected asynchronous motor. Load A is the load disturbance. Table 1 shows the specific parameters of asynchronous motors. Table 2 shows the specific parameters of synchronous generator.

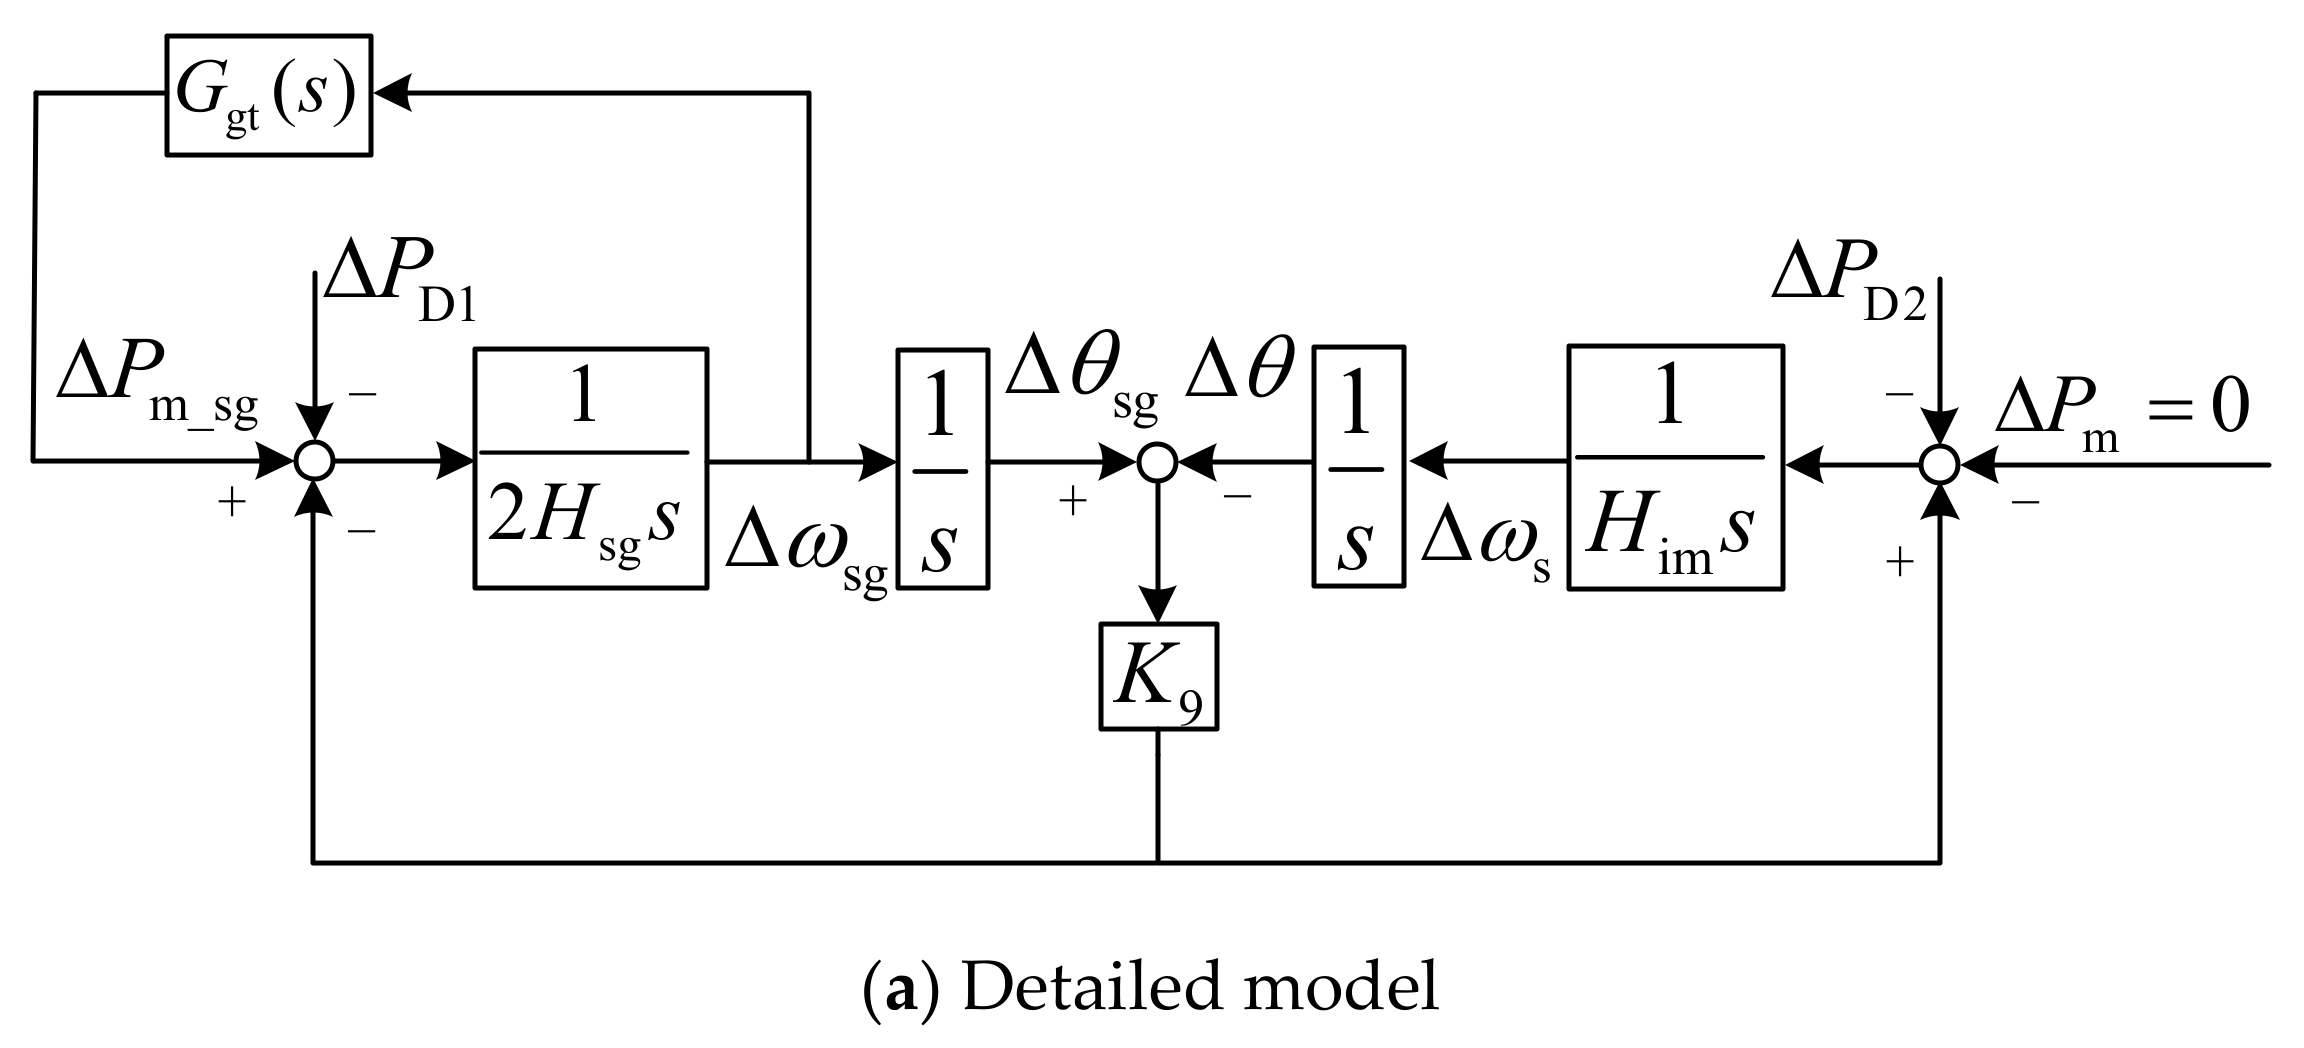
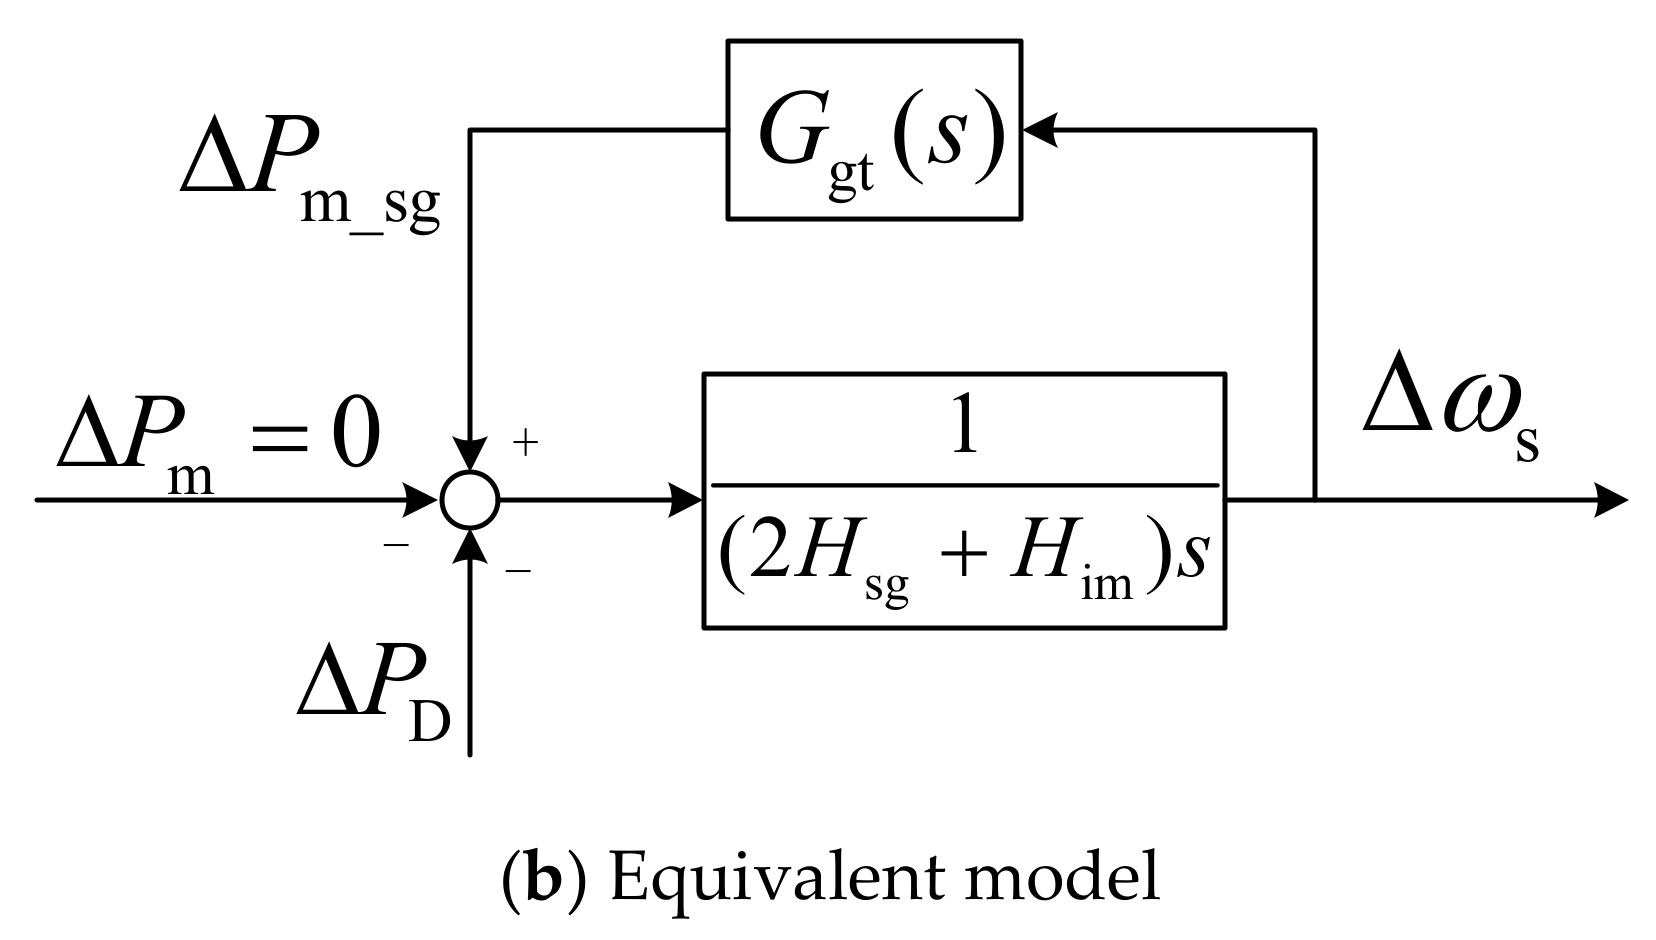
4.1. System Frequency Response Model

The system frequency response (SFR) model has been widely used in the study of frequency characteristics [18,19,20]. The phase motion equation of potential after transient reactance with equivalent inertia in the previous section is combined with the motion equation of synchronous generator to obtain the SFR model, as shown in Figure 8.
The governor Ggt(s) shown in Figure 8a is represented by the reduced steam turbine governor model in [21]. Ignore the active power loss on the line. According to Figure 8a, it can be obtained:
G gt ( s ) Δ ω sg Δ P D 1 K 9 ( Δ θ sg Δ θ ) = 2 H sg s Δ ω sg
K 9 ( Δ θ sg Δ θ ) Δ P D 2 = H im s Δ ω s
Assuming that
Δ ω s = Δ ω sg
Combining Equations (22)–(24), we obtain
G gt ( s ) Δ ω s Δ P D = ( 2 H sg + H im ) s Δ ω s
Combined with Equation (25), Figure 8a can be equivalently converted to Figure 8b. In Figure 8b, ΔPD = ΔPD1 + ΔPD2, considering the step form of load disturbance, i.e., ΔPD = Pstep/s, where Pstep is the amplitude of disturbance power. Substituting ΔPD into Equation (25), we obtain
Δ ω s = 1 G gt ( s ) ( 2 H sg + H im ) s P step s

4.2. Effect of Asynchronous Motor on System Frequency Characteristics

In this paper, the effect of the equivalent inertia of asynchronous motor on the system frequency characteristic is analyzed by three indexes of frequency characteristic: the maximum rate of change of frequency, the steady-state frequency deviation, and the maximum frequency deviation.
(1)
The maximum rate of change of frequency.
According to Equation (26), the maximum rate of change of frequency is obtained from the initial value theorem as
d Δ ω s d t | t = 0 + = lim s s L ( d Δ ω s d t ) = P step 2 H sg
From Equation (27), it can be seen that at the moment t = 0+, the maximum rate of change of frequency is only determined by the rotational inertia of synchronous generator. According to the theoretical analysis in the previous section, it is known that when the power disturbance occurs, the slip frequency responds instantaneously. At this time, the inertia support of asynchronous motor to the grid is very small, and the rotor speed does not respond instantaneously due to the constraints of rotational inertia. Therefore, the asynchronous motor does not affect the maximum system rate of change of frequency at t = 0+. Subsequently, the system frequency characteristics are determined jointly by the inertia levels of both synchronous generators and grid-connected asynchronous motors.
(2)
The steady-state frequency deviation.
According to Equation (26), the steady-state frequency deviation is given by the final value theorem as
Δ ω s | t = = lim s 0 s L ( Δ ω s ) = P step K m R + Y 2 Y 4
where Km and R are governor parameters; the specific values are given in [21].
From the detailed expressions of f(ωr), Y2, and Y4 in Appendix A, it can be seen that the effect of the equivalent inertia on the steady-state frequency deviation is determined by the mechanical load factor P0. The larger P0 is, the smaller the steady-state frequency deviation, and the more stable the system is.
(3)
The maximum frequency deviation.
The characteristics of the maximum frequency deviation are related to synchronous generator inertia, asynchronous motor inertia, and governor parameters, which are difficult to quantify from the equation. Therefore, this paper analyzes the effect of the equivalent inertia of asynchronous motor on the maximum frequency deviation through numerical calculation of Equation (26).

4.3. Theoretical Analysis

On the basis of the above section, the numerical calculation of Equation (26) by MATLAB can give the influence of the equivalent inertia of asynchronous motor on the system frequency characteristics when the load disturbance keeps increasing in the process of black-start. Figure 9 shows the system frequency characteristic with/without asynchronous motor (i.e., replaced by a static load of equal power) when the load disturbance is increasing. The synchronous generator capacity is 247.5 MW, the asynchronous motor capacity is 100 MW, and the load disturbance is 10 MW. In Figure 9, the blue line indicates the load disturbance is 8 MW. The black line indicates the load disturbance is 10 MW. The red line indicates the load disturbance is 12 MW. As can be seen in Figure 9, the effect with (solid line)/without (dashed line) asynchronous motor on the system frequency characteristics becomes increasingly more obvious as the load disturbance continues to increase.
Based on the above parameters, the influence of different operating points on the equivalent inertia of asynchronous motor can be obtained through numerical calculation, as shown in Figure 10. In Figure 10, the blue line indicates ωs = 1.000 pu. The black line indicates ωs = 0.589 pu. The red line indicates ωs = 0.208 pu. As the operating point decreases, the maximum rate of change of frequency, the maximum frequency deviation, and the steady-state frequency deviation become larger. Therefore, the equivalent inertia of asynchronous motor decreases with the decrease in operating point. The results coincide with the above conclusions.
It can be seen from the detailed expression of Him(s) that the equivalent inertia is mainly affected by rotor resistance, inertia time constant, and mechanical load coefficient except the operating point. Figure 11 shows the influence of these three parameters on the equivalent inertia of asynchronous motor. In Figure 11, the blue line indicates Rr = 1.812 pu, H = 1.5 s, and P0 = 0.5. The black line indicates Rr = 0.3624 pu, H = 1.5 s, and P0 = 0.5. The red line indicates Rr = 0.3624 pu, H = 7.5 s, and P0 = 0.5. The purple line indicates Rr = 0.3624 pu, H = 7.5 s, and P0 = 2.5. It can be seen from the figure that the maximum rate of change of frequency, the maximum frequency deviation, and the steady-state frequency deviation decrease with the decrease in rotor resistance. The maximum rate of change of frequency and the maximum frequency deviation decrease with the increase in inertia time constant. In addition, the steady-state frequency deviation decreases with the increase in mechanical load coefficient. The results also coincide with the above conclusions.
In conclusion, for the frequency stability problem, a more comprehensive analysis result can be obtained by considering the asynchronous motor load in the system.

5. Simulation Validation

In order to validate the correctness of the equivalent inertia of asynchronous motor proposed in this paper and its influence on the system frequency characteristics during black-start, the simulation system is built on the MATLAB/Simulink software platform by Figure 7. The load disturbance is put into the system at 10 s. The detailed system parameters are shown in Table 1 and Table 2.

5.1. Simulation Validation of the Equivalent Inertia of Asynchronous Motor

Figure 12 compares the theoretical frequency characteristics with equivalent inertia (blue dashed line ①), the time-domain simulation with equivalent inertia (blue solid line②), the theoretical frequency characteristics without asynchronous motors (red dashed line ③), and the time-domain simulation without asynchronous motors (red solid line ④). The synchronous generator capacity is 247.5 MW, the asynchronous motor capacity is 100 MW, and the load disturbance is 10 MW. From Figure 12, the theoretical frequency characteristics with equivalent inertia are basically consistent with the time-domain simulation results, which are different from the frequency characteristics without considering the asynchronous motor, verifying the correctness of the equivalent inertia of asynchronous motor.

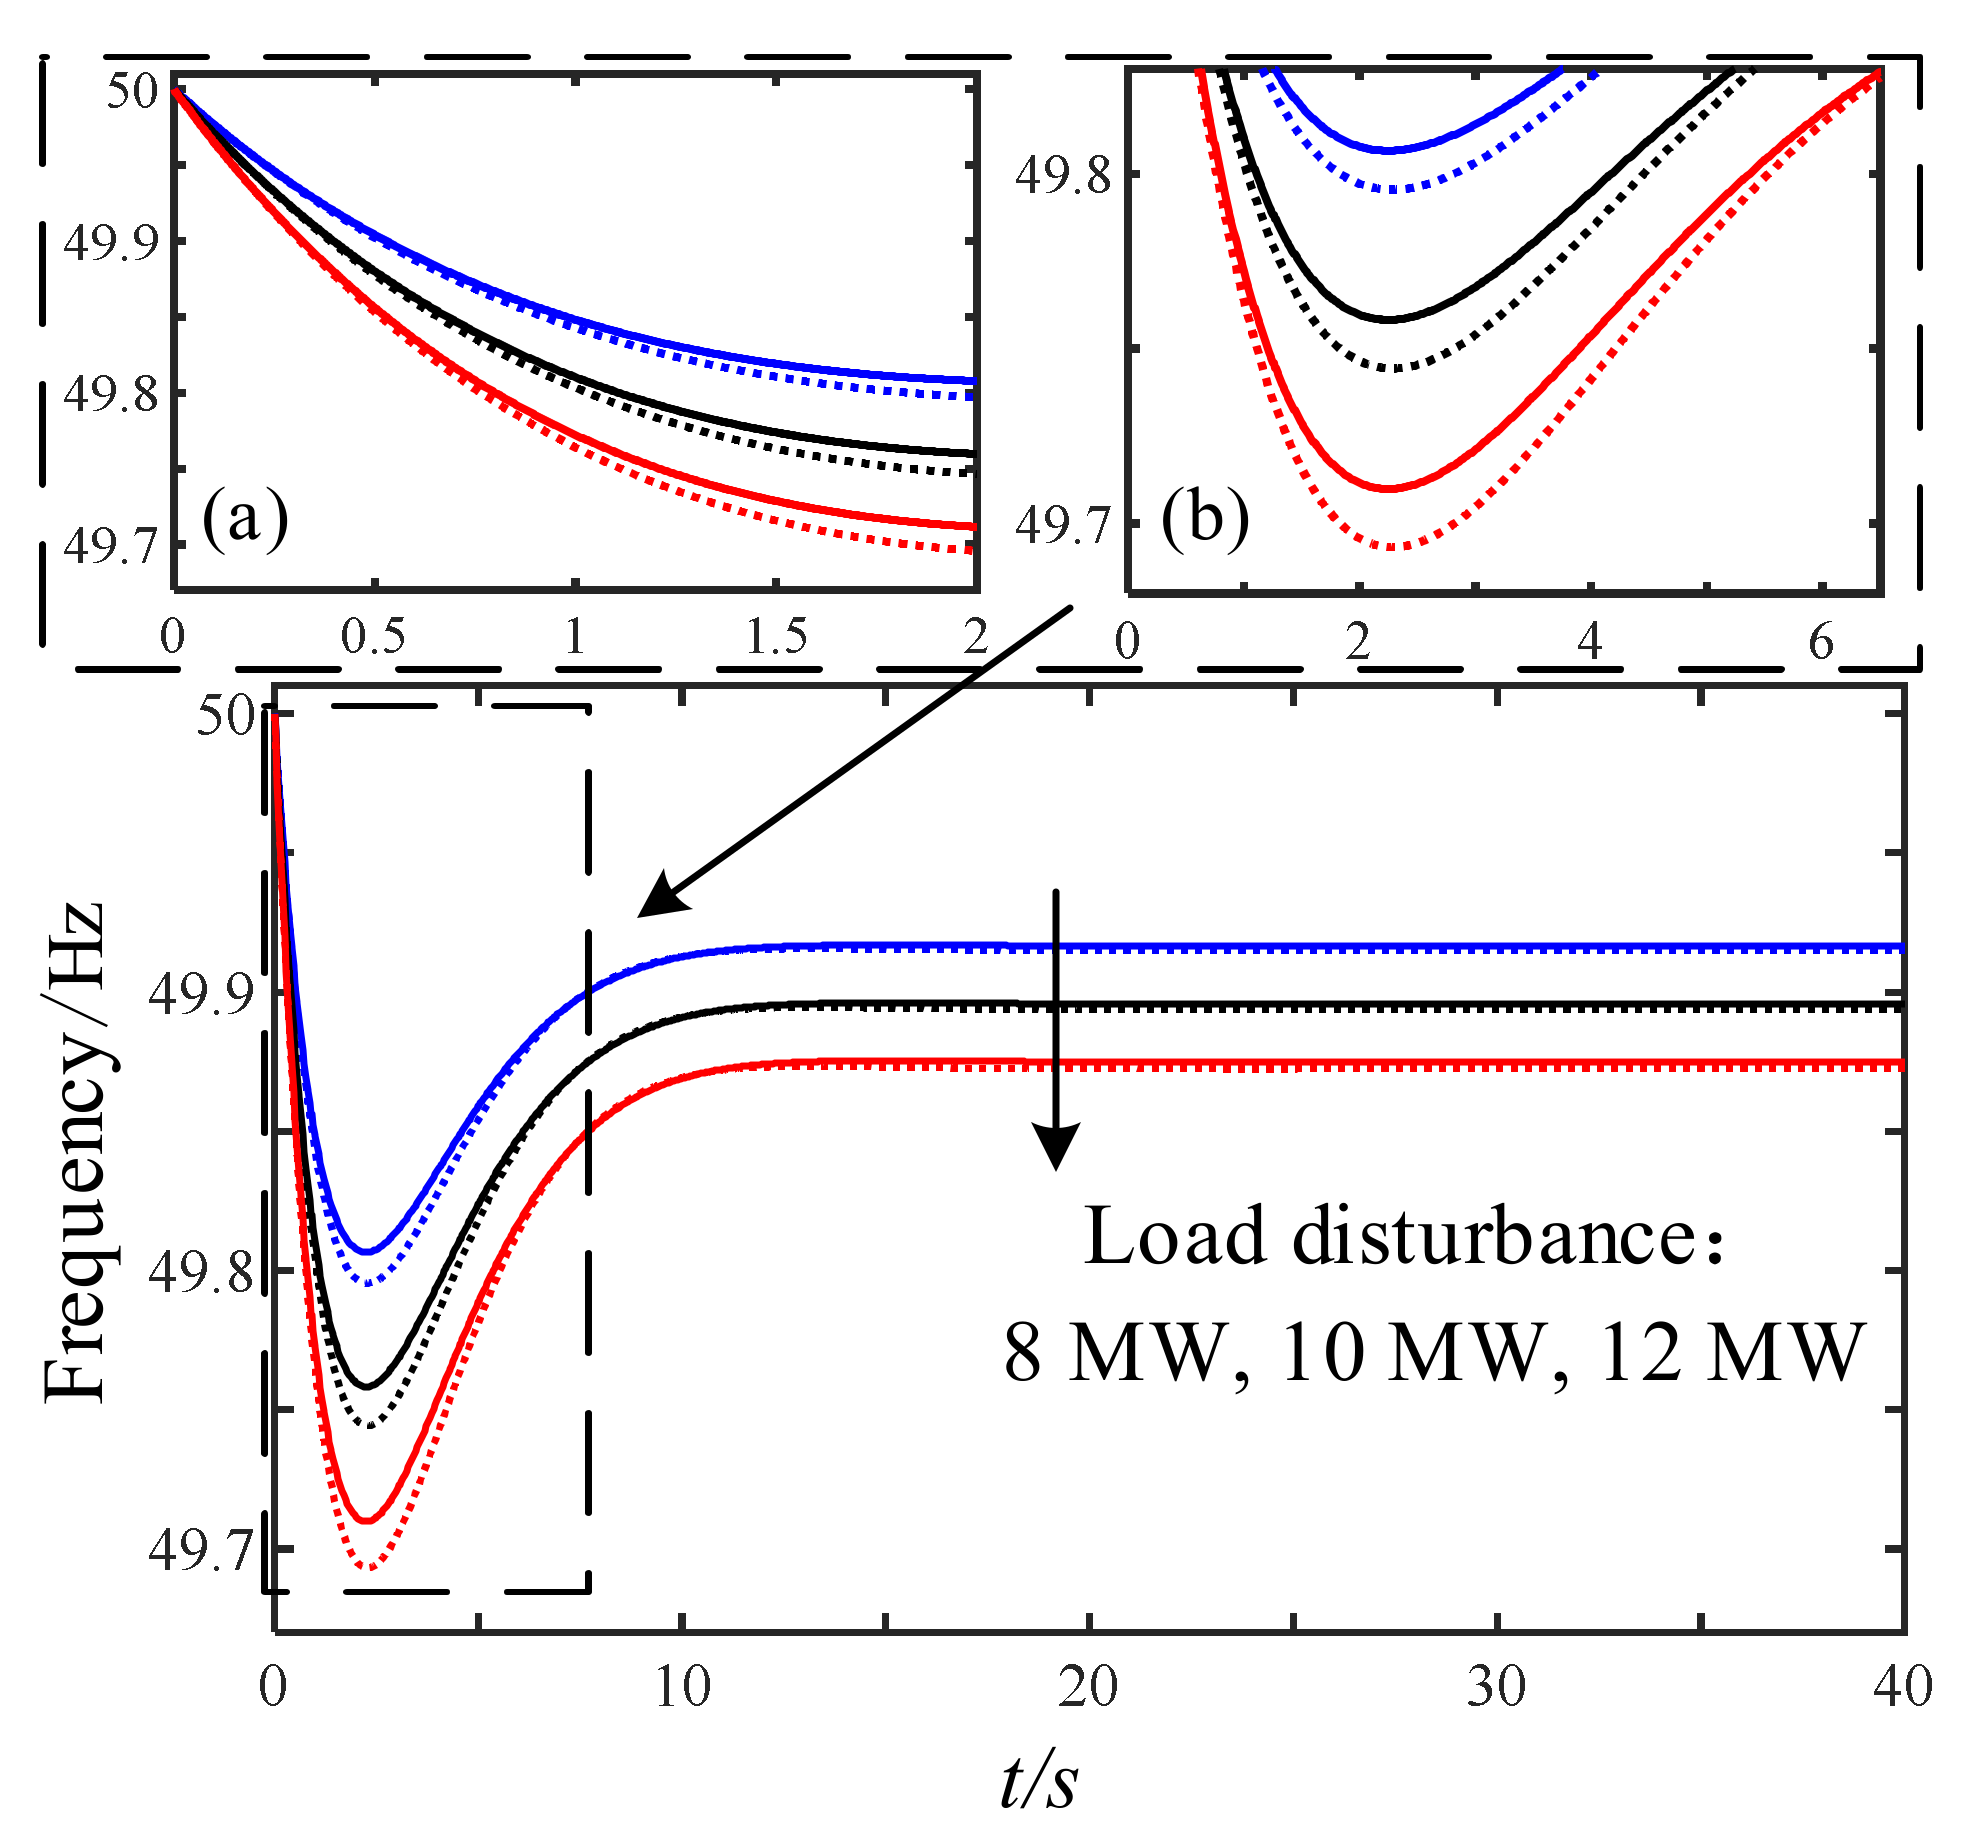
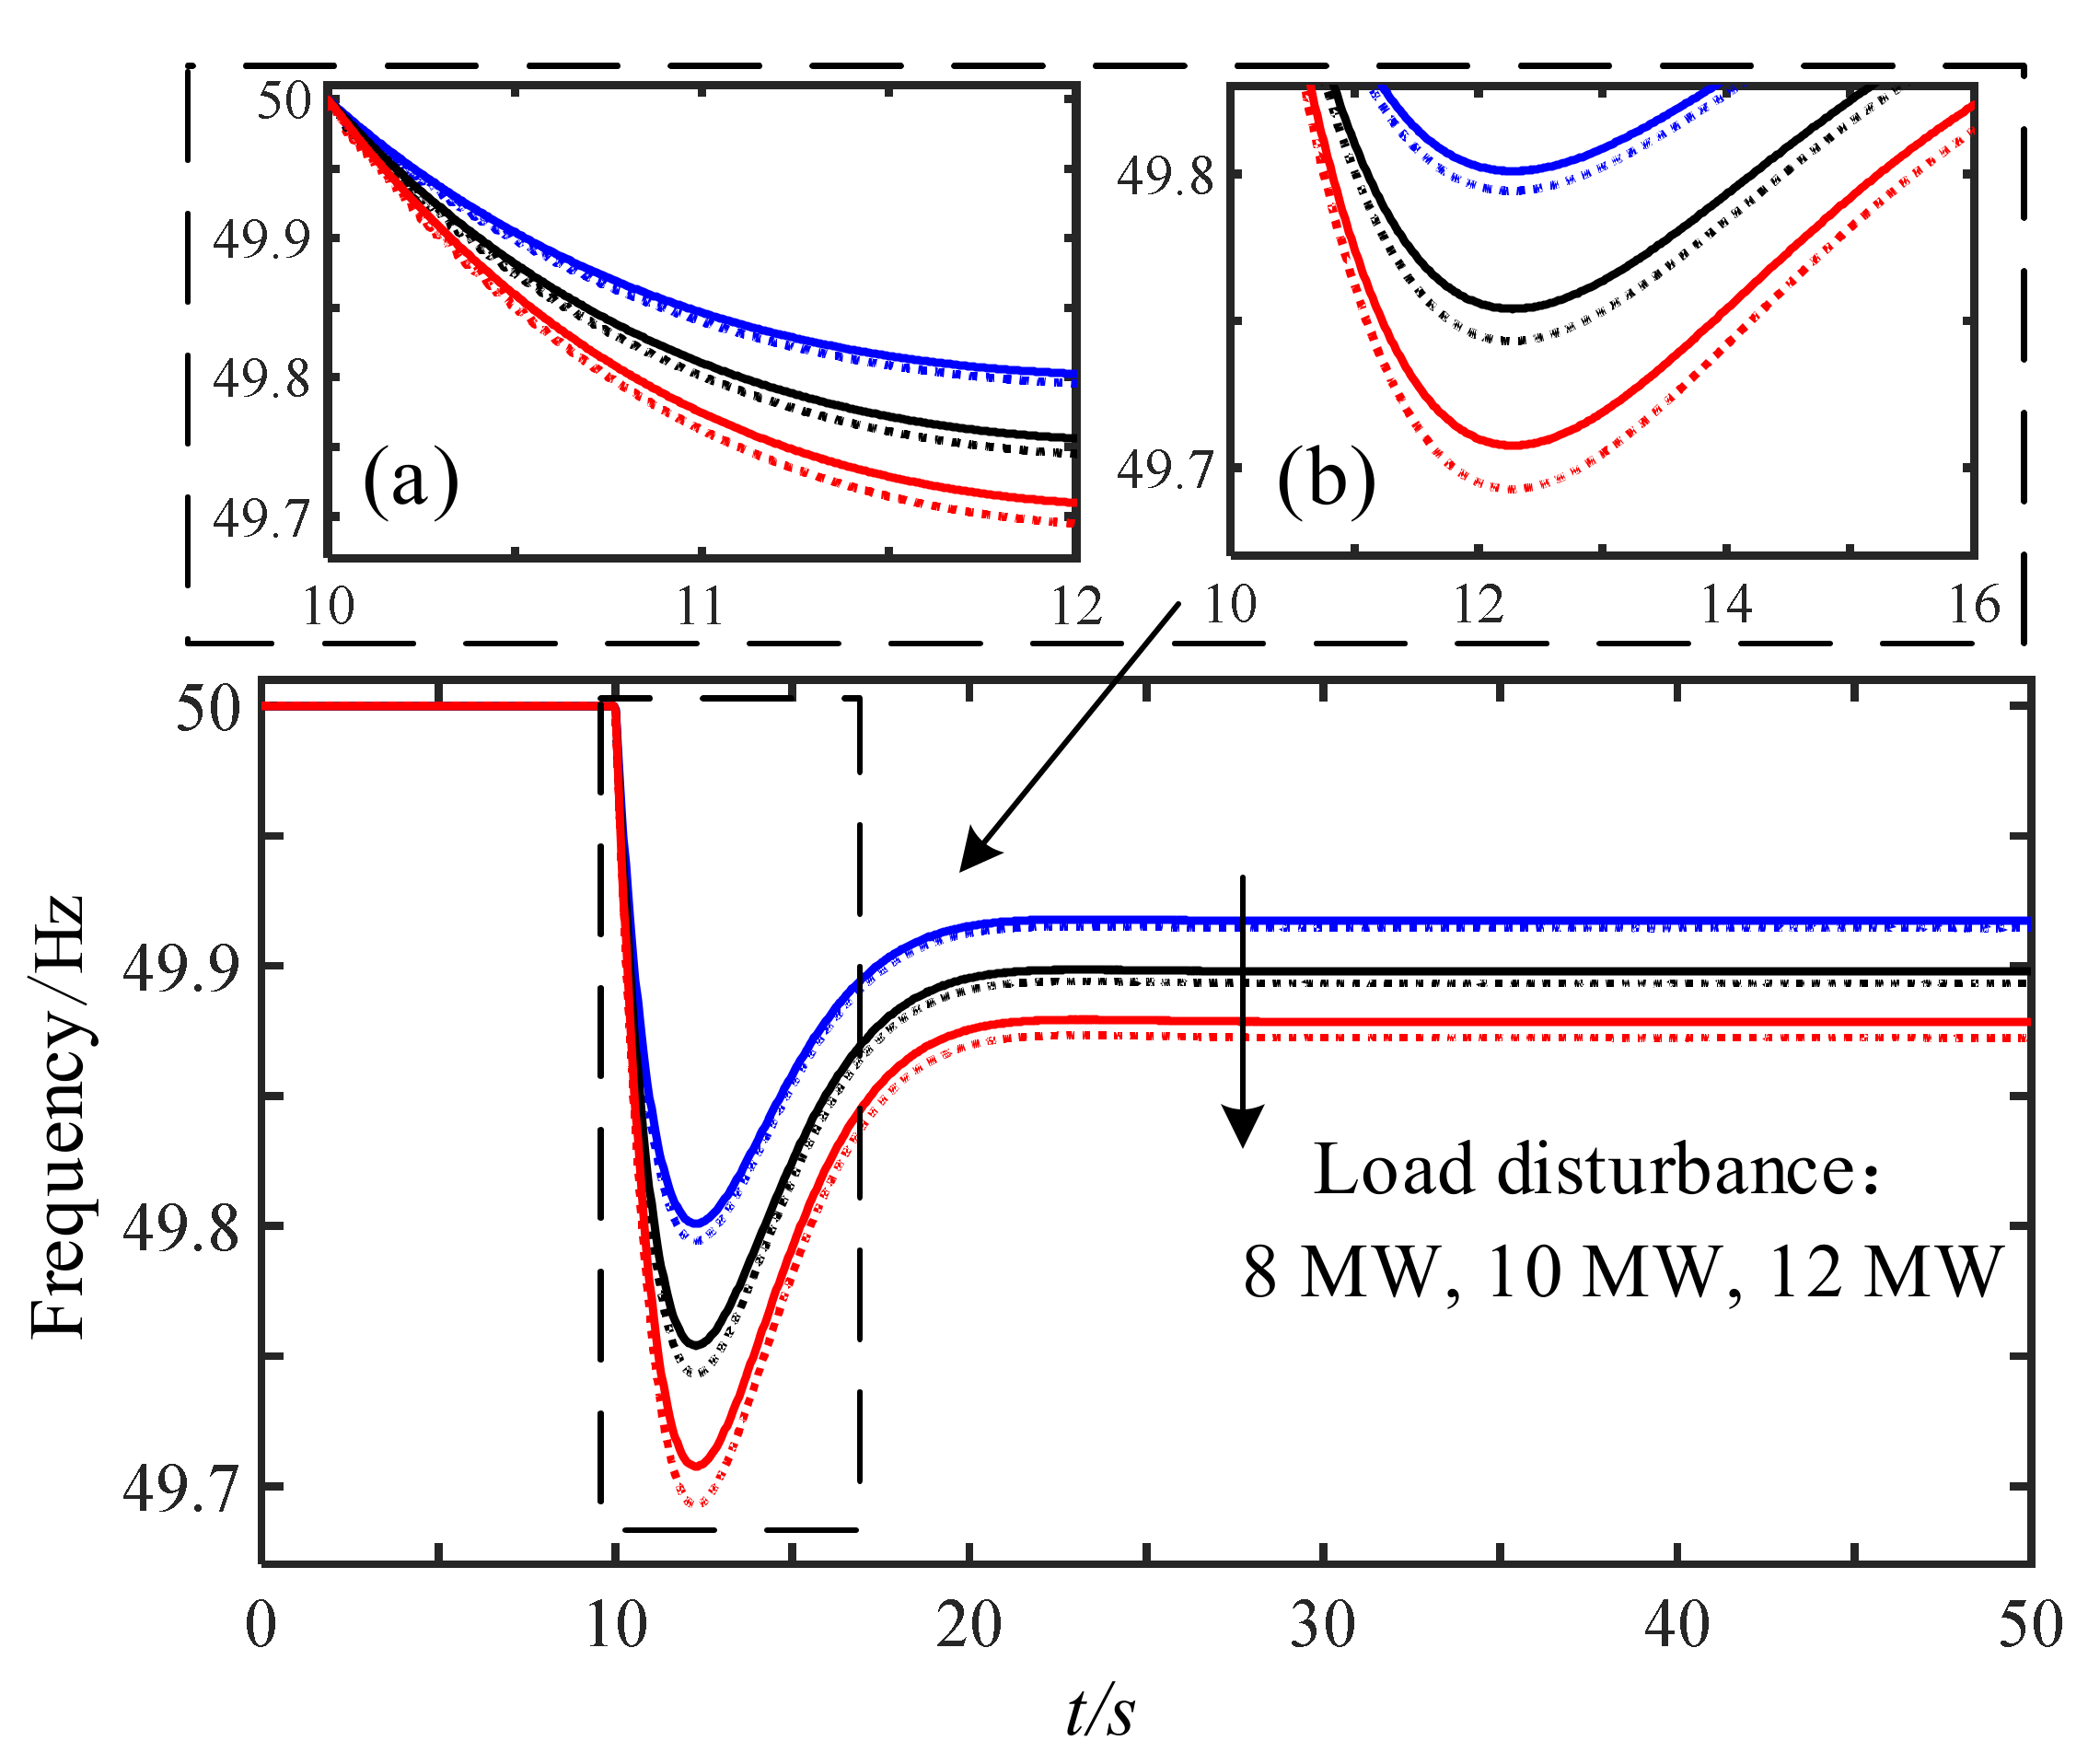
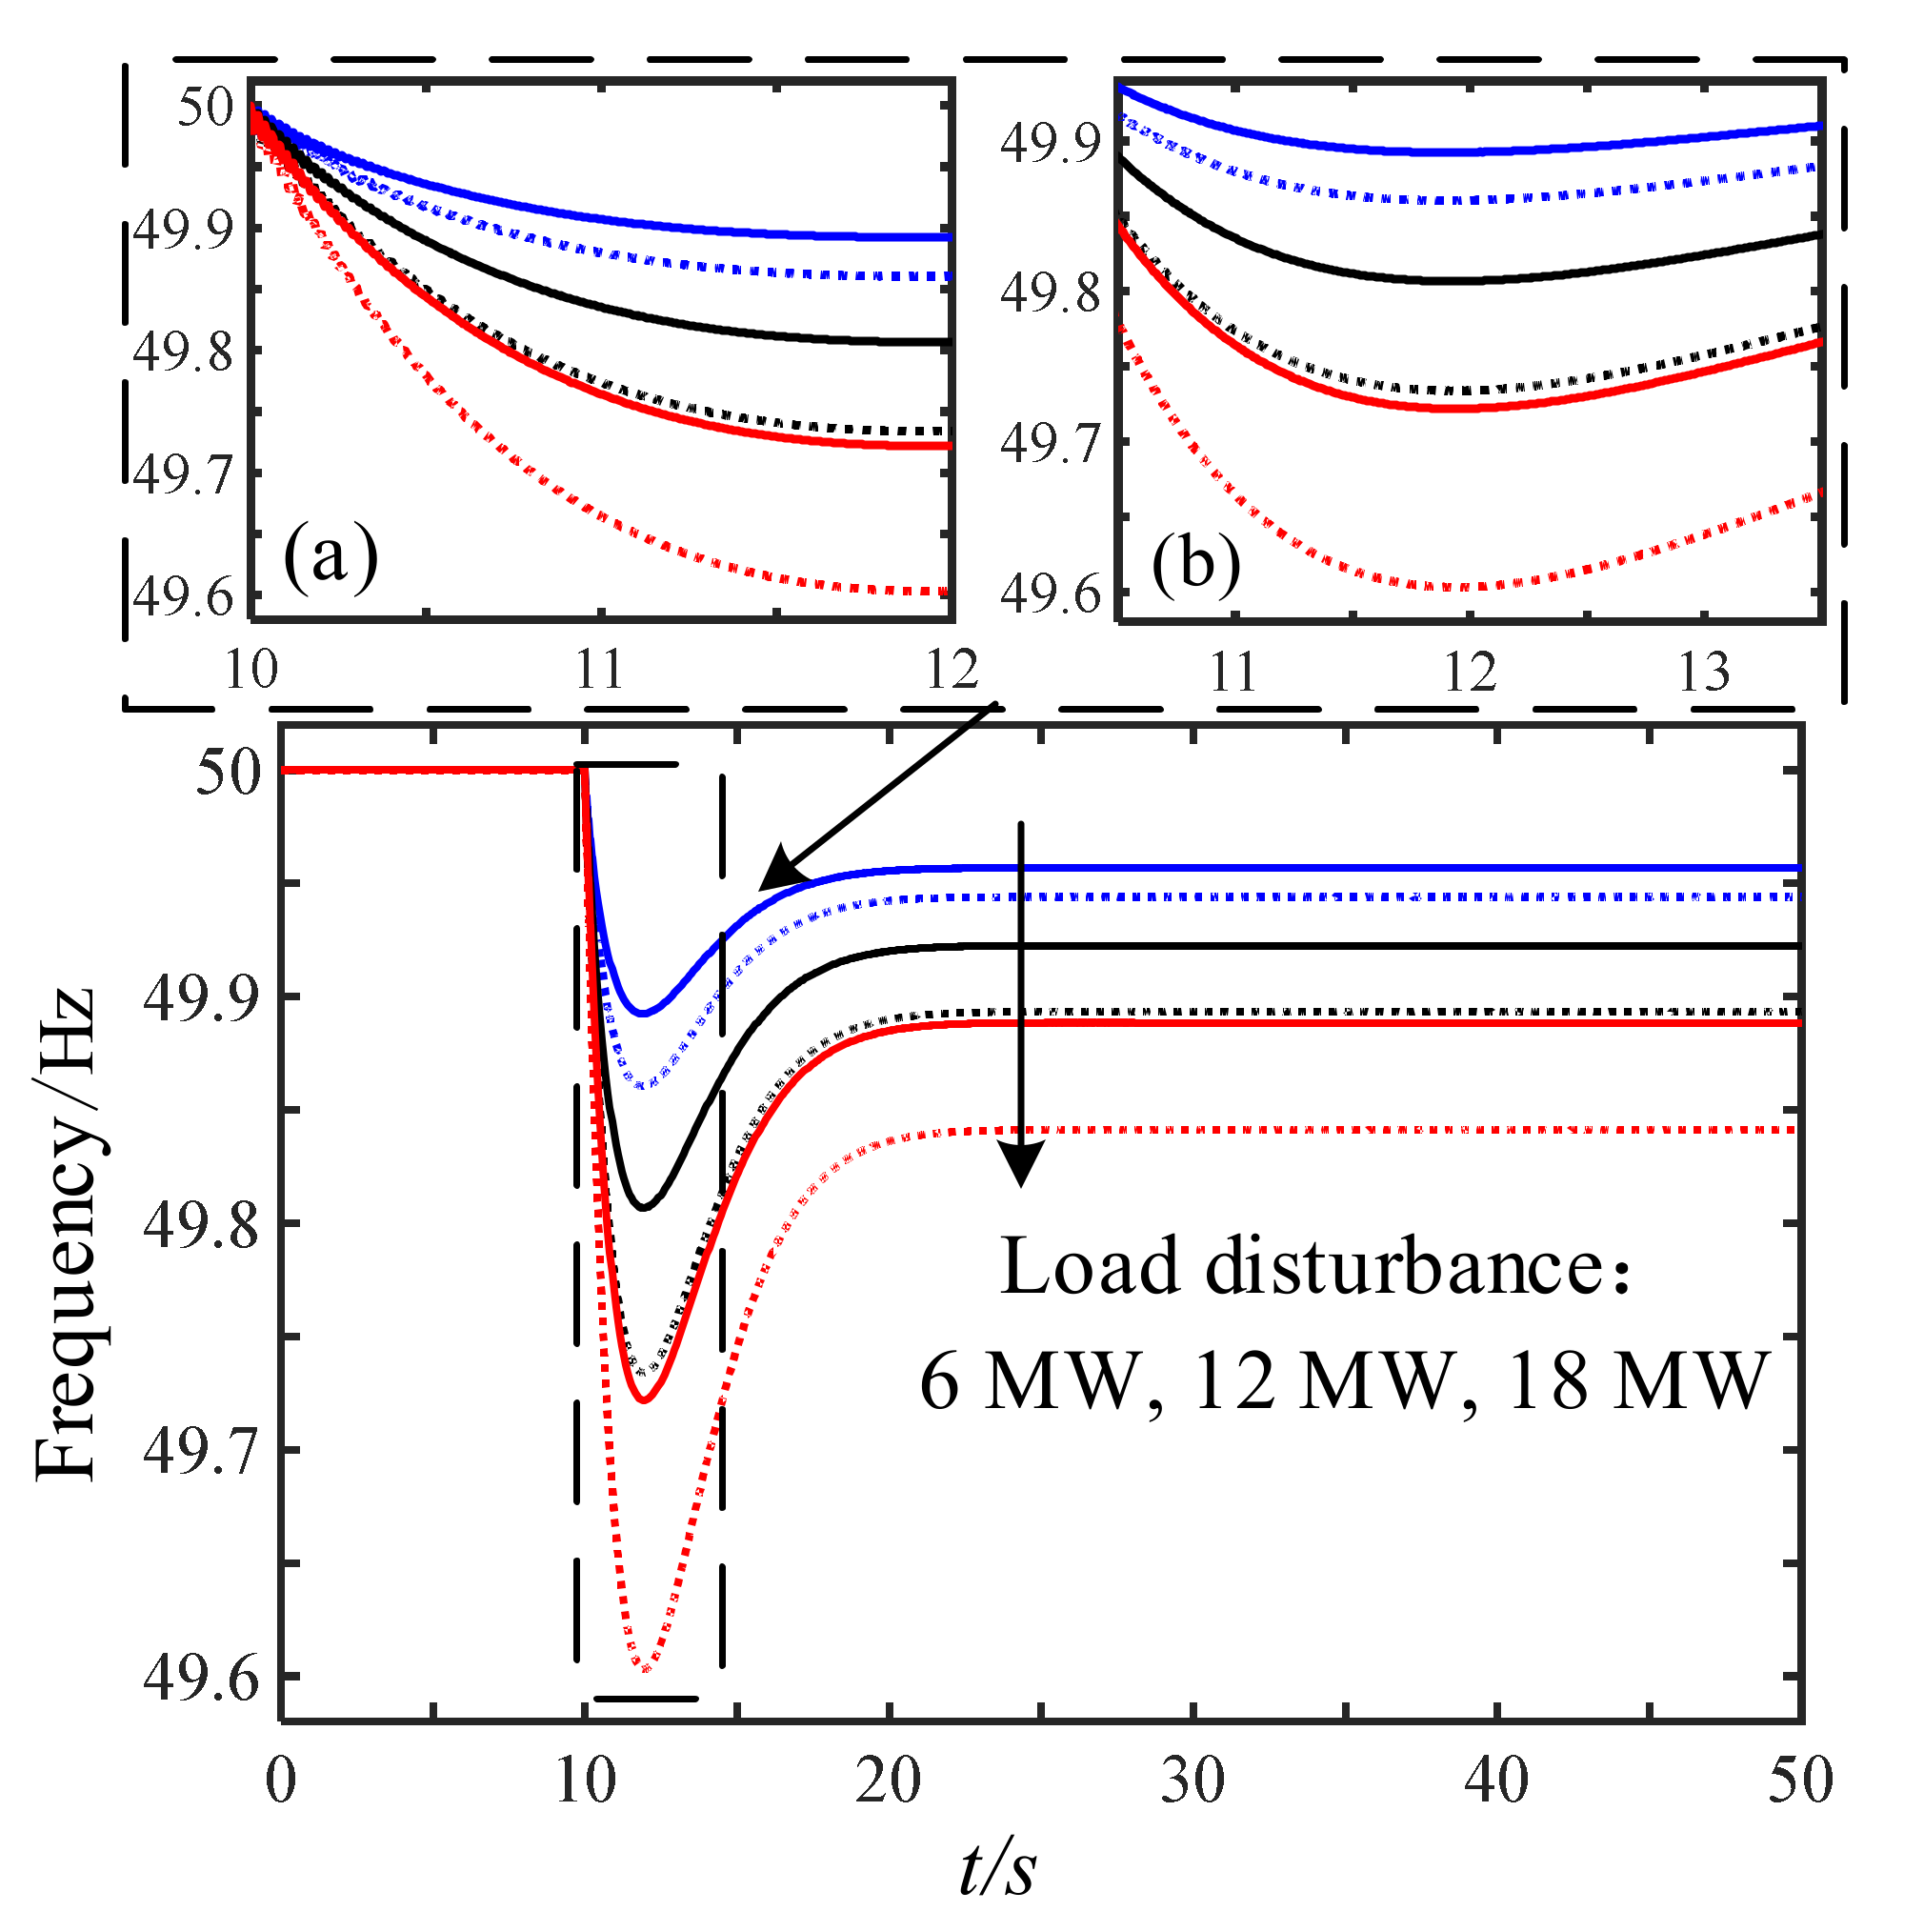
5.2. Simulation Validation of the Effect of Asynchronous Motor Equivalent Inertia on the System Frequency Characteristics during Black-Start

Figure 13 shows the time-domain simulation results of the influence with (solid line)/without (dashed line) asynchronous motors on the system frequency characteristics when the load disturbance keeps increasing. In Figure 13, the blue line indicates the load disturbance is 8 MW. The black line indicates the load disturbance is 10 MW. The red line indicates the load disturbance is 12 MW. Figure 13a shows the local amplification of the maximum rate of change of frequency after the disturbance occurs, and Figure 13b shows the local amplification of the maximum frequency deviation after the disturbance occurs. It can be seen from Figure 13a that the maximum rate of change of frequency is small when the equivalent inertia of asynchronous motor is considered. As can be seen in Figure 13b, the maximum frequency deviation becomes smaller when considering the equivalent inertia of asynchronous motor, and the effect with/without asynchronous motor on the maximum frequency deviation becomes increasingly more obvious as the load disturbance increases. The simulation results coincide with the theoretical analysis.
Figure 14 shows the time-domain simulation results of the effect with (blue line①)/without (red line ②) asynchronous motor on the system frequency characteristics in the process of continuous load put-in and cut-out. The first load put-in is 8 MW at 10 s, the second load put-in is 2 MW at 25 s, the third load put-in is 2 MW at 40 s, the first load cut-out is 2 MW at 55 s, and the second load cut-out is 2 MW at 70 s. From the figure, it can be seen that the influence with/without asynchronous motor on the system frequency characteristics becomes increasingly more obvious as the load put-in increases. As the load cut-out increases, the supporting effect with/without asynchronous motor on the system frequency is gradually reduced. The simulation results coincide with the theoretical analysis.

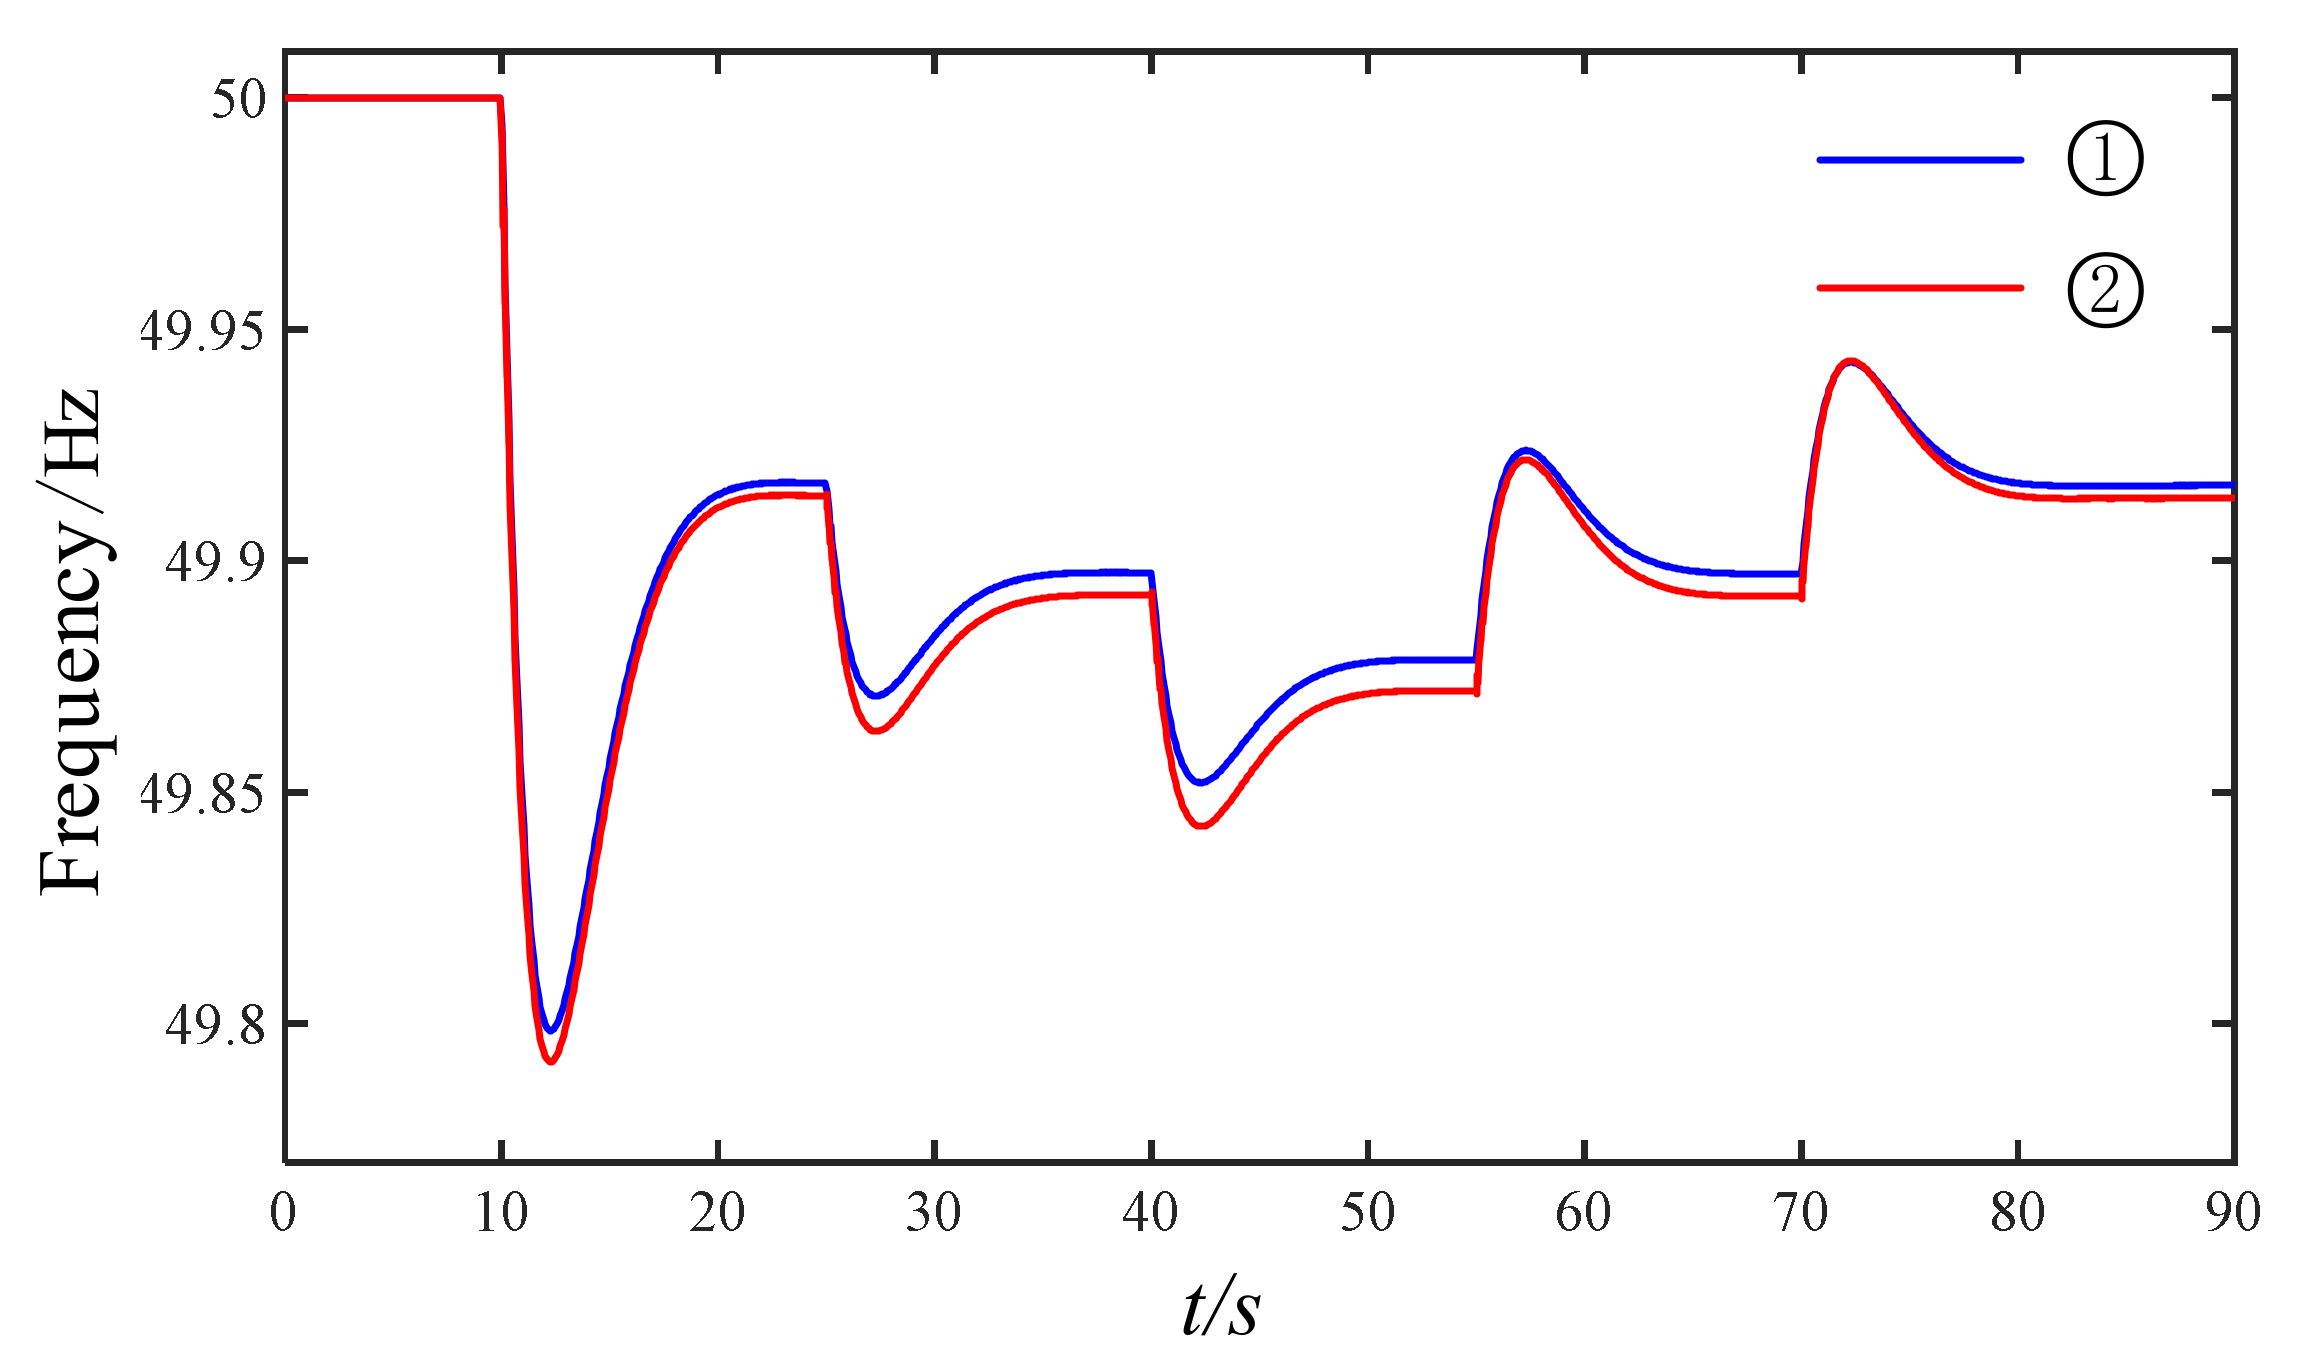
5.3. Simulation Validation of the Effect of Asynchronous Motor Equivalent Inertia on the System Frequency Characteristics when Wind Power Is Considered

When the black-start process reaches steady state, consider the parallel operation of non-inertia wind power and synchronous generator. The total system capacity is 247.5 MW, which remains unchanged, and the proportion of non-inertia wind power is 20% (i.e., wind power capacity is 49.5 MW and the synchronous generator capacity is 198 MW).
Figure 15 shows the time-domain simulation results of the influence with (solid line)/without (dashed line) asynchronous motors on the system frequency characteristics with the increasing load disturbance when wind power is considered. In Figure 15, the blue line indicates the load disturbance is 6 MW. The black line indicates the load disturbance is 12 MW. The red line indicates the load disturbance is 18 MW. Figure 15a shows the local amplification of the maximum rate of change of frequency after the disturbance occurs, and Figure 15b shows the local amplification of the maximum frequency deviation after the disturbance occurs. It can be seen from Figure 15a,b that as the load disturbance increases, the influence of the equivalent inertia with/without asynchronous motor on the maximum rate of change of frequency and the maximum frequency deviation becomes increasingly more obvious. The simulation results also coincide with the theoretical analysis.

6. Conclusions

In this paper, based on the three-order model of asynchronous motor, the amplitude–phase motion equation based on potential after transient reactance is proposed. On this basis, the phase motion equation of potential after transient reactance is derived, and then the equivalent inertia of asynchronous motor in electromechanical time scale is estimated. Secondly, the effect of different parameter settings on the equivalent inertia of asynchronous motor is analyzed. Finally, the effect of asynchronous motor equivalent inertia on the system frequency characteristics is investigated when the load disturbance is increasing. The following conclusions are obtained.
(1)
Different from the inertia time constant, the effect of asynchronous motor equivalent inertia on the system frequency characteristics is time-varying due to the joint action of rotor speed and slip frequency.
(2)
In addition to the operating point, the effect of asynchronous motor equivalent inertia on the maximum rate of change of frequency and the maximum frequency deviation are determined by the rotor resistance and the inertial time constant. Smaller rotor resistance and larger inertial time constant can reduce the maximum rate of change of frequency and the maximum frequency deviation. In addition, the larger the mechanical load coefficient, the better the steady-state frequency deviation.
(3)
For the frequency stability problem, this paper illustrates that the equivalent inertia of asynchronous motors can essentially improve the system frequency characteristics, and clearly points out the error direction when the equivalent inertia of asynchronous motors is ignored, so that the load inertia of asynchronous motors can be considered in frequency stability analysis to obtain more realistic results.
Different from the existing asynchronous motor inertia evaluation methods, the proposed method provides a new and more comprehensive approach. The equivalent inertia of asynchronous motor can be directly applied to the frequency stability analysis of multi-machine systems, which can reflect the system frequency characteristics more accurately.
There are many neglected factors in the derivation process for the proposed method, which may lead to a large deviation between theoretical calculation and simulation verification results in the study of complex systems. Future research will consider further improving the accuracy of the method and exploring the possibility of applying the method in related fields.

Author Contributions

X.Z. and P.Q. conceived the research. P.Q. participated in the analysis of the data and in writing the initial manuscript. X.Z. and Z.T. revised the manuscript and adjusted the data presentation. All authors have read and agreed to the published version of the manuscript.

Funding

This work is supported by the Science and Technology Project of State Grid Shanxi Electric Power Corporation (No. 20201102028) and Shanxi Science and Technology Program (No. 520530200006).

Data Availability Statement

The data presented in this study are available in this article.

Conflicts of Interest

The authors declare no conflict of interest.

Appendix A

Denote:
K 1 = 2 R r L m 2 ω base ω s 0 Q e 0 L r 2 u 0 2 s 2 R r L r ω base u 0 2 4 L r 2 u 0 ω s 0 Q e 0 ( 1 + ω base s slip 0 )
K 2 = u 0 2 Q e 0
K 3 = u 0 2 ω s 0
K 4 = L r s + 2 R r ω base 2 L r ω base ω s 0 Q e 0
K 5 = 1 + ω base s slip 0 ω base Q e 0
K 6 = 1 + ω base s slip 0 ω base ω s 0
Y 1 = 2 H L r 2 u 0 2 ( 1 s slip 0 )
Y 2 = L r 2 u 0 2 ( 1 s slip 0 ) f ( ω r 0 )
Y 3 = 2 H R r L m 2 ω s 0
Y 4 = R r L m 2 ω s 0 f ( ω r 0 ) + L r 2 u 0 2
f ( ω r ) = P 0 ω r 2

References

  1. Kayikci, M.; Milanovic, J.V. Dynamic Contribution of DFIG-Based Wind Plants to System Frequency Disturbances. IEEE Trans. Power Syst. 2009, 24, 859–867. [Google Scholar] [CrossRef]
  2. Ekanayake, J.; Jenkins, N. Comparison of the response of doubly fed and fixed-speed induction generator wind turbines to changes in network frequency. IEEE Trans. Energy Convers. 2018, 19, 800–802. [Google Scholar] [CrossRef]
  3. Delille, G.; Francois, B.; Malarange, G. Dynamic Frequency Control Support by Energy Storage to Reduce the Impact of Wind and Solar Generation on Isolated Power System’s Inertia. IEEE Trans. Sustain. Energy 2012, 3, 931–939. [Google Scholar] [CrossRef]
  4. Tielens, P.; Van Hertem, D. The relevance of inertia in power systems. Renew. Sustain. Energy Rev. 2016, 55, 999–1009. [Google Scholar] [CrossRef]
  5. Dreidy, M.; Mokhlis, H.; Mekhilef, S. Inertia response and frequency control techniques for renewable energy sources: A review. Renew. Sustain. Energy Rev. 2017, 69, 144–155. [Google Scholar] [CrossRef]
  6. Heylen, E.; Teng, F.; Strbac, G. Challenges and opportunities of inertia estimation and forecasting in low-inertia power systems. Renew. Sustain. Energy Rev. 2021, 147, 111176. [Google Scholar] [CrossRef]
  7. Wang, B.; Sun, H.; Li, W.; Yang, C.; Wei, W.; Zhao, B.; Xu, S. Power system inertia estimation method based on maximum frequency deviation. IET Renew. Power Gener. 2022, 16, 622–633. [Google Scholar] [CrossRef]
  8. Morren, J.; Pierik, J.; De Haan, S.W.H. Inertial response of variable speed wind turbines. Electr. Power Syst. Res. 2006, 76, 980–987. [Google Scholar] [CrossRef]
  9. Keung, P.K.; Li, P.; Banakar, H.; Ooi, B.T. Kinetic energy of wind-turbine generators for system frequency support. IEEE Trans. Power Syst. 2008, 24, 279–287. [Google Scholar] [CrossRef]
  10. Kundur, P.; Balu, N.J.; Lauby, M.G. Power System Stability and Control; McGraw-Hill: New York, NY, USA, 1994. [Google Scholar]
  11. Pradhan, C.; Bhende, C.N. Frequency sensitivity analysis of load damping coefficient in wind farm-integrated power system. IEEE Trans. Power Syst. 2016, 32, 1016–1029. [Google Scholar]
  12. Chen, L.; Wang, X.; Min, Y.; Li, G.; Wang, L.; Qi, J.; Xu, F. Modelling and investigating the impact of asynchronous inertia of induction motor on power system frequency response. Int. J. Electr. Power Energy Syst. 2020, 117, 105708. [Google Scholar] [CrossRef]
  13. Inoue, T.; Taniguchi, H.; Ikeguchi, Y.; Yoshida, K. Estimation of power system inertia constant and capacity of spinning-reserve support generators using measured frequency transients. IEEE Trans. Power Syst. 1997, 12, 136–143. [Google Scholar] [CrossRef]
  14. Tavakoli, M.R.B.; Power, M.; Ruttledge, L.; Flynn, D. Load inertia estimation using white and grey-box estimators for power systems with high wind penetration. IFAC Proc. Vol. 2012, 45, 399–404. [Google Scholar] [CrossRef]
  15. Wang, D.; Yuan, X.; Shen, Y.; Cui, T.; Hu, Z.; Cao, W.; Li, L. Available Inertia Estimation of Induction Machine and Its Effect on Frequency Response of Power Systems with Wind Penetration. In Proceedings of the 2019 IEEE Innovative Smart Grid Technologies-Asia (ISGT Asia), Chengdu, China, 21–24 May 2019; pp. 1783–1787. [Google Scholar]
  16. Nomikos, B.M.; Vournas, C.D. Investigation of induction machine contribution to power system oscillations. IEEE Trans. Power Syst. 2005, 20, 916–925. [Google Scholar] [CrossRef]
  17. Van Cutsem, T.; Vournas, C. Voltage Stability of Electric Power Systems; Springer Science & Business Media: Amsterdam, The Netherlands, 2007. [Google Scholar]
  18. Sigrist, L.; Rouco, L. An induction motor model for system frequency response models. Int. Trans. Electr. Energy Syst. 2017, 27, e2413. [Google Scholar] [CrossRef]
  19. Aik, D.L.H. A general-order system frequency response model incorporating load shedding: Analytic modeling and applications. IEEE Trans. Power Syst. 2006, 21, 709–717. [Google Scholar] [CrossRef]
  20. Hu, J.; Sun, L.; Yuan, X.; Wang, S.; Chi, Y. Modeling of type 3 wind turbines with df/dt inertia control for system frequency response study. IEEE Trans. Power Syst. 2016, 32, 2799–2809. [Google Scholar] [CrossRef]
  21. Anderson, P.M.; Mirheydar, M. A low-order system frequency response model. IEEE Trans. Power Syst. 1990, 5, 720–729. [Google Scholar] [CrossRef] [Green Version]
Figure 1. (a) Asynchronous motor initial circuit. (b) Asynchronous motor equivalent circuit.
Energies 15 08350 g001
Figure 2. Single-machine infinite system structure.
Energies 15 08350 g002
Figure 3. Amplitude–phase motion equation based on potential after transient reactance.
Energies 15 08350 g003
Figure 4. Small-signal block diagram of the phase motion equation of potential after transient reactance based on inertial time constant.
Energies 15 08350 g004
Figure 5. Phase motion equation of potential after transient reactance with equivalent inertia.
Energies 15 08350 g005
Figure 6. Amplitude–frequency characteristic of asynchronous motor equivalent inertia with varied operating point.
Energies 15 08350 g006
Figure 7. System structure of the grid-connected asynchronous motor.
Energies 15 08350 g007
Figure 8. SFR model.
Energies 15 08350 g008aEnergies 15 08350 g008b
Figure 9. System frequency characteristic with/without asynchronous motor when the load disturbance is increasing. (a) The maximum rate of change of frequency; (b) The maximum frequency deviation.
Energies 15 08350 g009
Figure 10. The influence of different operating points on the equivalent inertia of asynchronous motor.
Energies 15 08350 g010
Figure 11. The influence of three parameters on the equivalent inertia of asynchronous motor. (a) The maximum rate of change of frequency; (b) The steady-state frequency deviation.
Energies 15 08350 g011
Figure 12. Comparison of system frequency characteristics between time-domain simulation and theoretical results.
Energies 15 08350 g012
Figure 13. The influence with (solid line)/without (dashed line) asynchronous motors on the system frequency characteristics when the load disturbance keeps increasing. (a) The maximum rate of change of frequency; (b) The maximum frequency deviation.
Energies 15 08350 g013
Figure 14. The effect with (blue line ①)/without (red line ②) asynchronous motor on the system frequency characteristics in the process of continuous load put-in and cut-out.
Energies 15 08350 g014
Figure 15. The influence with (solid line)/without (dashed line) asynchronous motors on the system frequency characteristics with increasing load disturbance when wind power is considered. (a) The maximum rate of change of frequency; (b) The maximum frequency deviation.
Energies 15 08350 g015
Table 1. Asynchronous motor specific parameters.
ParameterValueParameterValue
Pn/MVA100Lg/H1.36
Vn/kV16.5Rr4.929
Lr/H0.1139H/s1.5
Lm/H0.1098P00.5
Table 2. Synchronous generator specific parameters.
ParameterValueParameterValue
Pn/MVA247.5X1/pu0.15
Vn/kV16.5Td0′/pu8.0
Xd/pu1.81Td0′/pu0.03
Xd′/pu0.3Tq0′/pu1.0
Xd′′/pu0.23Tq0′/pu0.07
Xq/pu1.76Rs/pu0.0379
Xq′/pu0.65H/s3.33
Xq′′/pu0.25p20
Publisher’s Note: MDPI stays neutral with regard to jurisdictional claims in published maps and institutional affiliations.

