Article

Effects of Different Heat Transfer Conditions on the Hydrogen Desorption Performance of a Metal Hydride Hydrogen Storage Tank

School of Mechatronic Engineering and Automation, Foshan University, Foshan 528225, China
*
Author to whom correspondence should be addressed.
Energies 2022, 15(22), 8375; https://doi.org/10.3390/en15228375
Submission received: 20 October 2022 / Revised: 4 November 2022 / Accepted: 7 November 2022 / Published: 9 November 2022
(This article belongs to the Section A5: Hydrogen Energy)

Abstract

:
To investigate the influence of thermal effects on the hydrogen desorption performance of the metal hydride hydrogen storage system, a two-dimensional numerical model was established based on a small metal hydride hydrogen storage tank, and its accuracy was verified by the temperature variations in the reaction zone of the hydrogen storage tank during hydrogen desorption. In addition, the influence of the heat transfer medium on the heat and mass transfer performance of the hydrogen desorption reaction was analyzed. An external heat transfer bath was added to simulate the thermal effect of the model during the hydrogen desorption reaction. The temperature and type of heat transfer medium in the heat transfer bath were modified, and the temperature and reaction fraction variations in each zone of the hydrogen storage model were analyzed. The results showed that under heat transfer water flow, the reaction rate in the center region of the hydrogen storage tank was gradually lower than that in the wall region. The higher the temperature of water flow, the shorter the total time required for the hydrogen desorption reaction and the shortening amplitude is reduced. The variations in the temperature and hydrogen storage capacity during hydrogen desorption were similar, with water and oil as the heat transfer medium, under the same flow rate and heat transfer temperature, however, the heat transfer time and hydrogen desorption time of water were about 10% and 5% shorter than that of oil, respectively. When the air was used as the heat transfer medium, the heat transfer rate of the air convection in the channel was lower than the heat transfer rate of the tank wall, reducing the temperature difference between the air and alloy on both sides of the wall, decreasing heat transfer efficiency, and significantly prolonging the time required for hydrogen desorption.

1. Introduction

Energy is one of the most crucial material bases for human progress and development. With the emission of greenhouse gases and the depletion of fossil fuels, hydrogen energy is considered an alternative fuel to traditional hydrocarbon fuels because of its non-pollution, renewability, and high combustion calorific value. In addition to the production and application of hydrogen, its storage is a barrier that must be overcome for large-scale applications [1]. Hydrogen storage technologies mainly include high-pressure hydrogen storage, liquefied hydrogen storage, nanomaterial adsorption-based hydrogen storage, and hydrogen storage in alloys containing metal hydrides. Among them, metal hydride hydrogen storage has higher safety, hydrogen storage density, and hydrogen purity [2,3,4]. Nevertheless, the thermal conductivity of the hydrogen storage alloy powder is low, and the heat transfer during the hydrogen desorption reaction is slow, resulting in a decrease in the hydrogen desorption reaction rate in the reactor. Heat and mass transfer occur in the reactor due to the interaction of multiple physical fields, and heat transfer enhancement is critical during hydrogen storage [5]. Many scholars have conducted extensive simulation work on the heat transfer characteristics in the metal hydride reactor during hydrogen absorption/desorption.
Metal hydride dehydrogenation is a highly endothermic reaction in which thermal management is critical for the safety and structural optimization of metal hydride hydrogen tanks [6,7]. Many studies show that the heat dissipation efficiency of hydrogen tanks affects the hydrogen absorption efficiency of metal hydrides [8,9,10,11]. Therefore, the hydrogen absorption efficiency can be improved by increasing the heat transfer area of the alloy hydrogen tank. Nam et al. [8] simulated the hydrogen absorption reaction of reactors with the same volume but different geometric structures by establishing a three-dimensional mathematical model of hydrogen absorption by LaNi5 alloy, revealing that the ratio of the external surface area to the volume of the container was one of the important factors determining the hydrogen absorption efficiency. Chippar et al. [9] proposed an alloy reactor with multiple compartmentalized reaction zones stacked. Through numerical simulation, they discovered that the compartmentalized hydrogen absorption reactor could increase the contact surface between the alloy and the heat transfer zone, make the temperature distribution in the reaction zone more uniform, and effectively improve the hydrogen absorption efficiency of the reactor. Yun et al. [10] proposed a vertically placed, axisymmetric hydrogen storage tank which could be reduced to a two-dimensional hydrogen storage model for simulation. Wang [11] et al. developed a radiation mini-channel reactor (RMCR) model on the radial section of the reactor based on the natural structure of the tree trunk, optimized the arrangement of heat transfer channels in the radial direction of the reactor, and proposed a radiation mini-channel reactor with jacket (RMCR-J). The results showed that RMCR-J could reduce the heat transfer distance of the MH bed even further and eliminate the adverse heat transfer zones at the outer edge of the RMCR.
The existing research mainly focuses on the structural optimization of the reactor and the performance of the hydrogen storage alloy, but relatively little attention has been paid to its dehydrogenation process, and few studies have investigated the influence of the heat transfer medium of the hydrogen storage reactor. Agostini et al. [12] have demonstrated that under the framework of the SSH2S project in Europe, the solid-state hydrogen storage tank-fuel cell system can be used as an auxiliary power unit for light vehicles and that solid-state hydrogen storage technology has a large space for optimization compared with gaseous hydrogen storage technology. Through numerical simulation, some researchers have analyzed the effects of heat transfer fluid temperature, outlet pressure, and heat transfer coefficient on the hydrogen desorption of reactors [5,13,14,15]. Chung et al. [5] used a two-dimensional metal hydride reaction model to simulate and investigate the influence of the expanded volume on the hydrogen absorption and desorption reactions of alloys, revealing that hydrogen in the expanded volume could flow along the tank wall due to thermal buoyancy, and thermal convection in the reaction zone could be ignored if no volume expansion occurred. Mghari et al. [13] proposed to use phase-change materials (PCMs) to absorb the heat generated during hydrogen absorption. In addition, they analyzed the effects of thermal conductivity and latent heat of PCMs on their hydrogen absorption and desorption properties, and were analyzed using a two-dimensional model for describing mass and heat transfer and their interaction in metal hydrides and PCMs. Kyoung et al. [14] simulated the hydrogen desorption process of the three-dimensional hydrogen storage tank model and analyzed the temperature and H/M atomic ratio during hydrogen desorption in the hydrogen storage tank, as well as hydrogen flow distribution in the reactor. Corgnale et al. [15] proposed a honeycomb-finned hydrogen storage reactor with hexagonal honeycomb heat conducting fins providing the heat required for hydrogen desorption through a 100-W electric heater placed in the center of the honeycomb structure. The results showed that with a low heating power, the 0.5-L container could release about 45% hydrogen in a short time.
The existing research results have validated the hydrogen desorption reaction model of LaNi5 alloy, including the mechanism of hydrogen flow in porous and non-porous media, the dynamic model of heat and mass transfer of the hydrogen desorption reaction, and the coupling operation among the three equations of mass, momentum, and energy conservation in the reaction tank. With an in-depth understanding of the mechanism of the hydrogen desorption reaction, it is crucial to optimize the heat transfer structure of the reactor based on the heat transfer characteristics of the alloy hydrogen desorption reaction, thereby improving the hydrogen desorption performance of the hydrogen storage reactor. According to existing studies [5,6,7,8,13,14,15], the structural optimization of the reactor mainly considers: (1) the heat transfer efficiency of the reactor structure; (2) the effect of hydrogen absorbing and discharging process of hydrogen storage alloy on reactor structure; (3) the volume of the reactor heat transfer structure. Based on the above analysis, this study developed a numerical model of the hydrogen desorption reaction in a LaNi5-based metal hydride reactor. Furthermore, the variations in alloy temperature and reaction fraction in the reactor were considered, and the model was verified by comparing it with the experimental data on the hydrogen desorption reaction by Jemni [16]. Moreover, the effects of different heat transfer fluids and their temperatures on the reaction were simulated and analyzed using a heat transfer bath installed outside the reaction tank.

2. Numerical Model of Hydrogen Desorption Reaction of Hydrogen Storage Alloy

2.1. Model Assumptions

In the metal hydride hydrogen desorption system, the macro-differential equation could be obtained by simplifying the model and calculating the mass, momentum, and energy conservation equations in different specific zones. The following are the main assumptions used in the model [8,17]: it was assumed that: (1) Hydrogen is an ideal gas and that its relevant physical quantities obey the ideal gas law. (2) A local thermal equilibrium exists between solid metals and hydrogen. (3) The metal powder has uniform pore size, permeability, and other pore characteristics. (4) The porosity, permeability, and thermal conductivity of metal hydrides remain unchanged during hydrogen desorption. (5) The heat transfer medium was incompressible.

2.2. Conservation Equations of the Reaction Zone

Based on the assumptions stated above, the numerical model of the metal hydride reaction zone obeyed three conservation laws: mass conservation, momentum conservation, and energy conservation.
First, the mass conservation in the reaction zone was determined. Then, the mass conservation in the hydrogen zone and the hydrogen storage alloy zone were analyzed, respectively. The mass conservation equation for hydrogen is:
ε ρ H t + ( ρ H v ) = S m
where ρ H is the density of hydrogen, ε is the porosity of the hydrogen storage alloy, v is the velocity vector of hydrogen, and S m is the mass source—the physical meaning of which is the mass of gaseous hydrogen released from solid metal hydrides per unit time and per unit volume. The density of hydrogen ρ H was calculated using the following equation:
ρ H = P H M H R T
where P H is the pressure of hydrogen, M H is the molecular weight of hydrogen, R is the gas constant, and T is the temperature. The mass conservation equation of hydrogen storage alloys is given by:
( 1 ε ) ε ρ M t = S m
where ρ M is the density of alloy and ε is the porosity of the hydrogen storage alloy. Additionally, the momentum conservation in the reaction zone was determined, and its equation is as follows:
1 ε [ ρ H v t + 1 ε ( ρ H v v ) ] = P + τ + ρ H g + S v
This is the momentum control equation of hydrogen in the hydrogen desorption zone, where τ is shear stress and S v is viscous resistance; they are generated by the existence of porous media and represent the momentum loss of hydrogen flowing in porous hydrogen storage alloys. Therefore, in the non-porous zone of the hydrogen storage alloy, S v is equal to 0. However, in the porous zone, S v was calculated as follows:
S v = ( μ K ) v
where μ is the dynamic viscosity and K is the permeability.
Finally, the energy conservation in the reaction zone was determined as follows:
ρ C p ¯ T t + ( ρ H c p H T v ) = ( k e f f T ) + S T
This is the energy conservation control equation, which contains an energy term S T caused by chemical reactions during the hydrogen desorption of alloys. During the hydrogen desorption reaction of alloys, energy transfer in the reaction zone meets the law of energy conservation. In the equation, ρ C p ¯ is the total heat capacity of the reaction zone, and λ e f f is the effective thermal conductivity; ST represents the heat absorbed during the hydrogen desorption reaction. ρ C p ¯ , λ e f f and ST were calculated by the following equations, respectively:
ρ C p ¯ = ( 1 ε ) ρ M C p M + ε ρ H C p H
λ e f f = ( 1 ε ) λ m + ε λ h
S T = S m [ Δ H T ( C p H C p M ) ]
In Equation (8), λ m is the thermal conductivity of the hydrogen storage alloy, which is a linear combination function of the atomic ratio H / M :
λ m = ( H M ) / ( H M ) s a t λ M H + [ 1 ( H M ) / ( H M ) s a t ] λ M
In Equation (10), λ M H is the thermal conductivity of metal hydride when hydrogen absorption is saturated, and λ M is the thermal conductivity of metal hydride when complete dehydrogenation is achieved.

2.3. Kinetic Model of the Reaction Zone

The hydrogen desorption rate of LaNi5 alloy can be expressed by the kinetic model of the reaction. For the hydrogen desorption reaction, S m can be calculated using the kinetic equation as [17,18,19]:
S m = C d exp ( E d R T ) ( P H P d , e q P d , e q ) ( ρ M ρ e m p M )
where C d is the rate constant of hydrogen desorption, E d is the activation energy of hydrogen desorption reaction, ρ s a t M is the density of the alloy without hydrogen absorption, and P d , e q is the equilibrium pressure of hydrogen desorption reaction. The equilibrium pressure P d , e q of hydrogen desorption reaction can be calculated using the Van’t Hoff equation [17,19]:
P d , e q = f ( H M ) exp ( Δ H R ( 1 T 1 T r e f ) ) = ( d 0 + n = 1 9 d n ( H M ) n ) exp ( Δ H R ( 1 T 1 T r e f ) )
where Δ H is the reaction entropy change of the hydrogen desorption reaction, T r e f is the reference temperature, and f ( H / M ) is the interpolation polynomial [19], with the coefficients shown in Table 1. The pressure–composition–temperature (P-C-T) curves of the hydrogen desorption reaction at different temperatures were drawn using Equations (5) and (6). Figure 1 shows the experimental P-C-T data and fitting curves of the hydrogen desorption of the LaNi5 hydrogen storage alloy. Figure 1 shows that the multicomponent experimental data of the hydrogen desorption reaction carried out by Jemni can be fitted using the Van’t Hoff equation to obtain the P-C-T equation of hydrogen desorption of alloys [16], which can then be solved in the model. The correlation coefficients R2 between the P-C-T equation and experimental data at 293 K, 303 K, 313 K were 0.9891, 0.9917 and 0.9927, which could validate the accuracy and reliability of the P-C-T equation.

2.4. Conservation Equations of the Heat Transfer Zone

The continuity equation when the heat transfer medium flows is:
v s = 0
where vs is the flow rate of the heat transfer medium.
The energy conservation equation of the heat transfer zone can be expressed as the following:
( ρ C p ) s T s t + ( ρ C p ) s v s T s = ( k s T s )
where T is the temperature of the heat transfer medium, ( ρ C p ) s is the total heat capacity of the heat transfer medium, and K is the thermal conductivity of the heat transfer medium.
When Re < 2300, the flow characteristics of the heat transfer medium can be described by the Navier–Stokes equation [20]:
ρ s v s v s = [ μ s ( v s + ( v s ) T ) ] p s
When Re > 10,000, the k ε turbulence model is used to describe the flow characteristics of the heat transfer medium [20,21]:
ρ s v s v s = [ ( μ s + μ T ) ( v s + ( v s ) T ) ] p s
where μ s and μ T are the viscosity of the heat transfer medium and turbulence, respectively. Among them, the turbulent kinetic energy is calculated as follows:
ρ s v s k = [ ( μ s + μ T σ k ) k ] + μ T { v s : [ v s + ( v s ) T ] } ρ s φ
where k is the turbulent kinetic energy and φ is the turbulent dissipation rate. The turbulent energy dissipation rate is calculated using the following equation:
ρ s v s φ = [ ( μ s + μ t σ φ ) φ ] + c 1 φ μ t k { v s : [ v s + ( v s ) T ] } c 2 ρ s φ 2 k
where the turbulent viscosity is calculated using the following equation:
μ T = ρ s C μ k 2 φ
In Equations (17) and (18), c 1 , c 2 , σ φ , and σ k are constants.

2.5. Initial and Boundary Conditions

2.5.1. Initial Conditions

Assuming that the reaction zone is initially in thermodynamic equilibrium, the initial conditions for the numerical model of the hydrogen desorption reaction are as follows:
T s = T w 1 = T w 2 = T i n = T o u t = T m
P = P e q , ρ M = ρ s a t M
where Ts, Tw1, Tw2, Tin, Tout, and Tm represent the initial temperature of the heat transfer medium, reactor wall, tank wall, fluid inlet, fluid outlet, and hydrogen storage alloy, respectively, and ρ s a t M is the alloy density when hydrogen storage is saturated.
Because there was no hydrogen in the reaction zone under the initial state, ρ 0 H was set to 0, and the initial hydrogen flow rate was v 0 = 0 .

2.5.2. Boundary Conditions

The boundary conditions at the hydrogen inlet are as follows:
P g , o u t = P 0 , T n = 0
where Pg,out is the hydrogen desorption pressure.
The boundary conditions for the outer wall of the reactor are as follows:
λ s T s n = h e x ( T s T w )
λ w T w n = h e x ( T w T s )
where hex is the convective heat transfer coefficient between the outer wall of the reactor and the heat transfer medium, λ s , λ w are the thermal conductivity of the heat transfer medium and reactor wall, respectively.
The boundary conditions for the inner wall of the reactor are as follows:
λ m T m n = h i n ( T m T w )
λ w T w n = h i n ( T w T m )
where hin is the heat transfer coefficient between the inner wall of the reactor and the hydrogen storage alloy.
The numerical simulation of the model was mainly calculated using the commercial software Fluent for fluid mechanics, and the reaction was simulated by setting the chemical reaction model and material parameters in Fluent. Table 2 shows the material parameters.
Equations (4) and (5) indicate that the heat and mass transfer of the reaction is related to the pressure, temperature, and atomic ratio of the reaction zone. Therefore, in the Fluent chemical reaction model, the macro-definition in user-defined functions (UDFs) was used to read the temperature T, pressure P, and alloy mass fraction Y of the grid cell at a given time point to calculate the mass source term S m and energy source term S T of the grid at a given time point, which was imported into the reaction model to decouple the relevant physical quantities.

3. Results and Discussion

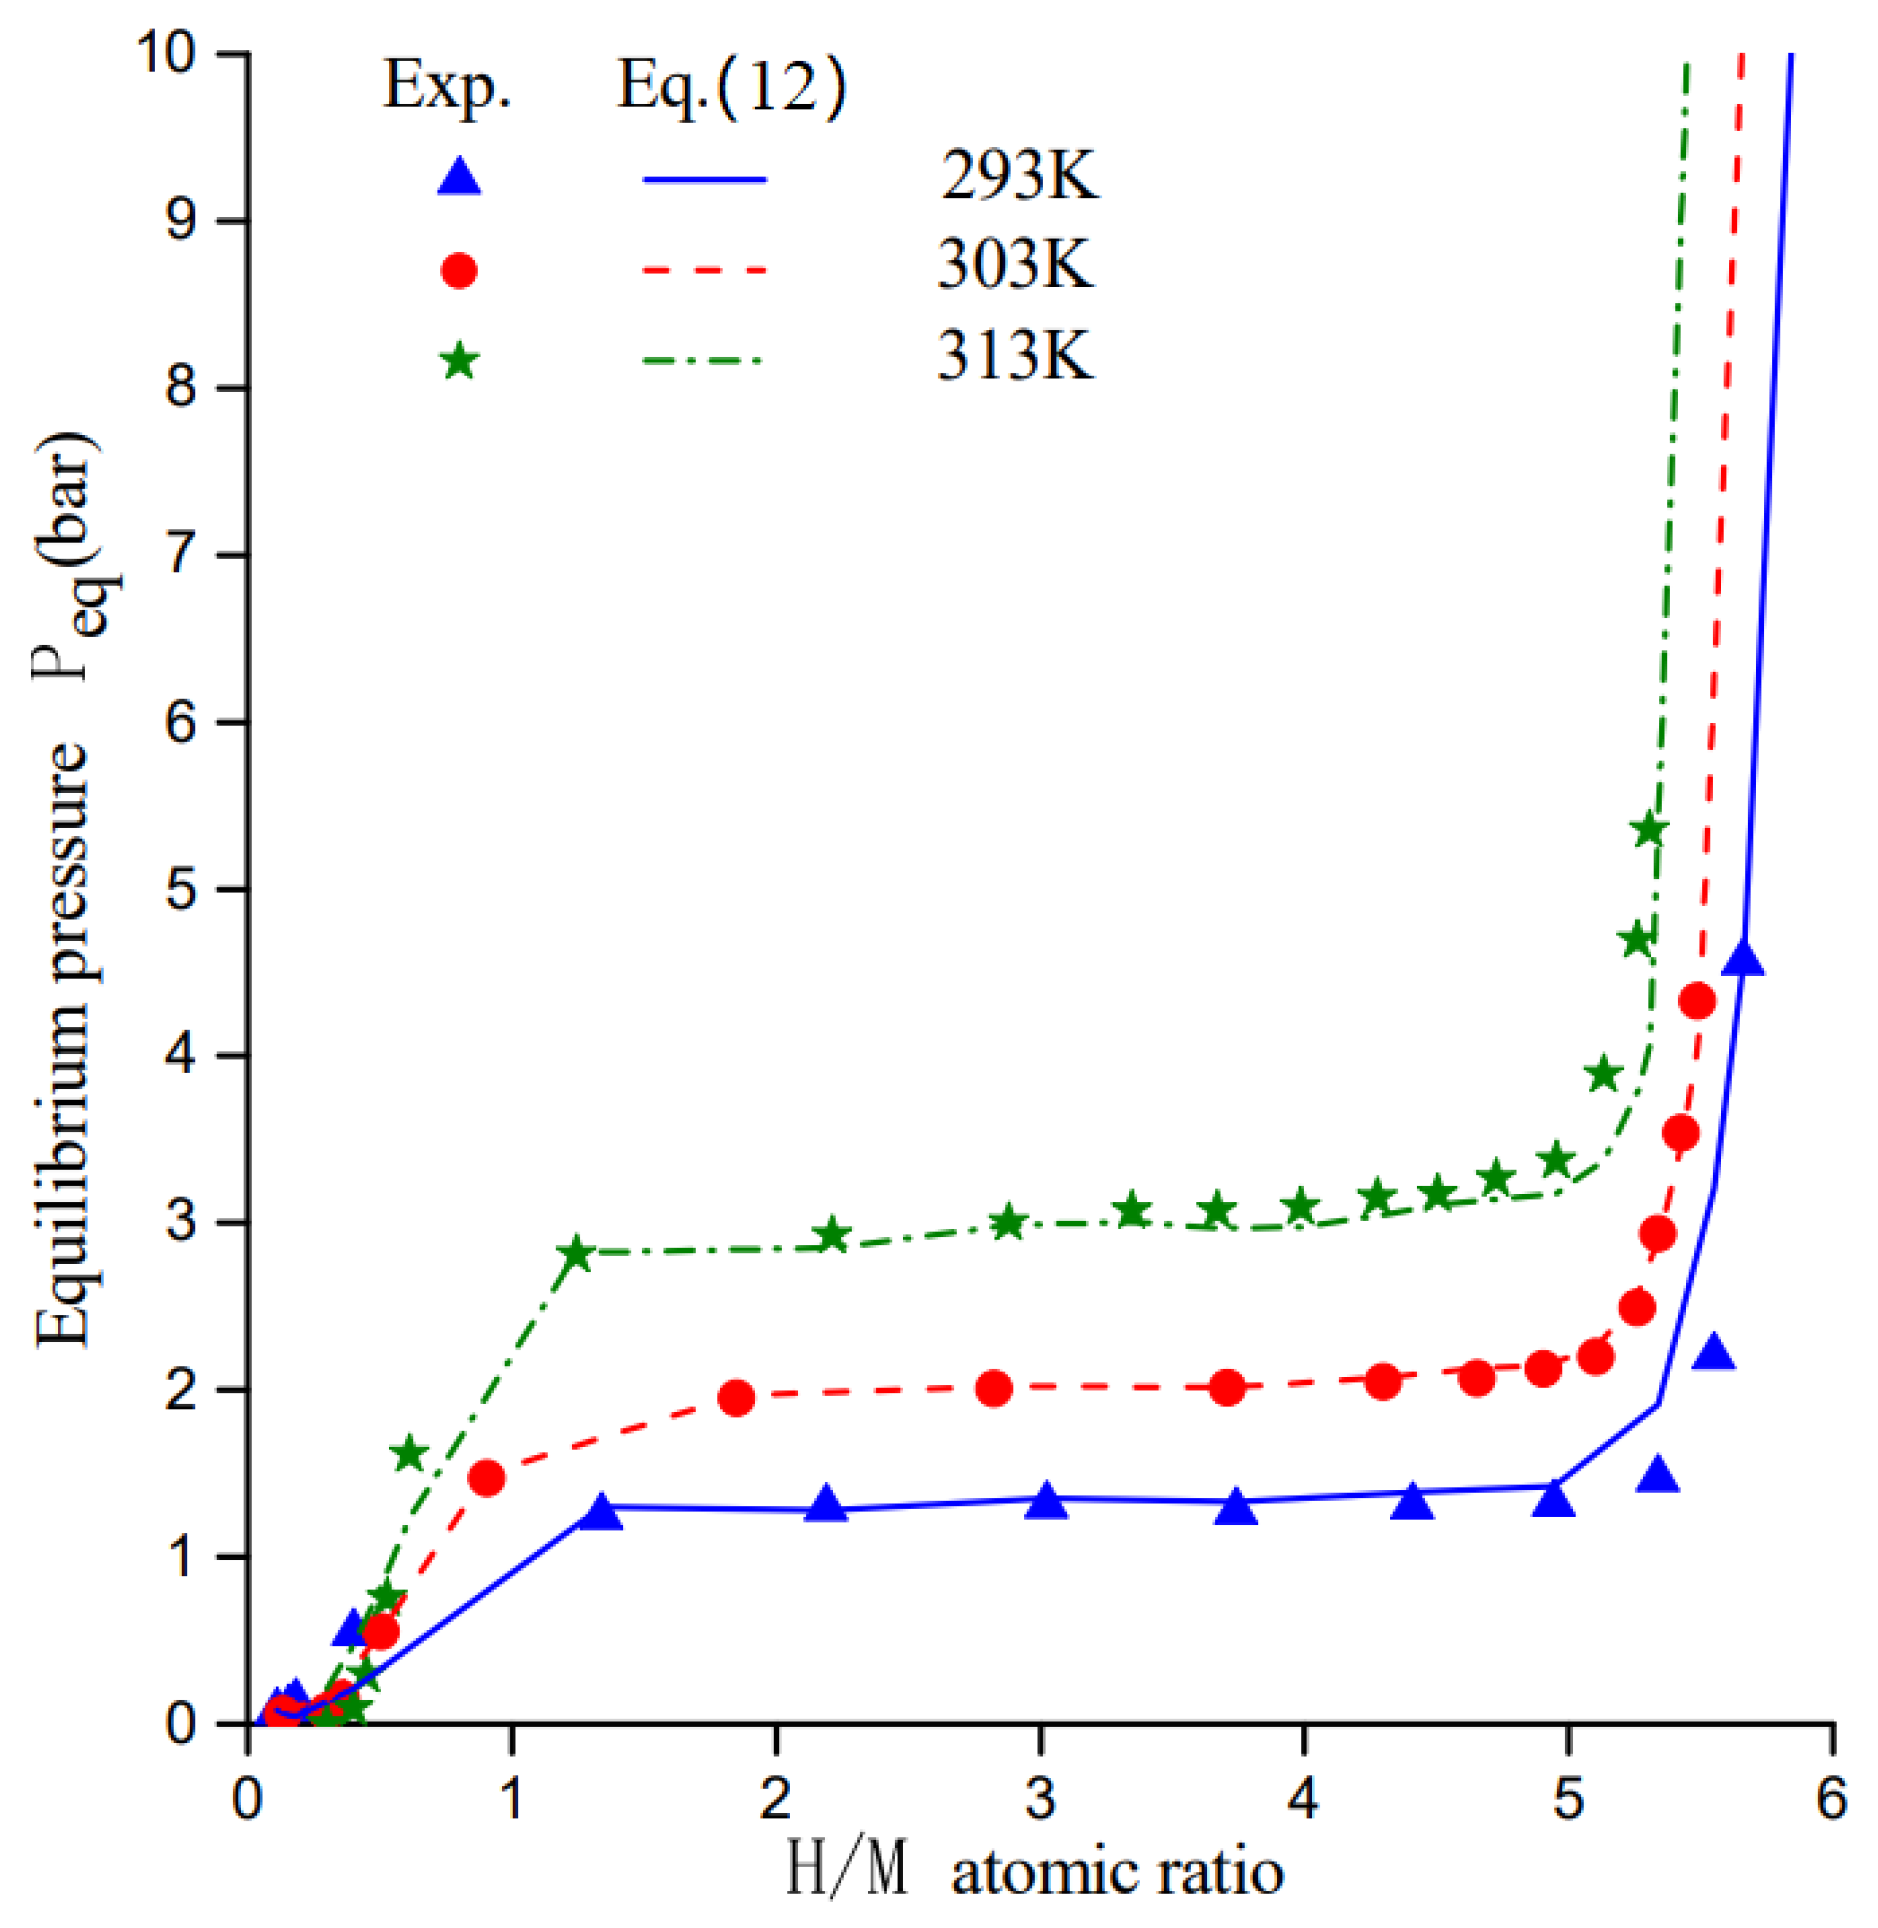
3.1. Model Validation

To verify the accuracy of the numerical model of the hydrogen desorption reaction, we referred to the hydrogen desorption experiment based on an LaNi5 hydrogen storage alloy conducted in a tank with a radius of 25 mm and a height of 80 mm by Jemni et al. [16] Additionally, a geometric model conforming its structure was established in Fluent, as shown in Figure 2a. During the experiment, the initial pressure and temperature in the tank were 85 mbars and 293.15 K, respectively. The temperature variation curves of the hydrogen desorption reaction in a hydrogen storage tank with an internal radius of 15 mm were measured at heights of 15, 25, and 35 mm, respectively.
Figure 2b displays the comparison of the temperature variation curves of experimental and numerically simulated values at the temperature measurement points. Comparisons were made for the predicted and measured temperature evolution profiles at three different points during hydrogen desorption. The correlation coefficients R2 between simulation results and experimental data during hydrogenation at z = 15, z = 25 and z = 35 were 0.856, 0.795 and 0.766, respectively. As shown in Figure 2b, there is a certain gap between the numerical results and the experimental data at the beginning of the reaction, which may be caused by the error between the P-C-T expression and the actual P-C-T curve when the hydrogen storage alloy temperature is low. However, the numerical results and the simulation results can still accurately simulate the temperature variation trend of the hydrogen desorption reaction in the reactor. Furthermore, the overall hydrogen desorption reaction in the hydrogen storage tank was fast at the initial stage. Because the heat absorption rate of the hydrogen desorption reaction was higher than the heat transfer rate of the reactor wall, the temperature and hydrogen storage capacity in the hydrogen storage tank dropped sharply, and the minimum temperature in the tank hit 255 K. As the temperature in the tank decreased, the overall hydrogen desorption reaction rate gradually reduced. The hydrogen desorption reaction began at the tank wall and progressed to the center of the tank due to the heat transfer effect of the tank wall. Therefore, the temperature curve measured in the experiment was close to the measuring point z = 35 mm in the center of the tank, and the time required for the temperature rise was relatively long.
The hydrogen desorption rate of the hydrogen storage alloys is closely related to the heat transfer performance of the reaction tank wall. As a result, to further investigate the effects of water baths at different temperatures and heat transfer with different media on the hydrogen desorption performance of the hydrogen storage tank, a two-dimensional metal hydrogen storage tank model with a heat transfer bath was designed, as shown in Figure 3. This model was mainly composed of three zones: expansion zone, alloy zone, and heat transfer bath zone. Additionally, it also included three heat transfer fluid flow ports: the heat transfer medium inlet and outlet and the hydrogen desorption outlet. The heat and mass transfer performance in the hydrogen desorption tank was analyzed by varying the temperature and type of heat transfer medium in the simulation model.

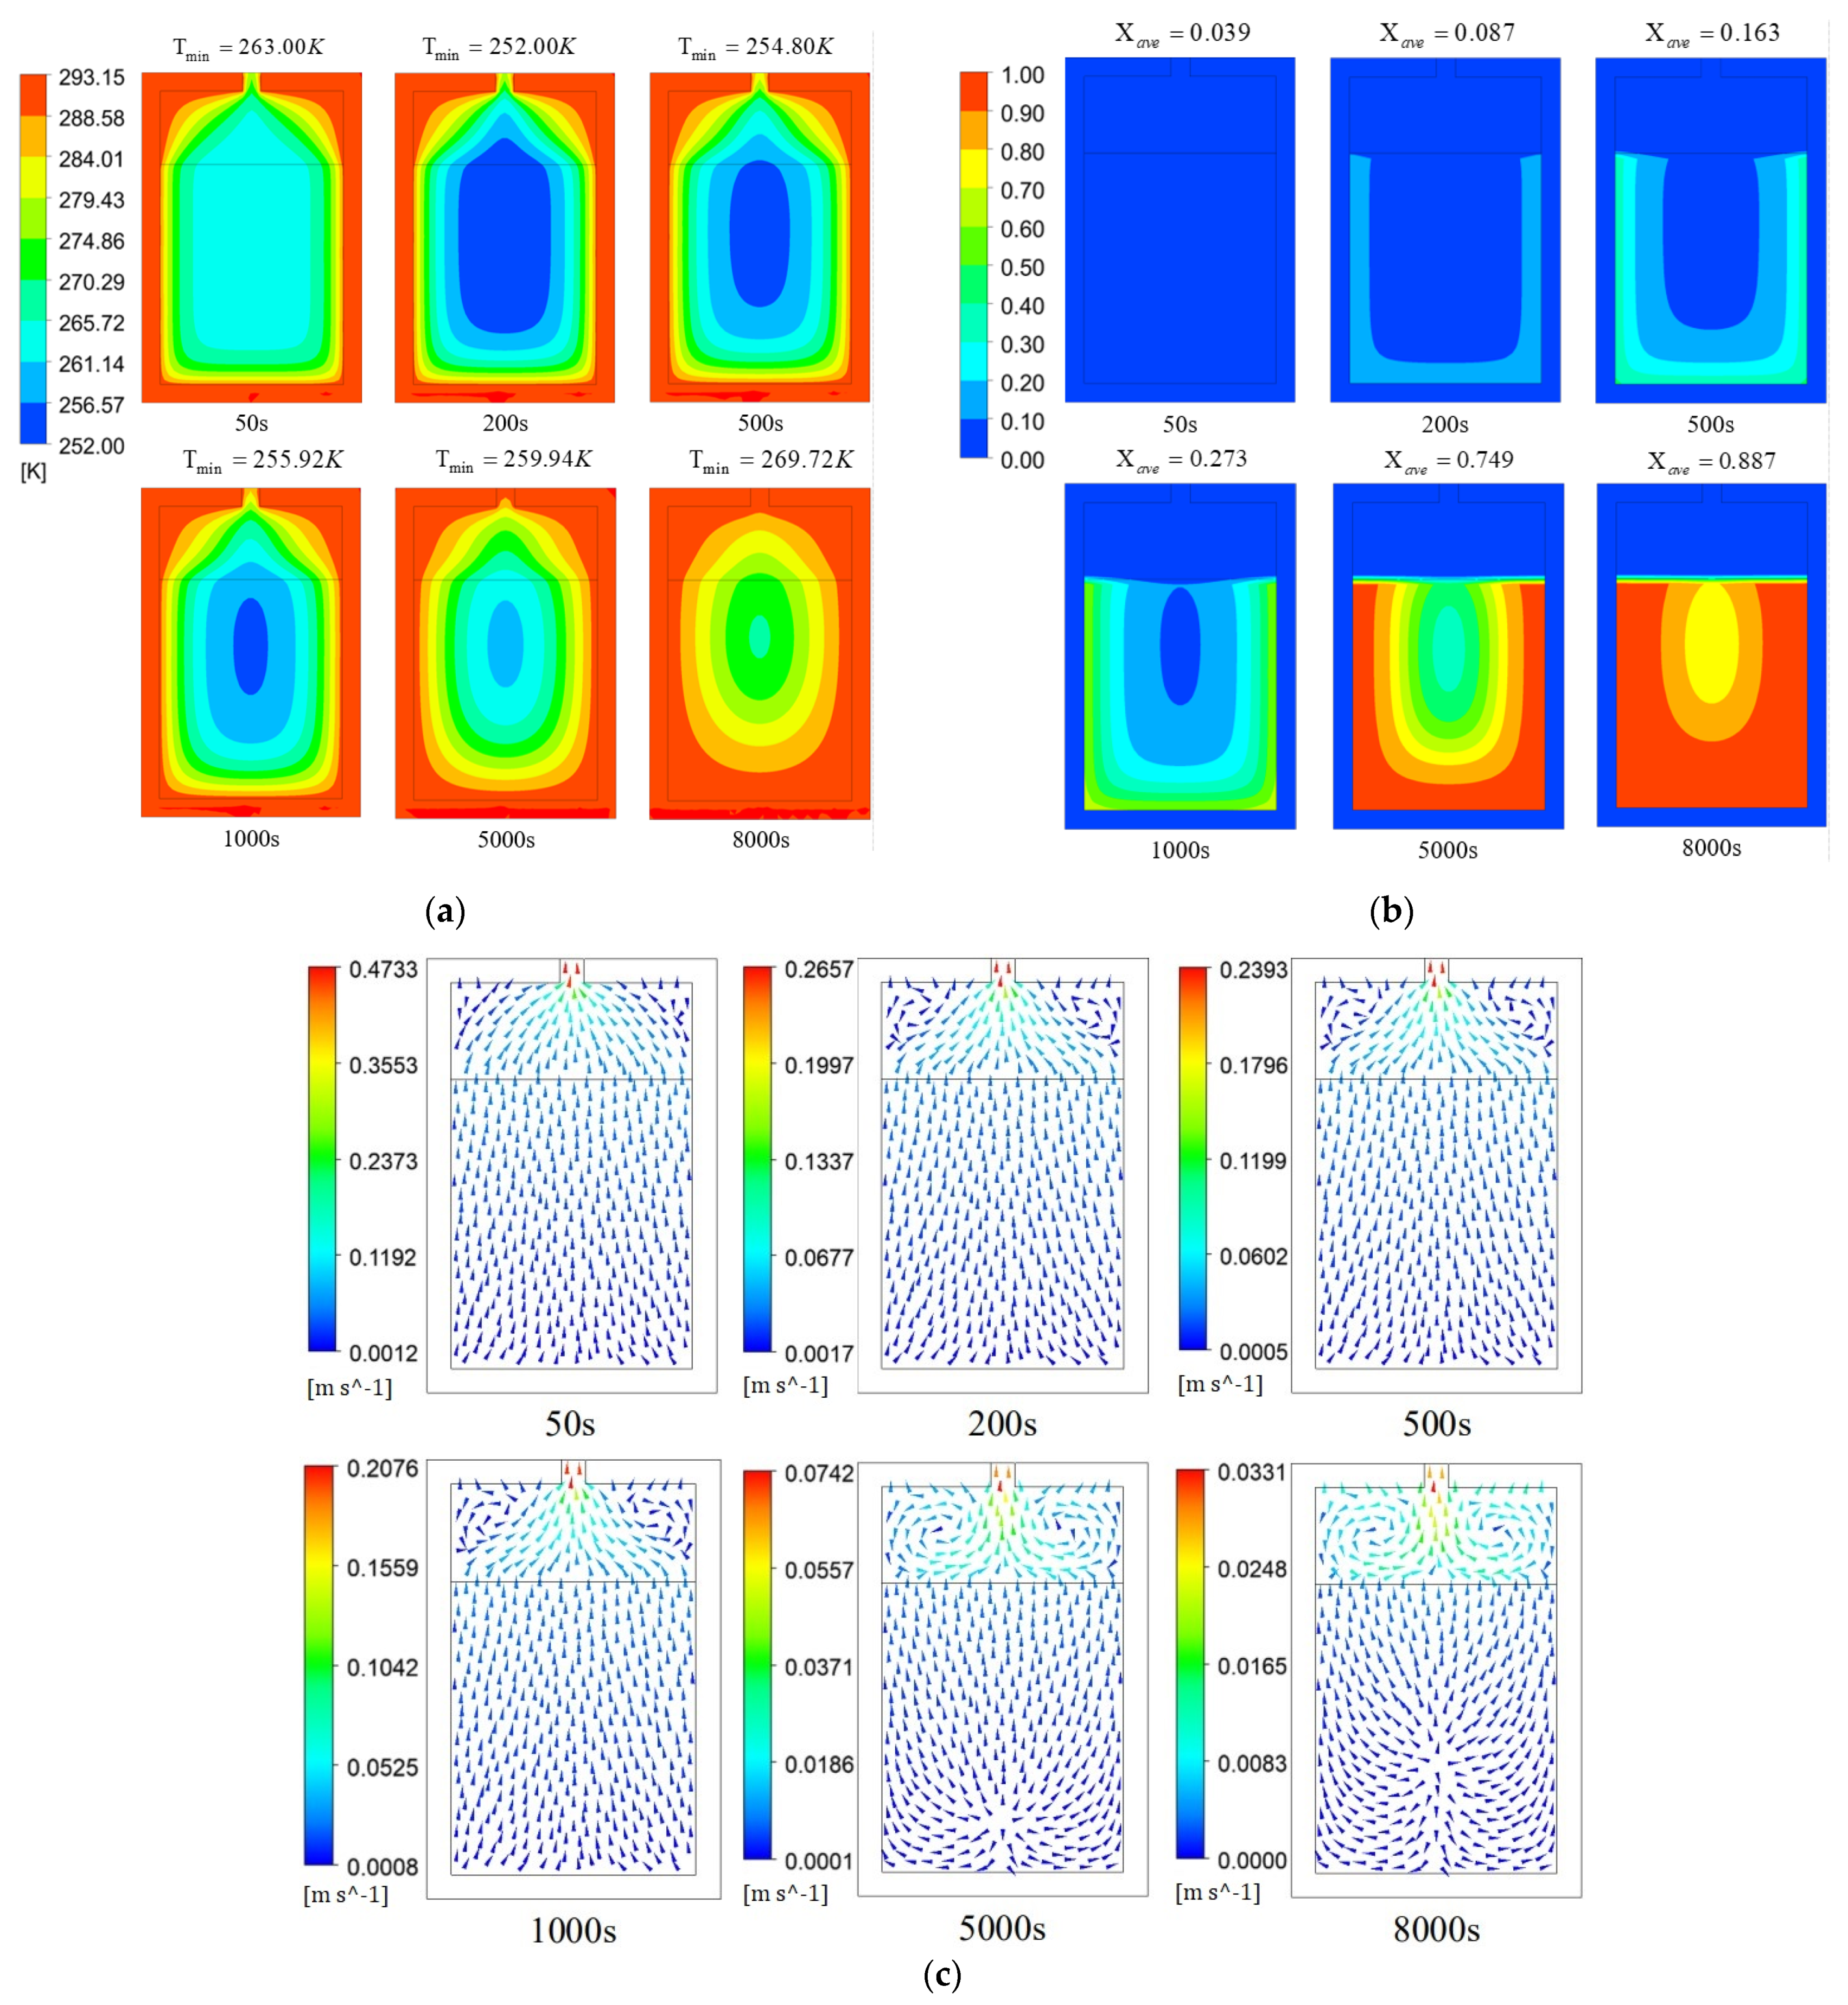
3.2. Analysis of Reactor Temperature, Reaction Fraction, and Flow Rate Distribution

When the medium in the heat transfer bath was water, the benchmark parameters of the hydrogen desorption reaction were set, with the hydrogen desorption pressure being 0.1 bar, the temperature 293.15 K, and the flow rate 1 m/s. Figure 4 shows the distribution of temperature, reaction fraction, and hydrogen flow rate during hydrogen desorption in the reactor under the benchmark parameters.
Figure 4a shows the variations in the reactor temperature distribution with time. Because the hydrogen desorption of alloys is an endothermic reaction, the temperature of the alloy zone in the reactor decreased rapidly at the initial stage, with the minimum temperature falling below 252 K. The temperature in the alloy zone near the tank wall was higher than that in the other zones. In the first 200 s, the reaction temperature in the alloy zone rapidly decreased to 252 K and was maintained in the central alloy zone, indicating that the reactor continued to release hydrogen during this period, resulting in no obvious temperature variations in the alloy zone. After 200 s, with the temperature of the alloy near the heat transfer bath increasing gradually due to heat transfer fluid, the hydrogen desorption reaction in the alloy zone near the tank wall almost stopped.
The chemical equation of the hydrogen desorption reaction of the LaNi5 hydrogen storage alloy is expressed as follows:
LaNi 5 H 6 LaNi 5 + 3 H 2 + Δ H
It indicates that 6 mol hydrogen atoms are released per 1 mol LaNi 5 H 6 . The hydrogen desorption reaction fraction X can be calculated using the following equation:
X = 1 ( H / M ) ( H / M ) s a t
H M = 2 ( ρ M ρ e m p M ) / M H 2 ρ e m p M M L a N i 5
Figure 4b depicts a cloud figure showing the variations in the reaction fraction of the reactor over time. In the first 50 s, the reaction fraction in the alloy zone increased almost uniformly. Subsequently, with the heating of the alloy zone by the heat transfer water flow, the temperature of the alloy zone near the tank wall rose, and the hydrogen desorption reaction rate increased. The alloy zone near the heat transfer bath firstly reached a higher reaction fraction.
Figure 4c depicts a cloud figure showing the variations in the hydrogen flow rate in the reactor over time. The hydrogen flow rate in the expansion zone was higher than that in the alloy zone. In the first 1000 s, the flow of hydrogen in the alloy zone was from the bottom to the top and flowed out through the hydrogen desorption outlet. Combined with the cloud chart of reaction fraction in the first 1000 s, hydrogen was first released from the metal hydrides near the tank wall, and the hydrogen at the bottom of the alloy zone first flowed to the alloy zone with a small hydrogen desorption capacity, then to the expansion zone, and finally was discharged through the hydrogen desorption outlet. At this time, after 5000 s, a hydrogen diffusion zone formed in the central alloy zone, and partial hydrogen flowed to the alloy zone near the wall initially before being discharged along the tank wall toward the hydrogen desorption outlet, with the hydrogen desorption reaction in the alloy zone near the tank wall almost stopping, but it was still maintained in the central alloy zone.

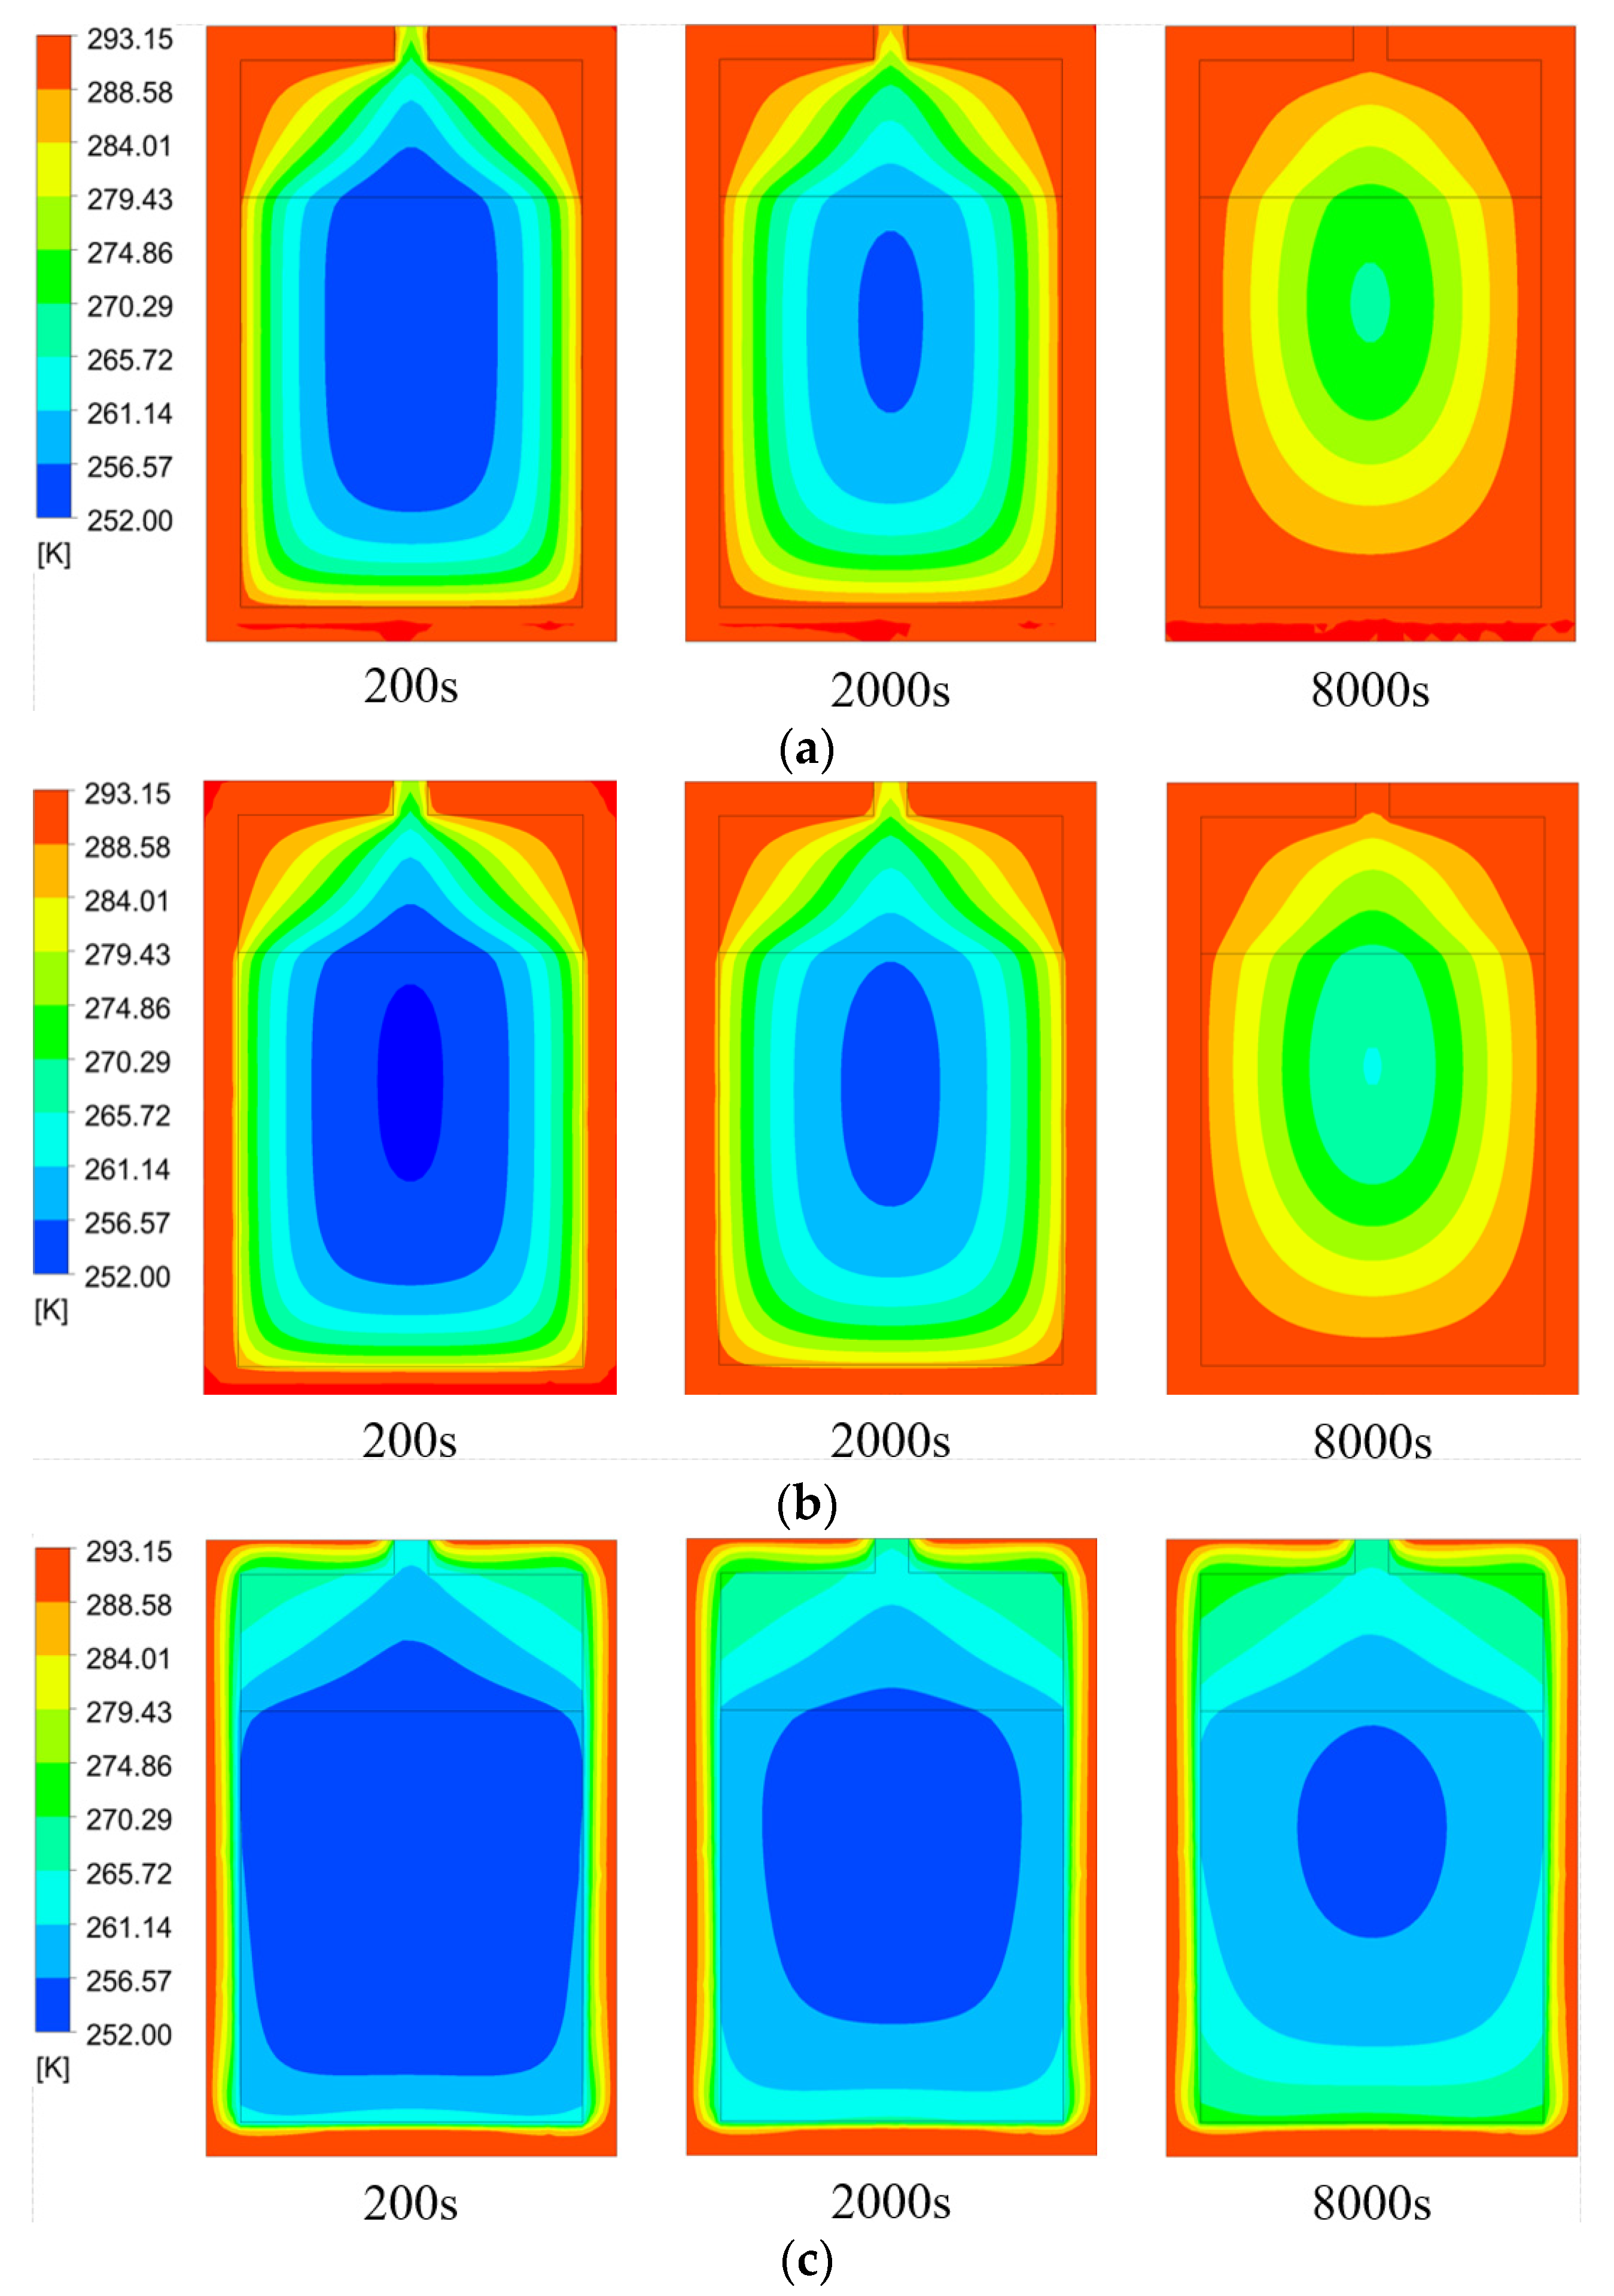
3.3. Effects of Temperature and Type of Heat Transfer Medium

To investigate the effect of a heat transfer medium with different operating parameters on the heat and mass transfer performance of the hydrogen desorption reaction in the alloy zone, the temperature variation and hydrogen storage capacity in the hydrogen storage tank were analyzed when the heat transfer medium was water and the temperature was 293.15–333.15 K, respectively. Figure 5 shows the variation curves of the average temperature and reaction fraction of the reaction zone with time under the water flow at four different temperatures.
It can be seen in Figure 5a that when the water temperature was low, the temperature rise time and reaction time in the alloy zone were relatively long. Starting with a water temperature of 293.15 K, the time required for the temperature in the alloy zone to rise to the corresponding temperature of the heat transfer medium was reduced by 1722, 960, 326, and 129 s, respectively, for every 10 K increase. It can be seen in Figure 5b that when the water temperature increased, the reduction in time required for metal hydrides to reach hydrogen desorption saturation gradually decreased, indicating that with the continuous increase in heat transfer fluid temperature, the improving effect of heat transfer fluid temperature on the hydrogen desorption rate is small.
The physical property of the heat transfer medium in the heat transfer bath is an important factor in determining the hydrogen desorption performance of the hydrogen storage reactor. According to the types of heat transfer media commonly used in industry, water, oil, and air with an initial temperature of 293.15 K and a flow rate of 1 m/s were selected as heat transfer media to simulate and analyze the hydrogen desorption process of hydrogen storage alloys. Table 3 shows the heat capacity and thermal conductivity of the heat transfer media.
Figure 6 and Figure 7 show the temperature distribution and reaction fraction distribution of the reactor at different time points when the heat transfer medium was water, oil, and air, respectively. Comparing Figure 6a,b with Figure 7a,b, when the heat transfer medium was water and oil, the variation characteristics of the temperature and hydrogen storage capacity in the reactor during hydrogen desorption were similar, but, and due to the high convective heat transfer coefficient between water and the tank wall, the heat transfer efficiency of water was higher than that of oil. It can be seen in Figure 6c that when the heat transfer medium was air, the temperature difference on both sides of the tank wall was small, resulting in no obvious heat transfer effect. This is because the thermal conductivity and heat capacity of the air are relatively low, and the convective heat transfer rate of the air in the tank is lower than that on the tank wall, resulting in a small temperature difference on both sides of the hydrogen storage tank wall. It can be seen from Figure 7c that when the heat transfer medium was air, the hydrogen storage capacity of alloys near the tank wall still increased initially, and the hydrogen desorption capacity of alloys near the air inlet increased significantly, but the overall hydrogen desorption efficiency remained relatively low.
Figure 8 shows the variation curves of the average temperature and reaction fraction of the reaction zone with time when different heat transfer media were used. It can be seen in Figure 8 that when the heat transfer media were water and oil, within 10,000 s, the hydrogen storage alloys almost reached hydrogen desorption saturation and the temperature rose to more than 285 K. Among them, water had the highest heat transfer efficiency, as well as the shortest hydrogen desorption time in the reactor. When the heat transfer medium was air, the hydrogen desorption reaction was still going on in the reactor, and its minimum average temperature was as low as 253 K. The temperature increased by only 7.53 K compared with the lowest average temperature in the reaction zone within 10,000 s.

4. Conclusions

In this study, the accuracy of the mass transfer model developed was verified by referring to the hydrogen desorption experiments of existing hydrogen storage alloys, with a heat and mass transfer model of the hydrogen desorption reaction in a metal hydrogen hydride storage tank being developed and numerically simulated. On this premise, a heat transfer bath was designed to heat the hydrogen storage tank during the hydrogen desorption reaction, and the hydrogen desorption reaction in the heat transfer tank was simulated and analyzed under different heat transfer temperatures and fluid types. The conclusions are as follows:
(1)
In the initial stage of the hydrogen desorption reaction, the reaction rate is high, the reaction absorbs a lot of heat, and the temperature in the alloy zone drops sharply. As the temperature in the alloy zone continues to decrease, the reaction rate gradually decreases, the temperature in the tank reaches its minimum, and the hydrogen desorption reaction almost stops.
(2)
Under heat transfer water flow, the tank wall temperature gradually rises, and the reaction rate increases. While increasing the temperature of the water flow can shorten the hydrogen desorption time within a certain range, the tank wall first reaches hydrogen desorption saturation, and the hydrogen desorption reaction begins on the tank wall and progresses to the center of the tank. However, as the water flow temperature continues to increase, the effect of heat and mass transfer performance in the hydrogen storage tank gradually diminishes.
(3)
When the heat transfer medium is water and oil, the temperature and hydrogen storage capacity of the reactor during hydrogen desorption have similar characteristics, but the heat transfer time of water is about 10% shorter than that of oil, and the corresponding hydrogen desorption time is about 5% shorter. When the heat transfer medium is air, the heat transfer effect of the hydrogen storage tank decreases significantly at the same flow rate, the reaction rate difference between the tank wall and the center of the tank is small, the minimum temperature of the hydrogen desorption reaction decreases, and the hydrogen desorption time increases significantly.

Author Contributions

Conceptualization, M.C., Z.L. and K.H.; methodology, M.C.; software, J.T. and L.G.; validation, J.T. and M.J.; formal analysis, J.T.; investigation, J.T.; resources, Y.C.; writing—original draft preparation, J.T.; writing—review and editing, M.C.; visualization, Y.C; supervision, M.C. All authors have read and agreed to the published version of the manuscript.

Funding

This research was funded by GuangDong Basic and Applied Basic Research Foundation, grant number No. 2020A1515110080, No. 2020B1515120006 and No. 2021A1515010712.

Data Availability Statement

The data presented in this study are available in this article.

Conflicts of Interest

The authors declare no conflict of interest.

References

  1. Thomas, K.M. Hydrogen adsorption and storage on porous materials. Catal. Today 2007, 120, 389–398. [Google Scholar] [CrossRef]
  2. Rusman, N.; Dahari, M. A review on the current progress of metal hydrides material for solid-state hydrogen storage applications. Int. J. Hydrog. Energy 2016, 41, 12108–12126. [Google Scholar] [CrossRef]
  3. Barthelemy, H.; Weber, F.; Barbier, F. Hydrogen storage: Recent improvements and industrial perspectives. Int. J. Hydrog. Energy 2017, 42, 7254–7262. [Google Scholar] [CrossRef]
  4. Song, J.; Wang, Y.; Li, S.; He, C.; Wang, D.; Yang, F.; Wu, Z.; Zheng, L.; Zhang, Z. Numerical and experimental study of La-Ni hydriding kinetics based on the varying-size model. Chem. Eng. Sci. 2018, 176, 580–599. [Google Scholar] [CrossRef]
  5. Chung, C.A.; Ho, C.J. Thermal–fluid behavior of the hydriding and dehydriding processes in a metal hydride hydrogen storage canister. Int. J. Hydrog. Energy 2009, 34, 4351–4364. [Google Scholar] [CrossRef]
  6. Baykara, S.Z. Hydrogen: A brief overview on its sources, production and environmental impact. Int. J. Hydrog. Energy 2018, 43, 10605–10614. [Google Scholar] [CrossRef]
  7. Marty, P.; Rango, P.; Delhomme, B.; Garrier, S. Various tools for optimizing large scale magnesium hydride storage. J. Alloy. Compd. 2013, 580 (Suppl. S1), S324–S328. [Google Scholar] [CrossRef]
  8. Nam, J.; Ko, J.; Ju, H. Three-dimensional modeling and simulation of hydrogen absorption in metal hydride hydrogen storage vessels. Appl. Energy 2012, 89, 164–175. [Google Scholar] [CrossRef]
  9. Chippar, P.; Lewis, S.D.; Rai, S.; Sircar, A. Numerical investigation of hydrogen absorption in a stackable metal hydride reactor utilizing compartmentalization. Int. J. Hydrog. Energy 2018, 43, 8007–8017. [Google Scholar] [CrossRef]
  10. Wang, Y.; Adroher, X.C.; Chen, J.; Yang, X.G.; Miller, T. Three-dimensional modeling of hydrogen sorption in metal hydride hydrogen storage beds. J. Power Sources 2009, 194, 997–1006. [Google Scholar] [CrossRef]
  11. Wang, D.; Wang, Y.; Huang, Z.; Yang, F.; Wu, Z.; Zheng, L.; Wu, L.; Zhang, Z. Design optimization and sensitivity analysis of the radiation mini-channel metal hydride reactor. Energy 2019, 173, 443–456. [Google Scholar] [CrossRef]
  12. Agostini, A.; Belmonte, N.; Masala, A.; Hu, J.; Rizzi, P.; Fichtner, M.; Moretto, P.; Luetto, C.; Sgroi, M.; Baricco, M. Role of hydrogen tanks in the life cycle assessment of fuel cell-based auxiliary power units. Appl. Energy 2018, 215, 1–12. [Google Scholar] [CrossRef]
  13. Mghari, H.E.; Huot, J.; Xiao, J. Analysis of hydrogen storage performance of metal hydride reactor with phase change materials. Int. J. Hydrog. Energy 2019, 44, 28893–28908. [Google Scholar] [CrossRef]
  14. Kyoung, S.; Ferekh, S.; Gwak, G.; Jo, A.; Ju, H. Three-dimensional modeling and simulation of hydrogen desorption in metal hydride hydrogen storage vessels. Int. J. Hydrog. Energy 2015, 40, 14322–14330. [Google Scholar] [CrossRef]
  15. Corgnale, C.; Hardy, B.; Chahine, R.; Cossement, D. Hydrogen desorption using honeycomb finned heat exchangers integrated in adsorbent storage systems. Appl. Energy 2018, 213, 426–434. [Google Scholar] [CrossRef]
  16. Jemni, A.; Nasrallah, S.B.; Lamloumi, J. Experimental and theoretical study of ametal–hydrogen reactor. Int. J. Hydrog. Energy 1999, 24, 631–644. [Google Scholar] [CrossRef]
  17. Gkanas, E.I.; Grant, D.M.; Khzouz, M.; Stuart, A.D.; Manickam, K.; Walker, G.S. Efficient hydrogen storage in up-scale metal hydride tanks as possible metal hydride compression agents equipped with aluminium extended surfaces. Int. J. Hydrog. Energy 2016, 41, 10795–10810. [Google Scholar] [CrossRef]
  18. Askri, F.; Jemni, A.; Nasrallah, S.B. Dynamic behavior of metal–hydrogen reactor during hydriding process. Int. J. Hydrog. Energy 2004, 29, 635–647. [Google Scholar] [CrossRef]
  19. Dhaou, H.; Askri, F.; Salah, M.B.; Jemni, A.; Nasrallah, S.B.; Lamloumi, J. Measurement and modelling of kinetics of hydrogen sorption by LaNi and two related pseudobinary compounds. Int. J. Hydrog. Energy 2007, 32, 576–587. [Google Scholar] [CrossRef]
  20. Bao, Z.; Wu, Z.; Nyamsi, S.N.; Yang, F.; Zhang, Z. Three-dimensional modeling and sensitivity analysis of multi-tubular metal hydride reactors. Appl. Therm. Eng. 2013, 52, 97–108. [Google Scholar] [CrossRef]
  21. Du, T.; Chen, Q.; Du, W.; Cheng, L. Performance of continuous helical baffled heat exchanger with varying elliptical tube layouts. Int. J. Heat Mass Transf. 2019, 133, 1165–1175. [Google Scholar] [CrossRef]
Figure 1. Equilibrium pressure for the hydrogen desorption reaction.
Energies 15 08375 g001
Figure 2. Comparisons of calculated and measured results. (a) Temperature measuring points; (b) simulation and experimental comparisons.
Energies 15 08375 g002
Figure 3. A hydrogen storage tank grid model with a heat transfer bath.
Energies 15 08375 g003
Figure 4. Temperature, reacted fraction and hydrogen flow velocity distribution in different times of the reaction tank subjected to a water at 293.15 K: (a) temperature distribution cloud figure; (b) reacted fraction distribution cloud figure; (c) velocity distribution cloud figure.
Energies 15 08375 g004
Figure 5. Time-varying curves of average temperature and reacted fraction in the reaction zone subjected to different water temperature: (a) average temperature; (b) reacted fraction.
Energies 15 08375 g005
Figure 6. A temperature distribution cloud figure in different times of the reaction tank subjected to different heat transfer media of air, water, and oil: (a) water as the heat transfer medium; (b) oil as the heat transfer medium; (c) air as the heat transfer medium.
Energies 15 08375 g006
Figure 7. A reacted fraction X distribution cloud figure in different times of the reaction tank selecting air, water, and oil as the heat transfer media: (a) water as the heat transfer medium; (b) oil as the heat transfer medium; (c) air as the heat transfer medium.
Energies 15 08375 g007
Figure 8. Time-varying curves of average temperature and the reacted fraction in the reaction zone in a condition of diverse heat transfer media.
Energies 15 08375 g008
Table 1. Polynomial coefficient for Equation (12).
d0d1d2d3d4d5d6d7d8d9
0.426−4.11414.180−13.1094.5570.166−0.5920.179−0.0230.00113
Table 2. Model parameters.
ParameterUnitValue
Initial temperature, T 0 °C20
Reference temperature, T r e f °C30
Hydrogen desorption rate constant, C d s 1 9.57
Activation energy, E d J mol 1 16473
Enthalpy change, Δ H J mol 1 −30,478.0
Hydrogen heat capacity, C p H J ( mol K ) 1 1489
Heat capacity of hydrogen storage alloy, C p M J ( mol K ) 1 419
Heat conductivity coefficient of hydrogen, k g W ( m K ) 1 0.167
Heat conductivity coefficient of alloy, k s W ( m K ) 1 1.3
Porosity, ε --0.63
Permeability of the pore area, K m 2 10 8
Alloy density, ρ e m p M kg m 3 8300
Saturated alloy density, ρ s a t M kg m 3 8428
Table 3. Parameters of heat transfer media.
Heat Transfer MediaWaterOilAir
Heat capacity J ( mol K ) 1 418218451006.43
Heat conductivity coefficient W ( m K ) 1 0.60.1450.0242
Publisher’s Note: MDPI stays neutral with regard to jurisdictional claims in published maps and institutional affiliations.

