Article

Intermediate Pyrolysis of Bambara Groundnut Shell (BGS) in Various Inert Gases (N2, CO2, and N2/CO2)

by
Mustapha Danladi Ibrahim
1,2,
Yousif Abdalla Abakr
3,
Suyin Gan
1,
Lai Yee Lee
1 and
Suchithra Thangalazhy-Gopakumar
1,*
1
Chemical & Environmental Engineering, Faculty of Science and Engineering, University of Nottingham Malaysia, Jalan Broga, Semenyih 43500, Selangor, Malaysia
2
Department of Chemical Engineering, Faculty of Engineering and Engineering, Abubakar Tafawa Balewa University, Bauchi P.M.B 248, Nigeria
3
Mechanical, Materials & Manufacturing Engineering, Faculty of Science and Engineering, University of Nottingham Malaysia, Jalan Broga, Semenyih 43500, Selangor, Malaysia
*
Author to whom correspondence should be addressed.
Energies 2022, 15(22), 8421; https://doi.org/10.3390/en15228421
Submission received: 5 October 2022 / Revised: 31 October 2022 / Accepted: 4 November 2022 / Published: 10 November 2022

Abstract

:
Energy from biomass is increasingly gaining attention amidst the environmental challenges of coal and fossil fuels. This study investigated the effects of inert gases (N2, CO2, and N2/CO2) on intermediate pyrolysis and product properties from Bambara Groundnut Shells (BGS) (shells from an underutilized crop, which has high nutritional values). N2/CO2 atmosphere roughly represents flue gas. The results showed that the inert gases did not significantly affect the yields of bio-oil, biochar, and syngas. The pH of bio-oil ranged from 5.2–5.8, indicating the minimum presence of acids in bio-oil. The CHNS analysis showed that all bio-oil and biochar had their carbon content within 50.04–60.49 wt.%. The FESEM resulted in a wide range of pore sizes in biochar produced in an N2/CO2 atmosphere. The GC-MS (Gas Chromatography-Mass Spectrometry) analysis revealed the presence of compounds which can be categorized as alkene, acid, benzene derivatives, ketone, phenol derivatives, alcohol, aldehyde, alkyl, and ester. However, the presence of N2/CO2 gas favored alcohol and phenol production significantly.

Graphical Abstract

1. Introduction

The International Renewable Energy Agency (IRENA) reported that globally generated renewable energy hit 260 GW, recording an increase of approximately 50%in 2020 in comparison to the preceding year [1]. Biomass is considered to be a viable, environmentally friendly, carbon-neutral, and a sustainable energy source that can curtail climate change, such as global warming and acid rain [2]. The processing of biomass, via pyrolysis, is a promising thermochemical technology for converting biomass into renewable biofuels and value-added chemicals. Pyrolysis has advantages over gasification, combustion, and incineration; for example, a low-temperature process and lower emission of NOx (Nitrogen oxides) and SO2, thereby increasing the energy recovery efficiency of the process and reducing the overall cost [3]. The principal operating parameters in pyrolysis are temperature, heating rate, and vapor residence time, which are 400–600 °C, 10–1000 °C/min, and 0.5 s–30 min, respectively.
Agricultural wastes, forestry residues, industrial wastes, and municipal solid wastes derive cleaner fuels and green chemicals, via biochemical and thermo-chemical processes, compared to fossil fuels. The biochemical process is not efficient, and is expensive, while the thermochemical process is more advantageous based on its cost-effectiveness, lower complexity, and easy operation. Pyrolysis is the most uncomplicated thermal conversion process to convert lignocellulosic materials to bio-oil, biochar, and syngas. Numerous factors, e.g., type of biomasses, catalyst, heating and inert flow rate, reactor design, and temperature effect, play a vital role in products yield [2]. Intermediate pyrolysis is the pyrolysis between fast and slow pyrolysis, with moderate heating rates. According to [4], intermediate pyrolysis of palm kernel shells at 600 °C and 75 °C/min heating rate yields oil, water, char, and gaseous products at 39%, 8%, 28%, and 25%, respectively [4]. Another study of intermediate pyrolysis on red algal biomass revealed the maximum yield at 50 °C/min and 450 °C for bio-oil. The bio-oil, biochar, and gas yields were 45.02 wt.%, 33.34 wt.%, and 21.64 wt.%, respectively [5]. Intermediate pyrolysis has an excellent product distribution of biochar, bio-oil, and syngas and is more flexible for treating waste biomass [6]. A review on intermediate pyrolysis mentioned that bio-oil from intermediate pyrolysis can be easily separated into two phases, whereas the organic phase has properties such as biodiesel, and can blend up to 50% with fossil liquid. Meanwhile, the aqueous phase is helpful in biogas and ethanol production, as it contains C2-C6 sugars, hydroxy acids, oligomers, and water-soluble phenols. Intermediate pyrolysis can also be used to treat high moisture content feedstock, and biochar achieves the properties of activated carbon due to its comprehensive interaction with steam [7]. Table 1 shows the results from the pyrolysis of some biomass with the yield, carbon content, and pH of bio-oil from literature.
Guizani et al. [13] studied the effect of CO2 in the biomass fast pyrolysis process at 850 °C to enhance CO production. Due to various reactions of CO2 with gases, tars, and char, in comparison to N2, a lower biochar yield was obtained. Biochar produced from CO2 atmosphere pyrolysis increased the surface area by approximately six times and had a different char chemical composition compared to biochar from pure N2 atmosphere pyrolysis [7]. The MSW thermal decomposition in N2, CO2, and N2/CO2 atmospheres, using thermogravimetric equipment, revealed that the higher the heating rate, the more the residual mass, and the higher the weight loss rates of the peaks for N2/CO2 atmospheres. The CO2 atmosphere had a pronounced peak and a small shoulder in the DTG curve, within 160–650 °C, releasing volatiles except in the N2/CO2 (4:1) atmosphere. Low CO2 concentration exacerbates the residual mass, while at over 60% of CO2, it remained constant (32.2%). The N2 promotes char gasification, where the residual mass reduces from 39.2% (N2) to 36.9% (N2/CO2 (4:1) and 33.2% (N2/CO2 (3:2), with the DTG curve two peaks in N2/CO2 (4:1) and a peak in pure N2 atmospheres at above 650 °C [13]. The pyrolysis kinetics of rice husk in a thermogravimetric analysis was studied in a CO2/N2 atmosphere by a two-stage fixed-bed pyrolysis reactor. The activation energy of pyrolysis was between 67.858 kJ/mol and 80.394 kJ/mol. Adding CO2 gas could facilitate CO2 conversion to produce C2H6 and C3H6 and decompose some biological compounds [14]. The co-pyrolytic interaction changed the maximum weight loss rate of the first peak, by −2.5 wt.% in N2 and −1.9 wt.% in CO2 atmospheres. The mass loss rate peak in the first stage was higher in the N2 than in CO2 and mixed atmospheres. The replacement of N2 with the different CO2 concentrations significantly increased the activation energies of the fifth and seventh pseudo-components [15]. CO2-assisted pyrolysis of cellulosic biomass and lignin-rich woody biomass confirmed the effects of CO2 on gas phase reactions between CO2 and volatile matter. Lignin-rich biomass had more CO2 susceptibility, resulting in more enhanced CO formation, via the gas phase reactions and enhanced by earth-abundant catalysts (Co/SiO2 and Ni/SiO2), for both biomass substrates, which increased the syngas formations by two and three times, respectively, which is higher than without catalysts. The cumulative formations of syngas from lignin-rich biomass almost doubled cellulosic biomass [16].
The study of corncob was investigated in a fluidized bed reactor with inert gas (N2, CO2, CO, CH4, and H2) atmospheres during fast pyrolysis, at 550 °C for 10 min. The CO atmosphere bio-oil yield was 49.6%, the lowest, compared to 57.1%, 55.3%, 58.7%, and 56.4%, obtained under N2, CO2, CH4, and H2 atmospheres [17]. Therefore, due to the limited research in biomass pyrolysis with different inert gases or co-gases for product analysis, this study was centered around the two inert gases—N2 and CO2— to investigate their possible potential outcomes.
Bambara (Legume crop) originates from the Bambara district near Timbuktu in West Africa, but its center of origins can be traced to North-Central and North-Eastern Nigeria, to Northern Cameroon, and to the Central African Republic. However, it is cultivated chiefly across Africa, Central and Southern America, and some Asian countries, including Malaysia, Sri Lanka, Indonesia, and Northern Australia. Bambara is an essential crop in Africa’s sub-Saharan continent, with a high tolerance to drought [18], and it thrives well in marginal soils [19]. Several investigations on Bambara found it to have high protein and complete food, providing daily nutritional requirements for adult protein, carbohydrates, and fat or oil [20], with nitrogen fixation capability in the land [21].
The annual production of Bambara groundnut (BGN) was estimated at 330,000 t in 1982, with approximately 50% coming from West Africa. The production is still at the subsistence level, and global production data has been challenging [19]. In the early 2000s, Zimbabwe exported approximately 2000–3000 tons, yearly, and transported predominantly to South Africa [22]. Zambia is still the most extensive producer compared to Nigeria, Niger, Ghana [18], Burkina Faso, Mali, Cote D’Ivoire, and Chad. However, the major exporters throughout tropical Africa are Burkina Faso, Chad, Mali, Niger, and Senegal [19]. There is little or no work investigating biomass using combined inert gases during pyrolysis, especially on the BGS [10].
The current study evaluated the impact of different inert gases and flow rates on the intermediate pyrolysis of BGS to improve the fuel properties of bio-oil. The temperature was set at 600 °C, and the inert gases used during the experiment were N2, CO2 and N2/CO2 (75: 25) vol% mixture to simulate a flue gas atmosphere. Several analyses were conducted, including Gas Chromatography-Mass Spectroscopy (GC-MS), Fourier Transform Infrared Spectroscopy (FTIR), Thermogravimetric Analysis (TGA), and Field Emission Scanning Electron Microscopy (FESEM), in order to understand the changes in physicochemical composition and surface morphology of bio-oil and biochar products.

2. Materials and Methods

2.1. Biomass Sample Collection

The BGS were collected from the Crop for The Future (CFF) Field Research Centre (FRC), University of Nottingham, Malaysia. The collected BGS were reduced in size using an impact rotor mill (model Retsch SM100) and sieved to 1.18 mm with a Heavy-Duty Sieve Shaker. They were all sealed in a plastic sample holder and stored in the laboratory for further analysis and for the intermediate pyrolysis experiments.

2.2. Feed Characterization

The elemental content of carbon, hydrogen, nitrogen, and sulfur (C, H, N, and S) was determined using an elemental analyzer (Vario MACRO Cube, Elementar). Usually, oxygen measurement is indirect, and is achieved by subtracting the weight percentage of all other elements (C, H, N, S) and the ash content from 100%. The Higher Heating Value (HHV) samples were analyzed, per British Standard No. BS4379, using a bomb calorimeter (Parr 6100) with a standard 1108 Oxygen Bomb, USA. The moisture content (MC) determination was based on the oven method: approximately 1 g of the biomass sample was measured in a porcelain dish and placed in the convection oven for 16 h at 105 ± 3 °C. Then, the sample was removed from the oven, kept in a desiccator, cooled to room temperature, and weighed. The moisture content (MC) was calculated from the weight difference and reported in weight percent. The volatiles matter determination was by heating approximately 15 mg of biomass at a constant heating rate of 10 °C/min in a TGA (Thermogravimetric Analysis). The analysis was performed under nitrogen at a 20 mL/min flow rate from room temperature to 110 °C and held at 110 °C for 10 min to remove all moisture content. Next, the sample was heated from 110 °C to 900 °C and held at 900 °C for 10 min. The volatiles matter, calculated as percent weight loss, occurred at 110 to 900 °C. The ash content (AC) was analyzed by ashing the biomass samples in a muffle furnace. A dried sample of 1 g was placed in a crucible and heated at 575 ± 10 °C for 4 h. The crucible was placed in a desiccator and cooled to room temperature. The crucible was weighed to the nearest 0.01 g [23]. The fixed carbon (FC) content calculation was carried out using the empirical formula in Equation (1):
FC = 100 − (MC + VM + AC)
The FESEM/EDX analysis (FEI Quanta 400F model and INCA 400 Oxford instrument with X-Max Detector—USA) determines the morphology and surface elemental composition. The FESEM/EDX image examination had an accelerating voltage of 20 kV to verify the sample surface morphology.

2.3. Intermediate Pyrolysis

Figure 1 shows the vertical tubular reactor (VTR), with an inner diameter of Φ 0.05 m and a length of 1.2 m, connected to gas inlet and outlet tubes using stainless steel and silicone gel. The intermediate pyrolysis of the BGS samples under atmospheric pressure occurred in a VTR. During pyrolysis, the operating parameters contribute to the product quality and quantity of both bio-oil and biochar. The reaction temperature is essential in a thermochemical process because it changes the biomass’s volatile and condensable components [24]. Approximately 30 g of the BGS biomass was used for each batch of pyrolysis. The samples were held onto a stainless-steel mesh holder that was inserted into the reactor. The supported mesh/sieve was 0.4 m above the bottom of the reactor, and the reactor coupler was screwed tight at the top.
Nitrogen (N2), carbon dioxide (CO2), and flue gas (N2/CO2), at a ratio of 75:25%, were used as inert gases to purge the reactor at a 30 mL/min flow rate for 3 min during each specific experiment. Subsequently, the adjusted flow rates were 5, 17.5, and 30 cm3/min according to the experimental design of the pyrolysis. The inert gas displaced the air, or any other gases present, in the reactor before operation. The furnace heating rate was at 50 °C, but the biomass heating rate was operated at ≥33 °C/min to reach a reaction temperature of 600 °C, and then held for 1 h before cooling to room temperature (reaction and cooling time). The appearance of fuming was observed at 15 min and disappeared after 30 min of operation. At the end of the experiment, the inert gas flow rate was increased to 30 mL/min for 3 min to purge all the gas residues inside the reactor. The gas went through a series of two condensers in an ice bath, and finally into a water scrubber before being released or discharged through the laboratory exhaust. The biochar was collected from the reactor outlet after the unit was cooled to less than 40 °C. The products were collected, weighed, and the product yields were calculated with equations (2–4). The bio-oil was stored in a freezer at 4 °C, while the biochar was stored in a plastic bag for further chemical and physical characterization, without further treatment.
Bio-oil Yield (wt.%) = (Bio-oil Weight (g))/(Weight of BGS (g)) × 100
Biochar Yield (wt.%)) = (Biochar Weight (g))/(Weight of BGS (g)) × 100
Gas Yield (wt.%) = 100 − (Bio-oil Yield (wt.%) + Biochar Yield (wt.%))

2.4. Products Characterization

2.4.1. Bio-Oil Characterization

Proximate analysis (HHV) and ultimate analysis (CHNS) were measured, as discussed in Section 2.2. The pH value of the bio-oil samples was measured using a digital handheld pH meter (PH100 ExStik® pH Meter, China), pre-calibrated with pH 4.0, 7.0, and 10.0 buffer solutions. The density of the bio-oil was measured using a density meter (DMA 4500 M, Anton Paar, Ashland, VA, USA).

2.4.2. Gas Chromatography and Mass Spectrometry (GC-MS) Analysis

The composition of bio-oil was analyzed using a GC-MS analyzer (GC Clarus 680, Perkin Elmer, Waltham, MA, USA) with the Elite—5MS (Perkin Elmer) capillary column (30 m × 0.25 mm, film thickness 0.25 μm). The bio-oil sample for GC-MS analysis was prepared at 1:10 w/w ratio of bio-oil to methanol and filtered through a 0.45 µm polyether sulfone syringe filter. The sample volume of 1 μL was injected at 250 °C in split mode, with a split ratio of 51:1. The temperature ramps of the GC oven were as follows: Initial heating at 40 °C, held for 2 min, increased by 10 °C/min to 300 °C, and sustained for 10 min. The helium carrier gas flow was 1 mL/min. Eluted compounds from the column passed through the transfer line at a temperature of 250 °C into MS Clarus SQ 8 S (Perkin Elmer): 40 to 600Da. The solvent delay was 3.00 min. Electron ionization (EI), used in MS and standard mass spectra recorded, were at ionization energy of 70 eV. The comparison of identified mass spectra was with the mass spectra of compounds from the NIST library.

2.4.3. The Fourier Transform Infra-Red (FTIR) Spectroscopy

The FTIR characterization was conducted using attenuated total reflectance (ATR) (Perkin Elmer Frontier MIR/FIR Spectrometer (Part Number: L1280044) with PIKE GladiATR). The bio-oil samples (1–2 drops) were applied and confirmed on the ATR node. The spectra record with scans 20 and a step size of 4 cm−1 within 400–4000 cm−1 wavenumbers.

2.4.4. Biochar Characterization

Proximate analysis (HHV, Volatile Matter (VM), Ash Content (AC), Fixed Carbon (FC)), and Ultimate analysis (CHNS) were measured as discussed in Section 2.2. FESEM and EDX (Field Emission Scanning Electron Microscope/Energy Dispersive X-ray) analysis (FEI Quanta 400F model and INCA 400 Oxford instrument with X-Max Detector, Hillsboro, OR, USA) were conducted to determine the morphology and elemental composition. Biochar was examined via FESEM/EDX with an accelerating voltage of 20 kV to verify the morphology. FTIR analysis of biochar samples were performed as mentioned in Section 2.4.3, in which a pinch of biochar samples was placed and screwed on the ATR sample holder for analysis.

3. Results

3.1. Feedstock Properties

The BGS feedstock properties constitute HHV, MC, AC, VM, FC as 15.7 MJ/kg, 10.7 ± 0.3 wt.%, 10.0 ± 0.7 wt.%, 67.3 wt.%, and 12 wt.%, respectively. The CHNS analysis of BGS biomass resulted in 39.7, 6.0,1.2, 0.3, and 42.8 wt.% for carbon, hydrogen, nitrogen, sulphur, and oxygen, respectively.

3.2. The Product Yields

Figure 2 shows the yields of intermediate pyrolysis products at 5, 17.5, and 30 mL/min flow rates for different inert gases (N2, CO2, and N2/CO2). In the pyrolysis of BGS, the resulting bio-oil and the gas generally maintained an average equal yield across the different inert gases and their flow rates. Figure 2 shows the bio-oil yields for the gases (N2, CO2, and N2/CO2) used and their respective flow rates, such as 5, 17.5, and 30 mL/min. The inert gas does not significantly affect the product yield examined in this study. In a similar study, there was little or no difference in product yield (bio-oil) in the various atmospheres (Ar, N2, and CO2), ranging from 23.56–32.88%, with CO2 recording the most negligible yield of 25.25% and Ar was 32.88% of the initial mass of the Brewer’s Spent Grain (BSG) at 600 °C [25].
There was a slight increase in biochar when the flow rate of CO2 increased from 17.5 to 30 mL/min, which can be the result of carbon capture from Ca or other alkaline metals in biomass. A modest degree of carbon capture can be expected at a higher flow rate of CO2 at 30 mL/min. A relative increase in biochar was noticed for the increase in flow rate of pyrolysis gases N2 and CO2. However, their combined effect declined biochar yield for the increase in N2/CO2 flow rate, from 17.5 to 30 mL/min. It can be deduced that, at a higher flow rate, carbon capture from CO2 cannot occur. However, more heat distribution can happen due to the combined effect of a higher flow rate of N2 and a lower heat capacity of CO2. Therefore, a simultaneous increase was observed in both bio-oil and gas. The carbon content in the biochar of CO2 was the highest from the CHNS in Table 2. According to Guizani et al., CO2 had an impact on gas, biochar yield, and their respective properties [13]. Bieniek et al. investigated the effect that carrier gases (argon, nitrogen, and carbon dioxide), at 500, 600, and 700 °C, have on the quality and yield in a brewer’s spent grain intermediate pyrolysis. When the temperature increased from 500–700 °C, the char yield decreased from 28 wt.% to 19 wt.%. However, the char obtained in the CO2 atmosphere had approximately 2% more carbon, but had no effect on the combustion properties (ignition and burnout temperatures). In addition, the acid concentration of oil fraction depended on the order of the carrier gas, as Ar > N2 > CO2. [25]. CO2, as a reaction medium, provides thermal cracking of harmful organic compounds and significantly improves the thermal efficiency of biomass pyrolysis, yielding a more intense biomass decomposition than in an N2 atmosphere, and improves biochar adsorption capacity [26].

3.3. Bio-Oil Energy and pH of Bio-Oil

Figure 3 shows the HHV of the bio-oil produced in the presence of carrier gases: nitrogen, carbon dioxide, and flue gas, at varying flow rates. During the investigation, the HHV for N2 was lower in the pyrolysis products than its raw biomass and CO2 or N2/CO2. There was no significant difference between the HHV of bio-oils produced in the presence of CO2 or N2/CO2, as the standard deviation was approximately two, which was a trend in HHV for bio-oils across the flow rates. The reason for the high standard deviation for BGS-N2 bio-oil could be the heterogeneous nature of bio-oil. In the presence of N2/CO2, the HHV of bio-oil was higher, at 17.5 mL/min, compared to other flow rates (5 & 30 mL/min). This suggests that CO2 influences bio-oil HHV; however, as the flow rate increased, the HHV decreased, due to the high amount of N2. These observations revealed that the high flow rate of N2 promoted the decomposition of biomass, and many high calorific value components escaped as uncondensed gas. Similar results were noticed for yard waste torrefaction in inert gases (N2, CO2, and N2/CO2) environments. Carbon dioxide gave the best carrier gas for improved energy, in which HHV enhanced from 15.6–22.2 MJ/kg [27]. This depicts the significant impact of CO2 as an inert gas. As reported by Jaideep et al. [27], carbon dioxide was the best carrier gas among N2, CO2, and flue gas in energy intensification, as it enhanced the HHV and the energy yield. The torrefied yard waste study concluded that the lower heat capacity of CO2 might be responsible for the improvement of the properties of the torrefied waste [27]. According to Onsree et al. [28], CO2 in the reacting gas (0–18% v/v balanced with N2) concentration with higher torrefaction temperatures enhances solid yields, which enables (i) overall higher thermal inertia as the specific heat of CO2 is more significant than N2, and N2 removes some heat in the process, and (ii) chemical reactions, as well as the catalytic reaction of CO2 with the feed (biomass pellets) [28].
In Figure 3, the pH value of the bio-oil produced was 5.2–7, while bio-oil produced in the presence of N2/CO2 had an almost neutral pH and was in the range of some biomass pyrolysis studies in Table 1. The GC-MS analysis results affirmed that this study recorded minimum acid in the pyrolysis bio-oil. Pyrolysis of agricultural and natural resources reported a bio-oil with a pH ranging between 2.8–4.0 [29]. According to Aziz et al., the esterification process has improved the pH value from 3.37 to 5.09–5.12 [30]. The tendency of the pH value of the produced bio-oil in this study towards neutrality may be due to esters present in the bio-oil BGS samples of the GC-MS analysis in Table 3, which is quite remarkable. The bio-oil could be useful in avoiding corrosion during application in industries, machinery, and the transportation sector as an energy source.
The CHNS analysis in Table 2 shows the raw biomass with 39.7 wt.%, compared with the bio-oil products with high carbon content (C) of 53.6–60.5 wt.%, representing an improved carbon content. Similarly, the biochar C from CNHS analysis was at 50.0–58.1 wt.%, which, relatively, agreed with the EDX surface analysis at 50.1–68.7 wt.%. Carbon content of biochar for EDX analysis showed that BGS-N2 had higher carbon than the other two biochar samples, which is in contrast to the CHNS results. One would expect the presence of some carbon capture of CO2 during pyrolysis, in the form of carbonates for the other two biochar samples. Therefore, BGS-CO2 and BGS-N2/CO2 biochar have high carbon content than BGS-N2, however, EDX analysis cannot detect this carbon. In addition, EDX is a locally specialized analysis and, therefore, some surfaces can have higher amounts than other surfaces. The inert gas, N2, showed the highest bio-oil carbon content, while CO2 had the lowest amount of carbon. As mentioned earlier, N2 promoted biomass decomposition, producing more carbon in bio-oil. The hydrogen contents of the bio-oils were ≤3.04 wt.%, while the hydrogen contents of all of the biochar were ≤2.72 wt.%, which were relatively low for bio-oil compared to other studies. Similar hydrogen contents for biochar were noted in the literature [31]. The nitrogen contents (N) for the bio-oils were ≤2.6 wt.%, whereas for biochar they were recorded as 2.0 ± 0.0 wt.%. The sulphur contents (S) in bio-oils were ≤0.377 wt.%, which were above the set standards of 0.05 mass% in ASTM D7544. The studied bio-oils H/C ratios were 0.58–0.6, which were lower than that of the raw BGS (1.8). The bio-oil H/C ratios tended toward the coal and anthracite.

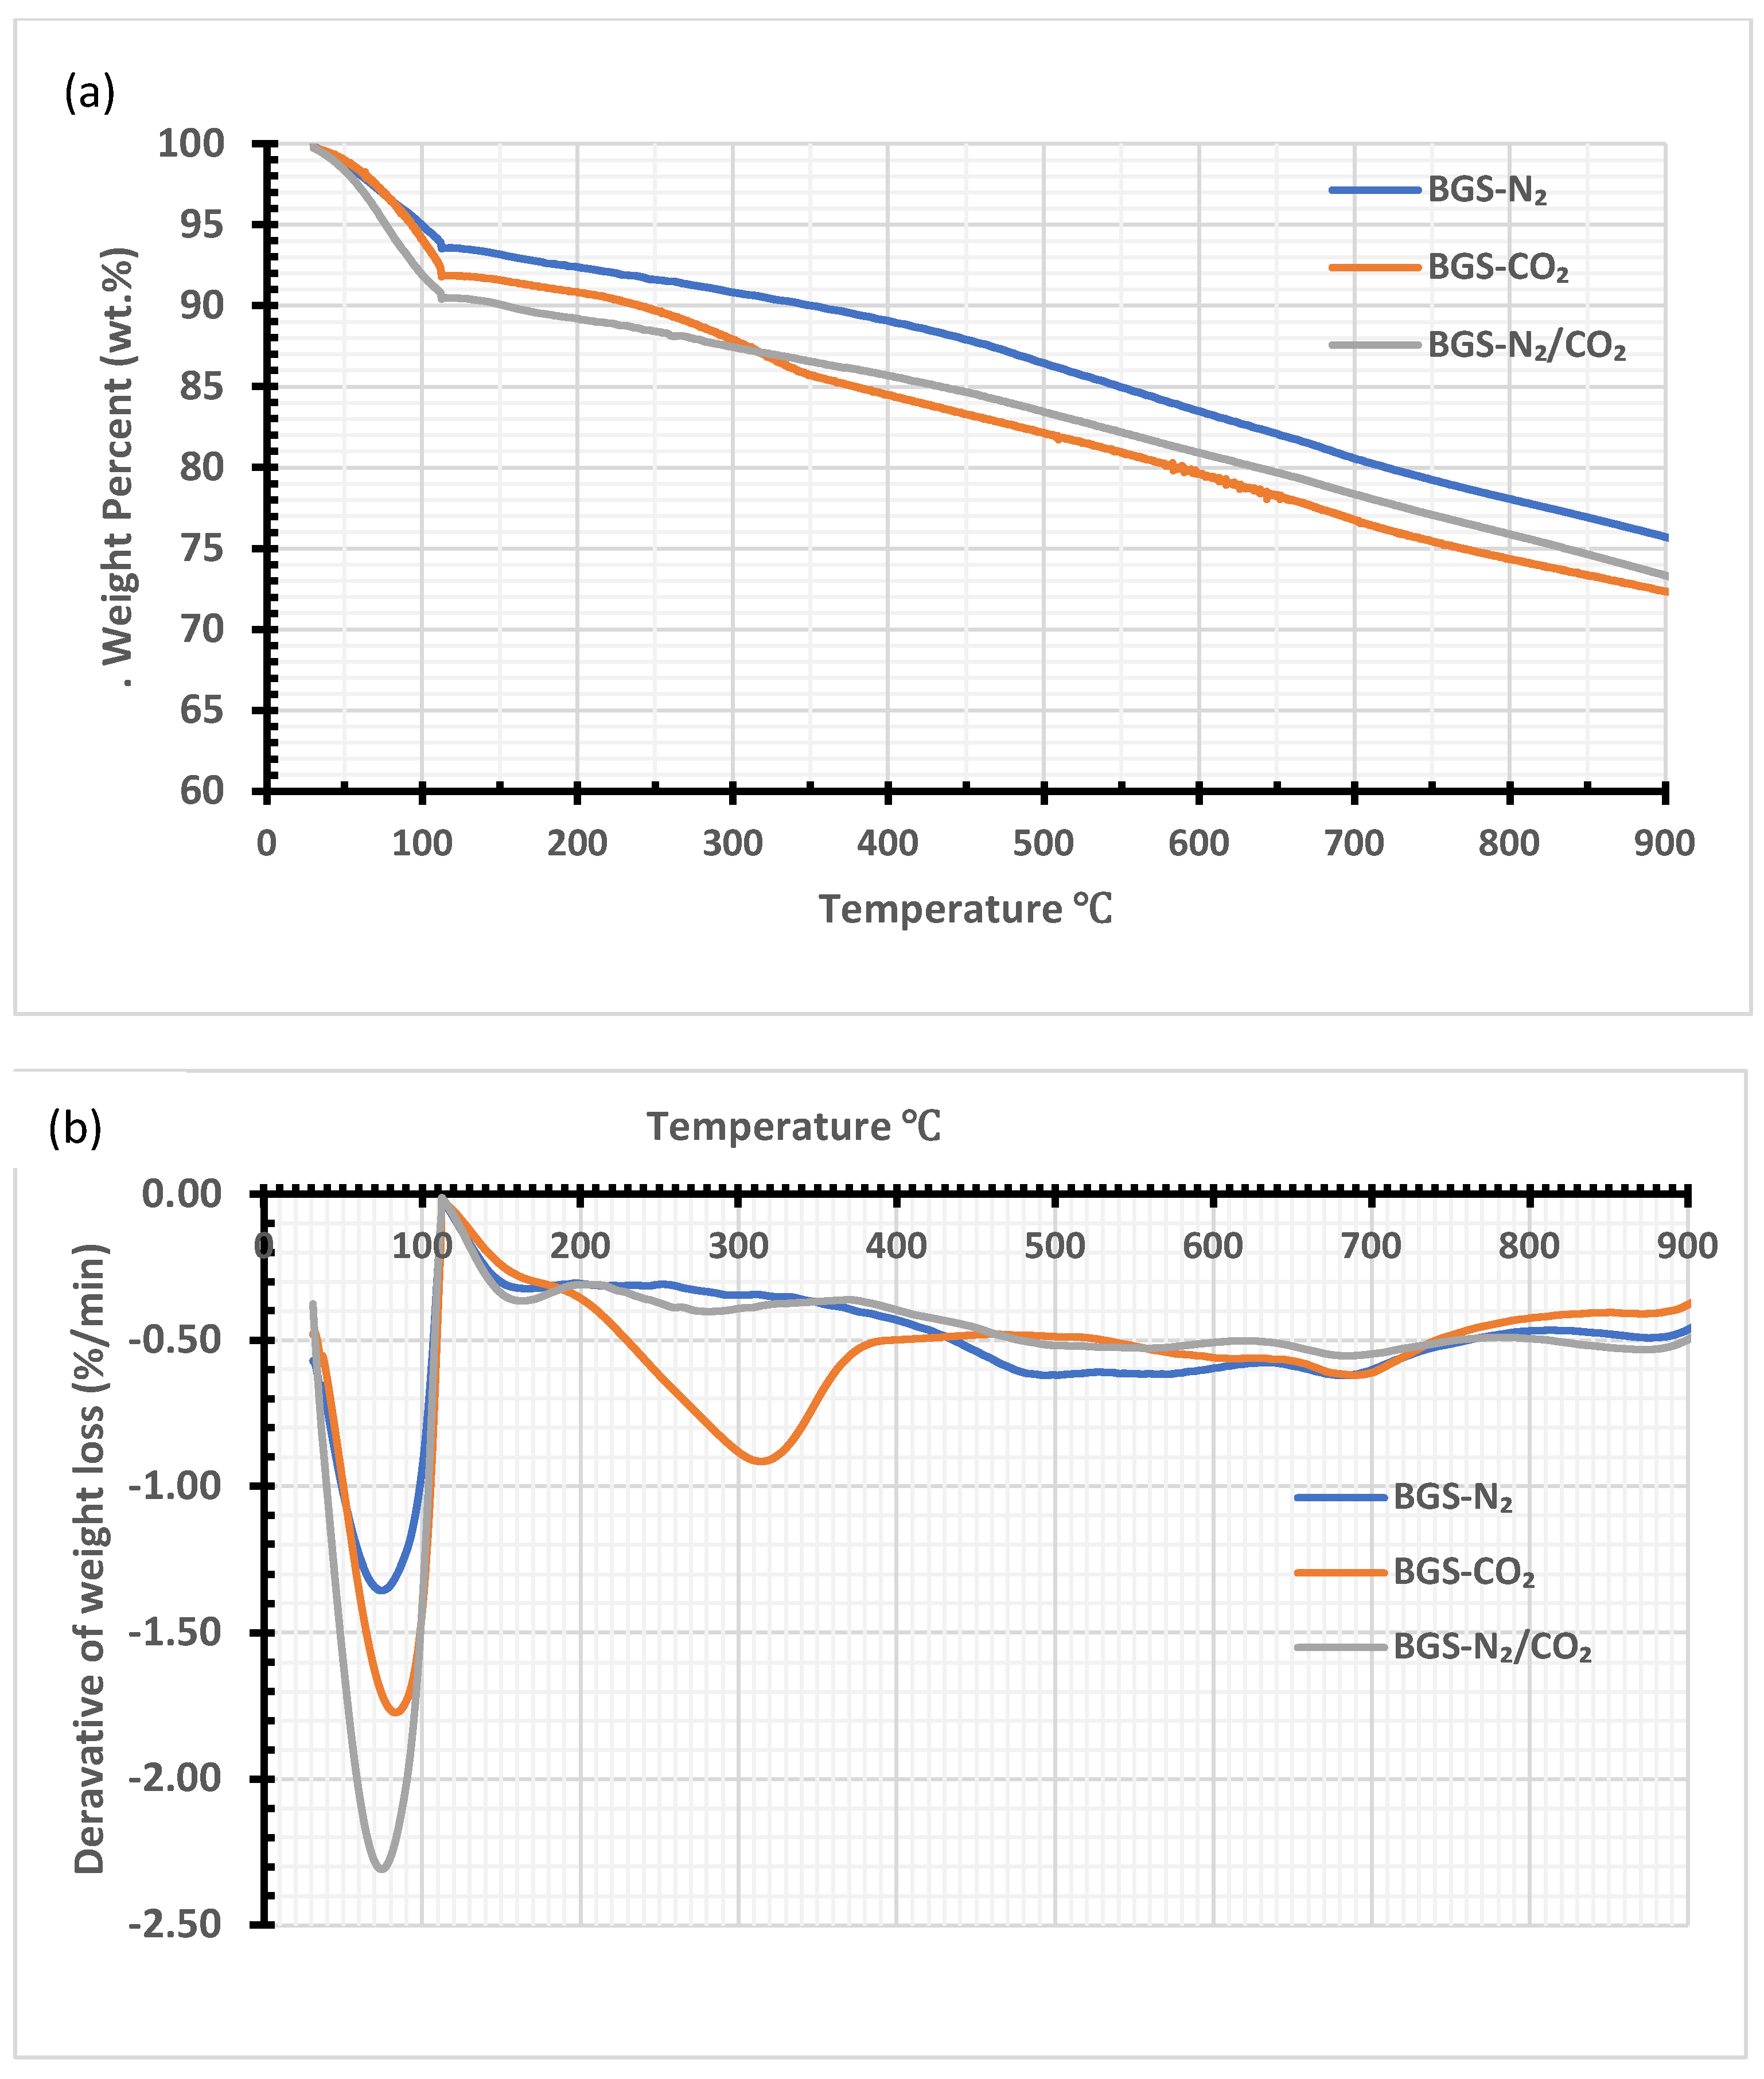
3.4. Thermogravimetric Analysis

The thermal degrading behavior of BGS-N2, BGS-CO2, and BGS-N2/CO2 biochar samples were analyzed. The TGA in Figure 4 shows moisture content (MC) removal, within 30–120 °C, for BGS-N2 (6.83 wt.%), BGS-CO2 (8.84 wt.%), and BGS-N2/CO2 (9.52 wt.%). In addition, the devolatilization of some light bio-oil compounds adsorbed on biochar pores occurred at this stage. The temperature ranges from 120–900 °C and there was a continuous gentle slope, which may be due to devolatilization of most of the VM that was left in the biochar. After the de-moisturization, the total weight percentage loss for BGS-N2, BGS-CO2, and BGS-N2/CO2 were 17.46, 18.75, and 16.96 wt.%, respectively. Biochar has higher thermal stability, up to 900 °C, as the overall mass loss ranges from 25–28 wt.%. Similar behavior for biochar samples were noticed with ice husk biochar (RHB), rice straw biochar (RSB), maize stover biochar (MSB), and sugarcane biochar (SCB) [32]. In the current study, biochar produced in the presence of a nitrogen atmosphere had higher stability than the biochar samples produced within the other two atmospheres.
Figure 4b shows the DTG BGS-CO2 degradation, which is different to the other two biochar degradations. At approximately 200–300 °C, an increasing weight loss for the BGS-CO2 biochar occurred. Although there were no significant differences in bio-oil or biochar yields at different gases, the number of compounds identified in the GC-MS analysis of bio-oil for BGS-CO2 was lower than that of the bio-oils from BGS-N2 and BGS-N2/CO2. Therefore, BGS-CO2 had some unidentified higher molecular range compounds which could not be detected in the GC. The presence of similar compounds can be expected on biochar that have been devolatilized at this temperature.

3.5. FT-IR Analysis

The FTIR spectra of the bio-oil and biochar (BGS-N2, BGS-CO2, and BGS- N2/CO2) are in Figure 5A,B. The inert gases do not significantly affect the disparity among the products (bio-oil and biochar). The functional group, above the 1500 cm−1 wavenumbers, most likely contains aliphatic (C-H), unsaturated alkene (C=C), alkyne (C≡C), and alcohol (O-H) compounds. The intensity at 3300 cm−1 in the range of 3600–3000 cm−1 is broad and short, indicating that H-bonding is very polar, and grouped as O-H stretching primarily contains alcohol (O-H) or carboxylic (C=O). In contrast, the wavenumber within 2950–2800 cm−1 had a sharp and short intensity at 2920 which is non-polar and likely an alkane [33], with C-H stretching in the bio-oil and biochar.
In Figure 5A, BGS-CO2 and BGS-N2/CO2 had a medium peak, or less intensity, compared to the BGS-N2 at 1695 cm−1, most likely as ketone group (C=O) is approximately at 1700 cm−1. No significant difference was observed in this peak intensity for bio-oils from three different gases. However, BGS-CO2 and BGS-N2/CO2 had more ketone presence in bio-oil for the GC-MS analysis compared to BGS-N2. In contrast, in Figure 5B, the peak at 1600 cm−1 (C=C) was more potent than that at 1695 cm−1, for BGS-N2.
In Figure 5A, the fingerprint at 1660 cm−1 frequency was a terminal alkene with small intensity, but was more pronounced in BGS-CO2 than BGS-N2 and BGS-N2/CO2; while in (b), BGS-N2 was more pronounced than BGS-CO2 and BGS-N2/CO2 for biochar. The ester (C-O), and possibly the carboxyl group (1220), lie at 1200 cm−1, with more intensity in BGS-CO2 biochar than in bio-oil. Another interesting comparison occurred at 1100 cm−1, which was likely an alcohol or ester (C-O) band [34], with the C–O stretching vibration in both bio-oil and biochar. However, this was only evident in BGS CO2 biochar. These C–O chemical bonds might result from phenols and partial lignin decomposition [35]. The fingerprint at 750 cm−1 was identified as an aromatic (ortho) C-H stretching in bio-oil and biochar [36] in Figure 5A,B.

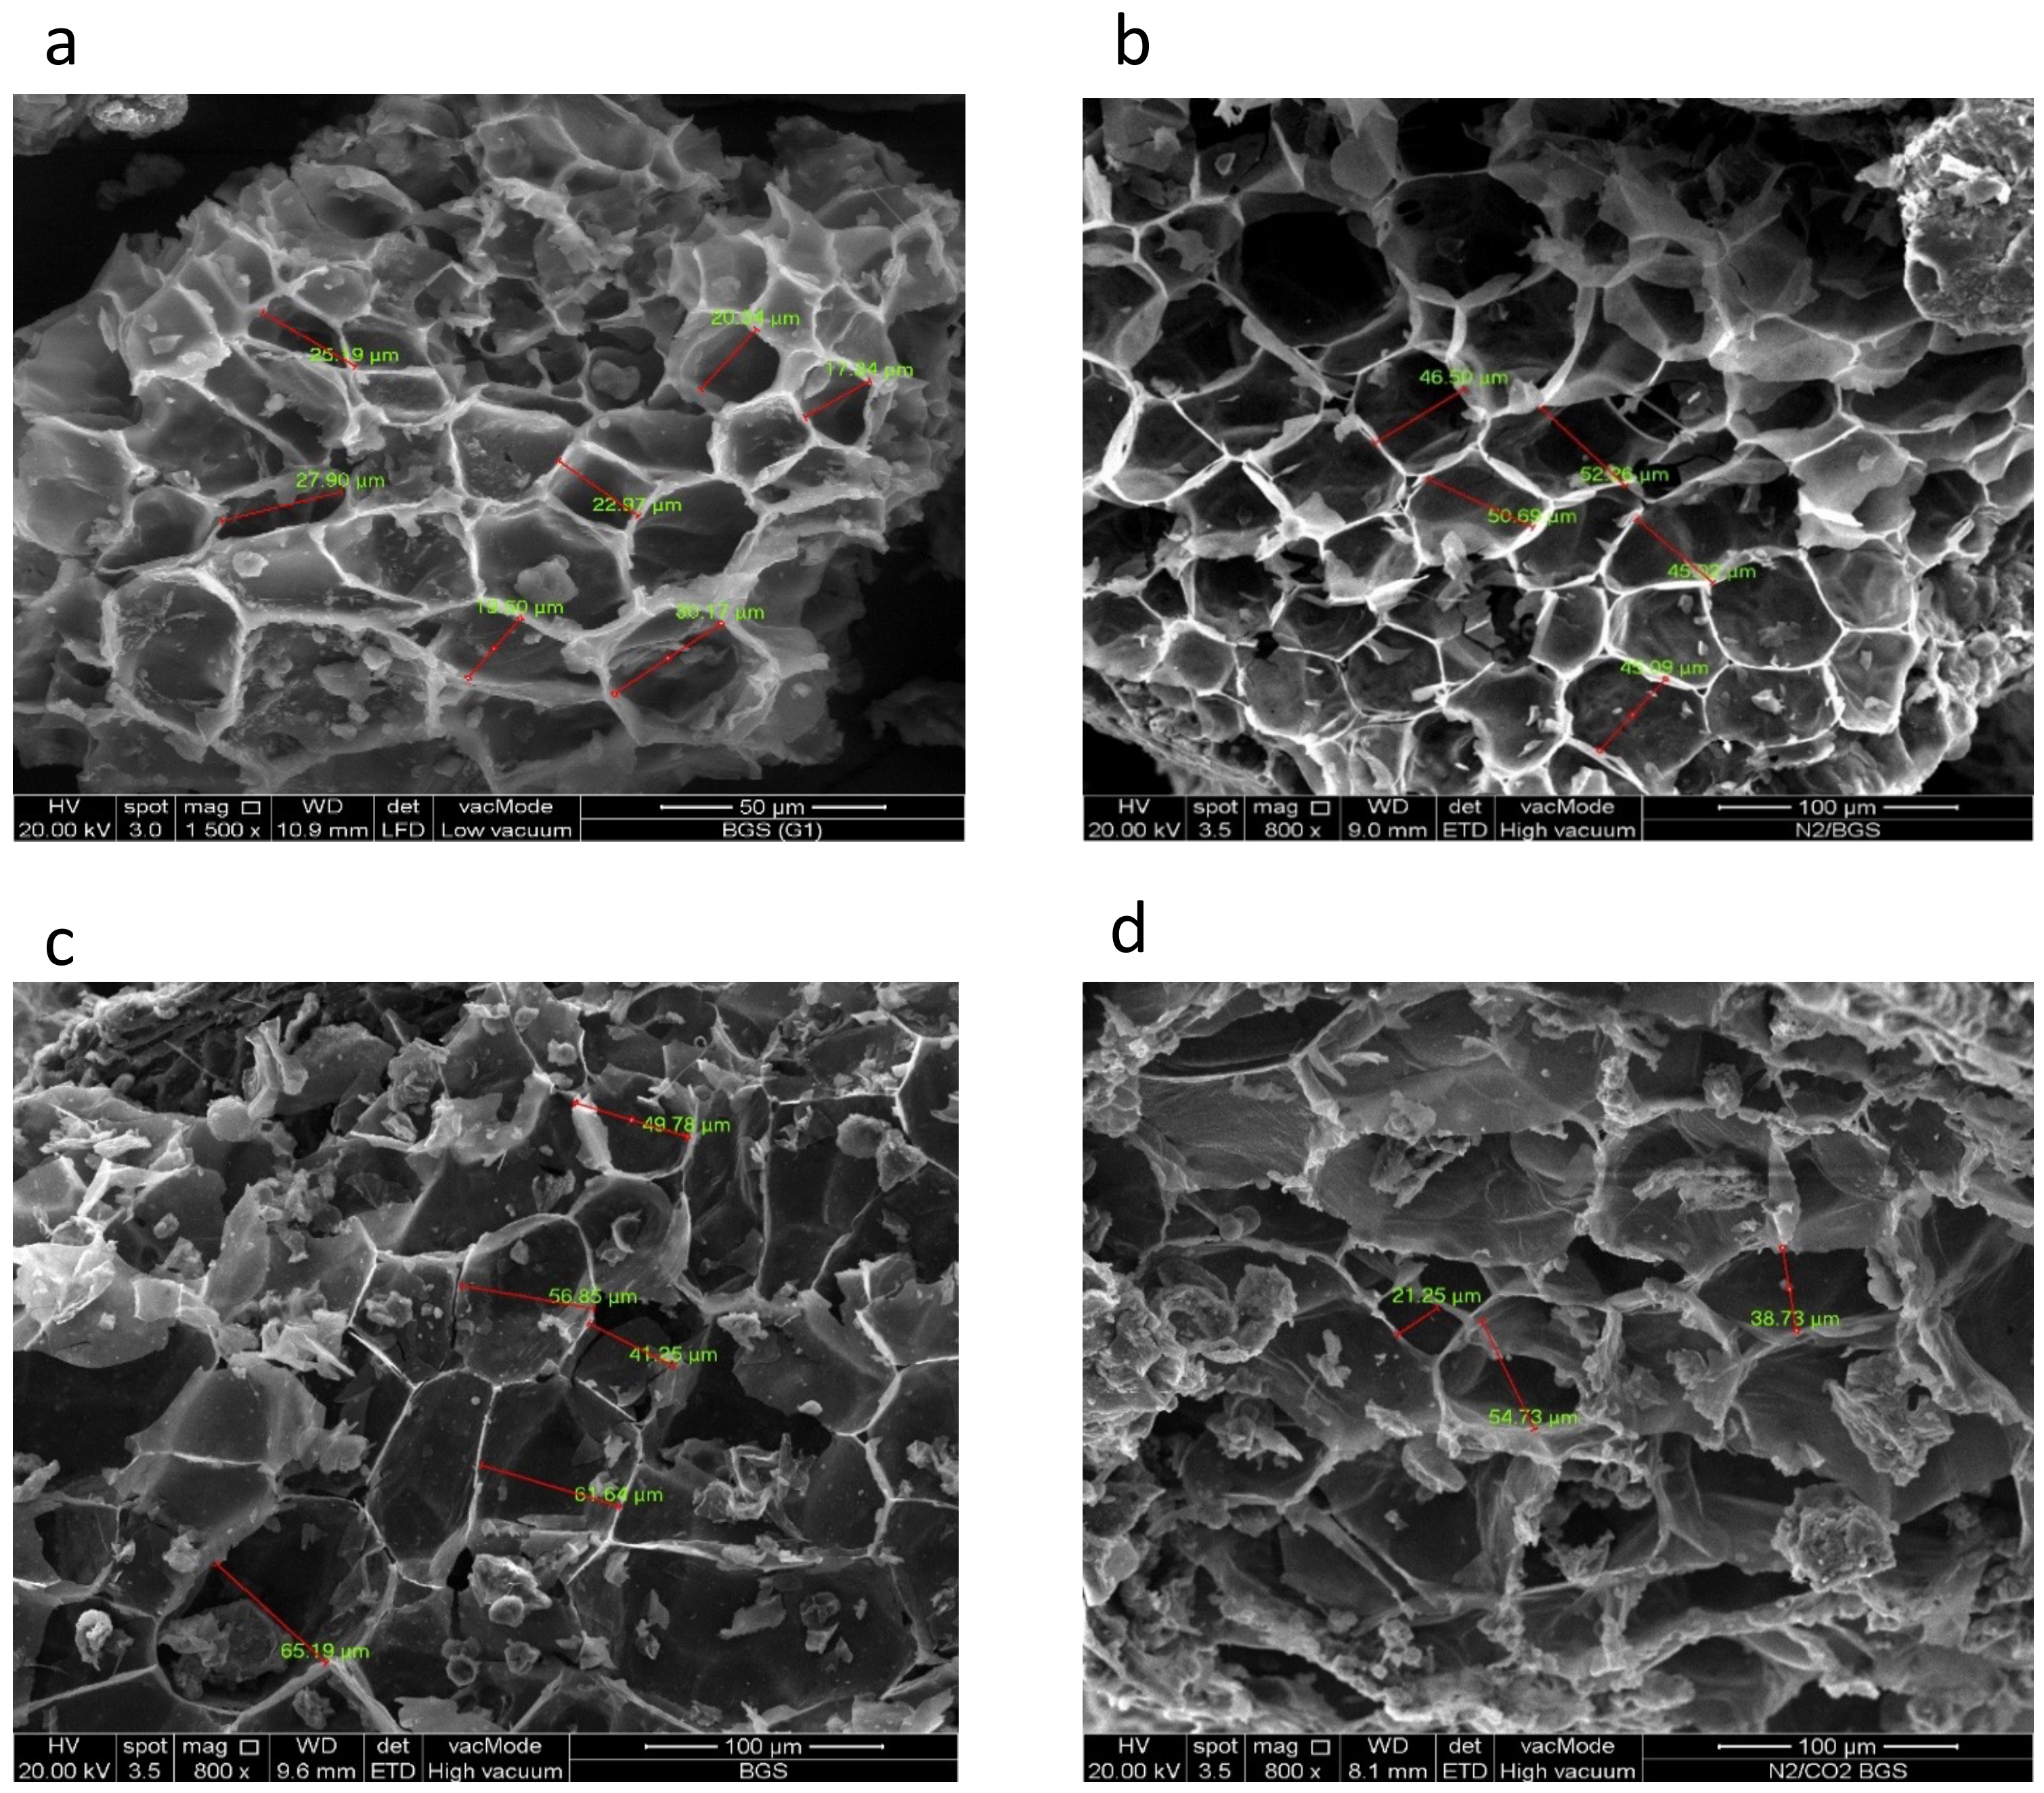
3.6. FESEM/EDX Analysis

Figure 6 illustrates that, compared to the (a) raw BGS pore size of 17.24–30.17 µm, the biochar witnessed a honeycomb structure with an enlarging pore size. The best recorded data, in descending order based on pore size, were: BGS-CO2 (41.3–65.2 µm) ≥ BGS-N2/CO2 (21.3–54.7 µm) ≥ BGS-N2 (45.02–52.26 µm). The high porosity and carbon content suggested its effective use as an activated carbon adsorbent for environmental applications, after physical or chemical activation. The tendency of CO2 to react with hydrogenated and oxygenated groups provided a higher surface area for biochar [26]. According to Guizani et al., biochar obtained in a CO2 environment had an almost six times increase in surface area and had a different chemical composition compared to the N2 environment [13]. The biomass pyrolysis of volatile organic carbon and thermal cracking from peat pyrolysis was enhanced in CO2, producing a larger biochar surface area in CO2 than N2 atmosphere [37]. It was evident that CO2 and N2/CO2 produced an increase in the pore size, and a large surface area, of the biochar. However, CO2, as an inert gas in the pyrolysis of food waste, affected the composition of the vapors and probably inhibited cyclic component formation, which is hazardous to the environment and to human health [38].

3.7. Bio-Oil Chemical Composition through GC-MS

The GC-MS analysis shows all the compounds that matched with the NIST library (R-match more than 700). Identified compounds accounted for the total area percentage of the bio-oils from BGS-N2, BGS-CO2, and BGS-N2/CO2, which were 34.5, 50.2, and 65. area%, respectively. All the compounds were categorized as alkene, acid, benzenes, ketone, phenols, alcohol, aldehyde, alkyl, and ester. The GCMS chemical composition indicated many aromatic compounds of tar formation, the most abundant compounds were ketone, phenol, and benzene. BGS-N2/CO2 showed the highest area percentage of the retrieved chemicals in the bio-oil products. A previous study mentioned that CO2 in biomass pyrolysis provides thermal cracking of harmful organic compounds, enhances syngas generation, and suppresses benzene derivatives and polycyclic formation of aromatic hydrocarbons [26]. This study showed that benzene derivatives were more suppressed in N2/CO2 and CO2 than N2. The BGS-CO2 and BGS-N2/CO2 had the highest chemical composition yields, and phenol derivatives were present in relatively higher amounts for N2/CO2 atmosphere, compared to the other two gas atmospheres, as presented in Table 3. Chromatograms are given in the Supplementary Materials.
The cellulose bio-oil pyrolysis yields: anhydrosugars, furans, ketones, acids, aldehydes, alcohols, phenols, and hydrocarbon compounds. Levoglucosan is the major product [39]. This study revealed the decline of anhydrosugar and no levoglucosan was detected. The Table 3 GCMS shows that BGS-CO2 and N2/CO2 had similar compounds compared to BGS-N2 for the ester and alcohol groups. However, most of these ketones and alcohols are higher molecular weight compounds. As discussed in Section 3.3, more cracking occurs in the presence of nitrogen gas compared to the other two gases. The Ketonization reaction converts carboxylic acids to ketones and releases CO2 and H2O, effectively reducing the acids’ corrosiveness [39]. The number of ketones in BGS-N2 was lower than the other two gases, which resulted in slightly high levels of acid for BGS-N2 bio-oil. The acids reported in Table 3 were higher organic acids and therefore they do not significantly contribute to bio-oil pH. Lignin is composed of phenylpropane structural units and the main components in the lignin bio-oil are phenols and its derivatives. Further cracking of phenols provides benzene and its derivatives. The amount of benzene derivatives was higher for BGS-N2 compared to the other two gases. In the case of phenol derivatives, BGS-N2 had a lower amount. These results ensure further cracking in the presence of Nitrogen gas.
The GC-MS results conclude that the presence of three inert gases have similar mechanisms as those reported in the literature for cellulose, hemicellulose and levoglucosan [40,41,42]. However, unhydrosugar compounds were not available from the cellulose pyrolysis of BGS. The intensity of cracking varies. Nitrogen gas causes more intensified cracking than CO2, whereas N2/CO2 gas had a combined effect of intensified cracking of N2 and low heat capacity of CO2.
Table 3. The GCMS identified compounds in bio-oil and their area percentage produced in presence of N2, CO2, and N2/CO2 inert gases at 17.5 mL/s.
#ALKANEBGS-N2BGS-CO2BGS-N2/CO2
1(+)-2-Aminoheptane 1.737
2Tridecane0.2740.502
3Heptadecane, 2,6,10,15-tetramethyl- 0.578
4Stigmastan-6,22-dien, 3,5-dedihydro- 0.527
Sub-Total0.2741.6071.737
ALKENE
5Cyclobutene, 2-propenylidene- 1.528
6Naphthalene, 2,2-dimethyl-1-oxa-2-sila-1,2-dihydro-0.273
Sub-Total0.2731.5280
AMIDE
7Pyrimidine, 4,5-dimethyl- 0.687
8Nonadecanamide 0.541
Sub-Total01.2280
ALDEHYDE
9Pentanal, 2,3-dimethyL- 0.969
Sub-Total00.9690
ALCOHOL Derivatives
101-Propanol, 2-amino-, (ñ)- 1.737
11Oxiranemethanol, (R)- 0.859
12Cyclobutanol 0.506
131,6-Heptadien-4-ol 0.383
14Ethanol, 2-(9,12-octadecadienyloxy)-, (Z,Z)- 0.476
Sub-Total00.4763.485
ESTER
15Nicotinic acid, 2-phenylethyl ester 0.637
16Formic acid, tetrahydrofurfuryl ester 0.354
17Propanoic acid, 3-chloro-, 4-formylphenyl ester 1.004
18Oxalic acid, 2-isopropylphenyl pentyl ester 0.887
19Hexadecanoic acid, methyl ester 0.678
2012,15-Octadecadienoic acid, methyl ester 0.528
216-Octadecenoic acid, methyl ester, (Z)- 2.736
Sub-Total05.5831.241
CARBOXYLIC ACID
22Butanoic acid, 4-hydroxy- 1.004
23Phosphonic acid, (p-hydroxyphenyl)-3.1250.463
24n-Hexadecanoic acid0.3573.9910.463
25trans-13-Octadecenoic acid 0.887
Sub-Total3.4826.3450.463
PHENOL Derivatives
26Phenol3.1254.6969.849
27Phenol, 2-methyl-2.203
28Phenol, 3-methyl-3.6892.93613.947
29Phenol, 2-methoxy-1.618
30Phenol, 3-methyl- 4.507
31Phenol, 2-methoxy- 3.5574.165
32Phenol, 2,6-dimethyl-0.4450.531.021
33Phenol, 2,5-dimethyl-
34Phenol, 2-ethyl-0.54 1.095
35Phenol, 2,5-dimethyl-1.667 2.359
36Phenol, 4-ethyl-1.2681.4773.599
37Phenol, 2-ethyl-5-methyl-0.371 0.763
382-Methoxy-5-methylphenol 1.0540.642
39Phenol, 3,4-dimethyl- 0.4540.384
40Phenol, 2,3,5-trimethyl- 0.407
41Phenol, 2-ethyl-4-methyl-1.233 1.279
42Phenol, 3,4,5-trimethyl- 0.476
43Phenol, 4-ethyl-3-methyl- 0.8491.141
44Phenol, 3-propyl-0.4310.6910.776
45Phenol, 4-ethyl-2-methoxy 1.789
462,5-Diethylphenol0.33 0.831
47Phenol, 2-ethyl-4,5-dimethyl- 0.618
482-Methoxy-4-vinylphenol 0.975
49Phenol, 2,6-dimethoxy0.3210.7610.748
50Phenol, 2-methoxy-4-propyl- 0.7360.562
51Phenol, 2-methoxy-6-(2-propenyl)-0.4480.9841.116
Sub-Total17.68924.32647.448
KETONE
523-Hexanone 0.552
53Cyclopentanone 0.5561.005
54Cyclopentanone, 2-methyl-0.229
552-Cyclopenten-1-one 0.449
56Cyclohexanone 0.933
57Cyclopentanone, 2-methyl- 0.7
582-Cyclopenten-1-one, 2-methyl-0.3190.7530.874
592-Cyclopenten-1-one, 3,4-dimethyl-0.3231.6782.11
Sub-Total0.8713.6875.923
BENZENE Derivatives
60Benzene, 1,3-dimethyl-0.3090.6190.816
61Benzenepropanoyl bromide0.2360.6370.452
62Benzene, 1,2,3-trimethy0.367
63Benzene, 1-ethyl-2-methyl- 0.358
643-Butynylbenzene 1.319
65Benzene, pentyl- 1.052
66Benzene, 1-methoxy-4-methyl-0.499
67Benzene, 1,4-dimethoxy-2-methyl-0.9212.138
682,5,6-Trimethylbenzimidazole0.241 0.464
691,2-Diethoxy-4-ethylbenzene 0.404
70ndolizine, 1-methyl- 0.415
711,4-Benzenediol, 2,5-dimethyl-0.278
72Benzene, 1,1’-(diazomethylene)bis- 0.439
73Benzene, (nitromethyl)-6.682
75Benzonitrile, 2-(4-benzyloxybenzylidenamino)-1.984
77Benzonitrile, m-phenethyl-0.408
Sub-Total11.9254.4464.667
Total34.51450.19564.964

4. Conclusions

The yields of bio-oils at different flow rates in the presence of N2, CO2 or N2/CO2 did not change significantly. The pH values ranged from 5.2 ± 0.1–5.8 ± 0.9, which showed a minimum presence of acids in bio-oil. HHV analysis of bio-oil showed that CO2 presence influenced the HHV positively. However, N2 promoted the decomposition of high calorific value components, which reduced HHV. The CHNS showed that the hydrogen content of bio-oil was very low: ≤3.04 wt.%. The thermogravimetric analysis showed that biochar had high thermal stability and ≥74 wt.% remained at 900 °C. The GC-MS analysis revealed that the N2/CO2 ratio favored alcohol and phenol production as nitrogen gas for benzene and CO2 for high molecular weight carboxylic acid formation.

Supplementary Materials

The following are available online at https://www.mdpi.com/article/10.3390/en15228421/s1, Figure S1: The GC-MS chromatogram for bio-oil produced during the pyrolysis in presence of N2 inert gas at 17.5 mL/min, Figure S2: The GC-MS chromatogram for bio-oil produced during the pyrolysis in presence of CO2 inert gas at 17.5 mL/min, Figure S3: The GC-MS chromatogram for bio-oil produced during the pyrolysis in presence of N2/CO2 inert gas at 17.5 mL/min.

Author Contributions

Experimentation, original draft preparation, investigation, analysis: M.D.I.; Co-supervision, project administration, review and editing: Y.A.A.; Co-supervision, review and editing: S.G.; review and editing: L.Y.L.; Conceptualization, validation, formal analysis, review and editing, supervision: S.T.-G. All authors have read and agreed to the published version of the manuscript.

Funding

Student received funding from Petroleum Technology Development Fund, Abuja, Nigeria (PTDF/ED/OSS/PHD/POF/1323/17) for his PhD studies.

Institutional Review Board Statement

Not applicable.

Informed Consent Statement

Not applicable.

Data Availability Statement

Not applicable.

Acknowledgments

Author’s appreciation and thanks go to the sponsors of our PhD scholarship, Petroleum Technology Development Fund, Abuja, Nigeria (PTDF/ED/OSS/PHD/POF/1323/17) and Abubakar Tafawa Balewa University (ATBU), Bauchi, Nigeria. However, only the authors are responsible for the opinions expressed in this paper and for any remaining errors.

Conflicts of Interest

The authors declare no conflict of interest.

References

  1. IRENA. Renewable Capacity Statistics 2020; International Renewable Energy Agency (IRENA): Abu Dhabi, United Arab Emirates, 2020; ISBN 978-92-9260-239-0. [Google Scholar]
  2. Kumar, M.; Rai, D.; Bhardwaj, G.; Upadhyay, S.N.; Mishra, P.K. Pyrolysis of peanut shell: Kinetic analysis and optimization of thermal degradation process. Ind. Crops Prod. 2021, 174, 114128. [Google Scholar] [CrossRef]
  3. Sipra, A.T.; Gao, N.; Sarwar, H. Municipal solid waste (MSW) pyrolysis for bio-fuel production: A review of effects of MSW components and catalysts. Fuel Process. Technol. 2018, 175, 131–147. [Google Scholar] [CrossRef]
  4. Waluyo, J.; Makertihartha, I.G.B.N.; Susanto, H. Pyrolysis with intermediate heating rate of palm kernel shells: Effect temperature and catalyst on product distribution. AIP Conf. Proc. 2018, 1977, 020026. [Google Scholar] [CrossRef]
  5. Bouai, H.; Tabal, A.; Barakat, A.; el Harfi, K.; Aboulkas, A. Optimal parameters and structural composition of bio-oil and biochar from intermediate pyrolysis of red algal biomass. Comptes Rendus. Chim. 2021, 24, 85–99. [Google Scholar] [CrossRef]
  6. Martínez, J.D.; Campuzano, F.; Agudelo, A.F.; Cardona-Uribe, N.; Arenas, C.N. Chemical recycling of end-of-life tires by intermediate pyrolysis using a twin-auger reactor: Validation in a laboratory environment. J. Anal. Appl. Pyrolysis 2021, 159, 105298. [Google Scholar] [CrossRef]
  7. Hornung, A. 2013 Intermediate pyrolysis of biomass. In Biomass Combustion Science, Technology and Engineering; Woodhead Publishing Limited: Cambridge, UK, 2013. [Google Scholar] [CrossRef]
  8. Zadeh, Z.E.; Abdulkhani, A.; Saha, B. Characterization of Fast Pyrolysis Bio-Oil from Hardwood and Softwood lignin. Energies 2020, 13, 887. [Google Scholar] [CrossRef] [Green Version]
  9. Alvarez, J.; Lopez, G.; Amutio, M.; Artetxe, M.; Barbarias, I.; Arregi, A.; Bilbao, J.; Olazar, M. Characterization of the bio-oil obtained by fast pyrolysis of sewage sludge in a conical spouted bed reactor. Fuel Process. Technol. 2016, 149, 169–175. [Google Scholar] [CrossRef]
  10. Mohammed, I.Y.; Abakr, Y.A.; Hui, J.N.X.; Alaba, P.A.; Morris, K.I.; Ibrahim, M.D. Recovery of clean energy precursors from Bambara groundnut waste via pyrolysis: Kinetics, products distribution and optimisation using response surface methodology. J. Clean. Prod. 2017, 164, 1430–1445. [Google Scholar] [CrossRef]
  11. Cai, W.; Liu, R.; He, Y.; Chai, M.; Cai, J. Bio-oil production from fast pyrolysis of rice husk in a commercial-scale plant with a downdraft circulating fluidised bed reactor. Fuel Process. Technol. 2018, 171, 308–317. [Google Scholar] [CrossRef]
  12. Kabir, G.; Din, A.T.M.; Hameed, B.H. Pyrolysis of oil palm mesocarp fiber and palm frond in a slow-heating fixed-bed reactor: A comparative study. Bioresour. Technol. 2017, 241, 563–572. [Google Scholar] [CrossRef]
  13. Guizani, C.; Sanz, F.J.E.; Salvador, S. Effects of CO2 on biomass fast pyrolysis: Reaction rate, gas yields and char reactive properties. Fuel 2014, 116, 310–320. [Google Scholar] [CrossRef]
  14. Lai, Z.; Ma, X.; Tang, Y.; Lin, H. Thermogravimetric analysis of the thermal decomposition of MSW in N2, CO2 and CO2/N2 atmospheres. Fuel Process. Technol. 2012, 102, 18–23. [Google Scholar] [CrossRef]
  15. Hou, B.; Liu, Z.; Zhao, J.; Li, C. Study on the Pyrolysis Characterization of Rice Husk Var in CO2/N2Atmosphere. In Proceedings of the 2022 4th Asia Energy and Electrical Engineering Symposium (AEEES), Chengdu, China, 25–28 March 2022; pp. 478–483. [Google Scholar] [CrossRef]
  16. Chen, J.; Zhang, J.; Liu, J.; He, Y.; Evrendilek, F.; Buyukada, M.; Xie, W.; Sun, S. Co-pyrolytic mechanisms, kinetics, emissions and products of biomass and sewage sludge in N2, CO2 and mixed atmospheres. Chem. Eng. J. 2020, 397, 125372. [Google Scholar] [CrossRef]
  17. Kim, J.H.; Jung, S.; Lin, K.Y.A.; Rinklebe, J.; Kwon, E.E. Comparative study on carbon dioxide-cofed catalytic pyrolysis of grass and woody biomass. Bioresour. Technol. 2021, 323, 124633. [Google Scholar] [CrossRef] [PubMed]
  18. Zhang, H.; Xiao, R.; Wang, D.; He, G.; Shao, S.; Zhang, J.; Zhong, Z. Biomass fast pyrolysis in a fluidized bed reactor under N2, CO2, CO, CH4 and H2 atmospheres. Bioresour. Technol. 2011, 102, 4258–4264. [Google Scholar] [CrossRef] [PubMed]
  19. Agyeman, K.; Asante, B.O.; Berchie, J.N.; Sarkodie-Addo, J.; Marno, P.; Adabah, R. Farmers’ perceptions, constraints and preferences for improved Bambara groundnut varieties in Ghana. J. Agric. Food Res. 2021, 3, 100097. [Google Scholar] [CrossRef]
  20. Ajilogba, C.F.; Olanrewaju, O.S.; Babalola, O.O. Improving Bambara Groundnut Production: Insight Into the Role of Omics and Beneficial Bacteria. Front. Plant Sci. 2022, 13, 836133. [Google Scholar] [CrossRef]
  21. Jahanshiri, E.; Von Goh, E.; Wimalasiri, E.M.; Azam-Ali, S.; Mayes, S.; Suhairi, T.A.S.T.M.; Nizar, N.M.M.; Sinin, S.S.M. The potential of Bambara groundnut: An analysis for the People’s Republic of China. Food Energy Secur. 2022, 11, 614–628. [Google Scholar] [CrossRef]
  22. Majola, N.G.; Gerrano, A.S.; Shimelis, H. Utilisation and Genetic Improvement in Sub-Saharan Africa. Agronomy 2021, 11, 1–16. [Google Scholar]
  23. Chong, Y.Y.; Gopakumar, S.T.; Gan, S.; Ng, H.K.; Lee, L.Y. Synergic Effect and Kinetic Mechanisms for Co-Pyrolysis of Empty Fruit Bunch and Palm Oil Sludge. Inst. Eng. Malaysia 2017, 78, 1–5. [Google Scholar]
  24. Tsai, W.T.; Liu, S.C.; Chen, H.R.; Chang, Y.M.; Tsai, Y.L. Textural and chemical properties of swine-manure-derived biochar pertinent to its potential use as a soil amendment. Chemosphere 2012, 89, 198–203. [Google Scholar] [CrossRef]
  25. Bieniek, A.; Jerzak, W.; Sieradzka, M.; Mika, Ł.; Sztekler, K.; Magdziarz, A. Intermediate Pyrolysis of Brewer’s Spent Grain: Impact of Gas Atmosphere. Energies 2022, 15, 2491. [Google Scholar] [CrossRef]
  26. Shen, Y.; Ma, D.; Ge, X. CO2-looping in biomass pyrolysis or gasification. Sustain. Energy Fuels 2017, 1, 1700–1729. [Google Scholar] [CrossRef]
  27. Jaideep, R.; Lo, W.H.; Lim, G.P.; Chua, C.X.; Gan, S.; Lee, L.Y.; Thangalazhy-Gopakumar, S. Enhancement of fuel properties of yard waste through dry torrefaction. Mater. Sci. Energy Technol. 2021, 4, 156–165. [Google Scholar] [CrossRef]
  28. Onsree, T.; Tippayawong, N. Torrefaction of Maize Residue Pellets with Dry Flue Gas. BioEnergy Res. 2020, 13, 358–368. [Google Scholar] [CrossRef]
  29. Sadaka, S.; Boateng, A.A. Pyrolysis and Bio Oil. Agric. Nat. Resour. 2017, 1, 1–6. [Google Scholar]
  30. Aziz, S.M.A.; Wahi, R.; Ngaini, Z.; Hamdan, S.; Yahaya, S.A. Esterification of Microwave Pyrolytic Oil from Palm Oil Kernel Shell. J. Chem. 2017, 2017, 8359238. [Google Scholar] [CrossRef] [Green Version]
  31. Shrivastava, P.; Kumar, A.; Tekasakul, P.; Lam, S.S.; Palamanit, A. Comparative Investigation of Yield and Quality of Bio-Oil and Biochar from Pyrolysis of Woody and Non-Woody Biomasses. Energies 2021, 14, 1092. [Google Scholar] [CrossRef]
  32. Chaturvedi, S.; Singh, S.V.; Dhyani, V.C.; Govindaraju, K.; Vinu, R.; Mandal, S. Characterization, bioenergy value, and thermal stability of biochars derived from diverse agriculture and forestry lignocellulosic wastes. Biomass Convers. Biorefinery 2021. [Google Scholar] [CrossRef]
  33. Chukwuneke, J.L.; Ewulonu, M.C.; Chukwujike, I.C.; Okolie, P.C. Physico-chemical analysis of pyrolyzed bio-oil from swietenia macrophylla (mahogany) wood. Heliyon 2019, 5, e01790. [Google Scholar] [CrossRef] [Green Version]
  34. Singh, S.B.; De, M. Thermally exfoliated graphene oxide for hydrogen storage. Mater. Chem. Phys. 2019, 239, 122102. [Google Scholar] [CrossRef]
  35. Yang, X.; Lyu, H.; Chen, K.; Zhu, X.; Zhang, S.; Chen, J. Selective Extraction of Bio-oil from Hydrothermal Liquefaction of Salix psammophila by Organic Solvents with Different Polarities through Multistep Extraction Separation. BioResources 2014, 9, 5219–5233. [Google Scholar] [CrossRef] [Green Version]
  36. Zhang, C.; Zhang, N.; Xiao, Z.; Li, Z.; Zhang, D. Characterization of biochars derived from different materials and their effects on microbial dechlorination of pentachlorophenol in a consortium. RSC Adv. 2019, 9, 917–923. [Google Scholar] [CrossRef] [PubMed] [Green Version]
  37. Lee, J.; Yang, X.; Song, H.; Ok, Y.S.; Kwon, E.E. Effects of carbon dioxide on pyrolysis of peat. Energy 2017, 120, 929–936. [Google Scholar] [CrossRef]
  38. Lee, Y.; Kim, S.; Kwon, E.E.; Lee, J. Effect of carbon dioxide on thermal treatment of food waste as a sustainable disposal method. J. CO2 Util. 2020, 36, 76–81. [Google Scholar] [CrossRef]
  39. Yang, Z.; Yu, Q.; Guo, Y.; Wu, X.; Wang, H.; Han, J.; Ge, Q.; Zhu, X. Effect of postsynthesis preparation methods on catalytic performance of Ti-Beta zeolite in ketonisation of propionic acid. Microporous Mesoporous Mater. 2021, 330, 111625. [Google Scholar] [CrossRef]
  40. Zheng, M.; Wang, Z.; Li, X.; Qiao, X.; Song, W.; Guo, L. Initial reaction mechanisms of cellulose pyrolysis revealed by ReaxFF molecular dynamics. Fuel 2016, 177, 130–141. [Google Scholar] [CrossRef]
  41. Patwardhan, P.R.; Brown, R.C.; Shanks, B.H. Product Distribution from the Fast Pyrolysis of Hemicellulose. ChemSusChem 2011, 4, 636–643. [Google Scholar] [CrossRef]
  42. Thangalazhy-Gopakumar, S.; Adhikari, S.; Gupta, R.B.; Fernando, S.D. Influence of pyrolysis operating conditions on bio-oil components: A microscale study in a pyroprobe. Energy Fuels 2011, 25, 1191–1199. [Google Scholar] [CrossRef]
Figure 1. A vertical tubular reactor.
Energies 15 08421 g001
Figure 2. The intermediate pyrolysis products yields at 5, 17.5, and 30 mL/min flow rates for different inert gases (N2, CO2, and N2/CO2).
Energies 15 08421 g002
Figure 3. HHV (MJ/kg) and pH of bio-oils produced at 5, 17.5, and 30 mL/min flow rates for different inert gases (N2, CO2, and N2/CO2).
Energies 15 08421 g003
Figure 4. (a) TGA and (b) DTG graphs for biochars produced in presence of N2, CO2, and N2/CO2 inert gases at 17.5 mL/s.
Energies 15 08421 g004
Figure 5. (A) Bio-oil and (B) biochar produced in presence of N2, CO2, and N2/CO2 inert gases at 17.5 mL/s.
Energies 15 08421 g005
Figure 6. SEM images for (a) BGS-G1 (biomass) (b) biochar BGS-N2 (c) biochar BGS-CO2 (d) biochar BGS- N2/CO2.
Energies 15 08421 g006
Table 1. The yield of bio-oil, carbon content and the pH values of pyrolysis of similar or other biomass.
S/NoBiomassYield (wt.%)Carbon ContentpHRef.
1Chouka Kraft Lignin24.4%,64.804.57[8]
2Sigma Kraft Lignin30.2%68.505.33[8]
3Sewage sludge77 (*)458.5[9]
4BGS36.4948.10 ± 0.513.80–4.20[10]
5Rice Husk47.7 ± 2.7-3.05 ± 0.09[11]
6Palm mesocarp fibre and Palm frond48 and 4767.77 and
60.81
3.0[12]
*—dry ash free.
Table 2. The CHNS and EDX analysis of the bio-oil and biochar at the N2, CO2, and N2/CO2 inert gases at 17.5 mL/min.
ComponentsCHNS
#RAW-BGS39.761.20.3
Bio-oil
BGS-N260.493.0352.560.377
BGS-CO253.572.6311.660.257
BGS-N2/CO258.622.7342.510.347
Biochar
BGS-N250.042.6591.90.253
BGS-CO258.132.7181.380.157
BGS-N2/CO255.792.5251.990.264
EDXC KO KK KAl KSi KS KCl KMg KFe KP K
BGS-N268.7 ± 3.022.7 ± 4.610.5 ± 5.91.7 ± 1.62.2 ± 2.20.4 ± 0.10.4 ± 0.10.2 ± 0.00.9 ± 1.1
BGS-CO250.1 ± 5.037.8 ± 3.89.1 ± 5.15.5 ± 3.95.1 ± 3.20.3 ± 0.20.2 ± 0.10.3 ± 0.11.3 ± 1.01.3
BGS-N2/CO257.2 ± 8.627.0 ± 3.79.2 ± 3.72.2 ± 0.82.4 ± 1.00.2 ± 0.10.3 ± 0.00.3 ± 0.20.5 ± 0.21.0 ± 0.4
#: raw biomass as received.
Publisher’s Note: MDPI stays neutral with regard to jurisdictional claims in published maps and institutional affiliations.

