Abstract
Although the energy change field in the centrifugal pump has been investigated under quasi-steady conditions (QSC), equivalent information is not yet known during the rapid starting period (RSP). A centrifugal pump loop system is constructed to investigate the energy change field in the centrifugal pump during RSP. The RSP is selected as a linear rotational speed from 0 rev/min to 2900 rev/min (design rotational speed) and a constant valve opening of 0.569. Results show that the flow rate lags behind the pump head value with the linear increase in rotational speed. The large values of partial derivations of mechanical energy in normal and tangential components are mainly concentrated at the impeller outlet, whose position is insensitive to rotational speed. The region of dominant energy loss is negatively correlated with rotational speed, and an opposite phenomenon is observed in the region of dominant energy increase. With the rotational speed increasing, the mean energy gradient function in the pump impeller and pump volute gradually increases, and the slope of the former is less than that of the latter. After reaching the design rotational speed, the energy change field gradually approaches that under quasi-steady conditions.
1. Introduction
Centrifugal pumps are general machinery with large quantities and wide ranges, and they play a vital role in aerospace, nuclear, petrochemical, biomedical, marine engineering, and other fields. Centrifugal pumps work under quasi-steady conditions (QSC) most of the time, and their flow rates and rotational speeds do not change with time. However, centrifugal pump often operates in transient conditions, including pump starting. A transient condition means that the working parameters change considerably with time, which increases the intricacy of the internal flow, including the energy change field. The energy field distribution is one of the important characteristics of the flow field inside the centrifugal pump [1,2]. During the rapid starting period (RSP) of the centrifugal pump, its working parameters change considerably with time. To investigate the energy change field of the centrifugal pump during RSP, a centrifugal pump loop system was established to construct a numerical simulation of the fast start of the centrifugal pump was conducted. Therefore, studying the energy change field in the centrifugal pumps during a rapid starting period (RSP) is essential.
Researchers have examined the behaviors of the internal flow in the centrifugal pump during the starting period. Sumio [3] investigated the transient characteristics under different conditions of tube length, valve opening, and starting time. Dazin et al. [4,5] studied the strength and duration of starting transient characteristics considering several factors, such as acceleration, rotational speed, flow rate, and pipeline length. Thanapand et al. [6,7] investigated the start-stop process of the centrifugal pumps under different valve openings. Tsukamoto et al. [8] investigated the instant operating behaviors of the rated speed through numerical calculation and experimental measurement. Lefebvre et al. [9] studied the start-stop process under three impeller starting and acceleration schemes through experiments. Chalghoum et al. [10] studied the starting time and impeller geometrical parameters effects. Elaoud et al. [11] studied the flow and pressure changes in upstream and downstream pipelines under four different starting times. Meanwhile, Grover et al. [12] investigated the effects of rotor inertia and in-pipe fluid inertia on the starting process through a torque balance equation. Based on the Tehran reactor pump, the transient behavior has been studied by Farhadi et al. [13]. To achieve the self-coupling simulation of the centrifugal pump, a closed-loop system is established by Zhang et al. [14]. Moreover, considering the pump start and stop period, they investigated the influences of viscosity on the internal flow [15]. Dai et al. [16] proposed three novel transcritical CO2 high-temperature heat pump systems to recover waste heat. Besides, in recent years, research on the starting of a multistage centrifugal pump [17] and a centrifugal pump with assisted valve [18] has also made some progress.
These studies did not conduct their analyses from the perspective of the energy field. Some reports in this field have been based on QSC. Several methods can be adopted to study energy losses [19,20,21,22], and among them, entropy production theory is a crucial method to study fluid machinery [23,24,25]. Dou [26] introduced an energy gradient method to express the ratio between energy increase and energy loss, and it has been utilized in several flows [27,28,29,30,31,32]. Recently, Chen et al. [33] investigated the energy change field in the centrifugal pump impeller and proposed the concepts of dominant energy increase (DEI) and dominant energy loss (DEL), whose phenomenon is obviously different between a quarter and design loads. However, no research on the energy change field in the centrifugal pump during RSP has been reported in the public literature. To reveal this mechanism, the present study takes a centrifugal pump loop system as the research object first. Then, we perform a numerical simulation of the research object to investigate the energy change field, whose rotational speed is a linear function of time and whose valve opening is constant. Six numerical simulations under QSC are also carried out to study the RSP effects.
The paper is structured as follows. The evaluation method of the energy change field is reviewed in Section 2. Details regarding numerical considerations are provided in Section 3. In Section 4, the numerical simulation results are presented and the energy change fields of the centrifugal pump during RSP and under QSC are compared. Finally, we sum up our dissertation concludes in Section 5.
2. Evaluation Method of the Energy Change Field
An energy gradient function, a ratio of energy increase and energy loss, is introduced by Dou [26] to analyze the instability of flow and elucidate the mechanism of shifting laminar and turbulent flow. Recently, Chen et al. [33] proposed to characterize the proportion of energy increase and energy loss based on the energy gradient function. The calculation method is as follows: An energy gradient function, a ratio of energy increase and energy loss, is introduced by Dou [26] to analyze the instability of flow and elucidate the mechanism of shifting laminar and turbulent flow. Recently, Chen et al. [33] proposed to characterize the proportion of energy increase and energy loss based on the energy gradient function. The calculation method is as follows:
where ui is the velocity vector. ∂/∂n and ∂/∂s are partial derivations in the normal and tangential components, respectively. ϕ is the rate of energy dissipation, and E is the total mechanical energy, which can be described as follows:
where μ is the viscosity. ρ is the density. p is the static pressure.
Note that, when its threshold equals 1.0, the energy increase and energy loss are mutually balanced. When the threshold value is greater than 1.0, the energy increase is greater than the energy loss, and when the threshold value is less than 1.0, the energy increase is smaller than the energy loss. Chen et al. [33] proposed to use the logarithm of the energy gradient function (LEGF, ) to represent the energy change results. They also found, () means that when the energy increase is at least twice the energy loss, the local energy increase dominates, namely dominant energy increase (DEI). Similarly, (), indicates that the local energy loss dominates, namely dominant energy loss (DEL).
3. Geometric Model and Numerical Considerations
3.1. Geometric Model and Mesh Generation
Some cylindrical pipes are used to connect the centrifugal pump, valve, and cistern. The diameter of the upstream cylindrical pipes of the centrifugal pump is 0.008 m2. The diameter of the downstream cylindrical pipes of the centrifugal pump is 0.005 m2. The geometric models of whole loop system, valve, and centrifugal pump are shown in Figure 1, and the main parameters of the centrifugal pump are shown in Table 1.

Figure 1.
Geometric models of (a) whole loop system, (b) valve, and (c) centrifugal pump.

Table 1.
Main parameters of the centrifugal pump.
The pump flow rate is the design value when the valve opening is 56.9% under the quasi-steady condition. To isolate the influence of rotational speed, the valve opening is maintained at 56.9%, and the rotational speed is set as a linear function. The relationship between rotational speed and time is shown in Figure 2, and its mathematical expression is as follows.
where t denotes time.
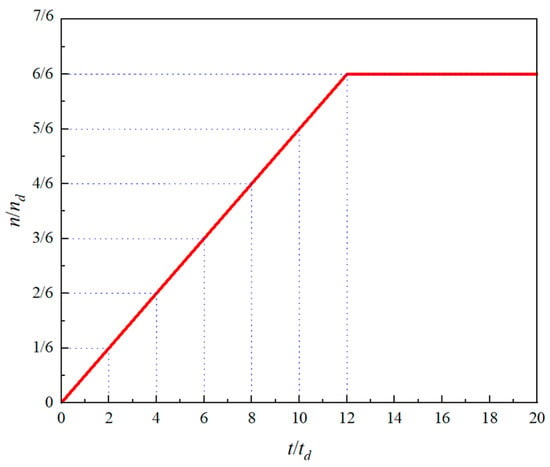
Figure 2.
Relationship between rotational speed and time.
To investigate the RSP effects, six numerical simulations of the centrifugal pump loop system under QSC are also performed. Based on the constant valve opening, the rotational speeds in QSC are also constant, including , , , , , and .
The computational domain of the centrifugal pump loop system is divided by the idea of a regional hexahedron structured mesh used by ANSYS ICEM-CFD 18.0. During the structural mesh generation, the number of interfaces in the computational domain should be reduced, and the number of mesh nodes on both sides of the interface should be consistent or similar. The fluid domain mesh near the wall area should be encrypted to ensure that the accurate flow structure can be captured. Figure 3 shows the meshes of the loop system, including the centrifugal pump, valve, cistern, and cylindrical pipes. The mesh independence of the centrifugal pump has been verified by Zheng et al. [34], and the adopted number is 6.59 million. In addition, the valve has 1.2 million meshes, the cistern has 2.98 million, and the pipeline has 4.35 million. Thus, the loop system has 14.43 million meshes, as presented in Table 2.

Figure 3.
Meshes of the centrifugal pump loop system.

Table 2.
Number of the system meshes.
3.2. Numerical Approach and CFD Validation
ANSYS Fluent 18.0 is used to simulate the flow field in the centrifugal pump loop system. The fluid domain is solved by the finite volume method. The turbulent model is shear stress transport k–ω with a standard wall function. The coupling of velocity and pressure is achieved by the SIMPLE algorithm. The convective term is discretized by a 2nd upwind scheme. The viscous terms are approximated with a 2nd central difference scheme.
The no-slip boundary condition is adopted for the wall, and the pressure condition is adopted for the upper cistern. The wall related to the impeller is the rotating wall, and the others are static walls. The initial field is static fluid. The time step equals the value when the impeller rotates by 1.5° under the design rotational speed, i.e., Δt = 8.62 × 10⁻⁵ s.
Since several numerical simulations and experimental measurements have been studied under QSC, the data validation based on these conditions is used to verify the result reliability. As shown in Figure 4, the numerical results of the performance curve, including pump head and efficiency, show agree well with the experimental data, whose relative errors are less than 5.4% and 2.9% under the design load, respectively. The distribution of pressure shown in Figure 5 also demonstrates the numerical results are also reliable. The pressure coefficient [35] is defined as follows:
where pref is the reference pressure, and u is the circumferential velocity of the impeller.
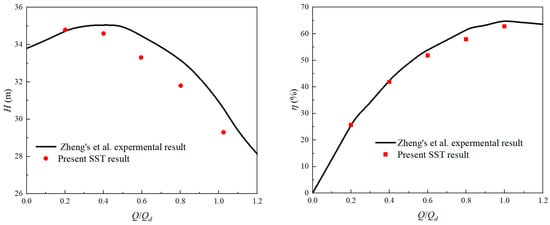
Figure 4.
Pump head (left) and efficiency (right) curves for different flow rates under the QSC [34,35].
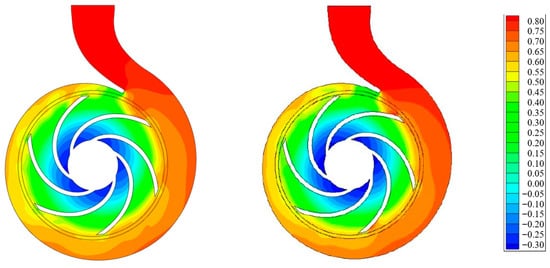
Figure 5.
Pressure on the center plane at design load. (left) Pump loop system and (right) single pump [35].
4. Results and Discussions
4.1. Pressure and Velocity Field
Figure 6 shows the evolution of the flow rate and pump head value. As can be seen on the left of the figure, the evolution of the pump head and flow rate value is nonlinear when the rotational speed linearly increases. The flow rate lags behind the pump head value. After the impeller rotational speed reaches its design value (i.e., instantaneous time equals 12td), the flow rate and pump head value gradually approach 45.4 m3/h (i.e., instantaneous time is approximately equal to 14td) and 29.7 m (i.e., instantaneous time is approximately equal to 20td), respectively, which are approximately equal to the results under QSC, as shown in Figure 6 (right).
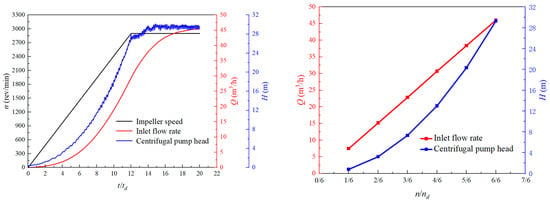
Figure 6.
Evolution of the pump head and flow rate during RSP (left) and under QSC (right).
Figure 7 shows the distributions of static pressure on the center plane of the centrifugal pump during RSP. Static pressure increases as the axial position increases, and the change of static pressure is relatively flat at the instantaneous rotational speed of nd/6. With the rotational speed increasing, the magnitude of static pressure increases dramatically. A similar trend can be observed from the results under QSC shown in Figure 8.
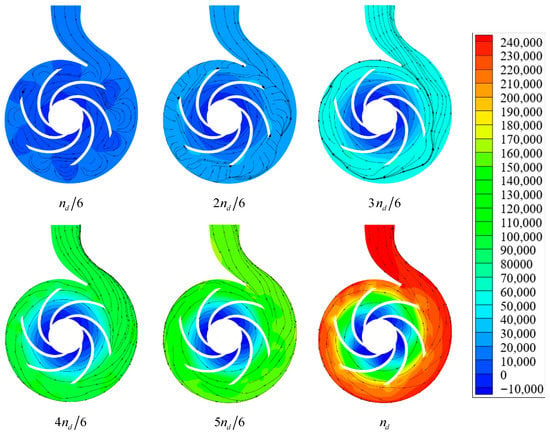
Figure 7.
Distributions of streamlines and static pressure on the center plane during RSP.
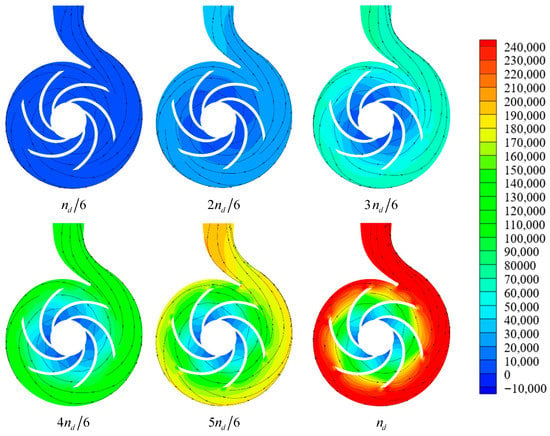
Figure 8.
Distributions of streamline and static pressure on the center plane under QSC.
4.2. Partial Derivation of Mechanical Energy
According to the description in Section 2, the partial derivation of mechanical energy in the normal (∂E/∂n) and tangential (∂E/∂s) components are two important physical quantities to determine the energy change field. This section mainly discusses the evolution characteristics of the two physical quantities during RSP. They are displayed in the logarithmic form to be intuitive and clear.
Figure 9 shows the distributions of log10|∂E/∂n| on the center plane of the centrifugal pump during RSP. The magnitude of log10|∂E/∂n| gradually increases with the rotational speed increasing. The larger value is mainly concentrated near the impeller outlet, whose position is basically independent of rotational speed. At the same time, the value near the pump volute is smaller than that in the impeller passage.

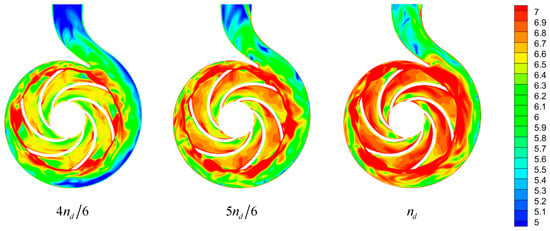
Figure 9.
Distributions of log10|∂E/∂n| on the center plane during RSP.
Although a broadly similar distribution trend can also be observed from log10|∂E/∂n|, some different distributions can still be observed, as shown in Figure 10. For example, compared with the distribution of log10|∂E/∂n|, the distribution of log10|∂E/∂s| is more detailed. The growth rate of log10|∂E/∂s| in the pump impeller is smaller than that of log10|∂E/∂n|, especially at the initial starting stage of nd/6.
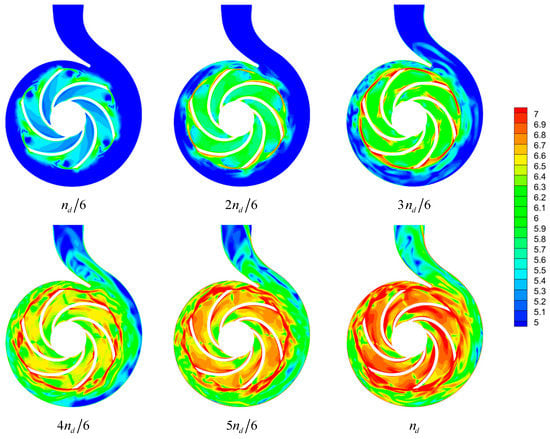
Figure 10.
Distributions of log10|∂E/∂s| on the center plane during RSP.
The evolution characteristics of partial deviations can be further investigated by using the mass-weighted average of partial deviations, which is called mean partial deviations, as shown in Figure 11. Note that, with the increase of the rotational speed, the two mean partial deviations increase, including log10|∂E/∂n| and log10|∂E/∂s|. These magnitudes in the impeller passage are larger than that near the pump volute. The magnitude of the mean log10|∂E/∂n| is larger than that of the mean log10|∂E/∂s| either near the pump volute or in the impeller passage.
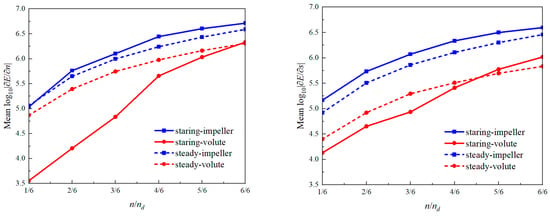
Figure 11.
Mean partial derivation of mechanical energy in the normal component (left) and tangential component (right).
Although a similar trend can be observed in the mean partial derivation during RSP and under QSC, there are still several differences. First, the mean partial derivations for the former are larger than that for the latter in the pump impeller. However, an opposite phenomenon is observed in the region near the pump volute, except when the instantaneous rotational speed is close to its design value. Second, the growth rate during RSP is remarkably larger than that under QSC, except for the mean partial derivations of log10|∂E/∂s| in the pump impeller.
4.3. Energy Change Field
Figure 12 shows the distributions of LEGF on the center plane of the centrifugal pump at different instantaneous rotational speeds during RSP. When the instantaneous rotational speed equals nd/6, the region of log10 K ≥ 0.3 is significantly smaller than that of log10 K ≤ −0.3, especially in the pump outlet pipe and the impeller passage. With the increase of rotational speed, the regions of log10 K ≤ −0.3 and log10 K ≥ 0.3 are decreased and increased, respectively. When the instantaneous rotational speed is larger than 4nd/6, the region of log10 K ≤ −0.3 is smaller than that of log10 K ≥ 0.3. It should be emphasized that the regions of log10 K ≤ −0.3 and log10 K ≥ 0.3 are presented because they can describe the dominant energy loss and dominant energy increase, respectively, as mentioned in Section 2. Therefore, the region of dominant energy loss is remarkably larger than that of dominant energy increase at the instantaneous rotational speed of nd/6, especially in the volute outlet and the impeller passage. With the rotational speed increasing, the decrease and increase trends can be observed in the regions of DEI and DEL, respectively.

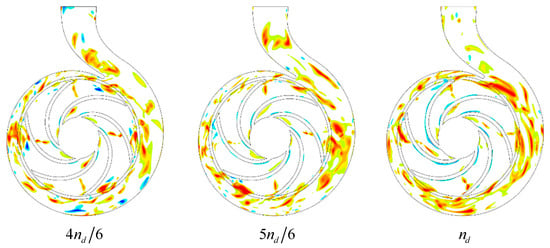
Figure 12.
Distributions of LEGF on the center plane during RSP.
The evolution characteristics of LEGF can be further investigated by the mean LEGF, as shown in Figure 13. Note that the magnitudes of the mean LEGF increases with the increase of the impeller rotational speed, especially when the instantaneous rotational speed is less than 4nd/6. The mean LEGF near the pump volute is less than that in the impeller passage. However, when the impeller speed reaches 4nd/6, the mean LEGF near the pump volute exceeds that in the pump impeller.
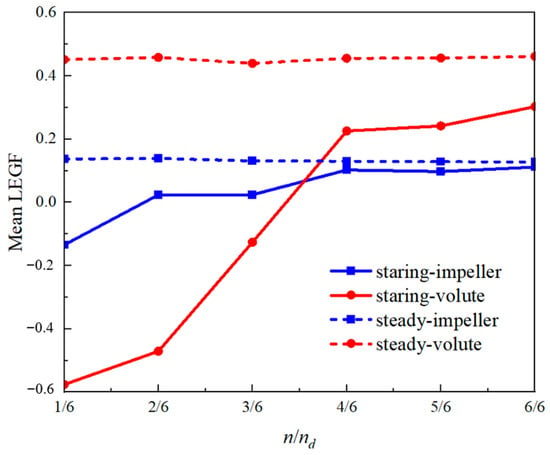
Figure 13.
Mean LEGF at different rotational speeds.
For comparison, the distributions of LEGF and the mean LEGF under QSC are also shown in Figure 13 and Figure 14. Note that their profiles are similar for different rotational speeds. The mean LEGF is insensitive to the rotational speed, which is approximately 0.15 in the pump impeller and 0.45 near the pump volute, respectively. Therefore, these significant differences indicate that RSP has an important effect on the energy change field.
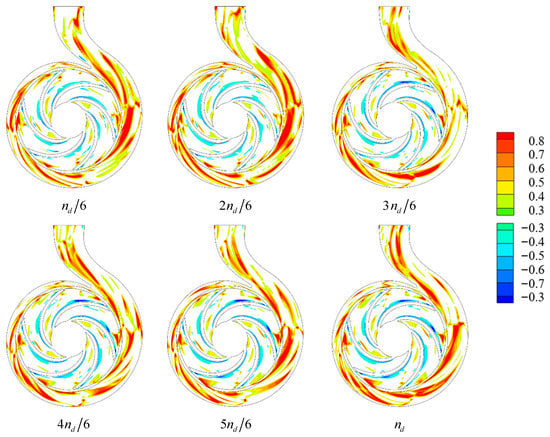
Figure 14.
Distributions of LEGF on the center plane under QSC.
Figure 15 shows the relationship between mean LEGF, and time during RSP after the impeller rotational speed reaches its design value. Note that the LEGF’s fluctuation near the pump volute is larger than that in the pump impeller, whereas they are all relatively insensitive to the time and approaches to the corresponding value under QSC. Meanwhile, an extreme value is observed when the time is at 18td, especially near the pump volute.
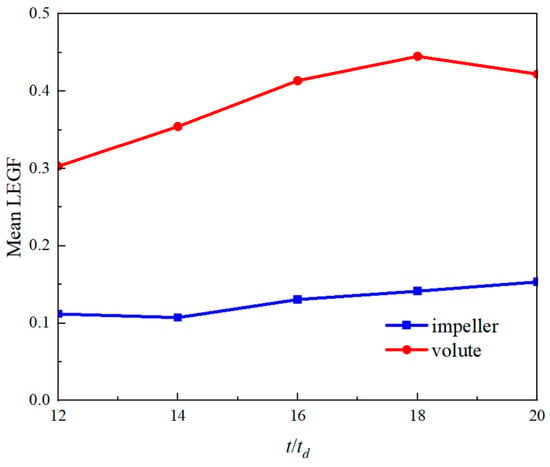
Figure 15.
Relation between mean LEGF and time during the RSP after the rotational speed reaches its design value.
5. Conclusions
We set up a centrifugal pump loop system, that includes a centrifugal pump, a valve, a cistern, and cylindrical pipes. A numerical simulation of the loop system with a constant valve opening of 0.569 and a linear rotational speed (i.e., rapid starting period, RSP) is performed to study the energy change characteristics in the centrifugal pump. The linear rotational speed is described as its increasing from 0 rev/min to 2900 rev/min (design rotational speed) in 0.248 s. The reliability of the numerical results is verified by comparing them with experimental data.
Compared with the results under quasi-steady conditions (QSC), the static pressure is higher and the streamline is more chaotic. With the increase in rotational speed, the flow rate lags behind the pump head.
The larger values of partial derivations of mechanical energy, including its normal component and tangential component, are mainly concentrated at the impeller outlet. The evolution trend of the partial derivations is similar, which are increasing with the rotational speed increased. The mean partial deviations in the pump impeller during RSP are larger than that under QSC. An opposite phenomenon is observed near the pump volute, except when the rotational speed is close to its design value. Moreover, the slope of the mean partial deviation during RSP is larger than that under QSC.
With regard to the energy change field, the region of dominant energy loss (DEL) is remarkably larger than the region of dominant energy increase (DEI) at the instantaneous rotational speed of nd/6, especially in the impeller passage and volute outlet. As the impeller rotational speed increased, the decrease and increase trends can be observed in the regions of DEI and DEL, respectively, leading to a sharp increase in the mean energy gradient function. Meanwhile, although the function both in the pump impeller and pump volute is increased, the slope of the former is less than that of the latter. After reaching the design rotational speed, the mean function gradually approaches the corresponding value under QSC, which is basically maintained at 0.15 in the pump impeller and 0.45 near the pump volute.
Therefore, the evolution characteristics of the energy change field in the centrifugal pump during RSP are significantly different from that under QSC. In the future, we will not only study the valve opening effects on the energy change field, but also investigate the corresponding characteristics during RSP.
Author Contributions
Conceptualization, X.C.; methodology definition, X.C. and X.Z.; software, X.L.; Validation, X.Z.; formal analysis, X.C. and X.Z.; investigation, X.C. and X.Z.; writing—original draft preparation, X.C. and X.Z.; writing—review and editing, X.C., X.Z. and X.L.; supervision, X.C., X.Z. and X.L.; project administration, X.C. and X.L.; funding acquisition, X.C. and X.L. All authors have read and agreed to the published version of the manuscript.
Funding
This work was financially supported by the National Natural Science Foundation of China (Grant No. 51976198), the Key Research and Development Program of Zhejiang Province (Grant No. 2020C01163), and the Fundamental Research Funds of Zhejiang Sci-Tech University (Grant No. 2021Y001).
Acknowledgments
The Authors would like to acknowledge the precious contribution to this work given by Zuchao Zhu from the Zhejiang Sci-Tech University and Lulu Zheng from Henan Institute of Technology for their extensive experimental activity supporting the research of a centrifugal pump during the rapid starting period.
Conflicts of Interest
The authors declare no conflict of interest.
Abbreviations
| RSP | rapid starting period |
| QSC | quasi-steady conditions |
| DEI | dominant energy increase |
| DEL | dominant energy loss |
| LEGF | logarithm of energy gradient function |
| cp | pressure coefficient (-) |
| D | impeller inlet diameter (mm) |
| E | total mechanical energy (Pa) |
| H | head (m) |
| K | energy gradient (-) |
| n | rotational speed (r/min) |
| ns | specific speed (-) |
| p | static pressure (Pa) |
| Q | flow rate (m3/h) |
| t | time (s) |
| u1 | circumferential velocity of the impeller (m/s) |
| Z | number of blades (-) |
| ∂/∂n | partial derivations in the normal components (-) |
| ∂/∂s | partial derivations in the tangential components (-) |
| ϕ | rate of energy dissipation (-) |
| μ | viscosity (Pa·s) |
| ρ | density (kg/m3) |
| η | efficiency (-) |
| d | design |
| ref | reference |
References
- Zhao, X.; Wang, Z.; Xiao, Y.; Luo, Y. Thermodynamic analysis of energy dissipation and unsteady flow characteristic in a centrifugal dredge pump under over-load conditions. Proc. Inst. Mech. Eng. Part C J. Mech. Eng. Sci. 2019, 233, 4742–4753. [Google Scholar] [CrossRef]
- Huang, R.F.; Zhang, Z.; Zhang, W.; Mou, J.G.; Zhou, P.J.; Wang, Y.W. Energy performance prediction of the centrifugal pumps by using a hybrid neural network. Energy 2020, 213, 119005. [Google Scholar] [CrossRef]
- Sumio, S. The transient characteristics of a pump during start up. Bull. Jpn. Soc. Mech. Eng. 1982, 25, 372–379. [Google Scholar]
- Dazin, A.; Caignaert, G.; Dauphin-Tanguy, G. Model based analysis of the time scales associated to pump start-ups. Nucl. Eng. Des. 2015, 293, 218–227. [Google Scholar] [CrossRef]
- Dazin, A.; Caignaert, G.; Dauphin-Tanguy, G. Transient behavior of turbomachineries: Applications to radial flow pump startups. J. Fluids Eng. 2007, 129, 1436–1444. [Google Scholar] [CrossRef]
- Thanapandi, P.; Prasad, R. Centrifugal pump transient characteristics and analysis using the method of characteristics. J. Fluids Eng. 1995, 37, 77–89. [Google Scholar] [CrossRef]
- Thanapandi, P.; Prasad, R. A quasi-Steady performance prediction model for dynamic characteristics of a volute pump. Proc. Inst. Mech. Eng. Part A J. Power Energy 1994, 208, 47–58. [Google Scholar] [CrossRef]
- Tsukamoto, H.; Yoneda, H.; Sagara, K. The response of a centrifugal pump to fluctuating rotational speed. J. Fluids Eng. 1995, 117, 479–484. [Google Scholar] [CrossRef]
- Lefebvre, P.J.; Barker, W.P. Centrifugal pump performance during transient operation. J. Fluids Eng. 1995, 117, 123–128. [Google Scholar] [CrossRef]
- Chalghoum, I.; Elaoud, S.; Akrout, M.; Ezzeddine, H.T. Transient behavior of a centrifugal pump during starting period. Appl. Acoust. 2016, 109, 82–89. [Google Scholar] [CrossRef]
- Elaoud, S.; Hadj-Taïeb, E. Influence of pump starting times on transient flows in pipes. Nucl. Eng. Des. 2011, 241, 3624–3631. [Google Scholar] [CrossRef]
- Grover, R.B.; Koranne, S.M. Analysis of pump start-up transients. Nucl. Eng. Des. 1981, 67, 137–141. [Google Scholar] [CrossRef]
- Farhadi, K.; Bousbia-salah, A.; D’Auria, F. A model for the analysis of pump start-up transients in tehran research reactor. Prog. Nucl. Energy 2007, 49, 499–510. [Google Scholar] [CrossRef]
- Zhang, Y.L.; Zhu, Z.C.; Dou, H.S.; Cui, B.L.; Li, Y.; Zhou, Z.Z. Numerical investigation of transient flow in a prototype centrifugal pump during startup period. Int. J. Turbo Jet-Engines 2017, 34, 167–176. [Google Scholar] [CrossRef]
- Zhang, Y.L.; Zhu, Z.C.; Li, W.G.; Xiao, J.J. Effects of viscosity on transient behavior of a low specific speed centrifugal pump in starting and stopping periods. Int. J. Fluid Mech. Res. 2018, 45, 1–20. [Google Scholar] [CrossRef]
- Dai, B.; Liu, C.; Liu, S.; Wang, D.; Wang, Q.; Zou, T.; Zhou, X. Life cycle techno-enviro-economic assessment of dual-temperature evaporation transcritical CO2 high-temperature heat pump systems for industrial waste heat recovery. Appl. Therm. Eng. 2022, 219, 119570. [Google Scholar] [CrossRef]
- Li, Q.; Ma, X.; Wu, P.; Yang, S.; Huang, B.; Wu, D. Study on the Transient Characteristics of the Centrifugal Pump during the Startup Period with Assisted Valve. Front. Energy Res. 2020, 8, 1241. [Google Scholar] [CrossRef]
- Long, Y.; Lin, B.; Fang, J.; Zhu, R.; Fu, Q. Research on the Transient Hydraulic Characteristics of Multistage Centrifugal Pump during Start-Up Process. Front. Energy Res. 2020, 8, 76. [Google Scholar] [CrossRef]
- Lai, F.; Zhu, X.Y.; Li, G.J. Numerical investigation of energy loss in a centrifugal pump through kinetic energy dissipation theory. Proc. Inst. Mech. Eng. Part C J. Mech. Eng. Sci. 2020, 234, 3745–3761. [Google Scholar] [CrossRef]
- Li, X.J.; Zhu, Z.C.; Li, Y.; Chen, X.P. Experimental and numerical investigations of head-flow curve instability of a single-stage centrifugal pump with volute casing. Proc. Inst. Mech. Eng. Part A J. Power Energy 2016, 230, 633–647. [Google Scholar] [CrossRef]
- Mayeli, P.; Sheard, G.J. An entropy generation analysis of horizontal convection under the centrifugal buoyancy approximation. Int. Commun. Heat Mass Transf. 2022, 133, 105923. [Google Scholar] [CrossRef]
- Kaluri, R.S.; Basak, T. Entropy generation due to natural convection in discretely heated porous square cavities. Energy 2011, 36, 5065–5080. [Google Scholar] [CrossRef]
- Gloss, D.; Herwig, H. Wall roughness effects in laminar flows: An often ignored though significant issue. Exp. Fluids 2010, 49, 461–470. [Google Scholar] [CrossRef]
- Sciacovelli, A.; Verda, V.; Sciubba, E. Entropy generation analysis as a design tool: A review. Renew. Sustain. Energy Rev. 2015, 43, 1167–1181. [Google Scholar] [CrossRef]
- Gong, R.Z.; Wang, H.J.; Chen, L.X.; Li, D.Y.; Zhang, H.C.; Wei, X.Z. Application of entropy production theory to hydro-turbine hydraulic analysis. Sci. China Technol. Sci. 2013, 56, 1636–1643. [Google Scholar] [CrossRef]
- Dou, H.S. Mechanism of flow instability and transition to turbulence. Int. J. Non-Linear Mech. 2006, 41, 512–517. [Google Scholar] [CrossRef]
- Dou, H.S.; Khoo, B.C.; Yeo, K.S. Instability of Taylor-Couette flow between concentric rotating cylinders. Int. J. Therm. Sci. 2008, 47, 1422–1435. [Google Scholar] [CrossRef]
- Dou, H.S.; Khoo, B.C. Criteria of turbulent transition in parallel flows. Mod. Phys. Lett. B 2010, 24, 1437–1440. [Google Scholar] [CrossRef]
- Liu, Y.B.; Tan, L. Tip clearance on pressure fluctuation intensity and vortex characteristic of a mixed flow pump as turbine at pump mode. Renew. Energy 2018, 129, 606–615. [Google Scholar] [CrossRef]
- Yan, B.H. Analysis of laminar to turbulent transition of pulsating flow in ocean environment with energy gradient method. Ann. Nucl. Energy 2011, 38, 2779–2786. [Google Scholar] [CrossRef]
- Xing, D.C.; Yan, C.Q.; Wang, C.; Sun, L. A theoretical analysis about the effect of aspect ratio on single-phase laminar flow in rectangular ducts. Prog. Nucl. Energy 2013, 65, 1–7. [Google Scholar] [CrossRef]
- Wang, C.; Gao, P.Z.; Tan, S.C.; Xu, C. Effect of aspect ratio on the laminar-to-turbulent transition in rectangular channel. Ann. Nucl. Energy 2012, 46, 90–96. [Google Scholar]
- Chen, X.P.; Zhu, Z.C.; Dou, H.S.; Li, Y. Large eddy simulation of energy gradient field in a centrifugal pump impeller. Proc. Inst. Mech. Eng. Part C J. Mech. Eng. Sci. 2019, 233, 4047–4057. [Google Scholar] [CrossRef]
- Zheng, L.L.; Chen, X.P.; Zhang, W.; Zhu, Z.C.; Qu, J.L.; Wang, M.M.; Ma, X.J.; Cheng, X.L. Investigation on characteristics of pressure fluctuation in a centrifugal pump with clearance flow. J. Mech. Sci. Technol. 2020, 34, 3657–3666. [Google Scholar] [CrossRef]
- Zheng, L.L.; Chen, X.P.; Dou, H.S.; Zhang, W.; Zhu, Z.C.; Cheng, X.L. Effects of clearance flow on the characteristics of centrifugal pump under low flow rate. J. Mech. Sci. Technol. 2020, 34, 189–200. [Google Scholar] [CrossRef]
Publisher’s Note: MDPI stays neutral with regard to jurisdictional claims in published maps and institutional affiliations. |
© 2022 by the authors. Licensee MDPI, Basel, Switzerland. This article is an open access article distributed under the terms and conditions of the Creative Commons Attribution (CC BY) license (https://creativecommons.org/licenses/by/4.0/).